Article

Evaluation of 3-Methylbutanoic Acid Methyl Ester as a Factor Influencing Flavor Cleanness in Arabica Specialty Coffee

Suntory Global Innovation Center Limited (Suntory SIC), Research Division, 8-1-1, Seikadai, Seika-cho, Soraku-gun, Kyoto 619-0284, Japan
*
Authors to whom correspondence should be addressed.
Appl. Sci. 2021, 11(12), 5413; https://doi.org/10.3390/app11125413
Submission received: 28 February 2021 / Revised: 1 June 2021 / Accepted: 9 June 2021 / Published: 10 June 2021
(This article belongs to the Special Issue Advances in Food Flavor Analysis)

Abstract

:
This paper reports on the chemical compounds in arabica coffee beans with a high Specialty Coffee Association (SCA) cupping score, especially those in specialty coffee beans. We investigated the relationship between the chemical compounds and cupping scores by considering 16 types of Coffea arabica (arabica coffee) beans from Guatemala (SCA cupping score of 76.5–89.0 points). Non-targeted gas chromatography-mass spectrometry-based chemometric profiling indicated that specialty beans with a high cupping score contained considerable amounts of methyl-esterified compounds (MECs), including 3-methylbutanoic acid methyl ester (3-MBM), and other fatty acid methyl esters. The effect of MECs on flavor quality was verified by spiking the coffee brew with 3-MBM, which was the top-ranked component, as obtained through a regression model associated with cupping scores. Notably, 3-MBM was responsible for the fresh-fruity aroma and cleanness of the coffee brew. Although cleanness is a significant factor for specialty beans, the identification of compounds that contribute to cleanness has not been reported in previous research. The chemometric profiling approach coupled with spiking test validation will improve the identification and characterization of 3-MBM commonly found in arabica specialty beans. Therefore, 3-MBM, either alone or together with MECs, can be used as a marker in coffee production.

1. Introduction

Coffee is a popular beverage consumed globally, yet there are no universal chemical-based standards to assess the coffee flavor and quality, although more than 800 volatile compounds have been identified in coffee beans [1,2]. Using a variety of analytical techniques, including solid-phase microextraction coupled with gas chromatography-mass spectroscopy (GC–MS) and liquid-liquid extraction coupled with GC–MS, the volatile compounds in coffee have been analyzed to characterize the variability among coffee beans [3,4,5,6,7]. Numerous methods, some of which use sensory analysis (e.g., aroma extract dilution analysis, GC–olfactometry, and omission test), have been performed to detect the volatile compounds that contribute to coffee aroma [8,9,10,11,12]. However, studies on the volatile compounds in coffee beans with high Specialty Coffee Association (SCA) cupping scores [13], which are regarded as the global coffee evaluation standard, particularly specialty coffee beans with cup quality defined based on the SCA evaluation criteria, are still limited.
Metabolic profiling has been used in the fields of medicine, agriculture, plant physiology, and microbiology as a comprehensive, non-targeted approach. Metabolic profiling in food science enables us to evaluate the balance of components in samples, determine the differences in samples containing multi-component compounds, and predict the correlations between bioactivity/functional activity and multi-component compounds [14,15,16]. Recently, Fujimura et al. identified multi-component compounds in tea extracts, which were correlated with bioactivity, by employing non-targeted analyses using matrix-assisted laser desorption ionization-mass spectrometry [17]. Among many metabolic profiling analytical techniques, such as nuclear magnetic resonance spectroscopy [18], visible micro-Raman spectroscopy [19], Fourier-transform infrared spectroscopy [20], hyperspectral imaging [21,22], liquid chromatography (LC) [23], and combined platforms [24], MS-based techniques are particularly sensitive and selective [25]. The advantage of non-targeted MS-based metabolic profiling is that it enables the detection and characterization of previously unidentified specific markers.
The constitution of green coffee beans directly affects the final beverage flavors due to the presence of precursors (e.g., sucrose, amino acids, and fatty acids) of key flavor-active compounds that are generated during roasting. In our previous report, we investigated the relationship between SCA cupping scores and compound information using an LC–MS-based metabolic profiling technique. We successfully identified 3-methylbutanoyl glycosides in green beans that were converted to 3-methylbutanic acid during roasting and that contributed to aftertaste [26]. Although several chemometric studies of roasted beans have been reported previously [3,4,27,28,29,30], understanding the chemistry behind sensory perception is still needed [31].
In this study, based on the development of chemometric profiling for sample preparation and non-targeted GC–MS measurement, the specialty arabica roasted beans were assessed. We characterized the chemical compounds that may be utilized for one of the markers.

2. Materials and Methods

2.1. Chemicals

LC-MS-grade methanol was purchased from Wako Pure Chemical Industries (Osaka, Japan). Analytical grade undecane, acetone, n-pentane, diethyl ether, dichloromethane, phenyl isocyanate, and 3-methylbutanoic acid methyl ester were purchased from Nacalai Tesque (Kyoto, Japan). 3-Methylbutanoic acid methyl ester as a food additive, Supelco® 37 component FAME Mix (methylene chloride solution), and C4–C24 even carbon-saturated FAMEs (hexane solution) were purchased from Sigma-Aldrich (St. Louis, MO, USA).

2.2. Green and Roasted Coffee Beans

Sixteen commercial samples of green arabica coffee beans from Guatemala (with different cultivars, geographic altitudes, growing region, and ripeness stages) were obtained in the market (Table S1). Each sample of green coffee beans (100 g) was roasted using a laboratory-scale roaster (Suntory Coffee Roastery Lab, Kanagawa, Japan), as described in our previous report [26]. The roasting degree was adjusted to a luminosity (L) value of 22–23 for all samples.

2.3. Sensorial Evaluation for Chemometric Profiling

Sensory evaluation experiments for chemometric profiling were performed in accordance with the Specialty Coffee Association (SCA) cupping protocol [13] on 16 samples of coffee beans using a method based on our previous report [26]. The experiments were conducted twice in random order, whereby the control sample was assigned 83.0 points (the median value for all samples). All samples were evaluated by an experienced “Licensed Q Grader” certified by the Coffee Quality Institute.

2.4. Preparation of Roasted Bean Extracts and GC–MS Analysis

The roasted beans were ground one to two days after roasting, and 4 g of freshly ground coffee powder was mixed with 10 mL of pentane/diethyl ether (1:2 v/v). Undecane (100 μL of 2 mL/L in acetone) was then added as an internal standard (IS), and the coffee was extracted with shaking (100 rpm) for 16 h at ambient temperature. Extracts were filtered using polyvinylidene fluoride (0.22 μm) ultra-free-MC filters (Millipore, Billerica, MA, USA) before GC–MS analyses. GC–MS measurements were performed using a 7890A GC system coupled to a 5975 inert XL MSD mass spectrometer (Agilent Technologies, Santa Clara, CA, USA), and separation was carried out using a J&W DB-WAXetr fused silica capillary column (60 m × 0.32 mm i.d., df = 0.25 μm, Agilent Technologies). The GC was operated in splitless injection mode (2 μL injection volume), and helium was used as the carrier gas at constant pressure. The GC temperature program was as follows: hold at 40 °C for 2 min, increase to 250 °C at 4 °C/min, and hold at 250 °C for 5 min. MS analysis was conducted at a transfer-line temperature of 250 °C and an ion-source temperature of 230 °C. MS scans were performed over an m/z range of 33–450. Samples were analyzed in triplicate.

2.5. GC–MS Data Processing, Multivariate Statistical Analysis, and Correlation Plots

Peak deconvolution and integration were performed using the Automatic Mass Spectral Deconvolution and Identification System software package [32,33,34]. Mass Profiler Professional software (Agilent Technologies, Santa Clara, CA, USA) was employed for the alignment and identification of the data from the National Institute of Standards and Technology mass spectral database [35]. All peak areas were normalized using those of undecane in each sample, and the obtained data were filtered using a coefficient of variance (CV) < 35%. As a result, 237 valid signals were obtained.
The resultant peaks were subjected to multivariate statistical analysis using the SIMCA-P+ software (version 13.0; Umetrics, Umea, Sweden). An orthogonal projection to latent structure (OPLS) regression model was created to develop a sensory predictive model for the SCA cupping score. Correlation plots between the cupping score and the extracted normalized peak areas of the markers were plotted (Figure S1). The target compounds were identified by comparing their chromatographic retention times and mass spectral data obtained with authentic pure standards that were analyzed under the same conditions.

2.6. Quantitative Analysis of 3-Methylbutanoic Acid Methyl Ester in Coffee Brews by GC–MS

Two samples of green beans from Guatemala were purchased: a good-quality bean (SCA cupping score: 77.0 points) used as the control bean and an excellent quality bean (SCA cupping score: 84.0 points). Both types of beans were roasted with an L-value of 22–23 and ground. The ground powder (10 g) of each roasted bean sample was extracted with 100 mL of hot water (97 °C) for 5 min. Then, the extracts were filtered with paper coffee filters and 20 mL of each filtrate was spiked with 20 μL of phenyl isocyanate (0.5 mL/L in ethanol) as an IS. Further, for the calibration curve, 20 mL of the control filtrate including IS was spiked with 20 μL or 200 μL of 3-MBM (0.05 mL/L in ethanol). The spiked samples were loaded onto 150 mg of PoraPakTM Q (50–80 mesh, GL Science, Tokyo, Japan) in a glass column, and 1 mL of dichloromethane was used to elute the flavor compounds. The eluates were then analyzed by GC–MS using a J&W DB-WAXetr fused silica capillary column (60 m × 0.32 mm i.d., df = 1 μm, Agilent Technologies) for separation because of the retention of 3-MBM on the column.

2.7. Evaluation of the Sensorial Effect of 3-MBM in Coffee Brew

Roasted control beans were ground and the ground powder (30 g) was extracted with 300 mL of hot water (97 °C). The resultant coffee brew (control brew) and coffee brew with 5 or 10 nL/L of 3-MBM additives were evaluated using four trained panelists. The fruity-aroma intensity and cleanness intensity were assigned a value from 1 to 5 in quarter-point increments. The control brew and brew from beans with SCA cupping score of 84.0 points were assigned 3 points and 5 points, respectively.

3. Results and Discussion

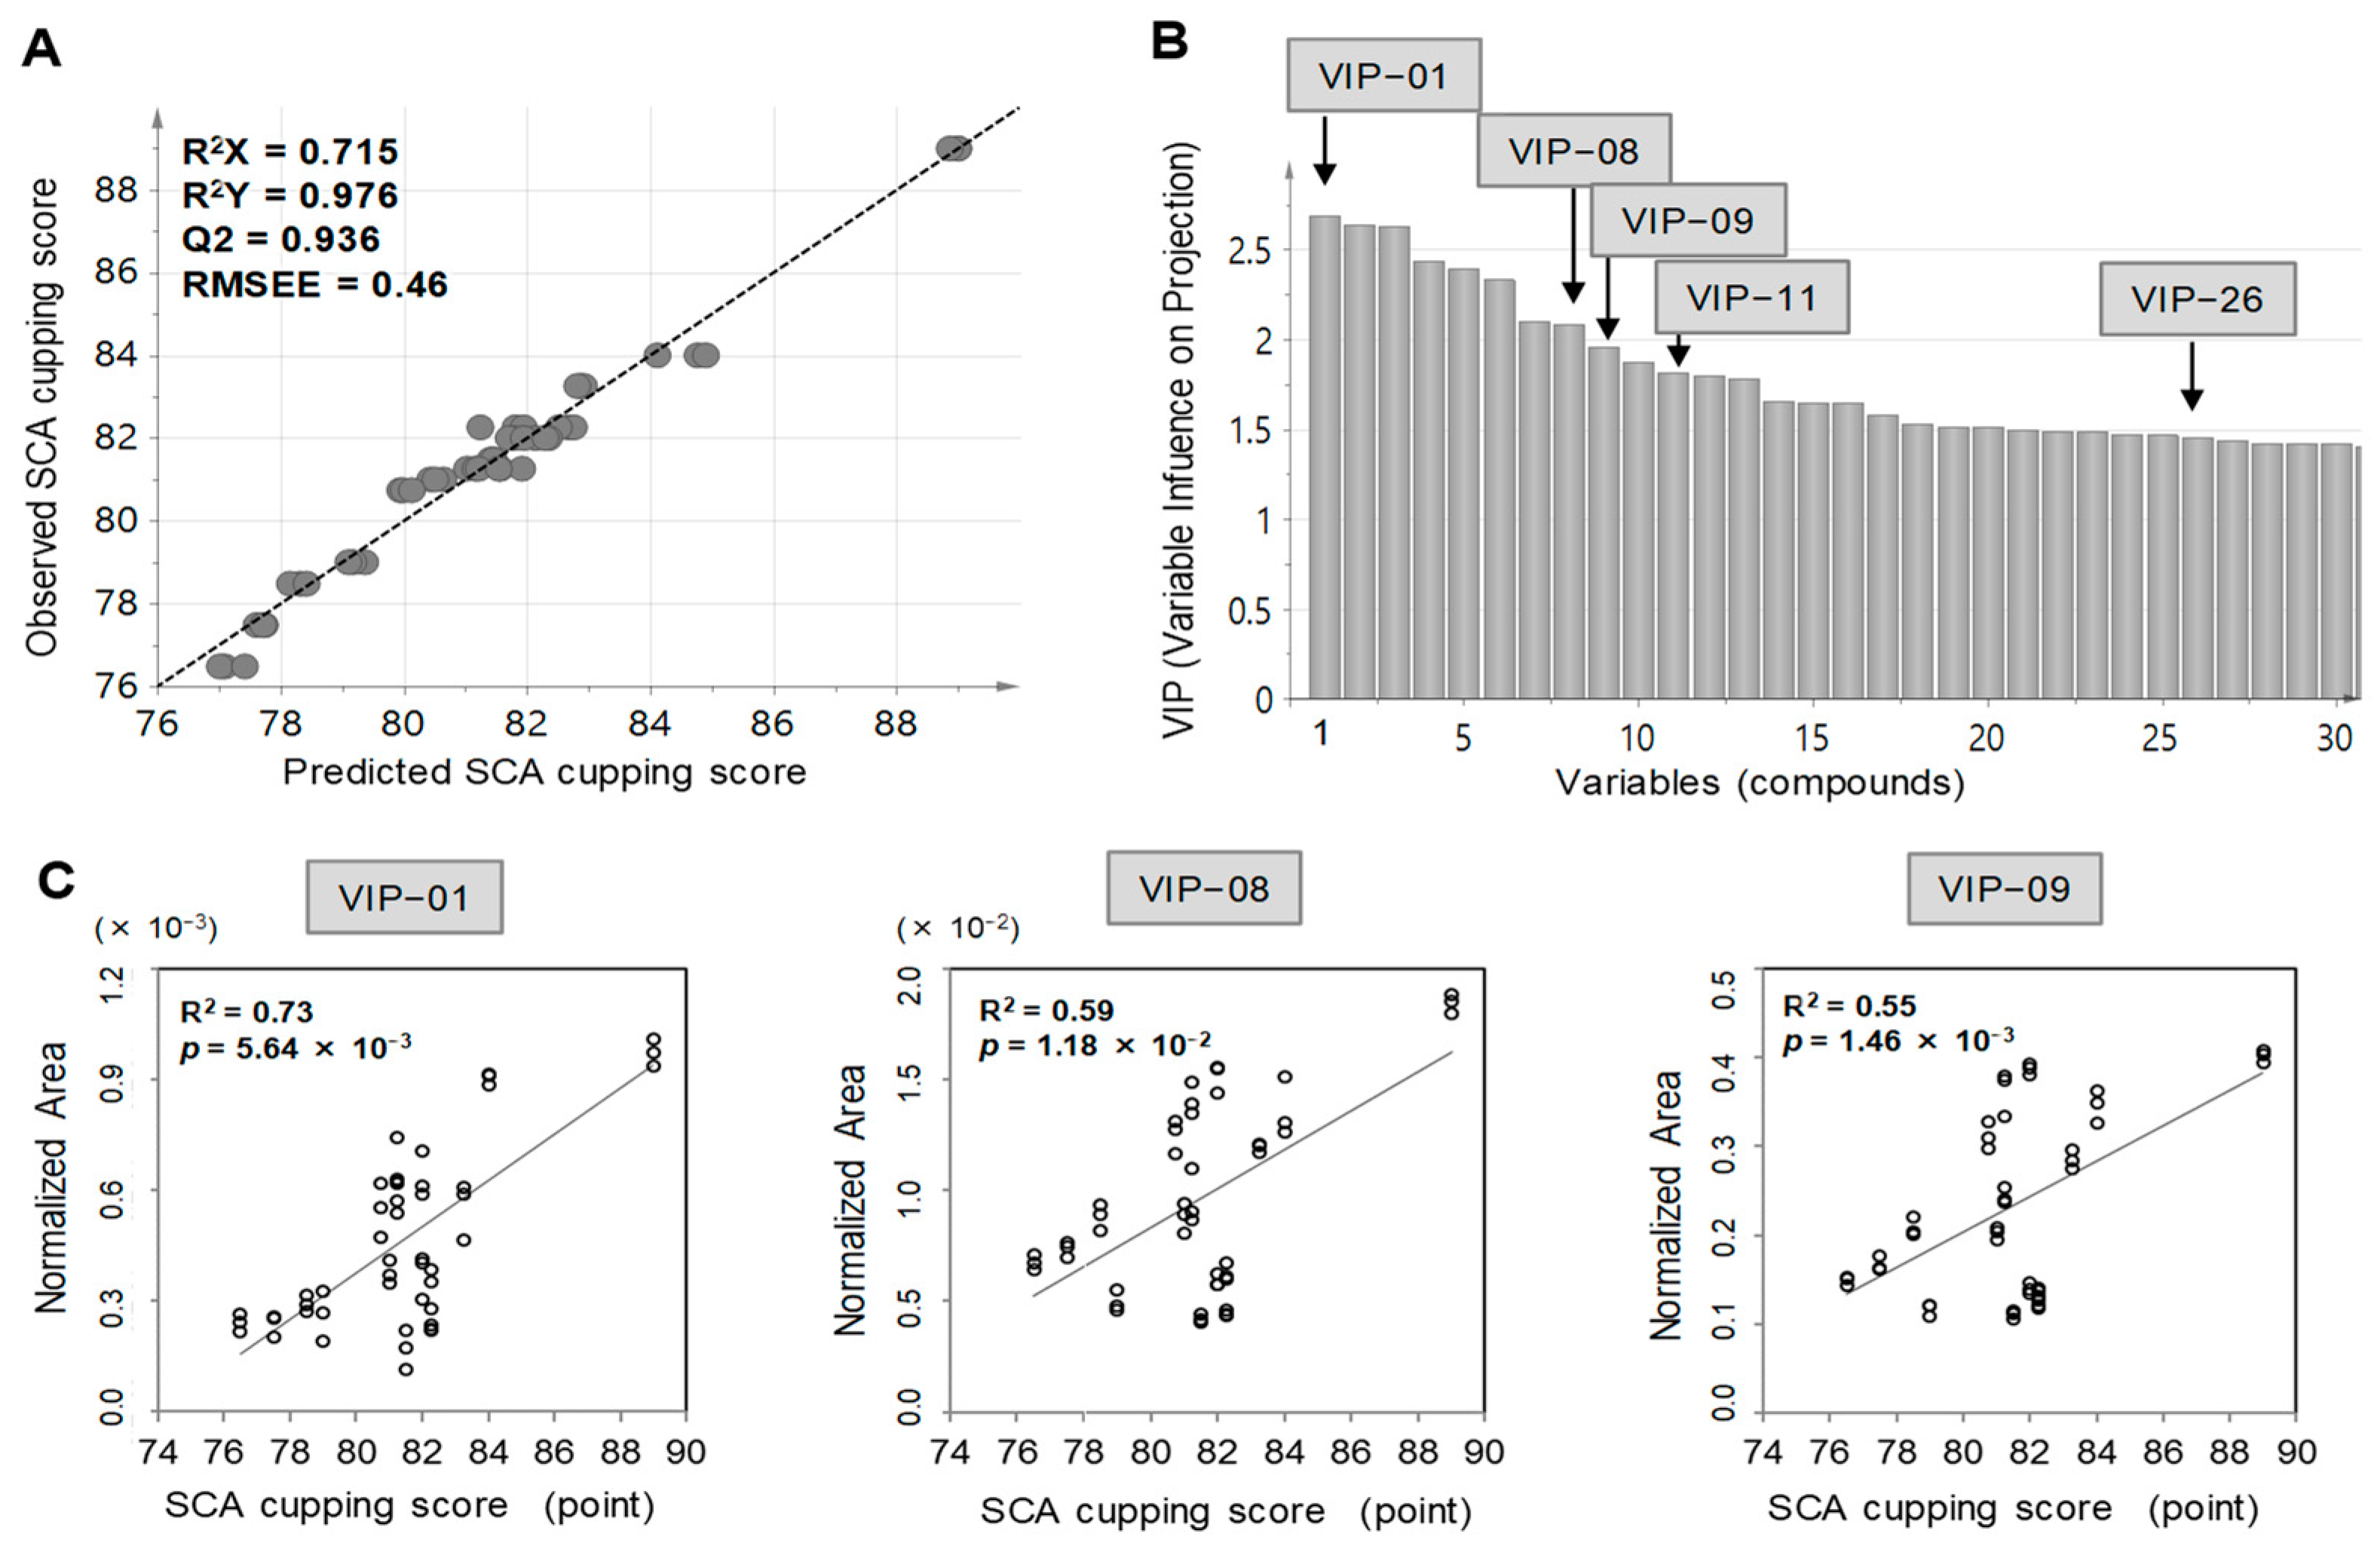
3.1. Identification of the Chemical Compounds Correlated with the SCA Cupping Score Using Chemometric Profiling

The identification of the chemical compounds in specialty beans was investigated in relation to the relationship between the sensorial data (cupping score) and information about the compounds obtained by non-targeted analyses. One of the important aspects of this approach is the quality of beans analyzed. Sixteen diverse samples of green coffee beans from Guatemala with different qualities were prepared and roasted uniformly. The roasted beans were evaluated by an experienced Q grader using the standardized SCA protocol to ensure accurate evaluation. The SCA cupping scores among 16 samples were ranged from 76.5 to 89.0 (Table 1 and Table S1).
The remainder of the roasted beans were extracted with pentane/diethyl ether for comprehensive analysis and then subjected to non-targeted GC–MS measurements. Data processing and filtering of the GC–MS spectra provided 237 valid peaks. To isolate the key compounds and contributing to the SCA cupping scores, a supervised statistical multivariate technique was applied. Using the SIMCA-P+ software, a cupping score prediction model based on OPLS regression analysis was created [36,37]. The cupping score could be predicted with high accuracy using the information provided by GC–MS, as indicated by the value of the correlation coefficient (R2Y = 0.976), the cross-validated correlation coefficient (Q2 = 0.936), and the square error of estimation (RMSEE = 0.46), with statistical significance (Figure 1A) [36]. The cupping score was highly correlated with the compound or multi-component compound information obtained from the beans. Using the results of the OPLS regression model, we determined the quality-related compounds based on the variable influence on the projection (VIP) parameter (Figure 1B). The top-ranked compound, 3-MBM (VIP-01), contributed most to the cupping score. In addition to the Maillard-derived aromatic compounds, which are important to determine the quality of coffee flavor [8,38,39,40], among the top 30 variables, four MECs were listed: VIP-08, linoleic acid methyl ester, VIP-09 palmitic acid methyl ester, VIP-11, stearic acid methyl ester, and VIP-26, oleic acid methyl ester. The SCA scores and the GC–MS normalized areas of these five markers were strongly correlated (VIP-01, VIP-08, VIP-09, VIP-11, and VIP-26, with R2 values of 0.73, 0.59, 0.54, 0.49, and 0.41, respectively (Figure 1C and Figure S1)). Moreover, these correlations were all positive, indicating that high-cupping score coffee beans contain higher amounts of these MECs. Although MECs are known to be present in roasted beans [41], to the best of our knowledge, this is the first study to report that MECs are key compounds that contribute to higher-cupping score coffee flavor in arabica beans.

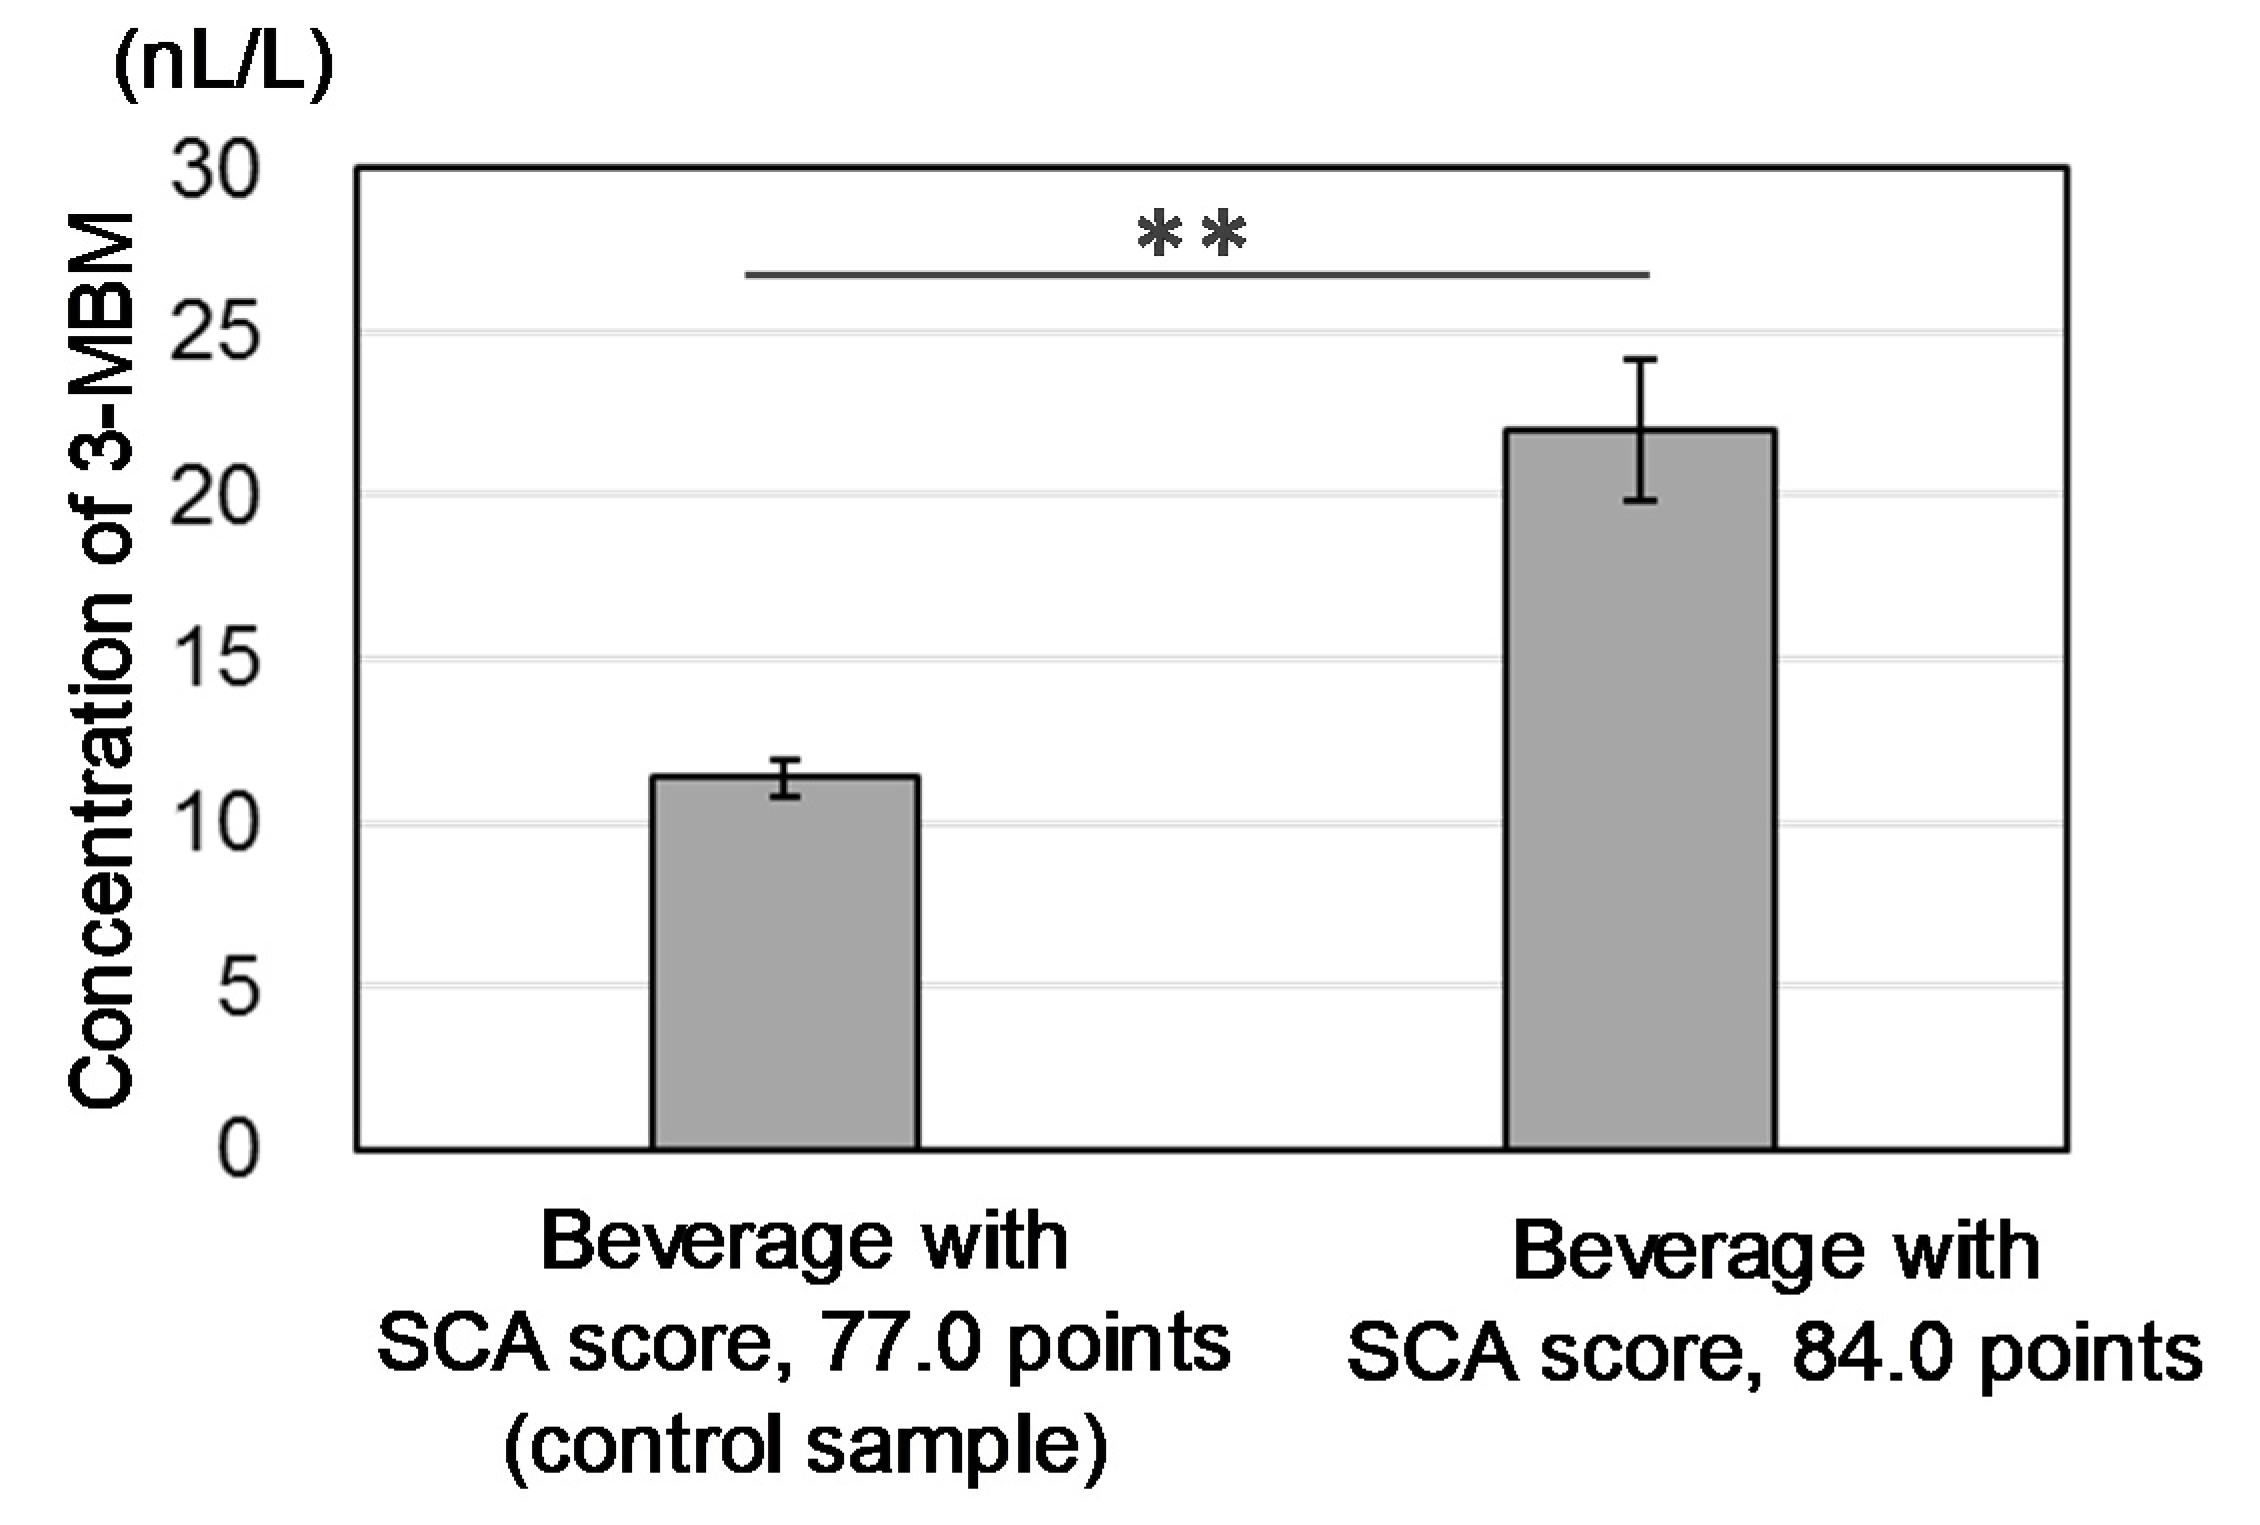
3.2. Validation of the Sensory Effect of MECs in Coffee Brews

To understand the sensory effect of MECs in coffee brews, we studied the amount of 3-MBM that contributed to the top-ranked SCA scores in two coffee brews of different qualities: good quality brews with an SCA score of 77.0 points (control brew) and an excellent quality brew with an SCA score of 84.0 points. Quantitative analyses revealed that the 3-MBM concentrations in good and excellent quality brews were 11.4 and 22.0 nL/L, respectively, confirming that the higher quality brew contained a higher amount of 3-MBM (Figure 2).
Next, sensory evaluation was performed. Although MECs are known to exist in strawberries and fresh strawberry juice and have fruity fragrance [42,43,44], reports on MECs in coffee are limited. The odor threshold value of 3-MBM is 5 nL/L, which is calculated using the published threshold of 4.4 μg/kg [42] and specific gravity of 0.88 g/mL at 25 °C. 3-MBM is considered to be odor-active in coffee brews, although the published threshold value was determined in water and the threshold in coffee can be modified in a specific matrix. Spiking the control brews with 3-MBM (10 nL/L) clearly enhanced the fresh, sweet, and fruity aromas (Figure 3A), which are distinguishable from the fruity odor from fermentation caused by ethyl-esterified compounds [45]. Furthermore, the effect of 3-MBM on cleanness of brews was evaluated, because cleanness is one of the most significant indicators of high-quality coffee and a significant factor affecting coffee flavor and impression. Figure 3B shows that the cleanness intensities increased with the addition of 3-MBM (5 or 10 nL/L). Therefore, 3-MBM not only increased the fresh, fruity aroma but also increased the cleanness of the brews (the reduction of off-flavor).
Recently, Niu et al. reported an enhancing or synergistic effect of perceptual interaction between ethyl-ester aroma compounds in Langjiu [46]. Xiao et al. studied the evaluation of the interaction between esters and sulfur compounds in pineapple, suggesting enhancement, masking, and synergistic effects [47]. Miyazawa reported that specific compounds (carboxylic acids (C1, C2, and C4) under odor threshold values) affect other aroma compounds and increase coffee aroma intensities [48,49,50,51]. However, the reduction of off-flavor in coffee brews has not yet been reported. To the best of our knowledge, this is the first study to report that 3-MBM is a compound contributing to the reduction of off-flavor in coffee brews and influencing flavor impression in arabica specialty coffee.

4. Conclusions

This paper reported the study on the chemical compounds in specialty Arabica coffee beans. The relationship between the chemical compounds and SCA cupping scores by analyzing 16 types of Coffea arabica beans from Guatemala was investigated. Our results indicated that specialty beans with a high cupping score contain considerable amounts of MECs. The effect of MECs on flavor quality was verified by spiking the coffee brews with 3-MBM. 3-MBM was responsible for the fresh-fruity aroma and cleanness of the coffee brews and contributed to the reduction of off-flavor in beverage matrices. To the best of our knowledge, this is the first report on the identification of compounds that influence flavor cleanness in arabica specialty coffee.
Our previous study [26] indicated that 3-methylbutanoyl glycosides in green beans were key precursors of odor-active compounds. Those precursors might convert to 3-methylbutanic acid and 3-MBM during roasting, thereby contributing to coffee flavors. Further studies on the production of 3-MBM are needed.
Our results indicated that 3-MBM is a significant factor in arabica specialty coffee and that 3-MBM, either alone or together with other compounds, can be used as a criterion in designing manufacturing processes. Our findings provide new insights into flavor chemistry.

Supplementary Materials

The following are available online at https://www.mdpi.com/article/10.3390/app11125413/s1, Table S1: Sixteen green coffee beans from Guatemala for chemometric profiling; Figure S1: Correlation plots between the SCA cupping score and the GC–MS normalized area of VIP-11 (left) and VIP-26 (right).

Author Contributions

Conceptualization, K.I. and K.N.; methodology, K.I. and K.N.; validation, K.I. and H.S.; formal analysis, K.I.; investigation, K.I.; data curation, K.I.; writing—original draft preparation, K.I.; writing—review and editing, Y.M. and K.N.; visualization, K.I.; supervision, Y.M. and K.N.; project administration, Y.M. and K.N. All authors have read and agreed to the published version of the manuscript.

Funding

This research received no external funding.

Acknowledgments

We thank Hiroaki Shimidzu (Suntory, Japan) for sensory evaluations of coffee samples. We acknowledge Chifumi Nagai (Hawaii Agriculture Research Center, HI, USA) for useful information and suggestions regarding this work. We thank Suntory Coffee Roastery (Kanagawa, Japan) for roasting the beans and for the sensory evaluation of coffee brews.

Conflicts of Interest

The authors declare no conflict of interest.

References

  1. Flament, I. Chapter 4, A Historical Survey of Coffee Aroma Research; 4.3, Results; Coffee Flavor Chemistry; John Wiley & Sons, Ltd.: London, UK, 2002; pp. 74–77. [Google Scholar]
  2. Nijssen, L.M.; Visscher, C.A.; Maarse, H.; Willemsens, L.C.; Boelens, M.H. Volatile Compounds in Food Qualitative and Quantit ative Data, 7th ed.; TNO Nutrition and Food Research Institute: Zeist, The Netherlands, 1996; pp. 72.1–72.23. [Google Scholar]
  3. Caporaso, N.; Whitworth, M.B.; Cui, C.; Fisk, I.D. Variability of single bean coffee volatile compounds of Arabica and robusta roasted coffees analysed by SPME-GC-MS. Food Res. Int. 2018, 108, 628–640. [Google Scholar] [CrossRef] [PubMed]
  4. Caporaso, N.; Genovese, A.; Canela, M.D.; Civitella, A.; Sacchi, R. Neapolitan coffee brew chemical analysis in comparison to espresso, moka and American brews. Food Res. Int. 2014, 61, 152–160. [Google Scholar] [CrossRef]
  5. Akiyama, M.; Murakami, K.; Ikeda, M.; Iwatsuki, K.; Wada, A.; Tokuno, K.; Onusgu, M.; Iwabuchi, H. Analysis of the headspace volatiles of freshly brewed Arabica coffee using solid-phase microextraction. J. Food Sci. 2007, 72, C388–C396. [Google Scholar] [CrossRef]
  6. Risticevic, S.; Carasek, E.; Pawliszyn, J. Headspace solid-phase microextraction–gas chromatographic–time-of-flight mass spectrometric methodology for geographical origin verification of coffee. Anal. Chim. Acta 2008, 617, 72–84. [Google Scholar] [CrossRef] [PubMed]
  7. Fisk, I.D.; Kettle, A.; Hofmeister, S.; Virdie, A.; Kenny, J.S. Discrimination of roast and ground coffee aroma. Flavour 2012, 1, 14. [Google Scholar] [CrossRef] [Green Version]
  8. Blank, I.; Alina, S.; Grosch, W. Potent odorants of the roasted powder and brew of Arabica coffee. Z. Lebensm. Unters. For. 1992, 195, 239–245. [Google Scholar] [CrossRef]
  9. Czerny, M.; Grosch, W. Potent odorants of raw Arabica coffee. Their changes during roasting. J. Agric. Food Chem. 2000, 48, 868–872. [Google Scholar] [CrossRef]
  10. Semmelroch, P.; Grosch, W. Studies on character impact odorants of coffee brews. J. Agric. Food Chem. 1996, 44, 537–543. [Google Scholar] [CrossRef]
  11. Kumazawa, K.; Masuda, H. Identification of odor-active 3-mercapto-3-methylbutyl acetate in volatile fraction of roasted coffee brew isolated by steam distillation under reduced pressure. J. Agric. Food Chem. 2003, 51, 3079–3082. [Google Scholar] [CrossRef] [PubMed]
  12. Sanz, C.; Czerny, M.; Cid, C.; Schieberle, P. Comparison of potent odorants in a filtered coffee brew and in an instant coffe beverage by aroma extract dilution analysis (AEDA). Eur. Food Res. Technol. 2002, 214, 299–302. [Google Scholar] [CrossRef]
  13. Specialty Coffee Association. Cupping Protocols. Specialty Coffee Association of America, Santa Ana, CA, USA. Available online: https://sca.coffee/research/protocols-best-practices (accessed on 28 February 2020).
  14. Acidri, R.; Sawai, Y.; Sugimoto, Y.; Handa, T.; Sasagawa, D.; Masunaga, T.; Yamamoto, S.; Nishihara, E. Phytochemical Profile and Antioxidant Capacity of Coffee Plant Organs Compared to Green and Roasted Coffee Beans. Antioxidants 2020, 9, 93. [Google Scholar] [CrossRef] [PubMed] [Green Version]
  15. Fujimura, Y.; Kurihara, K.; Ida, M.; Kosaka, R.; Miura, D.; Miura, D.; Wariishi, H.; Maeda-Yamamoto, M.; Nesumi, A.; Saito, T.; et al. Metabolomics-Driven Nutraceutical Evaluation of Diverse Green Tea Cultivars. PLoS ONE 2011, 6, e23426. [Google Scholar] [CrossRef] [PubMed] [Green Version]
  16. Shibutami, E.; Ishii, R.; Harada, S.; Kurihara, A.; Kuwabara, K.; Kato, S.; Iida, M.; Akiyama, M.; Sugiyama, D.; Hirayama, A.; et al. Charged metabolite biomarkers of food intake assessed via plasma metabolomics in a population-based observational study in Japan. PLoS ONE 2021, 16, e0246456. [Google Scholar] [CrossRef]
  17. Fujimura, Y.; Kawano, C.; Maeda-Murayama, A.; Nakamura, A.; Koike-Miki, A.; Yukihira, D.; Hayakawa, E.; Ishii, T.; Tachibana, H.; Wariishi, H.; et al. A Chemometrics-driven strategy for the bioactivity evaluation of complex multicomponent systems and the effective selection of bioactivity-predictive chemical combinations. Sci. Rep. 2017, 7, 2257. [Google Scholar] [CrossRef] [PubMed] [Green Version]
  18. Wei, F.; Furihata, K.; Koda, M.; Hu, F.; Kato, R.; Miyakawa, T.; Tanokura, M. 13C NMR-based metabolomics for the classification of green coffee beans according to variety and origin. J. Agric. Food Chem. 2012, 60, 10118–10125. [Google Scholar] [CrossRef] [PubMed]
  19. El-Abassy, R.M.; Donfack, P.; Materny, A. Discrimination between Arabica and Robusta green coffee using visible micro Raman spectroscopy and chemometric analysis. Food Chem. 2011, 126, 1443–1448. [Google Scholar] [CrossRef]
  20. Santos, J.R.; Sarraguca, M.C.; Rangel, A.O.S.S.; Lopes, J.A. Evaluation of green coffee beans quality using near infrared spectroscopy: A quantitative approach. Food Chem. 2012, 135, 1828–1835. [Google Scholar] [CrossRef]
  21. Caporaso, N.; Whitworth, M.B.; Grebby, S.; Fisk, I.D. Non-destructive analysis of sucrose, caffeine and trigonelline on single green coffee beans by hyperspectral imaging. Food Res. Int. 2018, 106, 192–203. [Google Scholar] [CrossRef] [PubMed]
  22. Caporaso, N.; Whitworth, M.B.; Grebby, S.; Fisk, I.D. Rapid prediction of single green coffee bean moisture and lipid content by hyperspectral imaging. J. Food Eng. 2018, 227, 18–29. [Google Scholar] [CrossRef]
  23. Alonso-Salces, R.M.; Serra, F.; Reniero, F.; Héberger, K. Botanical and geographical characterization of green coffee (Coffea arabica and Coffea canephora): Chemometric evaluation of phenolic and methylxanthine contents. J. Agric. Food Chem. 2009, 57, 4224–4235. [Google Scholar] [CrossRef] [PubMed]
  24. Choi, M.-Y.; Choi, W.; Park, J.H.; Lim, J.; Kwon, S.W. Determination of coffee origins by integrated metabolomics approach of combining multiple analytical data. Food Chem. 2010, 121, 1260–1268. [Google Scholar] [CrossRef]
  25. Dettmer, K.; Aronov, P.A.; Hammock, B.D. Mass spectrometry based metabolomics. Mass Spectrom. Rev. 2007, 26, 51–78. [Google Scholar] [CrossRef] [PubMed]
  26. Iwasa, K.; Setoyama, H.; Seta, H.; Fujimura, Y.; Miura, D.; Wariishi, H.; Nagai, C.; Nakahara, K. Identification of 3-methylbutanoyl glycosides in green Coffea arabica beans as causative determinants for the quality of coffee flavors. J. Agric. Food Chem. 2015, 63, 3741–3751. [Google Scholar] [CrossRef] [PubMed]
  27. Maeztu, L.; Sanz, C.; Andueza, S.; De Peña, M.P.; Bello, J.; Cid, C. Characterization of Espresso Coffee Aroma by Static Headspace GC–MS and Sensory Flavor Profile. J. Agric. Food Chem. 2001, 49, 5437–5444. [Google Scholar] [CrossRef] [PubMed]
  28. Pérez-Martínez, M.; Sopelana, P.; de Peña, M.P.; Cid, C. Application of multivariate analysis to the effects of additives on chemical and sensory quality of stored coffee brew. J. Agric. Food Chem. 2008, 56, 11845–11853. [Google Scholar] [CrossRef]
  29. Sunarharum, W.B.; Williams, D.J.; Smyth, H.E. Complexity of coffee flavor: A compositional and sensory perspective. Food Res. Int. 2014, 62, 315–325. [Google Scholar] [CrossRef]
  30. Rocchetti, G.; Braceschi, G.P.; Odello, L.; Bertuzzi, T.; Trevisan, M.; Lucini, L. Identification of markers of sensory quality in ground coffee: An untargeted metabolomics approach. Metabolomics 2020, 16, 127. [Google Scholar] [CrossRef] [PubMed]
  31. Bressanello, D.; Liberto, E.; Cordero, C.; Rubiolo, P.; Pellegrino, G.; Ruosi, M.R.; Bicchi, C. Coffee aroma: Chemometric comparison of the chemical information provided by three different samplings combined with GC–MS to describe the sensory properties in cup. Food Chem. 2017, 214, 218–226. [Google Scholar] [CrossRef] [PubMed]
  32. Automated Mass Spectral Deconvolution and Identification System (AMDIS). Available online: http://chemdata.nist.gov/mass-spc/amdis (accessed on 28 February 2020).
  33. Davies, T. The new automated mass spectrometry deconvolution and identification system (AMDIS). Spectrosc. Eur. 1998, 10, 24–27. [Google Scholar]
  34. Stein, S.E. An integrated method for spectrum extraction and compound identification from gas chromatography/mass spectrometry data. J. Am. Soc. Mass Spectrom. 1999, 10, 770–781. [Google Scholar] [CrossRef] [Green Version]
  35. NIST 11 Mass Spectral Library. Available online: https://chemdata.nist.gov/ (accessed on 28 February 2020).
  36. Eriksson, L.; Johansson, E.; Kettaneh-Wold, N.; Trygg, J.; Wikstr, C.; Wold, S. Multi- and Megavariate Data Analysis. Part I: Basic Principles and Applications; Umetrics: Umea, Sweden, 2006; p. 425. [Google Scholar]
  37. Wiklund, S.; Johansson, E.; Sjostrom, L.; Mellerowicz, E.; Edlund, U.; Shockcor, J.P.; Gottfries, J.; Moritz, T.; Trygg, J. Visualization of GC/TOF-MS-based metabolomics data for identification of biochemically interesting compounds using OPLS class models. Anal. Chem. 2008, 80, 115–122. [Google Scholar] [CrossRef]
  38. Grosch, W. Flavour of coffee. A review. Nahrung Food 1998, 42, 344–350. [Google Scholar] [CrossRef]
  39. Grosch, W. Chemistry III: Volatile compounds. In Coffee—Recent Developments; Clarke, R.J., Vitzthum, O.G., Eds.; Blackwell Science Ltd.: London, UK, 2001; pp. 67–89. [Google Scholar]
  40. Kerler, J.; Poisson, L. Understanding coffee aroma for product development. New Food Mag. 2011, 14, 39–43. [Google Scholar]
  41. Flament, I. Chapter 5, The Individual Constituents: Structure, Nomenclature, Origin, Chemical and Organoleptic Properties; 5.6, Esters; Coffee Flavor Chemistry; John Wiley & Sons, Ltd.: London, UK, 2002; pp. 169–181. [Google Scholar]
  42. Du, X.; Plotto, A.; Baldwin, E.; Rouseff, R. Evaluation of volatiles from two subtropical strawberry Cultivars using GC–Olfactometry, GC–MS odor activity values, and sensory analysis. J. Agric. Food Chem. 2011, 59, 12569–12577. [Google Scholar] [CrossRef] [PubMed]
  43. Ueda, Y.; Tsuda, A.; Bai, J.; Fujishita, N.; Chachin, N. Characteristic pattern of aroma ester formation from banana, melon, and strawberry with reference to the substrate specificity of ester synthetase and alcohol contents in pulp. Nippon Shokuhin Kogyo Gakkaishi 1992, 39, 183–187. [Google Scholar] [CrossRef] [Green Version]
  44. Schieberle, H.; Hofmann, T. Evaluation of the character impact odorants in fresh strawberry juice by quantitative measurements and sensory studies on model mixtures. J. Agric. Food Chem. 1997, 45, 227–232. [Google Scholar] [CrossRef]
  45. Lindinger, C.; Pollien, P.; de Vos, R.C.; Tikunov, Y.; Hageman, J.A.; Lambot, C.; Fumeaux, R.; Voiro-Baliguet, E.; Blank, I. Identification of ethyl formate as a quality marker of the fermented off-note in coffee by a nontargeted chemometric approach. J. Agric. Food Chem. 2009, 57, 9972–9978. [Google Scholar] [CrossRef] [PubMed]
  46. Niu, Y.; Liu, Y.; Xiao, Z. Evaluation of perceptual interaction between ester aroma components in Langjiu by GC–MS, GC–O, sensory analysis, and vector model. Foods 2020, 9, 183. [Google Scholar] [CrossRef] [PubMed] [Green Version]
  47. Xiao, A.; Chen, L.; Niu, Y.; Zue, J.; Zhang, J.; Deng, J. Evalutation of the interaction between esters and sulfur compounds in pineapple using Feller’s additive model, OAV, and odor activity coefficient. Food Anal. Methods 2021. [Google Scholar] [CrossRef]
  48. Miyazawa, T.; Gallagher, M.; Preti, G.; Wise, P.M. Synergistic Mixture Interactions in Detection of Perithreshold Odors by Humans. Chem. Sens. 2008, 33, 363–369. [Google Scholar] [CrossRef]
  49. Miyazawa, T.; Gallagher, M.; Preti, G.; Wise, P.M. The Impact of Sub-threshold Carboxylic Acids on the Odor Intesity of Supra- threshold Flavor Compounds. Chem. Percept. 2008, 1, 163–167. [Google Scholar] [CrossRef]
  50. Miyazawa, T.; Gallagher, M.; Preti, G.; Wise, P.M. Odor detection of mixtures of homologous carboxylic acids and coffee aroma compounds by humans. J. Agric. Food Chem. 2009, 57, 9895–9901. [Google Scholar] [CrossRef]
  51. Miyazawa, T.; Gallagher, M.; Preti, G.; Wise, P.M. Psychometric functions for ternary odor mixtures and their unmixed components. Chem. Sens. 2009, 34, 753–761. [Google Scholar] [CrossRef] [Green Version]
Figure 1. MECs strongly correlated with the SCA cupping score studied by non-targeted analysis. (A) OPLS model. The SCA cupping score was predicted by chemical information. (B) VIP plots. The top 30 variables (compounds) are shown. Arrow heads indicate MECs. (C) Correlation plots between the SCA cupping score and the GC–MS normalized area of VIP-01 (left), VIP-08 (center), and VIP-09 (right).
Applsci 11 05413 g001
Figure 2. Quantitative analysis of 3-MBM in coffee brews from two different quality coffee beans. Statistical significance is indicated by the Student t test (** p < 0.01).
Applsci 11 05413 g002
Figure 3. Sensory evaluation of coffee brews without and with added 3-MBM (5 nL/L or 10 nL/L). (A) Fresh-fruity aroma and (B) cleanness were evaluated by four trained panelists. Statistical significance is indicated by the Student t test (** p < 0.01).
Applsci 11 05413 g003
Table 1. Sixteen green coffee beans from Guatemala were evaluated using the SCA cupping score.
SCA Cupping Score (Point)
8989.0
88
87
86
85
8484.0
8383.25
8282.0, 82.0, 82.25, 82.5
8181.0, 81.25, 81.25, 81.5
8080.75
7979.0
7878.5
7777.5
7676.5
Publisher’s Note: MDPI stays neutral with regard to jurisdictional claims in published maps and institutional affiliations.

