
Application of Genetic Algorithms for the Selection of Neural Network Architecture in the Monitoring System for Patients with Parkinson’s Disease

 ,
,
Abstract
1. Introduction
- Impossibility of daily observation by a doctor in outpatient practice;
- inability to analyze the patient’s diaries by the doctor more than a few days prior to the date of the patient’s visit;
- impossibility of a comprehensive analysis of all pages of the diaries for the entire observation period of the patient;
- inaccuracy in filling out the patient diary for various reasons, including:
- ○
- biased perception by patients of their condition;
- ○
- untimely filling of the diary;
- ○
- difficulty of filling out diaries;
- ○
- loss of diary, and so on.
2. Related Work
- Applications that are designed for physical training; for example, in [5], the created mobile application was used for cognitive stimulation in the elderly. The application offers a number of games for training various cognitive functions (memory, concentration, and so on);
- applications that provide the ability to obtain information about the PD, as a whole, to the user and the ability to obtain information directly from those who have already had experience in solving such problems. Today, there are many websites and online reference books and, therefore, there is no need to download a separate application for a smartphone; and
3. Formulation of the Problem
- The development of an application that allows one to collect a training sample for a neural network using mobile devices;
- The preparation and processing of data for the future neural network model;
- The analysis of the possibility of using neural networks, in order to classify the condition of patients with PD;
- The selection and testing of various options for neural network architectures on the obtained sample;
- The testing of the neural network on patients with PD;
- The evaluation of the results of the neural network.
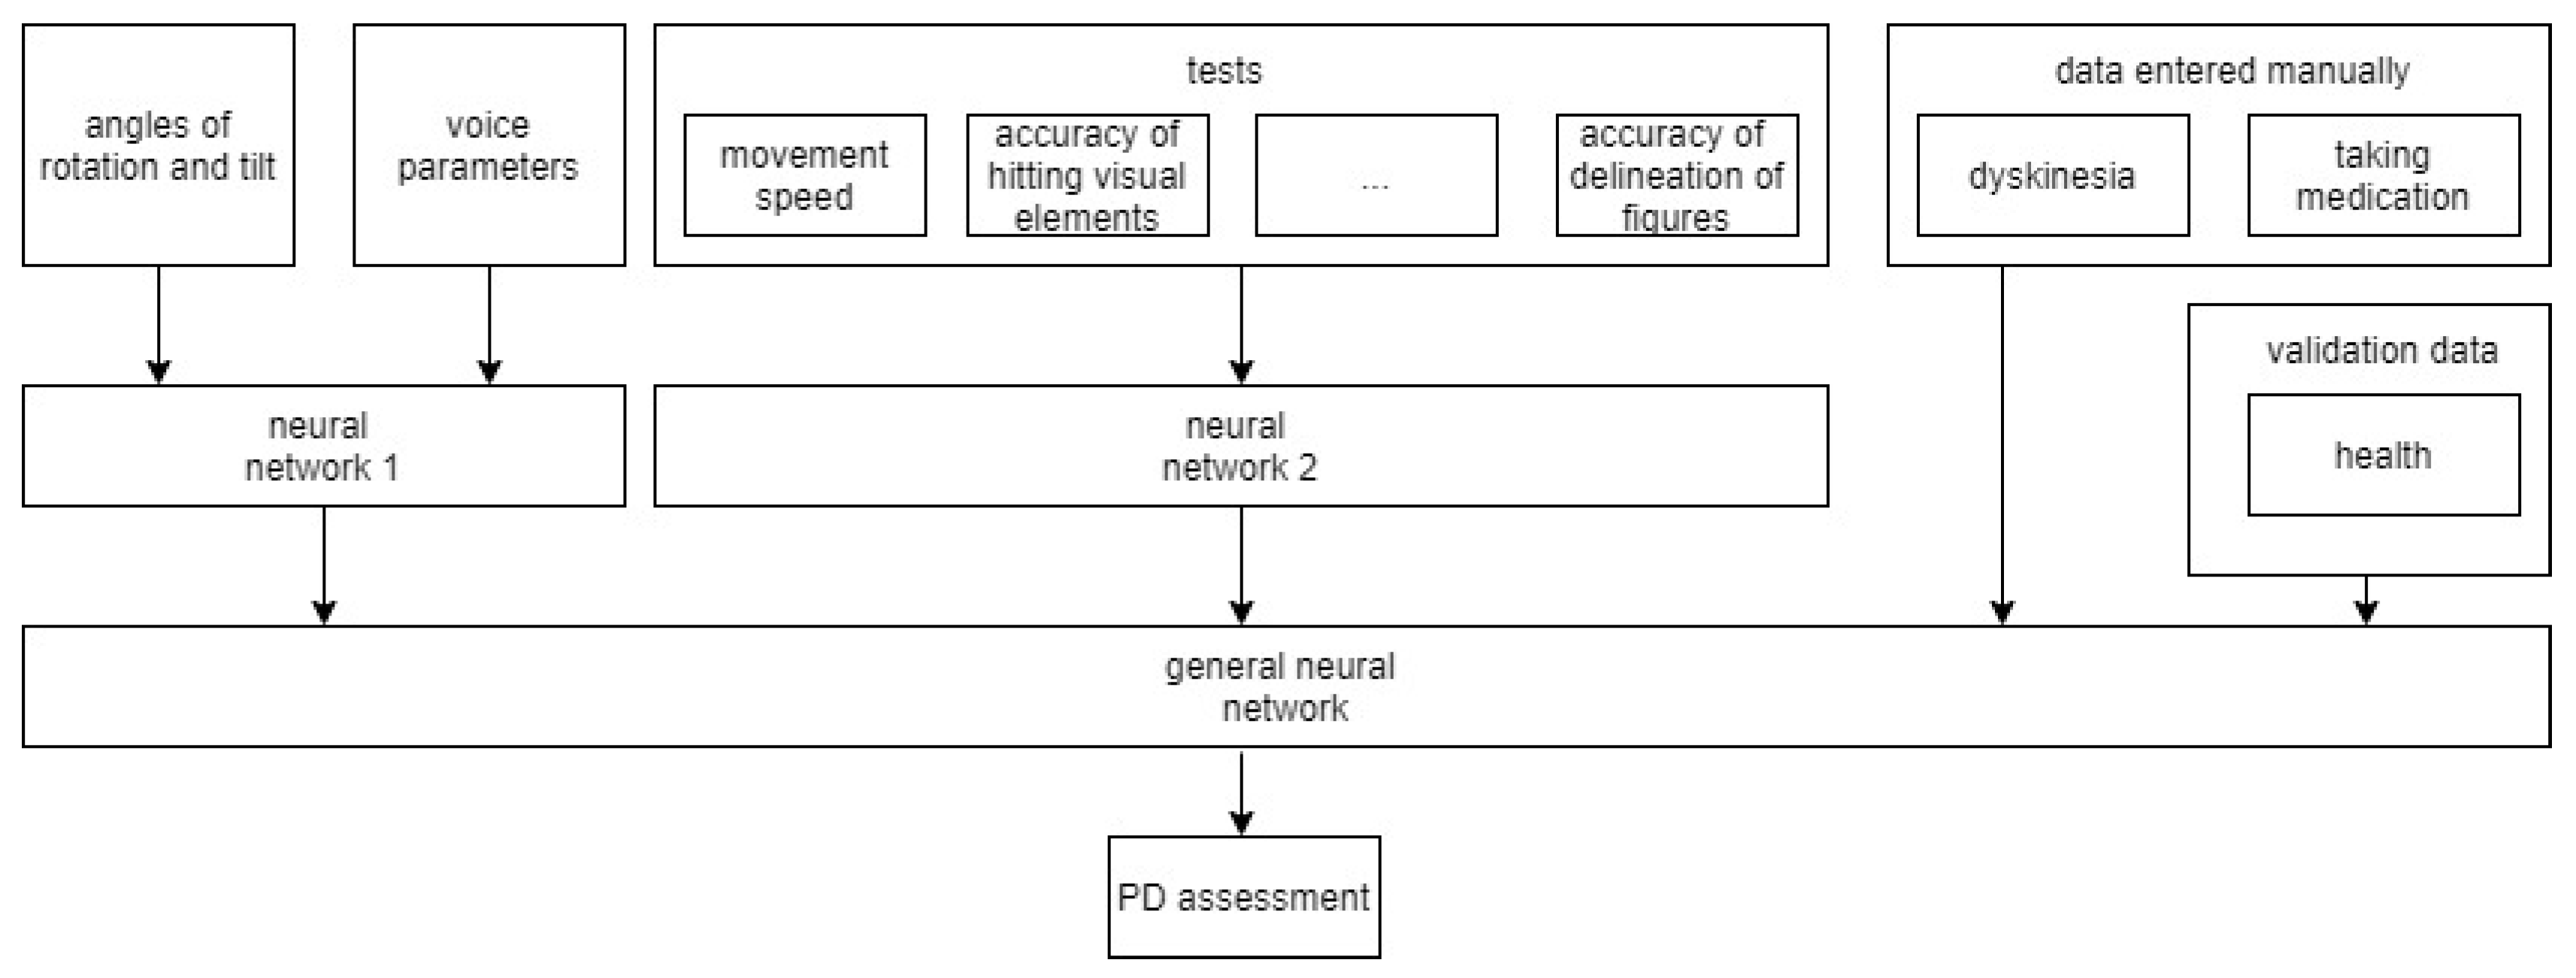
4. Data Collection System
- Data from the sensors of devices that are responsible for the movement of the phone (e.g., changing the coordinates along three axes, the angle of inclination, activity). These data allow for the tracking of the patient’s activity, tremor, and dyskinesia.
- Data collected from sensors responsible for controlling the telephone (e.g., pressing buttons, keys, and moving fingers on the screen). These data allow for the assessment of the general condition of patients.
- On the server, the main components are a data pre-processing module and a module for applying data mining algorithms to obtain knowledge about a patient. This knowledge is necessary to understand the characteristic signs of phone use in patients with Parkinson’s disease, and whether the patient is holding the phone in their hands or if another person is doing it.
5. Application of a Genetic Algorithm to Build a Neural Network
- Initialization of N random networks to create a population.
- Evaluation of each network. This step takes a long time, as it is necessary to train each neural network, then determine how well it performs when classifying the test set.
- Sorting of all networks in the population, according to the prediction accuracy of the test sample. A certain percentage of the best networks are retained to be part of the next generation and to create descendants. There will also be several networks with a low level of accuracy, potentially helping to find combinations between the worst and best neural networks.
- The next stage is “reproduction”: the algorithm selects two different members of the population and creates one or more descendants, where each descendant is a combination of a random set of parameters of its parents; for example, one descendant may have the same number of layers as one of its parents, and the rest of the parameters from its other parent.
- After it has been decided which networks should be stored, some parameters in a given set of networks are randomly changed.
- layers_count—an array of valid values for determining the number of layers in the neural network;
- neurons_count—a set of valid values for choosing the number of neurons in a layer;
- activation—a set of names of activation functions; and
- optimizer—a set of names for optimization functions.
6. Description of Test Data
- Values of voice loudness, measured in decibels (dB)—average, maximum, minimum values of voice loudness; average, maximum, minimum values of differences in voice loudness; and the number of differences in voice loudness. The loudness value is measured according to the following formulas:dbfsCoef = 20/ln(10.0),db = lg(amplitude) * dbfsCoef.Each frame contains information about the amplitude at a specific point in time. To calculate the loudness value over the entire file, it is necessary to process the amplitude array. At the point where the amplitude value is 0, the loudness value is taken as 0, as log tends to infinity at this point. When calculating the number of differences in loudness values, only those values for which the difference in magnitude of the loudness value from the following value exceeds the number 10 are involved.
- Pause values—average, maximum pause time, number of pauses. A pause, in this work, is considered when there is a sound volume value less than a certain specified value.A segment in which all amplitude values are below the third part of the average amplitude value of the entire file are considered “silence”. The minimum value of the pause length is taken as 0.1 s. The pause time is determined by the following formula: pause time = (frame length)/(sample rate),where length is the difference between the end and beginning of the current pause.
- Clarity of speech. For speech recognition, we used the library «CMUSphinx», which accepts an audio file as input [30]. The result of processing the file is a list of words. The recognition process is long and not always successful, as different people have different recording quality access and degrees of vocal intelligibility. To assess the intelligibility of speech, the developed test “Read the text” was used.As a result of passing the test, after the user read the specified text on the phone screen, the text that was pronounced by the phone user was recorded and recognized. The text was selected by doctors and psychologists. Each text was selected at random from a data set of 20 texts. The percentage of similarity between these texts was used as the measure of intelligibility. The original and recognized texts were compared using the Shingle algorithm, which includes:
- The canonization of the text (i.e., removing all prepositions and symbols from the text);
- Splitting the text into shingles (i.e., parts of the text selected for comparison), with a certain number of words in its sequence to check for uniqueness. The shingle size was taken as equal to two;
- The calculation of shingle hashes using 84 static functions.
- Speech rate. To determine the value of the rate of speech, it is necessary to divide the number of all spoken words by the duration of the entire audio file. The total number of words is known from the text obtained as a result of recognition. The duration of the entire audio file is defined as duration (in seconds) = (frame length)/(sample rate).
- List of repeated words and their number of times in the text. Another characteristic feature of speech is the repetition of words or the pronunciation of words of filler words; for example, “e” and “em,” among others. Therefore, it is necessary to highlight these words and the number of repetitions of each of them.
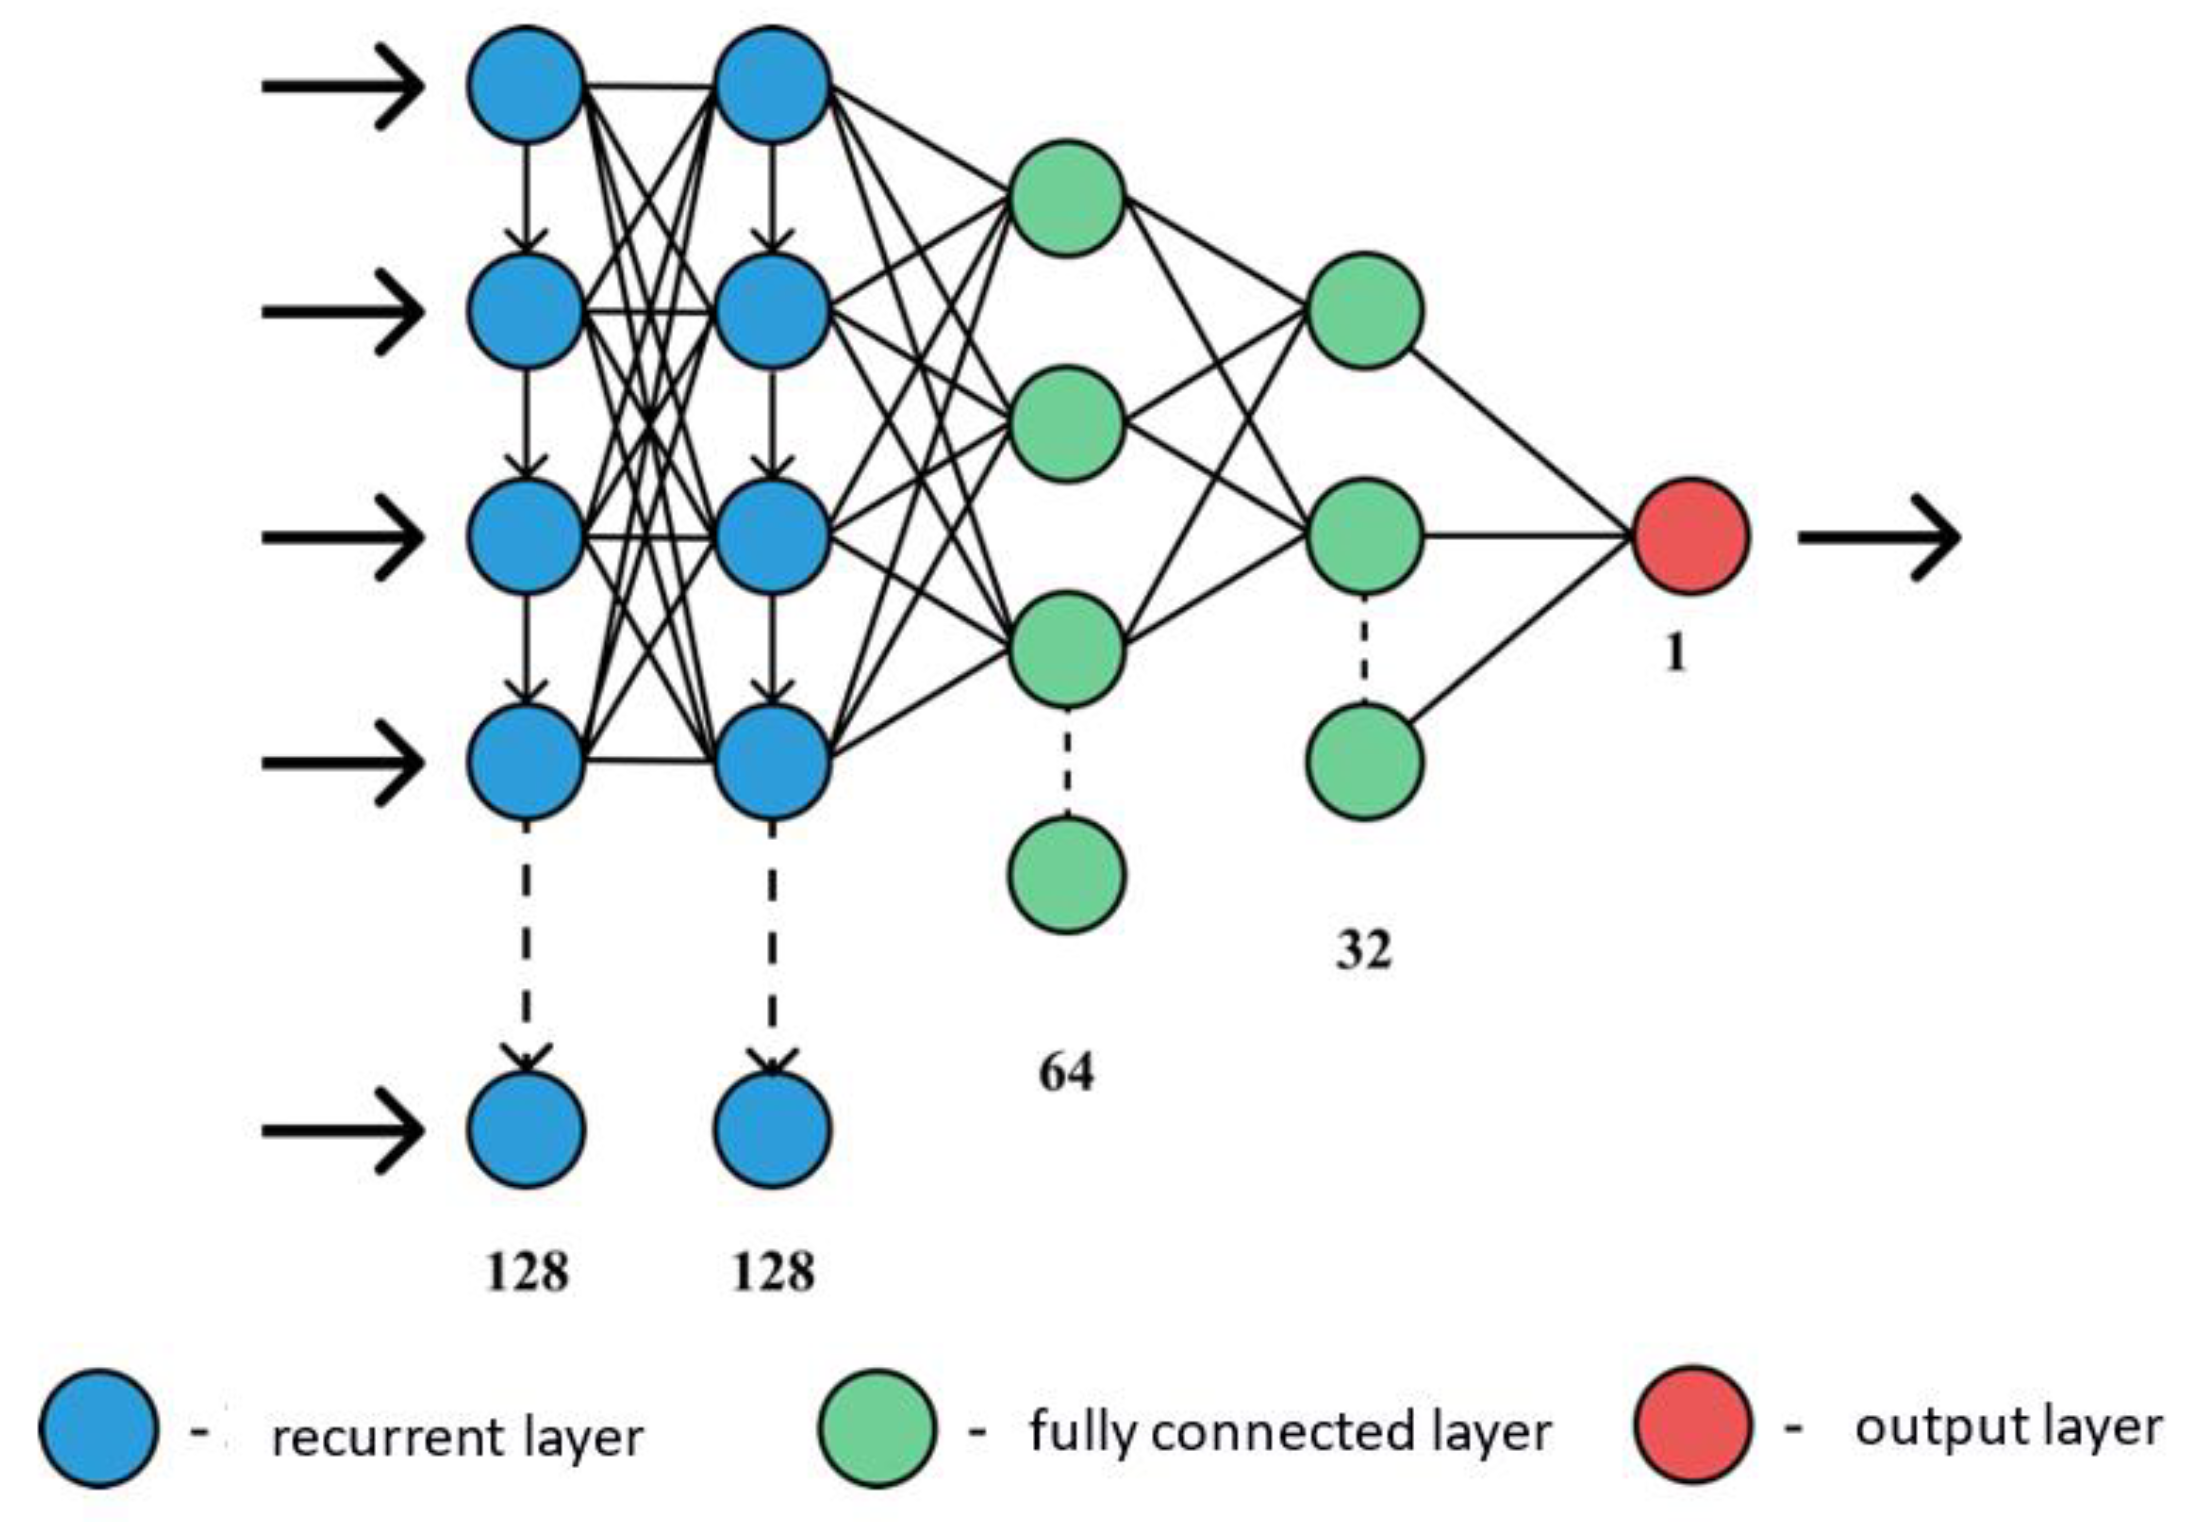
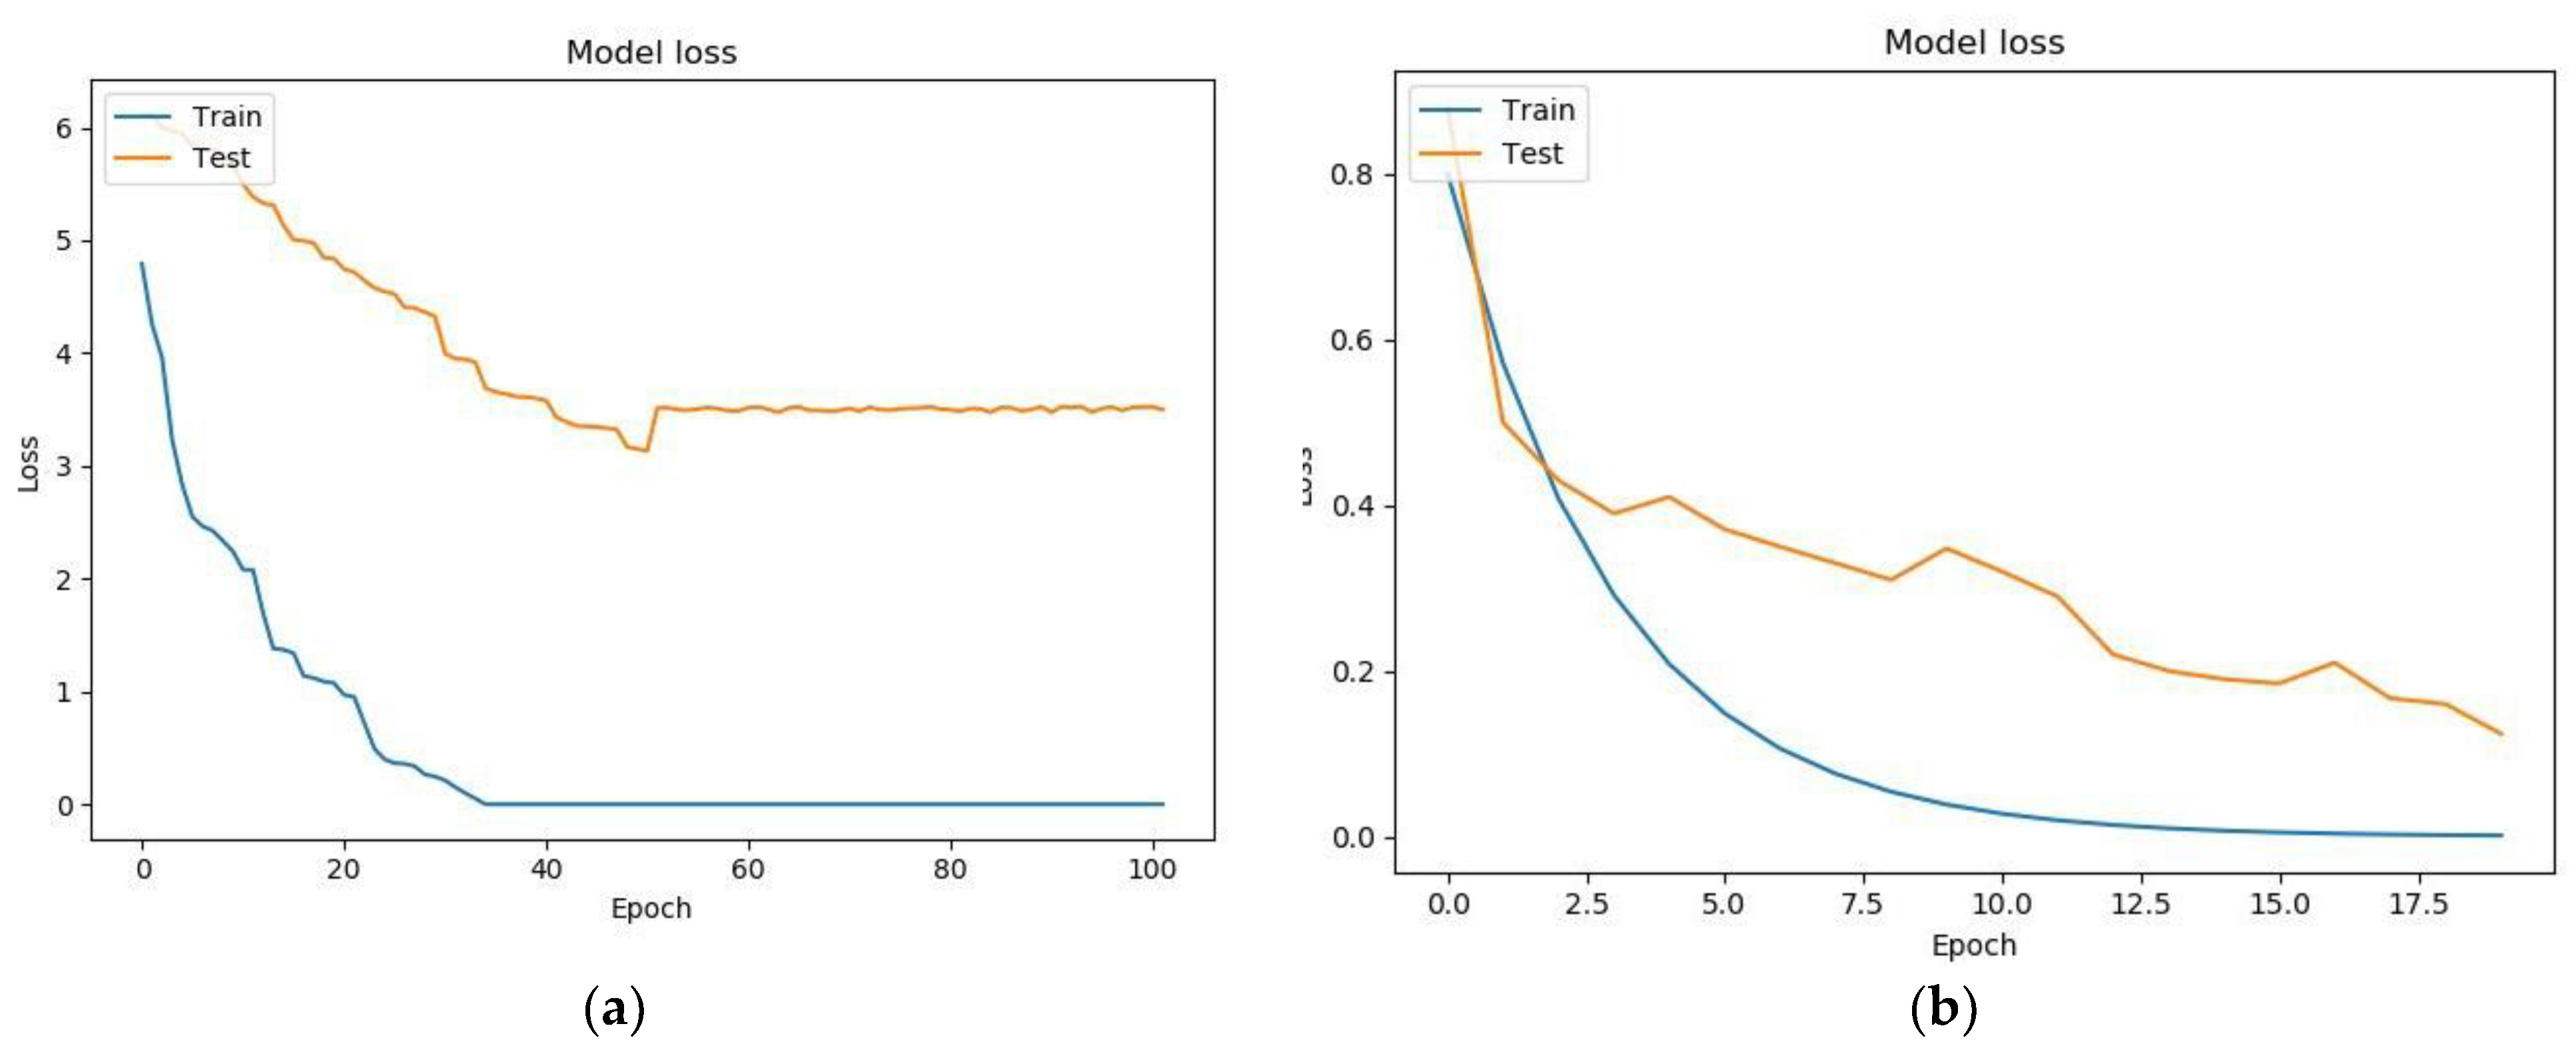
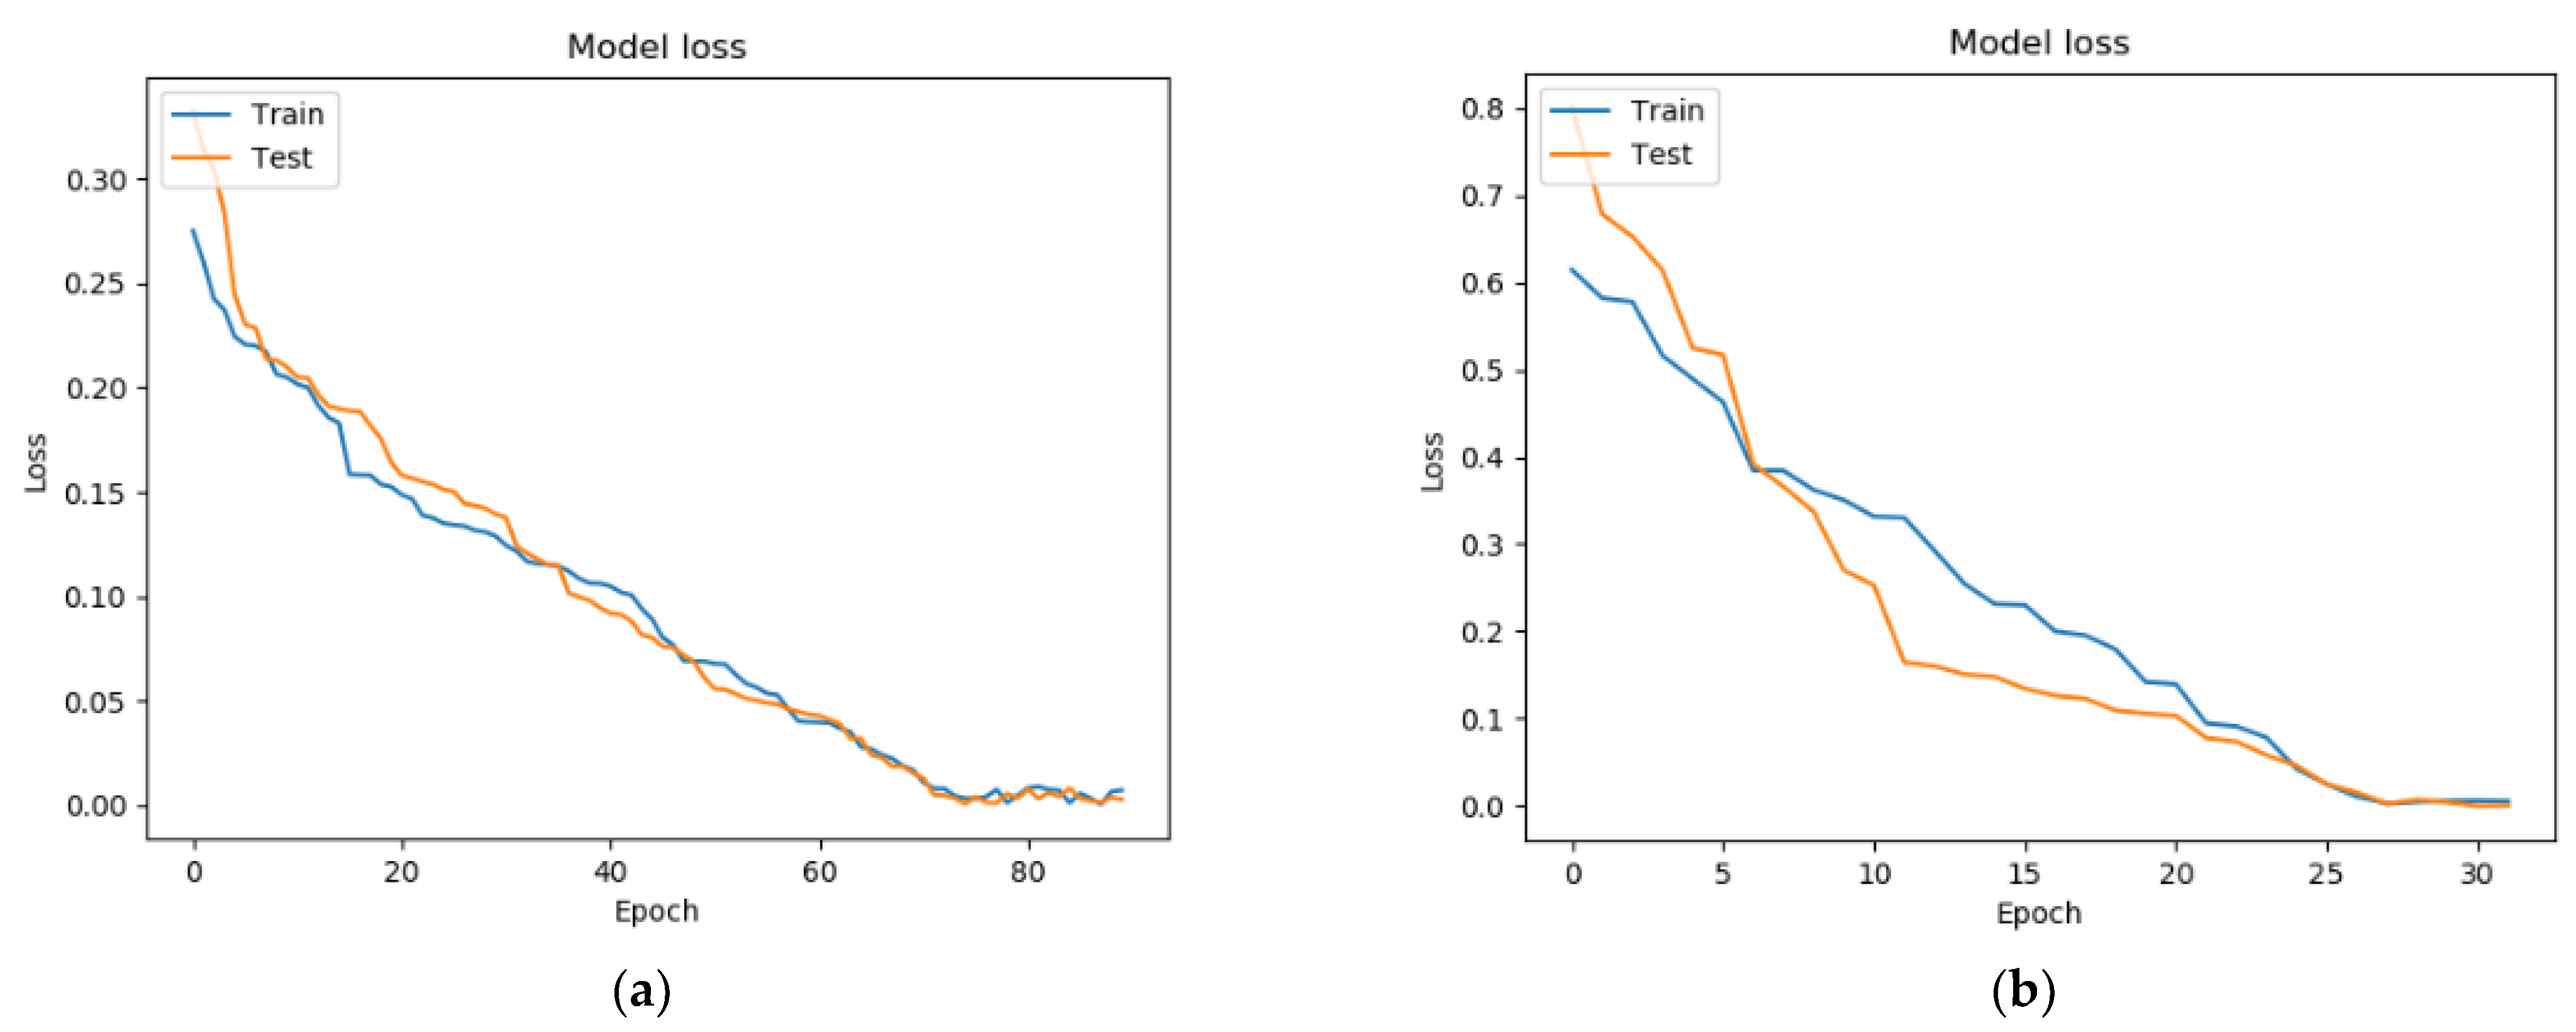
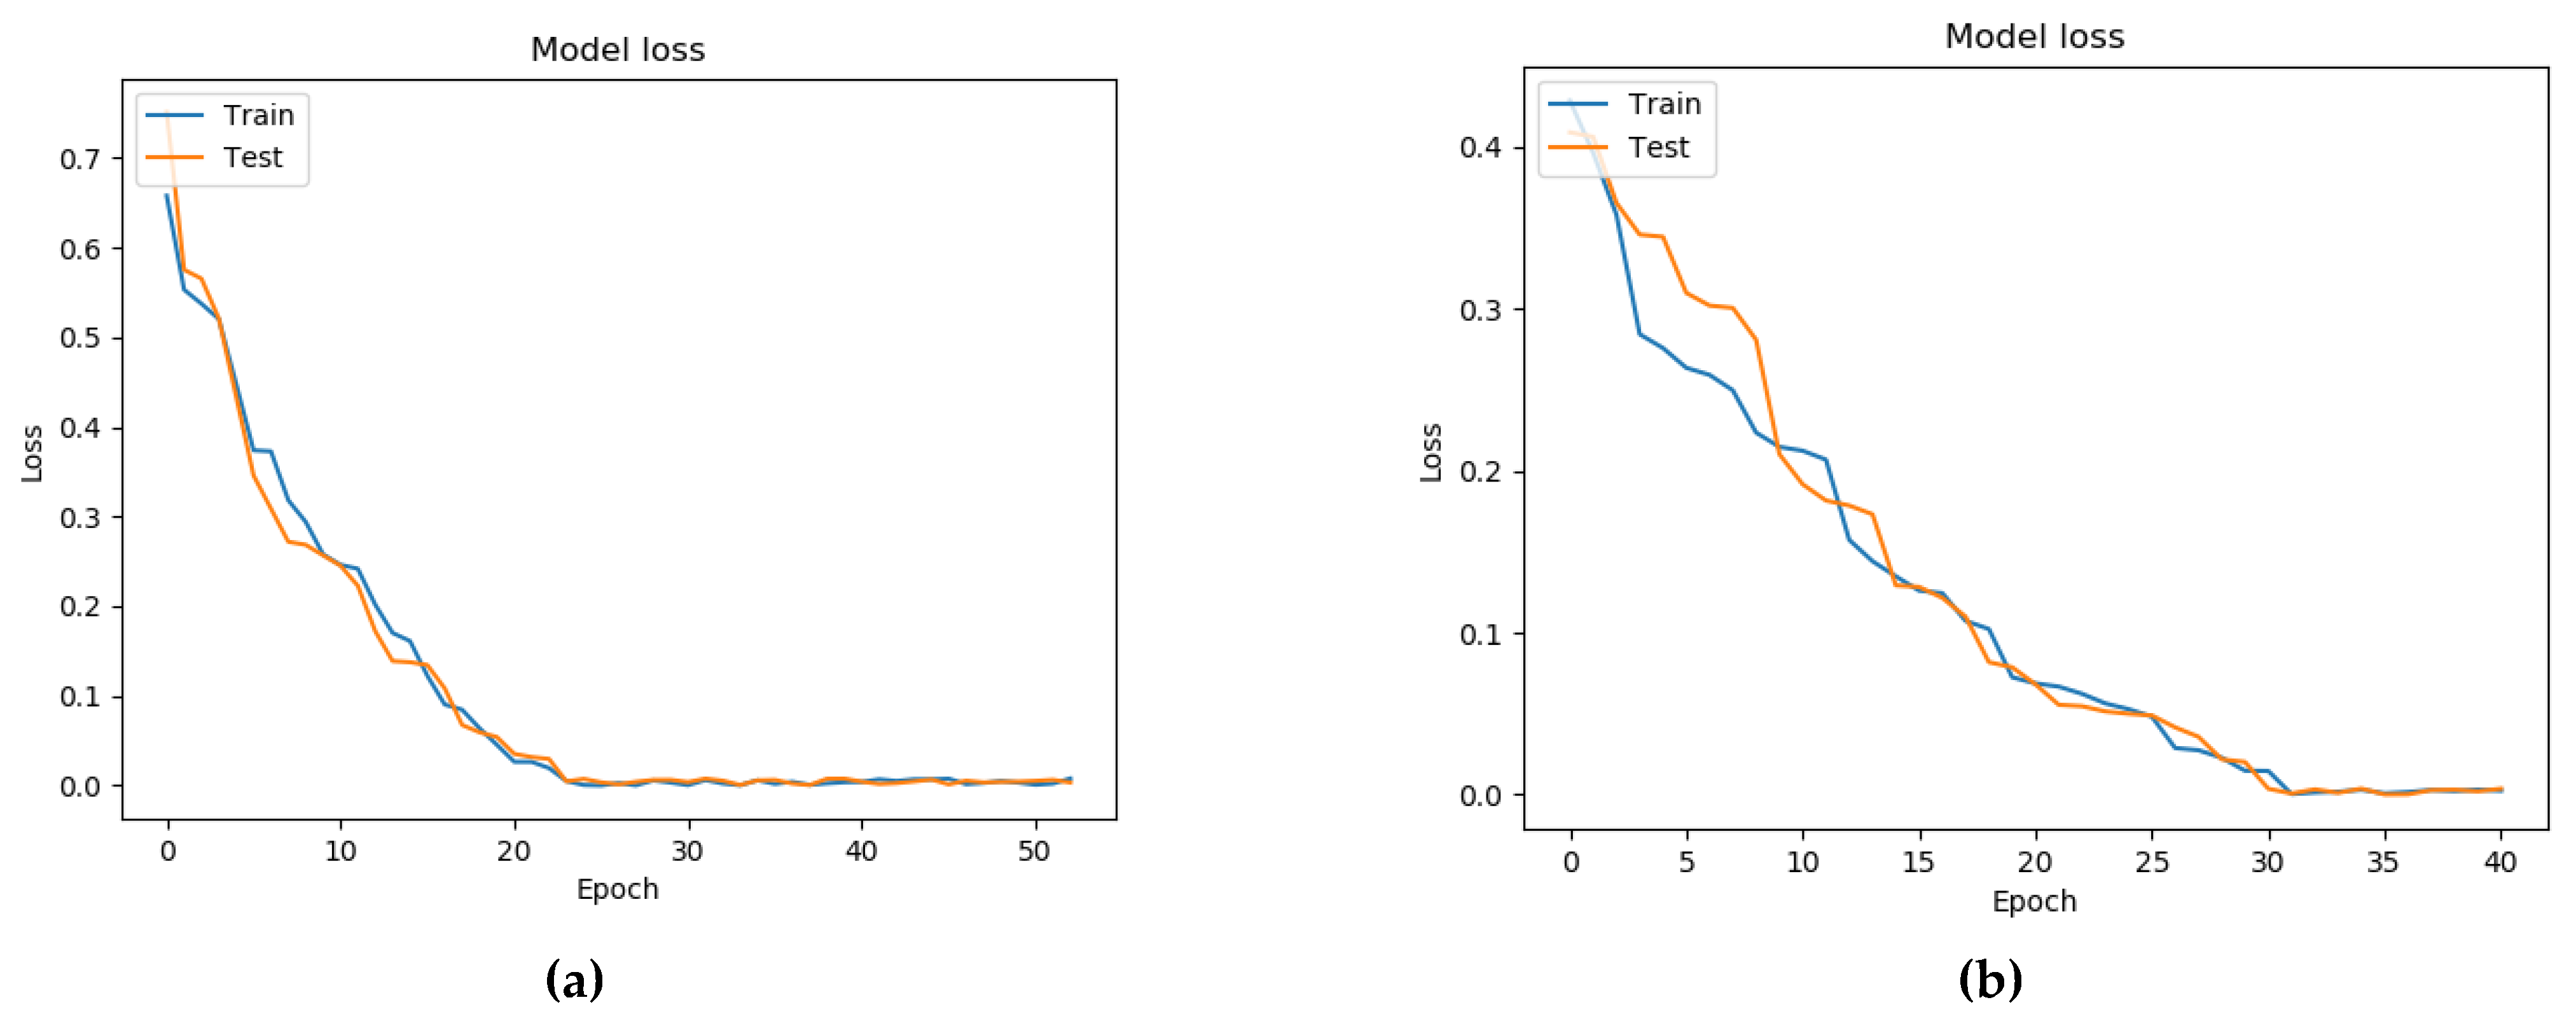
7. Testing a Model for Assessing the Condition of a Patient with Parkinson’s Disease Based on a Neural Network and a Genetic Algorithm
- Binary cross-entropy (BCE) was used as a loss function;
- The standard deviation (MSE) was used as a metric for learning quality;
- The activation function ReLU was used in the hidden layers of the neural network, while that in the output layer was Sigmoid.
8. Discussion
9. Conclusions
Author Contributions
Funding
Institutional Review Board Statement
Informed Consent Statement
Data Availability Statement
Conflicts of Interest
References
- Levin, O.S.; Fedorova, N.V. Parkinson’s Disease; OAO IPO «Lev Tolstoy»: Moskow, Russia, 2006. (In Russian) [Google Scholar]
- Luna, E.; Luk, K.C. Bent out of shape: α-Synuclein misfolding and the convergence of pathogenic pathways in Parkinson’s disease. FEBS Lett. 2015, 589, 3749–3759. [Google Scholar] [CrossRef]
- Stankevich, E.; Paramonov, I.; Timofeev, I.; Demidov, P.G. Mobile Phone Sensors in Health Applications. In Proceedings of the 12th FRUCT Conference, Oulu, Finland, 5–9 November 2012; p. 19. [Google Scholar]
- Wenlong, X.; Yin, L. mHealthApps: A Repository and Database of Mobile Health Apps. US National Library of Medicine National Institutes of Health. 2018. Available online: https://www.ncbi.nlm.nih.gov/pmc/articles/PMC4382566/ (accessed on 16 December 2019).
- Pavlakis, P.; Alepis, E.; Virvou, M. Intelligent mobile multimedia application for the support of the elderly. In Proceedings of the Eighth International Conference on Intelligent Information Hiding and Multimedia Signal Processing, Piraeus-Athens, Greece, 18–20 July 2012; pp. 297–300. [Google Scholar]
- Wu, D.; Warwick, K.; Ma, Z.; Gasson, M.N.; Jonathan, G.; Burgess, J.G.; Pan, S.; Aziz, T.Z. Prediction of parkinson’s disease tremor onset using a radial basis function neural network based on particle swarm optimization. Int. J. Neural Syst. 2010, 20, 109–116. [Google Scholar] [CrossRef]
- Wu, D.; Warwick, K.; Ma, Z.; Burgess, J.G.; Pan, S.; Aziz, T.Z. Prediction of Parkinson’s disease tremor onset using radial basis function neural networks. Expert Syst. Appl. 2010, 37, 2923–2928. [Google Scholar] [CrossRef]
- Antos, S.; Albert, M.; Kording, K. Hand, belt, pocket or bag: Practical activity tracking with mobile phones. J. Neurosci. Methods 2014, 231, 22–30. [Google Scholar] [CrossRef]
- Sadek, R.M.; Mohammed, S.A.; Abunbehan, A.R.K.; Ghattas, A.K.H.A.; Badawi, M.R.; Mortaja, M.N.; Abu-Nasser, B.S.; Abu-Naser, S.S. Parkinson’s disease prediction using artificial neural network. Int. J. Acad. Health Med Res. (IJAHMR) 2019, 3, 1–8. [Google Scholar]
- Joshi, S.; Shenoy, D.; Rrashmi, P.L.; Venugopal, K.R.; Patnaik, L.M. Classification of Alzheimer’s disease and Parkinson’s disease by using machine learning and neural network methods. In Proceedings of the Second International Conference on Machine Learning and Computing, Bangalore, India, 12–13 June 2010; pp. 218–222. [Google Scholar] [CrossRef]
- Ahmed, S.S.S.J.; Santosh, W.; Kumar, S.; Christlet, T. Neural network algorithm for the early detection of Parkinson’s disease from blood plasma by FTIR micro-spectroscopy. Vib. Spectrosc. 2010, 53, 181–188. [Google Scholar] [CrossRef]
- Hirschauer, T.J.; Adeli, H.; Buford, J.A. Computer-Aided Diagnosis of Parkinson’s disease using enhanced probabilistic neural network. J. Med. Syst. 2015, 39, 179. [Google Scholar] [CrossRef] [PubMed]
- Palumbo, B.; Fravolini, M.L.; Nuvoli, S.; Spanu, A.; Paulus, K.S.; Schillaci, O.; Madeddu, G. Comparison of two neural network classifiers in the differential diagnosis of essential tremor and Parkinson’s disease by 123I-FP-CIT brain SPECT. Eur. J. Nucl. Med. Mol. Imaging 2010, 37, 2146–2153. [Google Scholar] [CrossRef]
- Ene, M. Neural network-based approach to discriminate healthy people from those with Parkinson’s disease, Annals of the University of Craiova. Math. Comp. Sci. Ser. 2008, 35, 112–116. [Google Scholar]
- Hariharan, M.; Polat, K.; Sindhu, R. A new hybrid intelligent system for accurate detection of Parkinson’s disease. Comput. Methods Programs Biomed. 2014, 113, 904–913. [Google Scholar] [CrossRef] [PubMed]
- Tracy, J.M.; Özkanca, Y.; Atkins, D.C.; Ghomi, R.H. Investigating voice as a biomarker: Deep phenotyping methods for early detection of Parkinson’s disease. J. Biomed. Inform. 2020, 104, 103362. [Google Scholar] [CrossRef] [PubMed]
- Fernández-García, S.; Dumitrache, C.G.; González-López, J.A. Acoustic analysis of the voice in patients with Parkinson’s disease and hypokinetic dysarthria. Revista de Logopedia, Foniatría y Audiología 2020. [Google Scholar] [CrossRef]
- Hemmerling, D.; Wojcik-Pedziwiatr, M. Prediction and Estimation of Parkinson’s Disease Severity Based on Voice Signal. J. Voice 2020. [Google Scholar] [CrossRef] [PubMed]
- Majda-Zdancewicz, E.; Dobrowolski, A.; Potulska-Chromik, A.; Jakubowski, J.; Chmielińska, J.; Białek, K.; Nojszewska, M.; Kostera-Pruszczyk, A. The use of voice processing techniques in the assessment of patients with Parkinson’s disease. In Proceeding of the SPIE 11442, Radioelectronic Systems Conference, Jachranka, Polan, 20–21 November 2019. [Google Scholar] [CrossRef]
- Poorjam, A.H.; Kavalekalam, M.S.; Shi, L.; Raykov, J.P.; Jensen, J.R.; Little, M.A.; Christensen, M.G. Automatic quality control and enhancement for voice-based remote Parkinson’s disease detection. Speech Commun. 2021, 127, 1–16. [Google Scholar] [CrossRef]
- Tsanas, A.; Little, M.A.; Ramig, L.O. Remote Assessment of Parkinson’s Disease Symptom Severity Using the Simulated Cellular Mobile Telephone Network. IEEE Access 2021, 9, 11024–11036. [Google Scholar] [CrossRef] [PubMed]
- Viswanathan, R.; Arjunan, S.P.; Bingham, A.; Jelfs, B.; Kempster, P.; Raghav, S.; Kumar, D.K. Complexity Measures of Voice Recordings as a Discriminative Tool for Parkinson’s Disease. Biosensors 2020, 10, 1. [Google Scholar] [CrossRef] [PubMed]
- Ali, L.; Zhu, C.; Zhou, M.; Liu, Y. Early diagnosis of Parkinson’s disease from multiple voice recordings by simultaneous sample and feature selection. Expert Syst. Appl. 2019, 137, 22–28. [Google Scholar] [CrossRef]
- Lahmiri, S.; Shmuel, A. Detection of Parkinson’s disease based on voice patterns ranking and optimized support vector machine. Biomed. Signal Process. Control 2019, 49, 427–433. [Google Scholar] [CrossRef]
- Aich, S.; Younga, K.; Hui, K.L.; Al-Absi, A.A.; Sain, M. A nonlinear decision tree based classification approach to predict the Parkinson’s disease using different feature sets of voice data. In Proceedings of the 2018 20th International Conference on Advanced Communication Technology (ICACT), Chuncheon, South Korea, 11–14 February 2018; pp. 638–642. [Google Scholar] [CrossRef]
- Wroge, T.J.; Özkanca, Y.; Demiroglu, C.; Si, D.; Atkins, D.C.; Ghomi, R.H. Parkinson’s Disease Diagnosis Using Machine Learning and Voice. In Proceedings of the 2018 IEEE Signal Processing in Medicine and Biology Symposium (SPMB), Philadelphia, PA, USA, 1 December 2018; pp. 1–7. [Google Scholar] [CrossRef]
- Haq, A.U.; Li, J.P.; Memon, M.H.; khan, J.; Malik, A.; Ahmad, T.; Ali, A.; Nazir, S.; Ahad, I.; Shahid, M.; et al. Feature Selection Based on L1-Norm Support Vector Machine and Effective Recognition System for Parkinson’s Disease Using Voice Recordings. IEEE Access 2019, 7, 37718–37734. [Google Scholar] [CrossRef]
- Hochman, R.; Hochman, R.; Khoshgoftaar, T.M.; Allen, E.B.; Hudepohl, J.P. Using the genetic algorithm to build optimal neural networks for fault-prone module detection. In Proceedings of ISSRE’96: 7th International Symposium on Software Reliability Engineering, White Plains, NY, USA, 30 October–2 November 1996; pp. 152–162. [Google Scholar]
- Lam, H.-K.; Ling, S.H.; Leung, F.H.F.; Tam, P.K.S. Tuning of the structure and parameters of a neural network using an improved genetic algorithm. IEEE Trans. Neural Netw. 2003, 14, 79–88. [Google Scholar] [CrossRef]
- Update on CMUSphinx Project. Available online: https://cmusphinx.github.io/ (accessed on 21 March 2021).
- Pendharkar, P.C. Exhaustive and heuristic search approaches for learning a software defect prediction model. Eng. Appl. Artif. Intell. 2010, 23, 34–40. [Google Scholar] [CrossRef]
- TensorFlow Core. Available online: https://www.tensorflow.org/overview (accessed on 16 March 2021).


| Parameter | Parameter Description | Example Value | Unit of Measure |
|---|---|---|---|
| Text erased | Number of characters removed | 13 | - |
| Text time | Time to print text | 139,763 | ms |
| Levenshtein Distance | Levenshtein distance | 5 | - |
| Misclicks | The number of button misses in the application | 4 | - |
| Misclick distance | Distance between nearest button and miss | 2.357022 | dp |
| Tapping left count | Number of strokes with the left finger | 47 | - |
| Tapping right count | Number of strokes with the right finger | 52 | - |
| State | Subjective state of the patient | 1 | - |
| Velocity | Phone movement speed | 1.342 | ms |
| Figure distance | Distance from a point to a given shape | 2.23 | dp |
| Test Number | Average Pause Time (sec) | Maximum Pause Time | Number of Pauses | Audibility (%) | Number of Words Per Second | Popular Word |
|---|---|---|---|---|---|---|
| 1 | 0.29 | 0.44 | 6.8 | 34.73 | 1.74 | «and» -2 |
| 0.28 | 0.56 | 6.25 | 16.67 | 1.92 | « more »-2 | |
| 2 | 0.31 | 0.54 | 5.5 | 37.5 | 1.99 | - |
| 0.27 | 0.47 | 5.5 | 31.02 | 1.99 | - | |
| 3 | 0.31 | 0.50 | 6.4 | 7.28 | 1.78 | - |
| 0.22 | 0.48 | 5.5 | 5.79 | 1.63 | « not, and »-2 | |
| 4 | 0.26 | 0.36 | 4.65 | 28.35 | 1.70 | |
| 0.18 | 0.27 | 3.5 | 8 | 1.74 | - | |
| 5 | 0.25 | 0.38 | 8 | 18.71 | 1.92 | - |
| 0.27 | 0.48 | 5.5 | 4.16 | 1.91 | «in»-2 |
| Architecture | Number of Epochs for Training | Loss Function | Accuracy |
|---|---|---|---|
| Fully connected architecture built using a genetic algorithm | 105 | 3.74362 | 0.1745234 |
| Analytically built architecture (two recurrent layers + two fully connected layers) | 32 | 0.19795 | 0.88951 |
| Architecture | Number of Epochs for Training | Loss Function | Accuracy |
|---|---|---|---|
| Fully connected architecture built using a genetic algorithm | 90 | 0.000148 | 0.97295 |
| Analytically built architecture (one recurrent layer + four fully connected layers) | 35 | 0.00592 | 0.88725 |
| Architecture | Number of Epochs for Training | The Function of Losses | Accuracy |
|---|---|---|---|
| Four fully connected layers in a network built using a genetic algorithm | 55 | 0.00000241 | 0.83254 |
| Three fully connected layers in a network built without use of a genetic algorithm | 40 | 0.0000482 | 0.82152 |
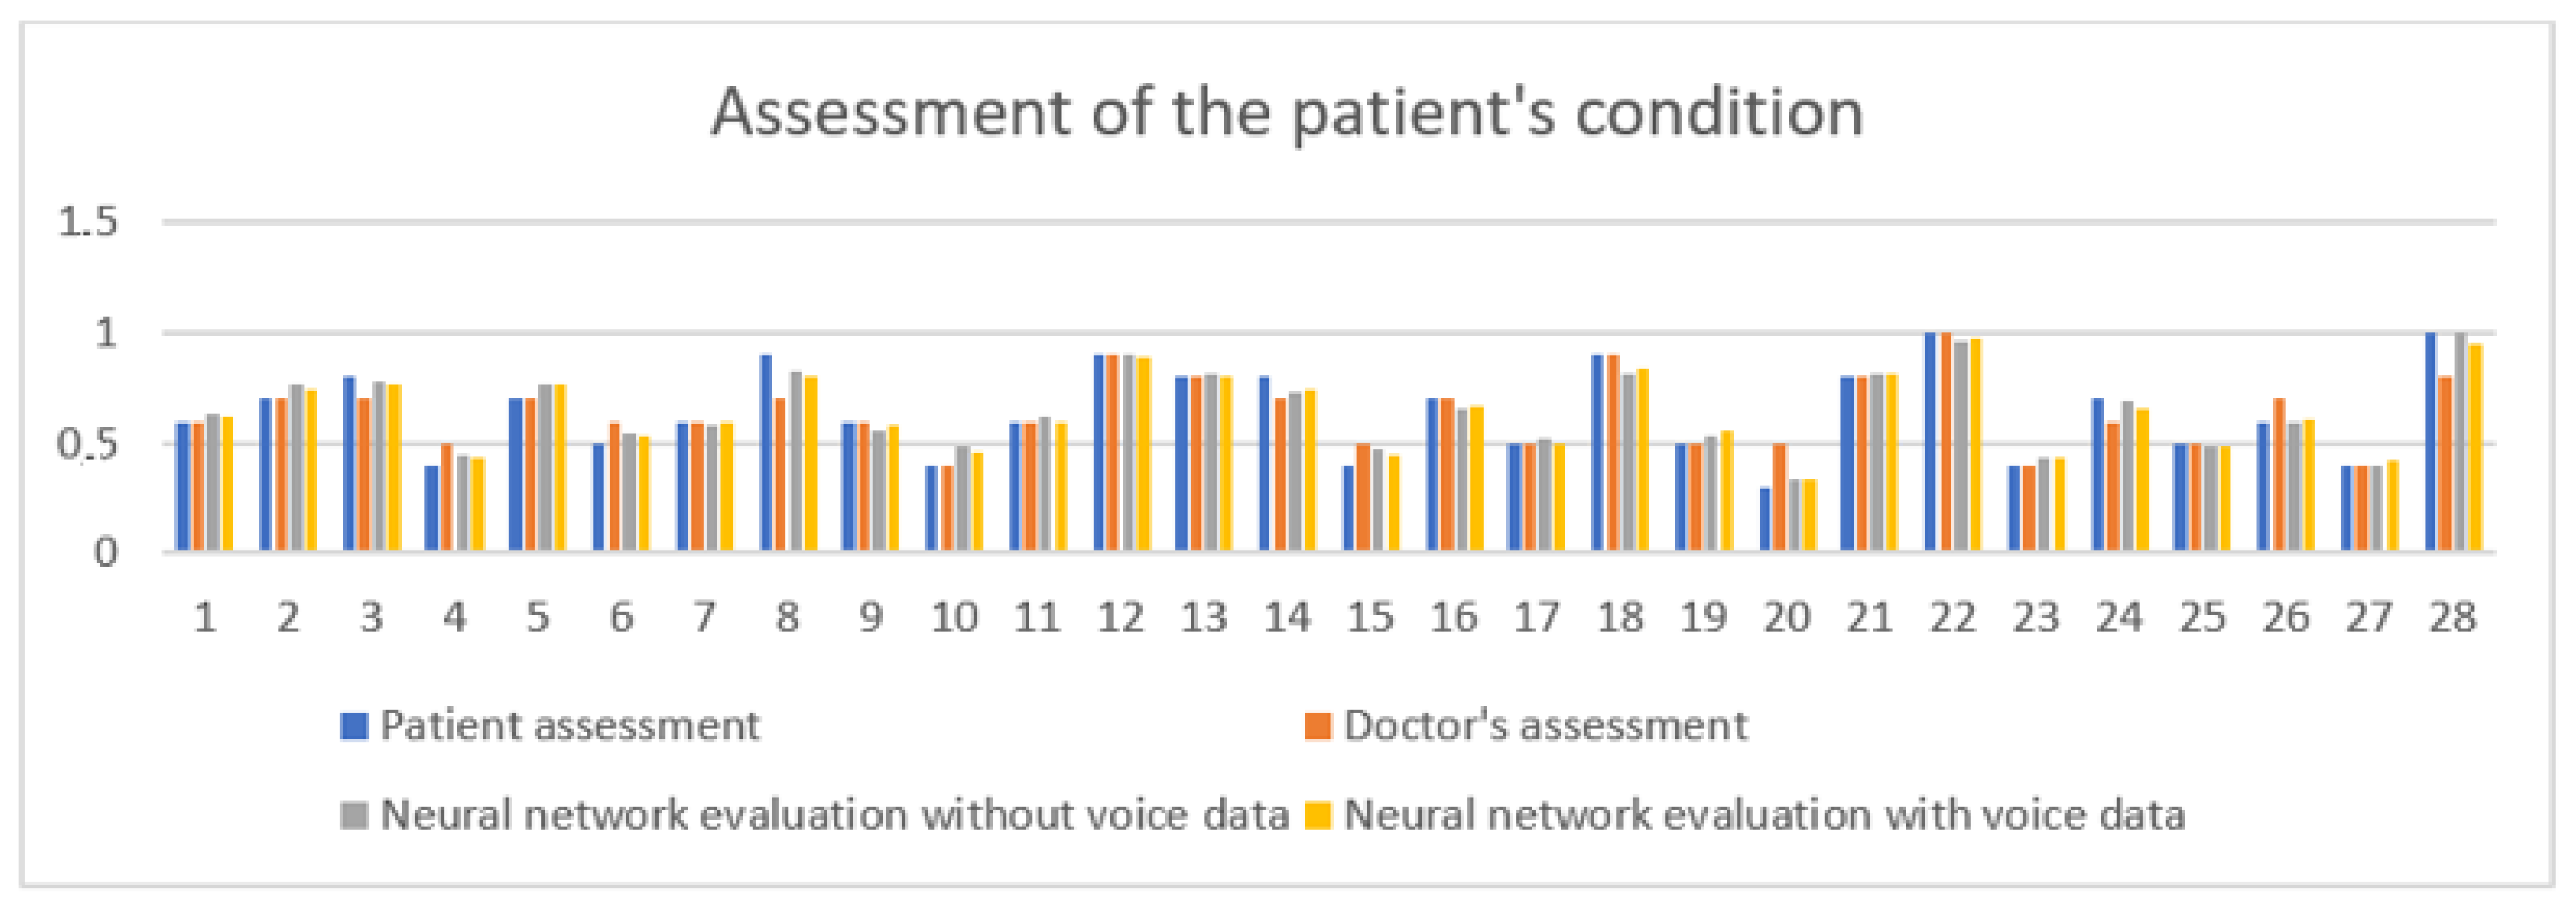
| Accuracy of Assessing the Condition of Patients (%) | Building Neural Networks Analytically | Building Neural Network Architectures Using a Genetic Algorithm | Hybrid Approach |
|---|---|---|---|
| Using voice parameters | 80 | 79 | 83 |
| Without using voice parameters | 78 | 77 | 80 |
Publisher’s Note: MDPI stays neutral with regard to jurisdictional claims in published maps and institutional affiliations. |
© 2021 by the authors. Licensee MDPI, Basel, Switzerland. This article is an open access article distributed under the terms and conditions of the Creative Commons Attribution (CC BY) license (https://creativecommons.org/licenses/by/4.0/).
Share and Cite
Shichkina, Y.; Irishina, Y.; Stanevich, E.; de Jesus Plasencia Salgueiro, A. Application of Genetic Algorithms for the Selection of Neural Network Architecture in the Monitoring System for Patients with Parkinson’s Disease. Appl. Sci. 2021, 11, 5470. https://doi.org/10.3390/app11125470
Shichkina Y, Irishina Y, Stanevich E, de Jesus Plasencia Salgueiro A. Application of Genetic Algorithms for the Selection of Neural Network Architecture in the Monitoring System for Patients with Parkinson’s Disease. Applied Sciences. 2021; 11(12):5470. https://doi.org/10.3390/app11125470
Chicago/Turabian StyleShichkina, Yulia, Yulia Irishina, Elizaveta Stanevich, and Armando de Jesus Plasencia Salgueiro. 2021. "Application of Genetic Algorithms for the Selection of Neural Network Architecture in the Monitoring System for Patients with Parkinson’s Disease" Applied Sciences 11, no. 12: 5470. https://doi.org/10.3390/app11125470
APA StyleShichkina, Y., Irishina, Y., Stanevich, E., & de Jesus Plasencia Salgueiro, A. (2021). Application of Genetic Algorithms for the Selection of Neural Network Architecture in the Monitoring System for Patients with Parkinson’s Disease. Applied Sciences, 11(12), 5470. https://doi.org/10.3390/app11125470