Article

Investigation of Controllable Modes in Active Vibration Cancellation Induced by Piezoelectric Patches

1
School of Marine Science and Technology, Northwestern Polytechnical University, Xi’an 710072, China
2
Ningbo Institute of Northwestern Polytechnical University, Northwestern Polytechnical University, Ningbo 315103, China
*
Author to whom correspondence should be addressed.
Appl. Sci. 2021, 11(12), 5542; https://doi.org/10.3390/app11125542
Submission received: 7 May 2021 / Revised: 4 June 2021 / Accepted: 9 June 2021 / Published: 15 June 2021
(This article belongs to the Special Issue Sensors, Actuators and Methods in Active Noise and Vibration Control)

Abstract

:
Piezoelectric (PZT) patches are widely preferred for actuators and sensors for achieving active vibration cancellation (AVC). When PZT actuators and sensors are placed at the region of maximum strain energy for structural modes, there are still uncontrollable and controllable modes in the actual application. When an uncontrollable mode is excited, the structural vibration problem may not be solved by AVC, and may even be aggravated. However, a few studies have specifically targeted this problem. In this study, the controllable modes of a plate with free boundaries are investigated to ensure the AVC effect. To specify the controllable modes in advance, a criterion for controllable modes is proposed. The proposed criterion is firstly obtained by defining the ratio of the open-loop and closed-loop energies of AVC, and then simplified by considering the dominating modes. Corresponding simulations and experiments are conducted on a smart plate consisting of PZT patches to verify the correctness of the theoretical analysis. Results show that the proposed criterion is reliable to specify the controllable modes. The vibration response of the plate is significantly attenuated at the selected controllable mode, and conversely enlarged at a specified uncontrollable mode. It is verified that controllable modes can be effectively predicted by the proposed criterion, which promotes the application of AVC.

1. Introduction

During the last decade, active vibration cancellation (AVC) has been widely investigated for achieving vibration attenuation in the aerospace and automotive fields [1,2,3]. Especially, AVC using piezoelectric (PZT) patches [4,5] has attracted attention due to its advantages of light weight, compact size, and low cost [6,7]. In recent years, many efforts have been made in terms of actuator placement to facilitate AVC applications using PZT patches [5]. Utilizing the optimal actuator placement, the AVC effect for each concerned mode cannot be ensured in many practical applications [8]. Therefore, several measures should still be taken to ensure the performance of AVC.
Controllability and observability analyses are helpful to ensure the AVC effect, which was proved by Abreu et al. [9]. Shevtsov et al. [10] emphasized that the controllability and observability of AVC are influenced by the size and location of the actuators. Mojtaba et al. [11] utilized spatial controllability/observability to determine optimal orientations of PZTs and ensured the AVC effect. Vasques et al. [12] pointed out that the AVC effect is mainly affected by unobserved model dynamics at the location of piezoelectric sensors. In addition, Singhal et al. [13] summarized that a misplacement of piezoelectric patches can lead to a lack of observability and controllability. Considering the lack of observability and controllability, majority studies mainly focused on high frequency spillover induced by the uncontrolled mode [14,15,16]. Tehrani et al. [14] demonstrated that the high frequency spillover of AVC is mostly determined by the uncontrolled mode. Morris et al. [15] weighted several uncontrolled modes to prevent the spillover of AVC. For spillover reduction of the modes, Xue et al. [16] proposed an optimal sensor placement to ensure vibration reduction in the controlled mode. Furthermore, Khan et al. [17] noted that the vibration of a smart structure may be aggravated in the controlled mode. The aggravated vibration does not benefit the actual suppression of vibration and noise. However, only a few studies considered the aggravated structural vibration induced by AVC.
In order to ensure the AVC effect, the mechanism of aggravated vibration is revealed, which is related to the location of PZT. When the positions are assigned, the structural modes can be divided into controllable and uncontrollable modes. Based on the open-loop and closed-loop energies of AVC, a criterion for the selection of controllable modes is proposed. When AVC is implemented at the selected controllable mode, vibration attenuation can be achieved. Meanwhile, the uncontrollable modes should be excluded during the implementation of AVC to avoid aggravated vibrations.
The rest of the article is organized as follows. In Section 2, the dynamic model of the smart plate is built. In Section 3, the criterion is presented to specify controllable and uncontrollable modes. In Section 4, simulations for each concerned mode are carried out to verify the theoretical analyses. In Section 5, typical experiments are performed to further verify the selected controllable and uncontrollable modes. Finally, several conclusions are drawn.

2. Dynamic Modeling

In this section, the dynamic model of a smart plate consisting of PZT actuators and sensors is presented. For the PZT sensors, it is assumed that the applied electric field is zero; PZT is polarized along the z-direction and the influence of the self-induction electric field is ignored. A state-space equation of the model is derived to facilitate the controllable mode analysis mentioned later in this work.

2.1. Dynamic Equation

Figure 1 shows a schematic view of the smart plate of this study. A homogeneous plate (dimensions: Lp,x × Lp,y × hp) was considered. The PZT actuator and sensor have the dimensions of La,x × La,y × ha and Ls,x × Ls,y × hs, respectively. The vibration of the plate was excited by both a sinusoidal external disturbance F(t) and a sinusoidal actuating voltage y(t). The displacement of the plate under pure bending is represented by ξ ( x , y , t ) . For simplicity, the parameters of ξ ( x , y , t ) in the brackets will be omitted in the following derivation. The sensing voltage of PZT is denoted as e(t). The Cartesian coordinate system for the smart plate is shown in Figure 1, and its origin is taken at one vertex of the plate. When the plate vibration is subjected to both disturbance F(t) and actuating voltage y(t), the dynamic equation of the plate [18,19] is:
D p [ 4 ξ x 4 + 4 ξ y 4 + 2 4 ξ x 2 y 2 ] + ρ p h p ξ ¨ = F ( t ) δ ( x x F ) δ ( y y F ) χ a y ( t ) ( 2 R a x 2 + 2 R a y 2 )
where D p = E p I p ( 1 + j η p ) is the complex flexural rigidity of the plate; E p , I p , ρ p , h p , and η p represent the Young’s modulus, the inertia moment, the density, the thickness, and the loss factor of the plate, respectively; χ a is a constant determined by the converse piezoelectric effect of PZT [20]; ( x F , y F ) is the location of the external disturbance F ( t ) ; and R a is the generalized location function of PZT. In Equation (1), the additional mass and stiffness of PZT are neglected, since the dimensions of the piezoelectric patches are small compared with those of the plate [21].
Utilizing the separation variable method, the transverse displacement of the plate is denoted as:
ξ ( x , y , t ) = Φ T
where Φ = [ φ 11 ( x , y ) , φ 12 ( x , y ) , , φ M N ( x , y ) ] ; T = [ T 11 ( t ) , T 12 ( t ) , , T M N ( t ) ] T ; φ m n ( x , y ) is the mode shape function satisfying the geometric boundary conditions; T m n ( t ) is the modal response of the first ( m , n ) mode; m and n are the number of half-waves in the longitudinal (x) and lateral (y) directions; and M and N are the total number of mode shapes in the x and y directions, respectively.
Based on the piezoelectric effect, the sensing signal of PZT is generated by the plate vibration. As shown in Figure 2, the amplified sensing signal, e(t), is denoted as [22]:
e ( t ) = χ s H c Φ s T T
where χ s is a constant determined by the piezoelectric effect of PZT; H c represents the transfer function of the charge amplifier circuit; Φ s = L s , x L s , y χ s [ ϕ 11 ( x s , y s ) , ϕ 12 ( x s , y s ) , , ϕ M N ( x s , y s ) ] ; and ( x s , y s ) is the center coordinate of PZT. Meanwhile, ϕ m n ( x i , y i ) represents the modal strain of the plate, which is given by:
ϕ m n ( x i , y i ) = ( 2 x 2 + 2 y 2 ) φ m n | x = x i , y = y i
As shown in Equation (3), the modal strain has a direct influence on the sensing voltage of PZT.

2.2. State-Space Model

By using the orthogonality conditions of φ m n ( x , y ) , substituting Equation (2) into Equation (1), multiplying φ m n ( x , y ) and then integrating over the entire area of the plate, the usual state-space representation is obtained as:
{ x ˙ = A x + B F F ( t ) + B u y ( t ) e = C x ,
where x = [ T ˙ 11 , ω 11 T 11 , T ˙ 12 , ω 12 T 12 , T ˙ M N , ω M N T M N ] T ; A = diag ( A m n ) , A m n = [ η p ω m n ω m n ω m n 0 ] ; ω m n 2 = D p / ρ p h p 0 L x 0 L y [ ( 2 / x 2 + 2 / y 2 ) 2 φ m n ( x , y ) ] φ m n ( x , y ) d x d y ; B F = 1 / ρ p h p [ φ 11 ( x F , y F ) , 0 , φ 12 ( x F , y F ) , 0 , , φ M N ( x F , y F ) , 0 ] T ; B u = Δ a , x Δ a , y χ a / ρ p h p [ ϕ 11 ( x a , y a ) , 0 , ϕ 12 ( x a , y a ) , 0 , , ϕ M N ( x a , y a ) , 0 ] T ; and C = Δ s , x Δ s , y χ s / ρ p h p [ 0 , ϕ 11 ( x s , y s ) , 0 , ϕ 12 ( x s , y s ) , , 0 , ϕ M N ( x s , y s ) ] . The controllability function, H c o n , and observability function, H o b s [23], are denoted as, respectively,
H c o n = min 1 2 T 0 y ( τ ) 2 d τ H o b s = min 1 2 T 0 e ( τ ) 2 d τ
With Equations (5) and (6), the controllability and observability of AVC is related to sensing signal e ( t ) and actuating voltage y ( t ) . Based on Equations (1) and (3), the modal strains are related to e ( t ) and y ( t ) . Therefore, modal strains at the locations of the PZT actuators and sensors have a direct influence on the controllability and observability of AVC.
The state-space representation provides a complete and reliable model for the smart plate, which contributes to clarifying the controllable mode in AVC in Section 3.

2.3. AVC System for the Smart Plate

A typical AVC system shown in Figure 3 is considered. When AVC is not activated, the plate is only excited by an external sinusoidal disturbance. When AVC is started, the sensing signal of PZT caused by structural vibrations is transmitted to the controller. Based on the sensing signal, the control algorithm in the controller is activated to generate the desired actuating voltage. Then, the actuating voltage is applied to the PZT actuator through the voltage amplifier to achieve AVC. Thus, the controlled vibration is subjected to both the external disturbance and the PZT actuator, which is described in Equation (5).
The control signal y ( t ) in Equation (5) is repeatedly updated through the filtered-x least mean square algorithm (FxLMS) [24]. Utilizing FxLMS, the sensing signal of PZT will gradually decay to 0 and AVC is achieved.

3. Controllable and Uncontrollable Modes for AVC

3.1. Description of Controllable and Uncontrollable Modes

A smart structure with a typical AVC system [25] is shown in Figure 4. The PZT is placed at the region of maximum strain energy on the structure to ensure good sensing and actuating performances. Throughout the entire history of AVC, both a PZT sensor and an accelerometer are adhered to the opposite position of the structure.
The AVC effect in a controllable mode is shown in Figure 5a. Obviously, the structural vibration attenuation in the controllable mode is accompanied by the suppression of the PZT sensing signal [26,27]. In the uncontrollable mode, the structural vibration is enlarged while the PZT sensing signal is decreased as before. This unexpected phenomenon is shown in Figure 5b, and has a negative influence on AVC. Therefore, designating the controllable modes for AVC in advance is critical.

3.2. Theoretical Analysis

In case of a persistent sinusoidal disturbance, the open-loop and closed-loop vibration energies are obtained through a covariance analysis [28]. The covariance matrix of the sinusoidal disturbance is denoted as:
E [ F ( t ) F ( t + τ ) ] = | F | 2 e j ω τ ,
where | F | is the amplitude of the persistent disturbance and ω is the angular frequency of disturbance. Based on the Lyapunov equation [28], the total open-loop vibration energy is:
E o = 1 2 l = 1 M N ( x 2 i 1 , 2 i 1 + x 2 i , 2 i ) = 1 2 m = 1 M n = 1 N β m n ( ω m n 2 + j η p ω ω m n ω 2 ) 2
where l = m n and β m n = | F | 2 e j ω τ φ m n 2 ( x F , y F ) / ρ p 2 h p 2 .
For the AVC system, e ( t ) tends to zero due to the effect of control signal y ( t ) in FxLMS. Based on Equation (5), the ideal control signal (y(t)) is:
y ( t ) = Φ s T Π Φ F T Φ s T Π Φ a T F ( t )
where Π = diag [ 1 / ( ω m n 2 + j η p ω ω m n ω 2 ) ] .
Substituting Equation (9) into Equation (5) yields:
x ˙ = A x + C ˜ B F F ( t )
where C ˜ = [ C ˜ 1 , 1 C ˜ 1 , 2 C ˜ 1 , M N C ˜ 2 , 1 C ˜ 2 , 2 C ˜ 2 , M N C ˜ M N , 1 C ˜ M N , 2 C ˜ M N , M N ] ; C ˜ i , j = [ c ˜ i , j 0 0 0 ] ; c ˜ i , j = { α j ϕ i ( x a , y a , Δ x , Δ y ) k = 1 M N α k ϕ k ( x a , y a , Δ x , Δ y ) i j 1 α j ϕ i ( x a , y a , Δ x , Δ y ) k = 1 M N α k ϕ k ( x a , y a , Δ x , Δ y ) i = j ; the term α j is given by:
α j = ϕ j ( x s , y s , Δ x , Δ y ) / ( ω + j 2 j η p ω ω j ω 2 )
Based on Equation (10), the total closed-loop energy is:
E c = 1 2 m = 1 M n = 1 N β m n ( 1 γ m n ) 2 ( ω m n 2 + j η p ω ω m n ω 2 ) 2
in which the term γ m n is given by:
γ m n = ϕ m n ( x a , y a , Δ x , Δ y ) j = 1 M N α j φ j ( x F , y F ) / φ m n ( x F , y F ) k = 1 M N α k ϕ k ( x a , y a , Δ x , Δ y )
Obviously, the value of γ m n is influenced by the disturbance frequency, the mode shape, and the modal strain.
To specify the controllable mode, the ratio of the open-loop energy to the closed-loop energy is defined as:
γ = E c E o
The defined ratio is used as a criterion to predict the AVC effect. When the disturbance frequency, ω , is close to the first (m, n) natural frequency, ω m n , substituting Equations (8) and (12) into Equation (14) approximately yields:
γ ( υ s 2 + 1 ) [ υ a v F v ω + υ a υ s ] 2
in which v ω = ω c 2 ω 2 ω m n 2 ω 2 is the gap ratio of adjacent natural frequencies; the mode at ω c is the closest mode to the (m, n) mode; v F = φ c ( x F , y F ) φ m n ( x F , y F ) is the ratio of adjacent mode shapes at the location of the disturbance; υ a and υ s are the ratios of adjacent modal strains at the actuator and sensor positions, respectively; and υ a = ϕ c ( x a , y a , Δ x , Δ y ) ϕ m n ( x a , y a , Δ x , Δ y ) ; υ s = ϕ c ( x s , y s , Δ x , Δ y ) ϕ m n ( x s , y s , Δ x , Δ y ) .
In Equation (15), the value of γ is determined by the ratio of adjacent modal strains, the ratio of adjacent mode shapes, and the gap ratio of adjacent natural frequencies. When the ratios v F , υ a , and υ s are large enough, the value of γ is greater than one. Thus, the total closed-loop energy in Equation (12) is greatly enlarged and AVC fails. Therefore, the ( m , n ) mode is denoted as an uncontrollable mode. Conversely, when v F , υ a , and υ s are less than one, the ( m , n ) mode is denoted as a controllable mode for AVC. In addition, when v ω is large enough, γ is less than one. In this condition, the ( m , n ) mode is denoted as a controllable mode. Hence, the value of γ can be used as a criterion in advance to distinguish the controllable and uncontrollable modes in AVC.

4. Simulation and Analysis

In this section, numerical simulation of a smart plate is performed using COMSOL. The finite-element model for the smart plate with parameters listed in Table 1 and Table 2 is shown in Figure 6.
The external disturbance for the plate is placed at (0.33 m, 0.17 m) to excite as many modes as possible. Based on the maximum strain criteria [29], the PZT actuator and sensor are placed at (0.37 m, 0.50 m) and (0.13 m, 0.04 m), respectively. Thus, the controllability and observability are ensured.
Making use of COMSOL yields the mode shapes of the smart plate. Based on theoretical analyses, several natural frequencies below 200 Hz are selected as the disturbance frequencies for AVC. The uncontrolled and controlled vibration responses at different natural frequency orders are shown in Table 3. Their corresponding values of γ calculated by Equation (15) are also shown in Table 3. The magenta triangle, the blue circle, and the cyan square represent the positions of the actuator, the disturbance, and the sensor, respectively. For comparison purposes, the range of the color bars in Table 3 has been set to the same. The darkest blue marks the same lowest value of the acceleration level, and the darkest red represents the same highest value of the acceleration level. The acceleration level is calculated by:
L a = 20 lg ω 2 | ξ | a r e f
in which | ξ | is the amplitude of the displacement of the plate and a r e f is the reference acceleration.
In Table 3, in the (2,3), (3,3), (3,4), and (3,6) modes, the values of γ are greater one, and their corresponding vibration responses are aggravated. These modes are uncontrollable modes, as mentioned above. Conversely, the residual modes listed in Table 3 are controllable. Among the residual modes, the vibration attenuations in the (1,4) and (2,4) modes are relatively small. The reason is that there are close relative modes near the concerned modes. They are difficult to distinguish in practical engineering. In general, only one of the close relative modes is dominant in the structural vibration response. Through AVC, the other close relative mode still contributes a great deal to the structural vibration response. Overall, the AVC effect and γ in the (1,4) and (2,4) modes are positive to verify the proposed criterion. With the results shown in Table 3, the controllable and uncontrollable modes can be effectively pre-estimated using the proposed criterion.
For the uncontrollable modes mentioned above, the main factors of γ related with the location of PZT are listed in Table 4. As shown in Table 4, both υ a and υ s are greater than one. Therefore, the controlled vibration is aggravated because the adjacent mode dominates the actuating and sensing performance of PZT.
From the simulation results, AVC is achieved when the controlled mode plays a dominant role in the performance of PZT. Thus, a series of controllable modes for AVC can be pre-specified according to the modal shapes of the controlled structure. In this way, the active vibration attenuation is ensured as much as possible. These results make contributions to promote the application of AVC with PZT actuators and sensors. In the following experiments, the pair of uncontrollable and controlled modes in Table 3 are randomly selected to further verify the theoretical results.

5. Experimental Verification

5.1. Experiment Setup

An AVC experiment is conducted on a smart plate to further verify the validity of the theoretical analysis. The smart plate is hung using elastic ropes to ensure nearly free boundaries. The experimental setup is shown in Figure 7. The setup includes the controller (HM-cSPACE 28335), the voltage and charge amplifier (self-made electronic board), the actuator (PZT), and the sensor (PZT). Before the AVC is started, an external disturbance is generated by the exciter (JZ-5A), which is determined by the signal generator (Tektronix 3390) through the power amplifier (Crown CT-8150). During AVC, the cSPACE system is used to implement the FxLMS algorithm. The PZT sensor is connected to the A/D ports of the cSPACE device through the charge amplifier. The sensing signal is transmitted to the input of FxLMS. The output of FxLMS is transmitted to the PZT actuator through the voltage amplifier. Consequently, AVC is achieved.
The photographs of the experimental setup are shown in Figure 8a. To measure the overall vibration response of the plate, a lightweight accelerometer is placed at 60 observation points, shown in Figure 8b, in turn. In particular, the acceleration at the center of the PZT sensor is concerned with verifying the AVC effect.
Based on the simulations above, two natural modes, namely the (3,3) and (1,4) modes, are selected to implement AVC. It should be noted that these modes in the experiment are slightly different from those in the simulations due to the influence of polarization conditions, stress/strain rates, temperatures, the additional stiffness of the exciter, etc. [30].
In order to evaluate the AVC effect, the voltage level of the PZT sensor is defined as:
L u = 20 lg | e | ,
in which | e | is the amplitude of the sensing signal. Considering Equation (16), the ratio in Equation (15) is calculated by:
γ = i = 1 60 10 0.1 L a i , c i = 1 60 10 0.1 L a i , o .
Here, L a i , o and L a i , c represent the open-loop and closed-loop vibration responses of the plate at the i-th observation point.

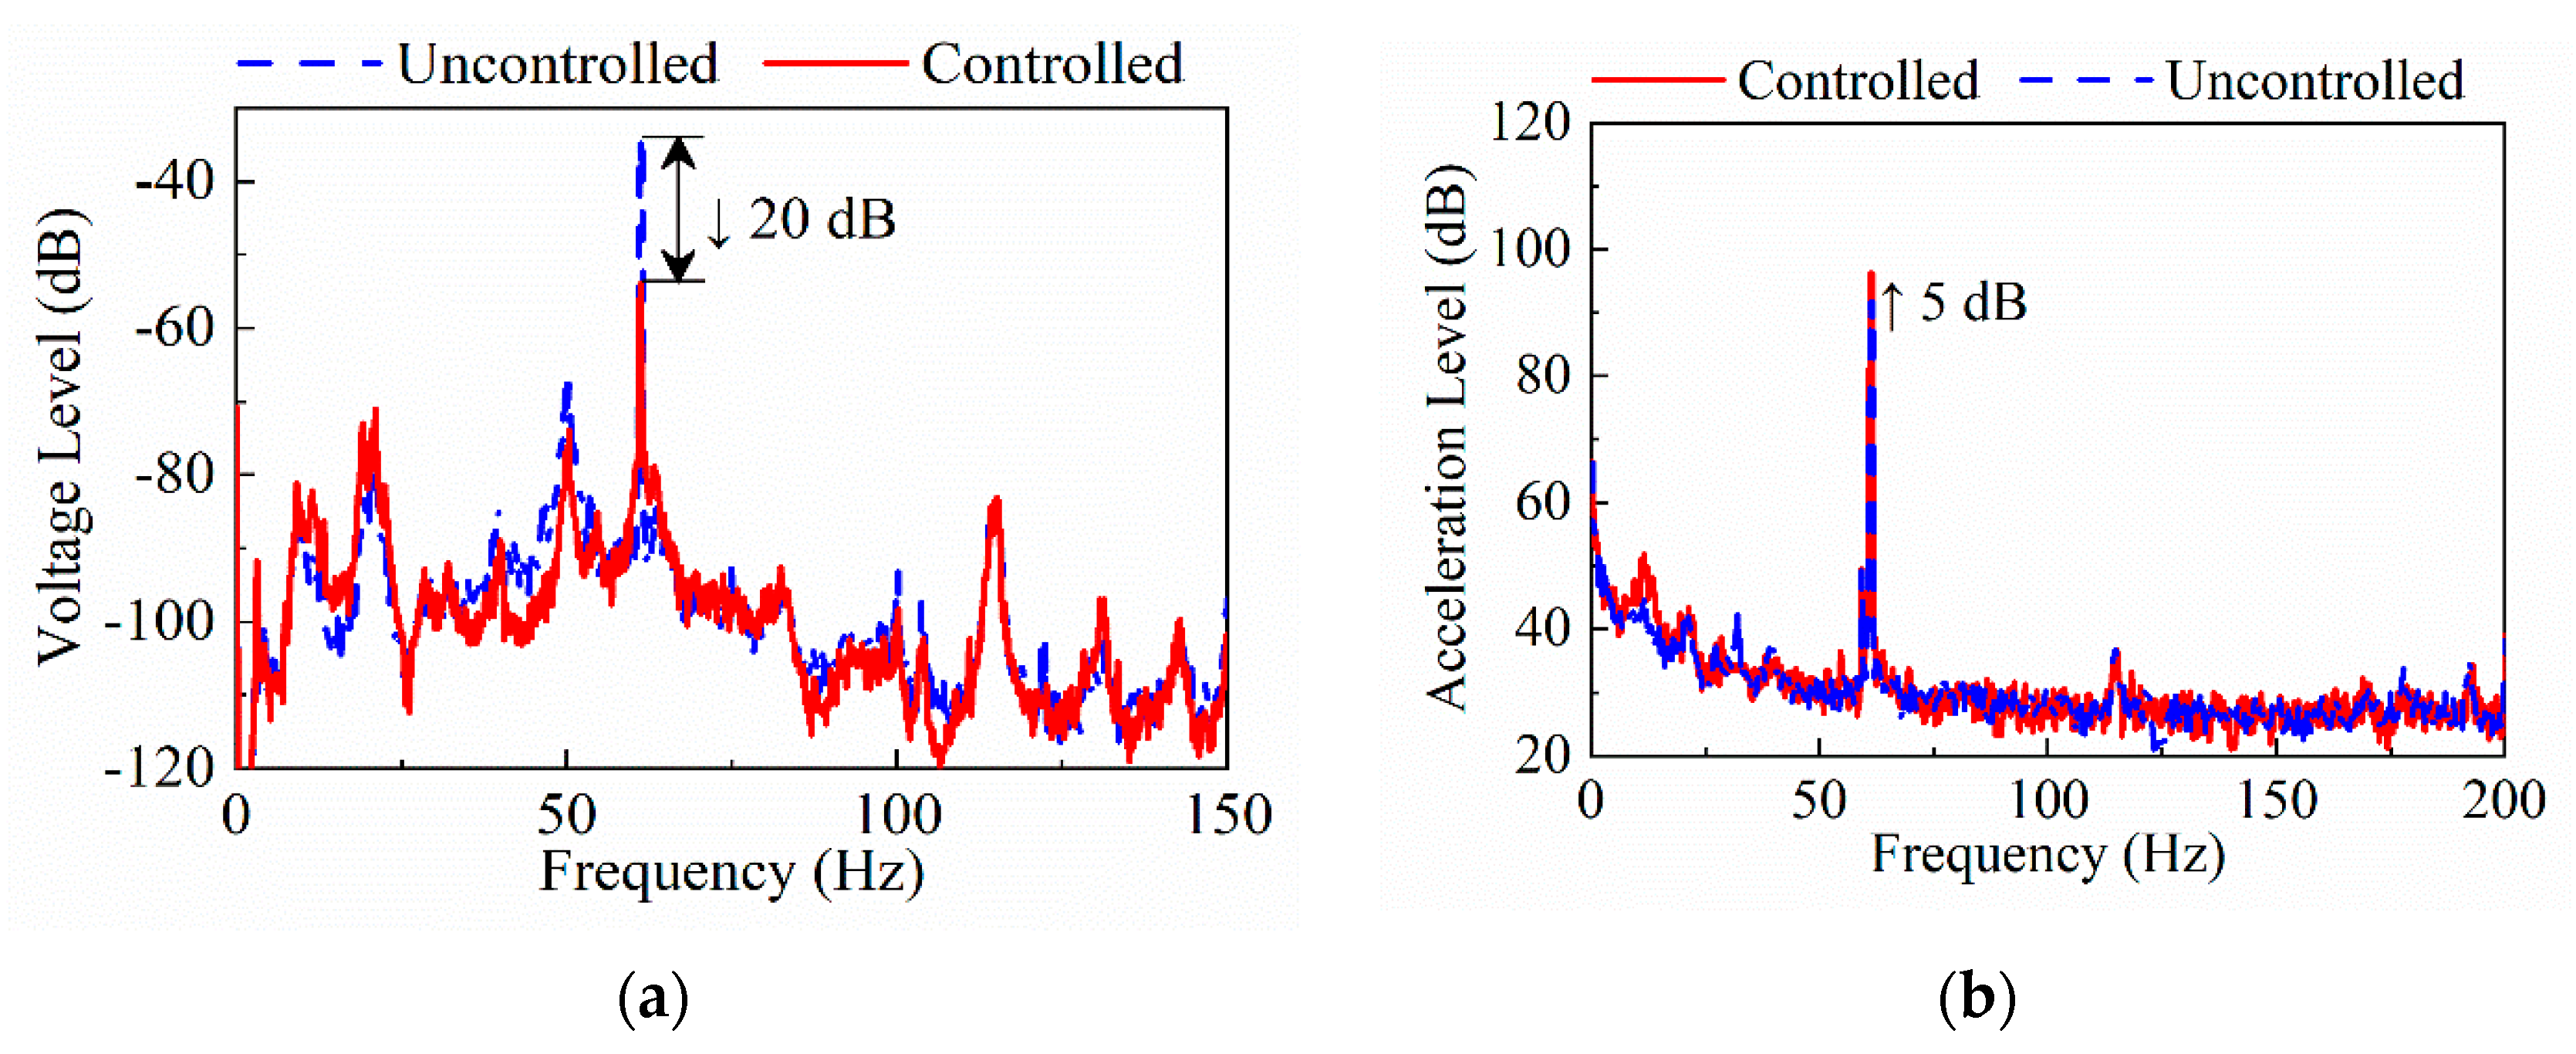
5.2. Uncontrollable Mode: AVC at (3,3) Modal Frequency

For the (3,3) uncontrollable mode, the measured acceleration and the sensing voltage at the same location in the AVC experiment are shown in Figure 9, where the blue and red curves represent the uncontrolled and controlled signals, respectively. When the AVC is turned on, the sensing voltage level of PZT quickly decays by 20 dB, whereas the vibration acceleration level is enlarged by 5 dB. The active vibration suppression at the position of the PZT sensor is not achieved.
In order to further evaluate the AVC effect, the global vibration response of the plate is measured and shown in Figure 10. It is clear that the controlled vibration at some non-control positions is greater than the uncontrolled vibration. In addition, the ratio of the closed-loop energy to the open-loop energy is calculated and shown in Equation (19). The controlled mode for AVC is verified to be uncontrollable because the ratio is greater than 1. Referring to Table 3, it can be found that the experimental results of the AVC effect in the (3,3) mode are consistent with the corresponding simulations. This validates the correctness of the theoretical results. As for the difference in Table 3 and Figure 10, it may be caused by the experimental inaccuracies in the boundary conditions of the plate or in the locations of PZT.
γ = 10 0.1 L a i , c 10 0.1 L a i , o = 71.3 39.8 = 1.8

5.3. Controllable Mode: AVC at (1,4) Modal Frequency

The AVC results in the (1,4) mode are shown in Figure 11. When AVC is carried out, the voltage level captured by the PZT sensor is attenuated by 16 dB. Meanwhile, the acceleration level at the same location is reduced by 15 dB. Thus, the active vibration attenuation at the position of the PZT sensor is achieved.
Furthermore, the global vibration response of the plate is captured and shown in Figure 12. The ratio of the closed-loop energy to the open-loop energy is calculated and shown in Equation (20). The overall vibration response of the plate is obviously decreased because the ratio is smaller than 1. Therefore, the (1,4) mode is controllable for AVC using PZT actuators and sensors. Similarly, the results are consistent with corresponding simulation results.
γ = 10 0.1 L a i , c 10 0.1 L a i , o = 2.4 17.4 = 0.1
The experimental results show that AVC is achieved when the specified controllable mode is excited, and fails in the predicated uncontrollable mode.

6. Conclusions

The controllable and uncontrollable modes for PZT actuators and sensors in AVC are discussed in this paper. A criterion is proposed to reveal the main causes of the uncontrollable mode and specify the controllable modes before AVC. On the premise of ensuring stability, several simulations and experiments of AVC are carried out to validate the proposed criterion. It is proved that a satisfactory AVC effect can be achieved on the plate at the controllable modes specified by the proposed criterion. Furthermore, the controllable mode is mainly determined by both the controlled mode and its adjacent mode.
In this paper, the effectiveness of the proposed criterion for the controllable mode is verified in a single-input and single-output AVC system. Similarly, it will be applicable in multi-input and multi-output AVC systems. The proposed criterion will be effective to optimize actuator placements, so as to obtain as many controllable modes as possible. These will be carried out in the future investigations.

Author Contributions

Conceptualization, M.S. and Y.H.; methodology, M.S. and Y.H.; software, Y.H.; validation, Y.H.; formal analysis, Y.H.; investigation, Y.H.; data curation, Y.H. and X.F.; writing—original draft preparation, Y.H.; Writing—review and editing, Y.H. and X.F.; visualization, M.S. and Y.H.; supervision, M.S.; project administration, M.S. All authors have read and agreed to the published version of the manuscript.

Funding

This research was funded by the Natural Science Foundation of Shaanxi Province, China (Grant No. 2021JLM-39).

Institutional Review Board Statement

Not applicable.

Informed Consent Statement

Not applicable.

Data Availability Statement

Numerical data can be available upon request to the Authors.

Conflicts of Interest

The authors declare no conflict of interest.

References

  1. Sivakumar, A.; Chandrasekaran, G.; Cáceres, C.A. Modeling and Active Vibration Suppression of Dynamical Systems: A Survey. J. Sci. Eng. 2016, 7, 50–71. [Google Scholar]
  2. Roberto, C.; Luigi, F. Advances in Vibroacoustics and Aeroacustics of Aerospace and Automotive Systems. Appl. Sci. 2018, 8, 366–370. [Google Scholar]
  3. Yuli, Z.; Xu, W. A Review of Low-Frequency Active Vibration Control of Seat Suspension Systems. Appl. Sci. 2019, 9, 26–33. [Google Scholar]
  4. Zhang, S.-Q.; Zhao, G.-Z.; Rao, M.N.; Schmidt, R.; Yu, Y.-J. A review on modeling techniques of piezoelectric integrated plates and shells. J. Intell. Mater. Syst. Struct. 2019, 30, 1133–1147. [Google Scholar] [CrossRef]
  5. Shivashankar, P.; Gopalakrishnan, S. Review on the use of piezoelectric materials for active vibration, noise, and flow control. SMAS 2020, 29, 053001. [Google Scholar] [CrossRef]
  6. Akira, S.; Kouji, H.; Nobuo, T. Active control of sound transmission through a rectangular panel using point-force actuators and piezoelectric film sensors. JASA 2015, 137, 458–469. [Google Scholar]
  7. Presas, A.; Luo, Y.; Wang, Z.; Valentin, D.; Egusquiza, M. A Review of PZT Patches Applications in Submerged Systems. Sensors 2018, 18, 2251. [Google Scholar] [CrossRef] [Green Version]
  8. Moussa, R.E.; Grossard, M.; Boukallel, M.; Hubert, A.; Chaillet, N. Modeling and control of a piezoelectric microactuator with proprioceptive sensing capabilities. Mechatronics 2014, 24, 590–604. [Google Scholar] [CrossRef] [Green Version]
  9. Abreu, G.L.C.M.; Ribeiro, J.F.; Valder, S.J. Experiments on Optimal Vibration Control of a Flexible Beam Containing Piezoelectric Sensors and Actuators. Shock. Vib. 2003, 10, 283–300. [Google Scholar] [CrossRef]
  10. Shevtsov, S.; Tsahalis, D.; Flek, M.; Samochenko, I. Comparison of active and passive modes of piezoelectric patch actuators for scaled helicopter rotor blade vibration suppression. In Proceedings of the International Conference on Noise & Vibration Engineering, Leuven, Belgium, 20–22 September 2010. [Google Scholar]
  11. Mojtaba, B.; Reza, M.H. Integrated and Consistent Active Control Formulation and Piezotransducer Position Optimization of Plate Structures considering Spillover Effects. Shock. Vib. 2014, 2014, 1–14. [Google Scholar]
  12. Vasques, C.M.A. Improved passive shunt vibration control of smart piezo-elastic beams using modal piezoelectric transducers with shaped electrodes. SMAS 2012, 21, 125003. [Google Scholar] [CrossRef]
  13. Singhal, N.; Sharma, M.; Mangal, S.K. Optimal placement of piezoelectric patches over a smart structure. Integr. Ferroelectr. 2017, 183, 60–90. [Google Scholar] [CrossRef]
  14. Tehrani, M.G.; Mottershead, J.E. An overview of the receptance method in active vibration control. IFAC Proc. Vol. 2012, 45, 1174–1178. [Google Scholar] [CrossRef] [Green Version]
  15. Morris, K.; Yang, S. Comparison of actuator placement criteria for control of structures. JSV 2015, 353, 1–18. [Google Scholar] [CrossRef]
  16. Xue, K.; Igarashi, A.; Kachi, T. Optimal sensor placement for active control of floor vibration considering spillover effect associated with modal filtering. Eng. Struct. 2018, 165, 198–209. [Google Scholar] [CrossRef]
  17. Khan, A.; Kim, H. Active Vibration Control of a Piezo-Bonded Laminated Composite in the Presence of Sensor Partial Debonding and Structural Delaminations. Sensors 2019, 19, 540. [Google Scholar] [CrossRef] [PubMed] [Green Version]
  18. Sharma, P. Vibration Analysis of Functionally Graded Piezoelectric Actuators; Springer: New York, NY, USA, 2019. [Google Scholar]
  19. Li, W.L. Vibration analysis of rectangular plates with general elastic boundary supports. J. Sound Vib. 2004, 273, 619–635. [Google Scholar] [CrossRef]
  20. Moheimani, S.R.; Fleming, A.J. Piezoelectric Transducers for Vibration Control and Damping; Springer Science & Business Media: London, UK, 2006. [Google Scholar]
  21. Giurgiutiu, V.; Zagrai, A.N. Characterization of Piezoelectric Wafer Active Sensors. J. Intell. Mater. Syst. Struct. 2000, 11, 959–976. [Google Scholar] [CrossRef]
  22. Preumont, A. Vibration Control of Active Structures An Introduction, 4th ed.; Springer International Publishing: Dordrecht, The Netherlands, 2018. [Google Scholar]
  23. Georges, D. The use of observability and controllability gramians or functions for optimal sensor and actuator location in finite-dimensional systems. In Proceedings of the 1995 34th IEEE Conference on Decision and Control, New Orleans, LA, USA, 13–15 December 1995; pp. 3319–3324. [Google Scholar]
  24. Huang, B.; Xiao, Y.; Sun, J.; Wei, G. A variable step-sze FXLMS algorithm for narrowband active noise control. IEEE-ACM T AUDIO SPE 2013, 21, 301–312. [Google Scholar] [CrossRef]
  25. Spaggiari, A.; Castagnetti, D.; Golinelli, N.; Dragoni, E.; Mammano, G.S. Smart materials: Properties, design and mechatronic applications. J. Mater. Design Appl. 2019, 233, 734–762. [Google Scholar] [CrossRef]
  26. Guan, Y.H.; Shepard, W.S.; Lim, T.C.; Li, M. Experimental analysis of an active vibration control system for gearboxes. SMAS 2004, 13, 12–30. [Google Scholar] [CrossRef]
  27. Mao, Q.; Pietrzko, S. Control of Noise and Structural Vibration; Springer: London, UK, 2013. [Google Scholar]
  28. Hać, A.; Liu, L. Sensor and actuator location in motion control of flexible structures. JSV 1993, 167, 239–261. [Google Scholar] [CrossRef]
  29. Bayard, D.S.; Hadaegh, F.Y.; Meldrum, D.R. Optimal experiment design for identification of large space structures. Automatica 1988, 24, 357–364. [Google Scholar] [CrossRef]
  30. Sharma, S.; Vig, R.; Kumar, N. Active vibration control: Considering effect of electric field on coefficients of PZT patches. SMAS 2015, 16, 1091–1105. [Google Scholar] [CrossRef]
Figure 1. Schematic diagram of the smart plate.
Applsci 11 05542 g001
Figure 2. Basic charge amplifier for the PZT sensor.
Applsci 11 05542 g002
Figure 3. Schematic diagram of the AVC system.
Applsci 11 05542 g003
Figure 4. Schematic diagram of a typical smart structure.
Applsci 11 05542 g004
Figure 5. (a) Description of the sensing voltage of PZT and the acceleration in a controllable mode; (b) description of the sensing voltage of PZT and the acceleration in an uncontrolled mode.
Applsci 11 05542 g005
Figure 6. Finite-element model for the smart plate.
Applsci 11 05542 g006
Figure 7. Schematic block diagram for measurement and control.
Applsci 11 05542 g007
Figure 8. (a) Description of the experimental set-up; (b) description of the distribution of measuring points.
Applsci 11 05542 g008
Figure 9. Control effect in the (3,3) mode. (a) Description of the sensing voltage of PZT; (b) description of the monitoring acceleration.
Applsci 11 05542 g009
Figure 10. Vibration response of the smart plate in the (3,3) mode. (a) Description of the uncontrolled acceleration level; (b) description of the controlled acceleration level.
Applsci 11 05542 g010
Figure 11. Control effect in the (1,4) mode. (a) Description of the sensing voltage of PZT; (b) description of the monitoring acceleration.
Applsci 11 05542 g011
Figure 12. Vibration response of the smart plate in the (1,4) mode. (a) Description of the uncontrolled acceleration level; (b) description of the controlled acceleration level.
Applsci 11 05542 g012
Table 1. Geometrical and material properties of PZT.
Thickness (m)Piezoelectric Constant (pC/N)Young’s Modulus (GPa)Density (kg/m3)Poisson’s RatioSurface Area (m2)
d31d32d33
0.0011241242807975000.30.04 × 0.04
Table 2. Geometrical and material properties of the plate.
Thickness (m)Young’s Modulus (GPa)Density (kg/m3)Poisson’s RatioSurface Area (m2)
0.00121678000.280.5 × 0.6
Table 3. Demonstration of γ , uncontrolled and controlled vibrations at different modes.
Order γ Uncontrolled Vibration of the PlateControlled Vibration of the Plate
(2,2)7.2 × 10⁻⁴ Applsci 11 05542 i001 Applsci 11 05542 i002
(1,3)3.4 × 10⁻⁴ Applsci 11 05542 i003 Applsci 11 05542 i004
(3,1)1.3 × 10⁻⁷ Applsci 11 05542 i005 Applsci 11 05542 i006
(2,3)2.6 Applsci 11 05542 i007 Applsci 11 05542 i008
(3,2)2.9 × 10⁻⁵ Applsci 11 05542 i009 Applsci 11 05542 i010
(1,4)4.0 × 10⁻⁷ Applsci 11 05542 i011 Applsci 11 05542 i012
(3,3)1.1 Applsci 11 05542 i013 Applsci 11 05542 i014
(4,1)1.3 × 10⁻⁷ Applsci 11 05542 i015 Applsci 11 05542 i016
(4,2)9.7 × 10⁻⁴ Applsci 11 05542 i017 Applsci 11 05542 i018
(3,4)1.4 Applsci 11 05542 i019 Applsci 11 05542 i020
(2,4)7.6 × 10⁻³ Applsci 11 05542 i021 Applsci 11 05542 i022
(4,4)1.9 × 10⁻³ Applsci 11 05542 i023 Applsci 11 05542 i024
(5,2)1.9 × 10⁻⁵ Applsci 11 05542 i025 Applsci 11 05542 i026
(3,6)1.3 Applsci 11 05542 i027 Applsci 11 05542 i028
(5,4)4.5 × 10⁻⁴ Applsci 11 05542 i029 Applsci 11 05542 i030
(6,1)4.8 × 10⁻⁸ Applsci 11 05542 i031 Applsci 11 05542 i032
Table 4. Lists of γ and related modal strain ratios at the positions of the actuator and the sensor.
Order γ υ a υ s
(2,3)2.64.83.3
(3,3)1.11.81.8
(3,4)1.43.71.5
(3,6)1.35.91.7
Publisher’s Note: MDPI stays neutral with regard to jurisdictional claims in published maps and institutional affiliations.

