Article

Analysis of Compound Stained Cervical Cell Images Using Multi-Spectral Imaging

Electronic Information School, Wuhan University, Wuhan 430072, China
*
Author to whom correspondence should be addressed.
Appl. Sci. 2021, 11(12), 5628; https://doi.org/10.3390/app11125628
Submission received: 21 April 2021 / Revised: 5 June 2021 / Accepted: 15 June 2021 / Published: 18 June 2021
(This article belongs to the Topic Medical Image Analysis)

Abstract

:
Multi-spectral imaging technique plays an important role in real-world applications such as medicine and medical detections. This paper proposes a cervical cancer cell screening method to simultaneously adopt TBS classification and DNA quantitative analysis for a single cell smear. Through using compound staining on a smear, the cytoplasm is stained by Papanicolauo and the nucleus is stained by Feulgen. The main evaluation parameter is the DNA content of the nucleus, not the subjective description of cell morphology, which is more objective than the TBS classification method and reduces the chances of missing a diagnosis due to subjective factors. Each nucleus has its own DI value and color image of the whole cell, which is convenient for doctors as it allows them to review and confirm the morphology of cells with a nucleus DI of over 2.5. Mouse liver smears and cervical cases are utilized as the measuring specimens to evaluate the performance of the microscope multi-spectral imaging system; illustrative results demonstrate that the proposed system qualifies, with high accuracy and reliability, and further presents wide application prospects in the early diagnosis of cervical cancer.

1. Introduction

Cervical cancer is one of the most common gynecological malignant tumors all over the world, especially in developing countries [1,2,3]. However, in developed countries, cervical cancer cases have been significantly reduced; this is mainly attributed to developed countries having implemented effective cervical cancer screening programs [4,5].
Several methods have been investigated for cervical cancer screening. The Bethesda system (TBS) classification and cellular DNA quantitative analysis are common screening methods for cervical cancer [6,7]. Cytology-based screening has not been effective; therefore, other methods, such as HPV DNA testing, are increasingly being evaluated [8]. Cellular DNA quantitative analysis is an objective method of interpreting the cytopathic changes in cervical cells [9,10]. Due to the superiority of screening for precancerous lesions, this technique could detect abnormalities before the morphology of cells is significantly changed [11,12]. Studies have found that women screened for cervical cancer at least once in their lifetime using HPV DNA testing significantly reduce their risk of developing advanced cervical cancers and cervical-cancer-related deaths [13,14].
There are some obstacles to implementing DNA quantitative analysis for cervical cancer screening in developing countries, such as cost, lack of infrastructure and concerns about health care workers’ attitudes [15,16]. An effective screening method is crucial for overcoming the lack of pathological resources related to cervical cancer screening in developing countries [17]. Research into cost-effective cervical cancer screening methods that involve the minimal number of clinic visits are urgently needed [18].
Multi-spectral imaging (MSI) is the technique of capturing the image data of samples within more than one wavelength; it has been widely applied in various fields such as medicine, environmental science, conservation of works of art, food, and biology [19,20,21,22]. For medical detection, multi-spectral imaging has mainly been employed to analyze hidden diseases in specimens such as cells and tissues. In this regard, Jakovels and Spigulis used the MSI technique to measure three chromophores of the skin in the spectral range of from 500 nm to 700 nm. Experimental results showed that MSI has high sensitivity and stability in this spectral range [23]. Basiri et al. designed a multi-spectral camera to acquire 18 wavelength-sensitive images in a single snapshot and utilized them in order to study the characterization of skin chromophores [24]. Crane et al. injected a specific mixture of fluorescent substances into the cervix of 10 patients with early cervical cancer, and fluorescent signals were detected in the lymph nodes of six patients by a real-time fluorescence spectral imaging system [25].
In general, TBS classification and cellular DNA quantitative analysis are performed separately on two different smears. It is difficult to carry out morphological analysis and DNA ploidy analysis of one cell at the same time. The compound staining method can reach the efficacy of simultaneously using the above two screening methods on the same smear [26]. In the compound-stained smears, the cytoplasm of cells is Papanicolauo-stained and the nuclei are Feulgen-stained, which leads to interference in DNA absorbance. To solve the above-mentioned issue, an absorbance-unmixing model is utilized in this study. Doctors are, therefore, able to acquire colored images of cells and the DNA index of the nucleus for each cell. This improvement can provide the possibility for doctors to perform morphological analysis and DNA ploidy analysis of cells simultaneously and efficiently, which leads to a positive effect on the accuracy of diagnosis. In this study, compared with a color camera of the same pixel size and area, each pixel from our solution could represent a different color band after using a designed interpolation algorithm to calculate the spectral image of multiple color channels. As a result, the monochrome camera collects the multi-spectral scheme, and the pixel accuracy is about three times higher than that of the color camera. In this context, our proposed method can collect a finer absorption spectrum under the same conditions. As a result, the DNA index calculated by multi-spectral color stripping becomes more accurate.
The remainder of this article is organized as follows: Section 2 describes the design and principle of a microscopic multi-spectral imaging system as well as a multi-spectral absorbance-unmixing model, followed by detailed experiments and results in Section 3. Finally, Section 4 concludes this paper.

2. Design and Principle

2.1. Design of Microscopic Multi-Spectral Imaging System

The overall structural design of the microscopic multi-spectral imaging system is shown in Figure 1. It mainly consists of the automatic microscope, imaging system and LED-composite light source.
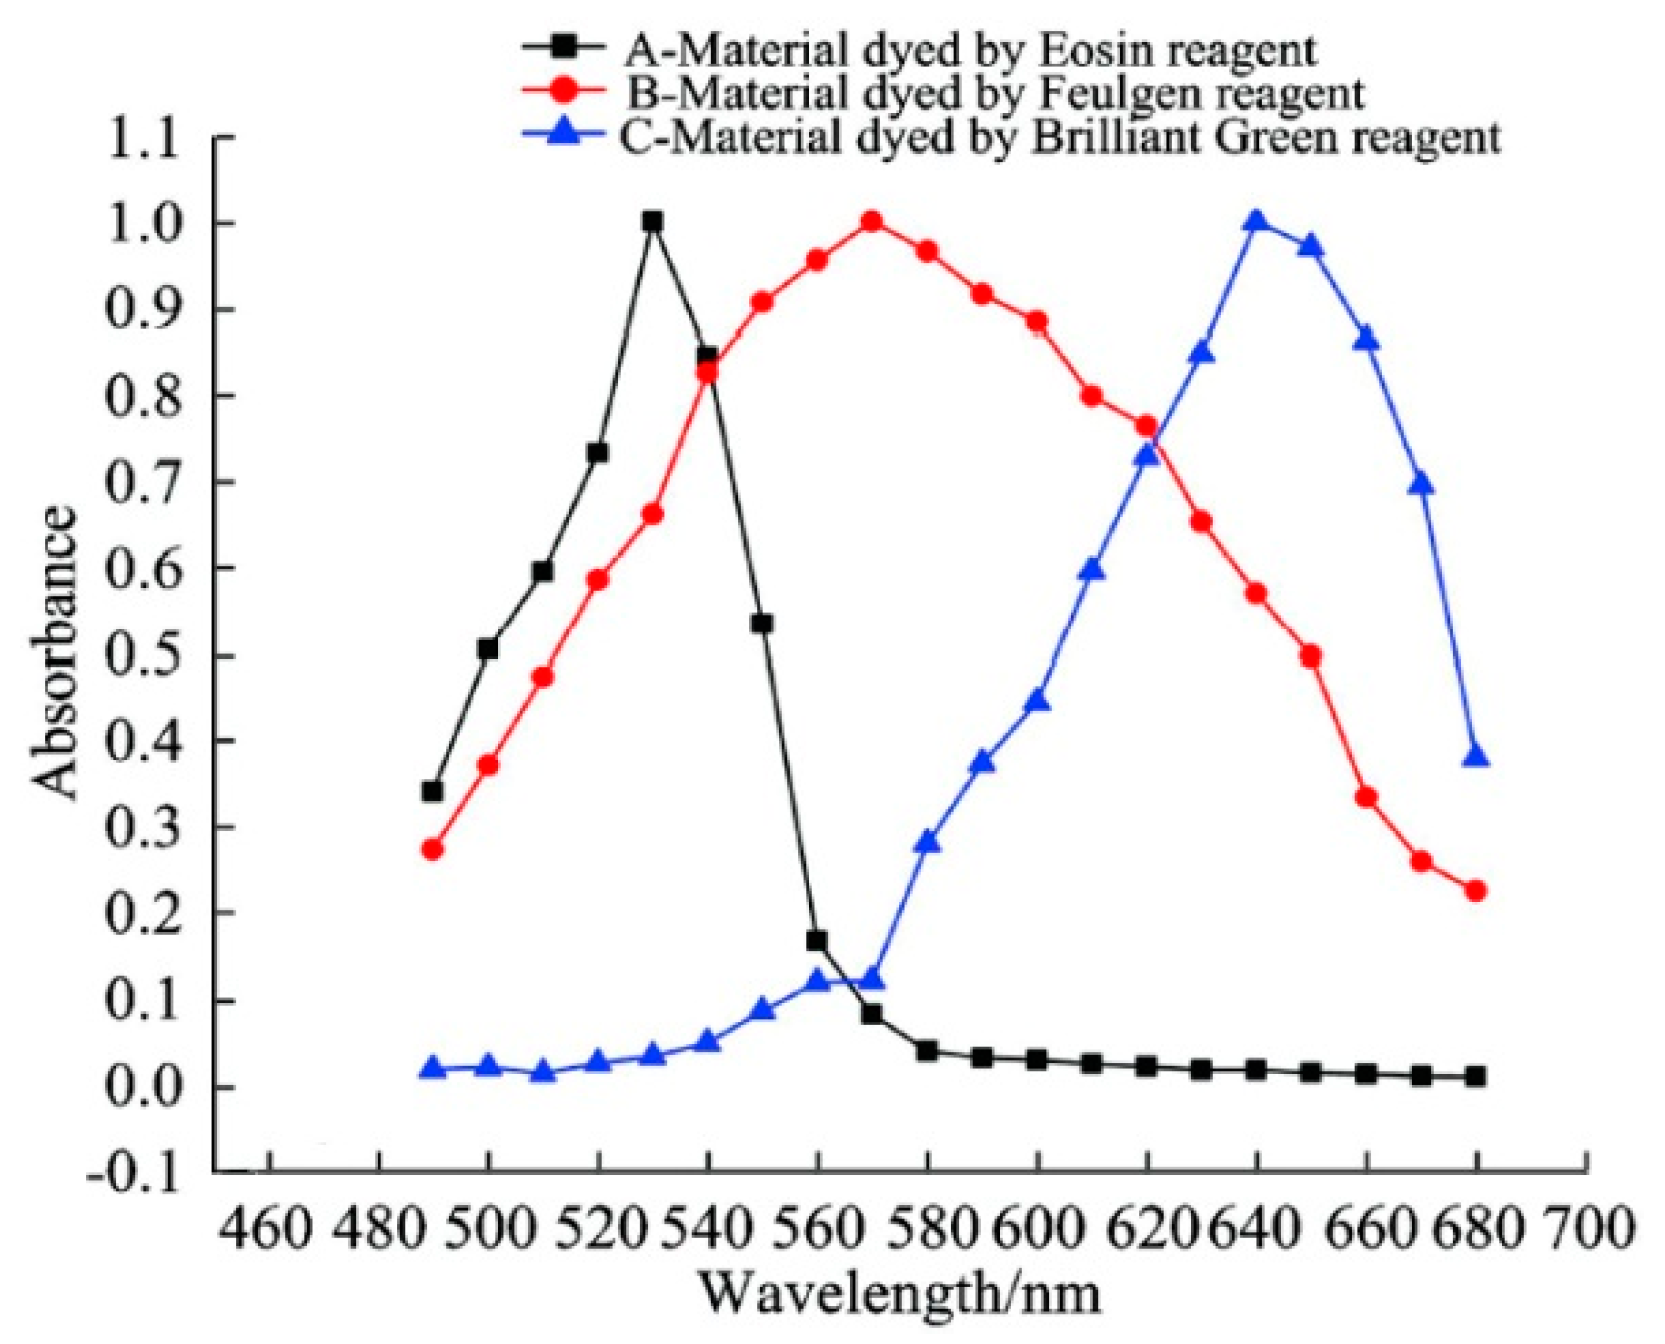
The automatic microscope is the Olympus BX41, which we transformed in this system. Through being driven by a screw mandrel and three stepping motors instead of manual operation, the microscope stage was reconstructed for automatization. An optoelectronic switch was installed at the edge of the microscope stage for automatic locating to the origin. These transformations realized the automatic focusing and scanning of cervical smears. The bright-green absorption is the largest under the 620 nm band, the Fulgen absorption is the largest under the 570 nm band, while the eosin absorption is the largest under the 520 nm band. In light of this, the coefficient of Forggen peeling under a specific light source can be calculated according to the curve.
The original illumination source of the microscope was replaced by a set of combined LED light sources. The wavelength accuracy of these LEDs is 5 nm. Light source 1 consists of three different wavebands of LEDs, the central wavelength of them being 620 nm (red), 520 nm (green), and 460 nm (blue); these three colors are easy to utilize for color imaging, and light source 2, emitting monochromatic light at 570 nm, can improve the accuracy of DNA quantitative analysis.

2.2. Multi-Spectral Absorbance Unmixing Model

There are three kinds of absorbent materials in the compound-stained cervical smears of this system; Figure 2 shows their absorbance curves in the spectral range of from 460 nm to 700 nm [27]. Traditional DNA quantitative analysis generally uses a wavelength of 570 nm because it is performed on Feulgen-stained specimens [28,29]. As shown in Figure 2, there are spectral overlaps of these absorbent materials in all spectral wavebands in the compound staining method. Therefore, the DNA content of cells cannot be measured directly.
By the linear superposition character of absorbance, if there are n kinds of absorbent materials in the specimen, the total absorbance of the specimen is:
A t o t a l = i = 1 n A i λ = i = 1 n ε i λ b c i
where A t o t a l represents the total absorbance of the light-receiving medium. A i λ is the absorbance of each component in the medium, c i is the concentration vector of the dyeing substance, and ε i λ b is the spectral characteristic of the dyeing substance.
If there are monochromatic lights with wavelengths of λ 1 , λ 2 , …, λ m in the system, the equation above can be described as:
{ A λ 1 = i = 1 n A i λ 1 = i = 1 n ε i λ 1 b c i A λ 2 = i = 1 n A i λ 2 = i = 1 n ε i λ 2 b c i A λ m = i = 1 n A i λ m = i = 1 n ε i λ m b c i
Equation (2) can be expressed by the matrix as follows:
A = X × C
In Equation (3), A = [ A λ 1 , A λ 2 , ,   A λ m ] T is the absorbance vector, X = [ X 1 , X 2 , , X n ] is the feature Matrix where X i = [ ε i λ 1 , ε i λ 2 , , ε i λ m ] is the feature vector, i = 1 ,   2 , ,   n , and C = [ c 1 ,   c 2 , , c n ] T is the concentration vector of the absorbent materials in the specimen. By using the multiple linear regression method, the least square solution of the concentration vector is:
C = ( X T × X ) 1 × X T × A
From the absorbance curves, the matrix X in Equation (3) can be obtained through collecting the absorbance image ( A λ ) based on the microscopic multi-spectral imaging system. Then, the concentration of each absorbent material can be calculated by Equation (4).
Four color bands are adopted for imaging analysis in this study. To be specific, the band of red color is 620 nm (central wavelength) ± 2.5 nm (half width), while the band values of green color, blue color, and yellow color are 520 nm ± 2.5 nm, 460 nm ± 2.5 nm, and 570 nm ± 8 nm, respectively. Fulgan presents the largest absorption in the 570 nm band, while eosin and brilliant green have a small amount of absorption. After subtracting the absorption values of eosin and bright aluminum from the absorption values of 570 nm, the absorption value of Forggen is obtained, which can be adopted to calculate the accurate DNA index.

3. Experiments and Results

3.1. Pseudo-Color Image Synthesizing and Absorbance Unmixing

The process of multi-spectral imaging is as follows: (1) Turn off the light source and obtain an image of the dark background. The dark background image contains the dark-current noise and the response of ambient light of the CMOS camera. (2) Place a blank slide on the microscope stage, turn on the light sources and switch the four LEDs, obtain multi-spectral images of blank background. (3) Replace the blank slide with a cervical smear, control the light source as mentioned above and obtain multi-spectral images of the cervical cells.
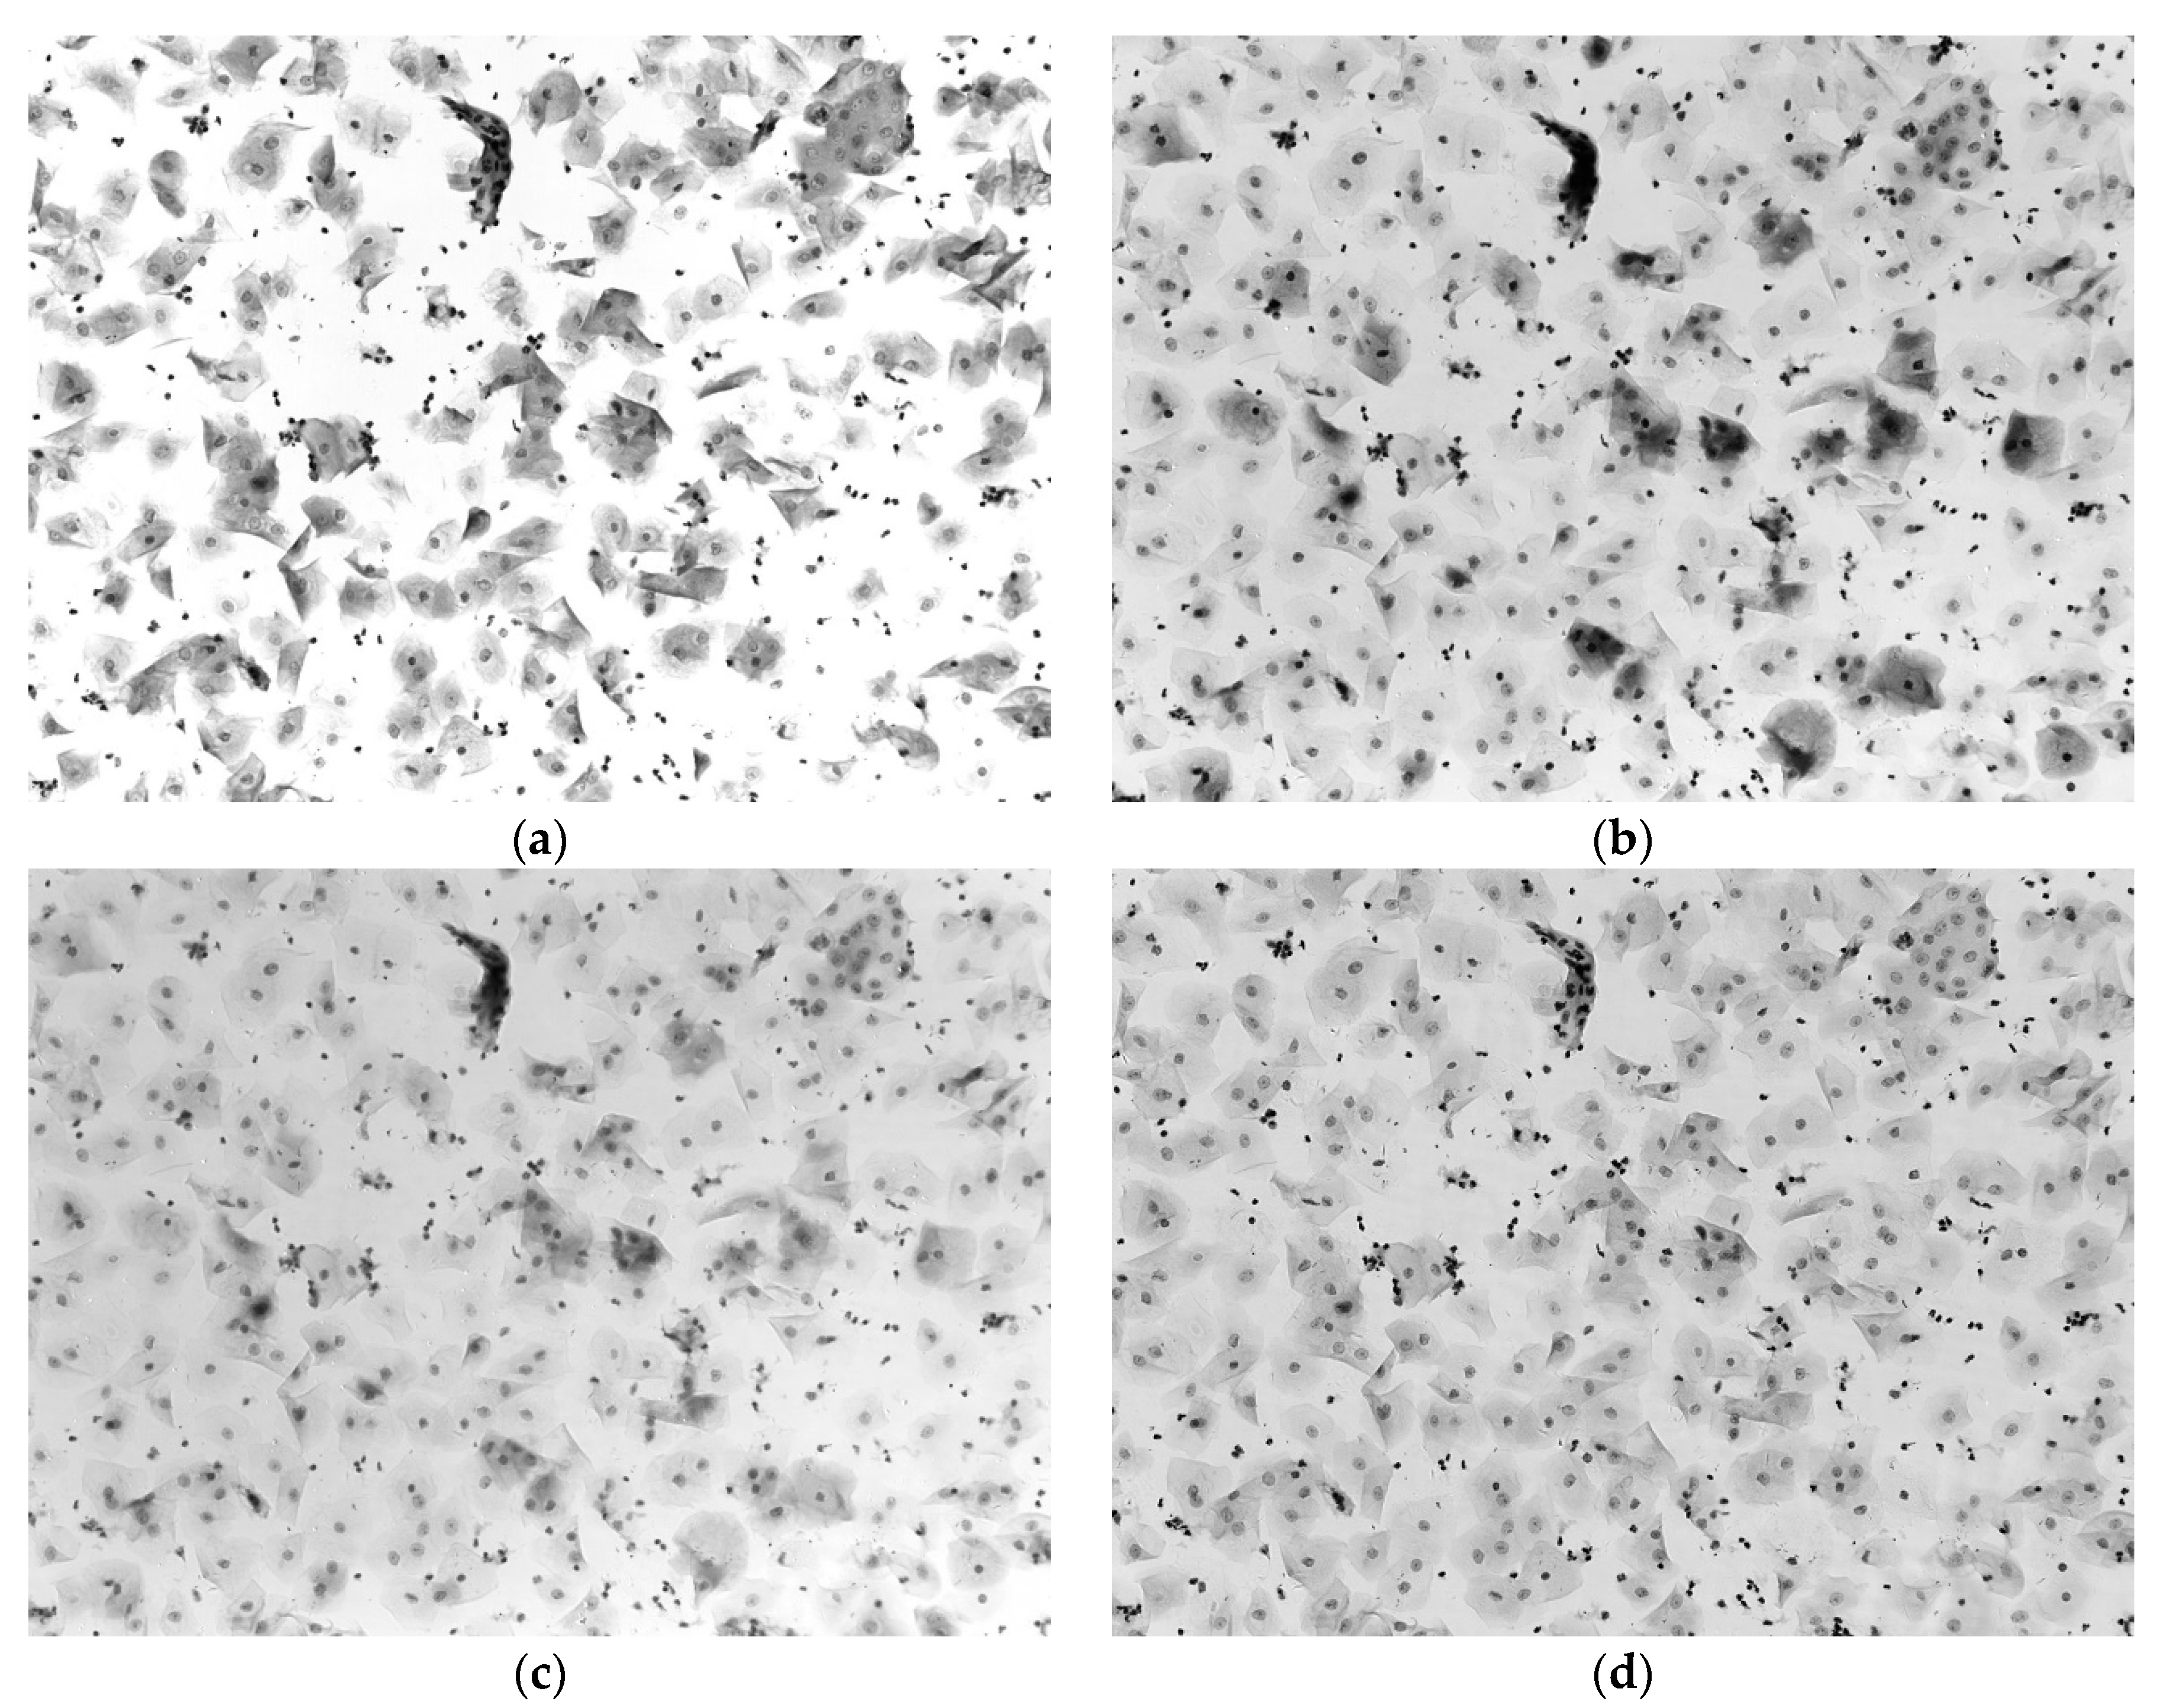
Figure 3 shows the original images of the compound-stained cervical smear in monochromatic lights with the wavelengths of 620 nm, 520 nm, 460 nm and 570 nm. It can be observed that the problem of DNA absorbance interference caused by compound staining is serious. The cytoplasmic background in Figure 3 will affect the image processing. It is not feasible to carry out DNA quantitative analysis by using the original image. In our study, the proposed system adopts a grayscale camera (monochrome camera), which captures the image under a single band and then performs the peeling calculation. The grayscale change value is 0–255, and the pixel area is 2592 × 1944 pixels.
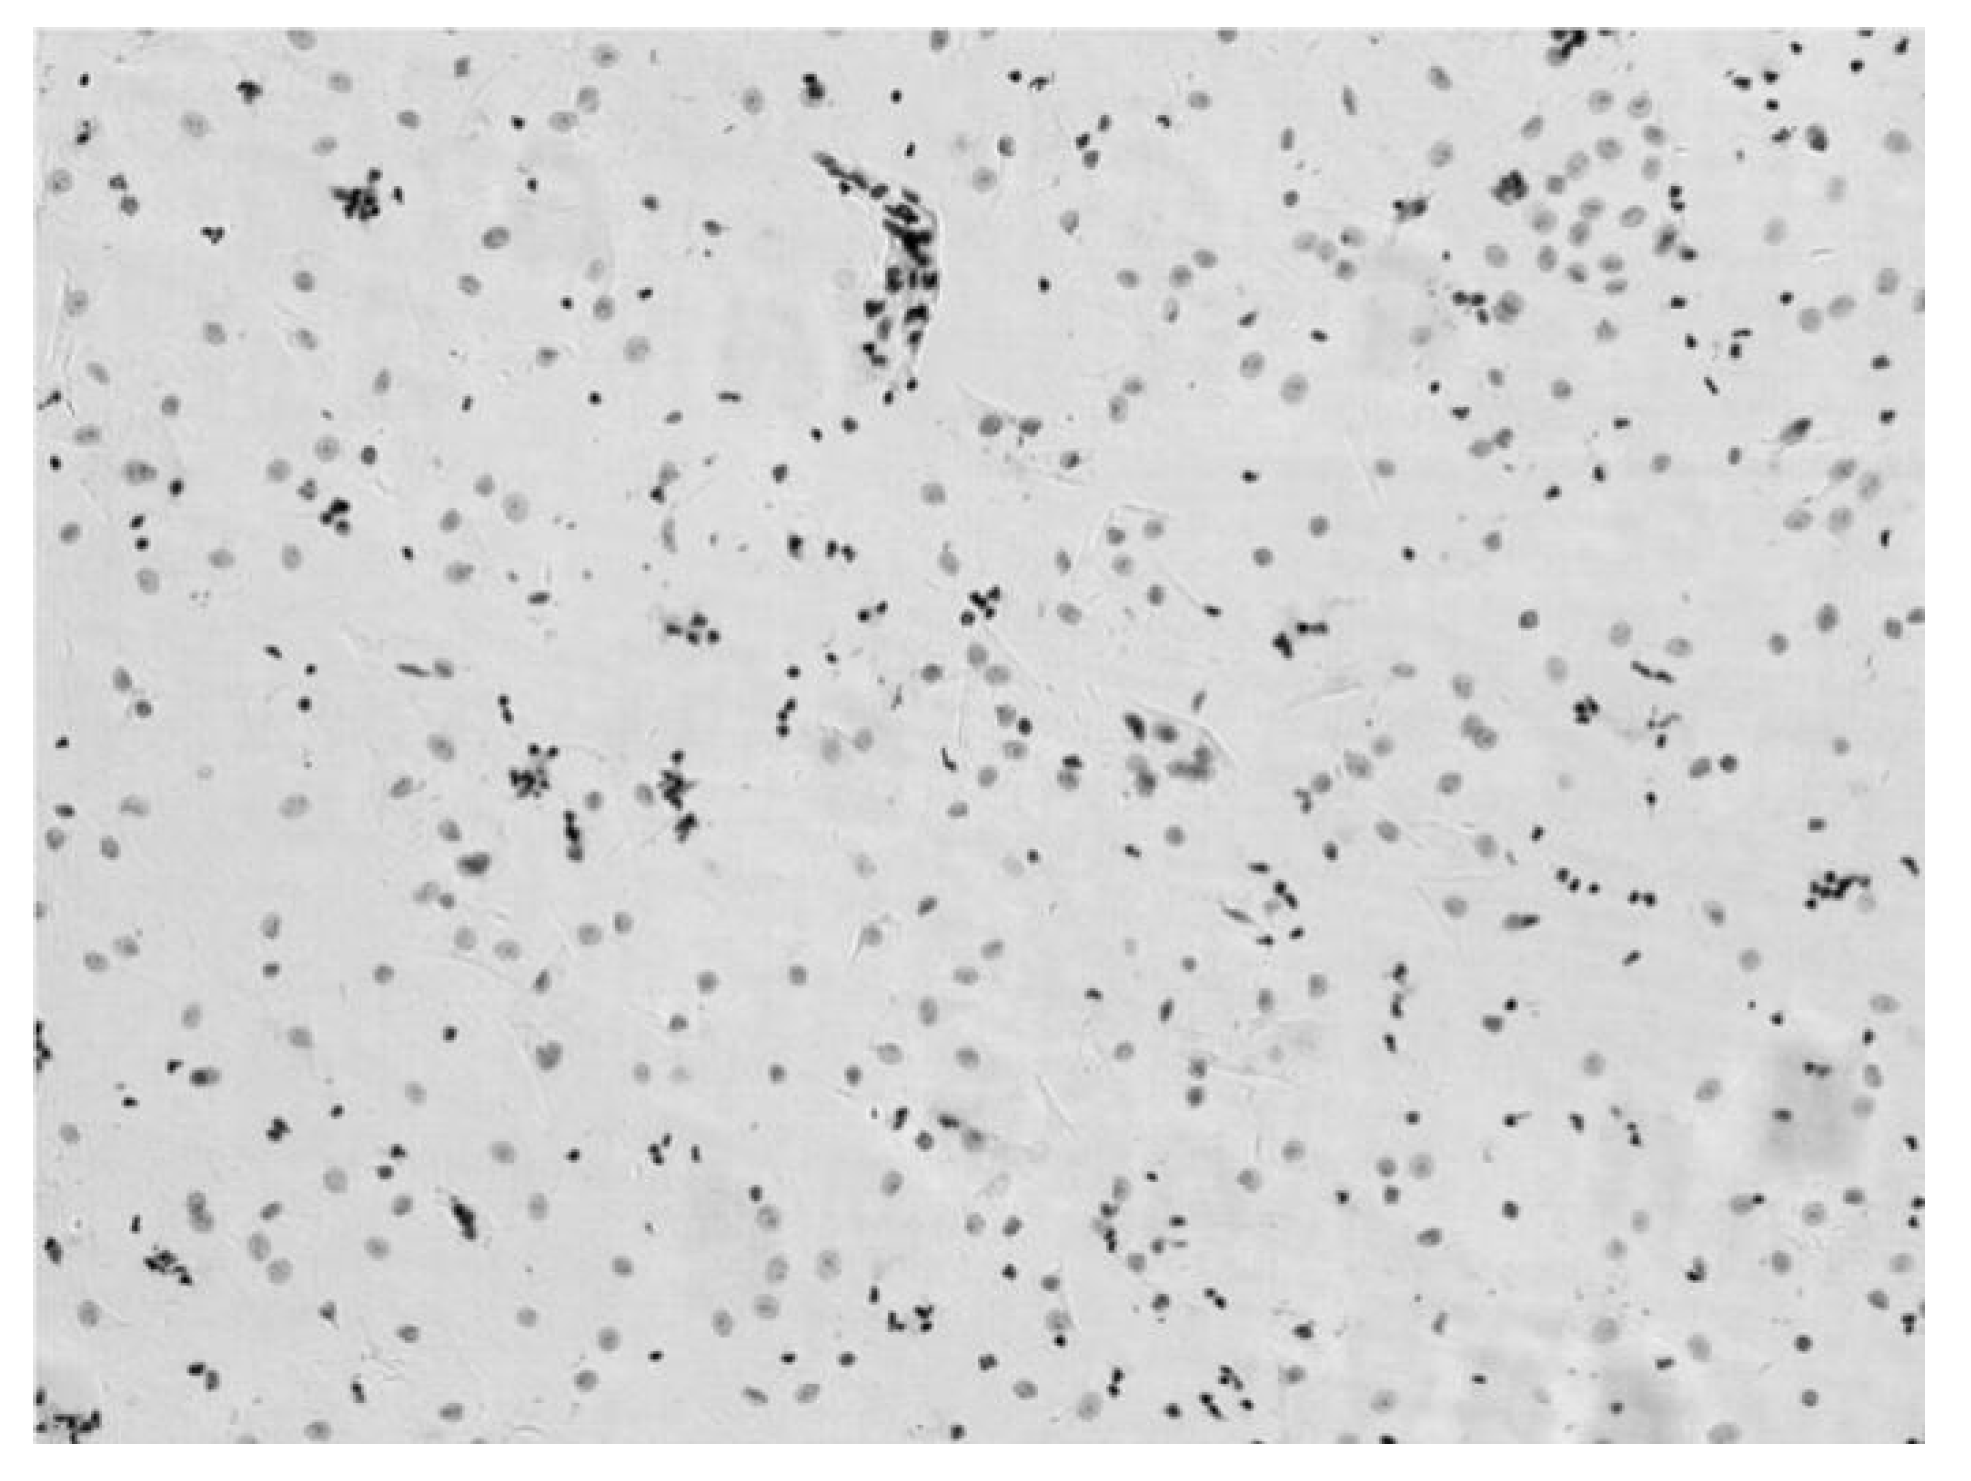
Figure 4 is the image after absorbance unmixing. It can be seen that the image of the cytoplasm has been removed; only the clear nuclei can be seen after the absorbance unmixing, which could be effective for a personal computer (PC) to conduct quantitative DNA analysis. This image reflects the true absorbance of DNA at a wavelength of 570 nm.
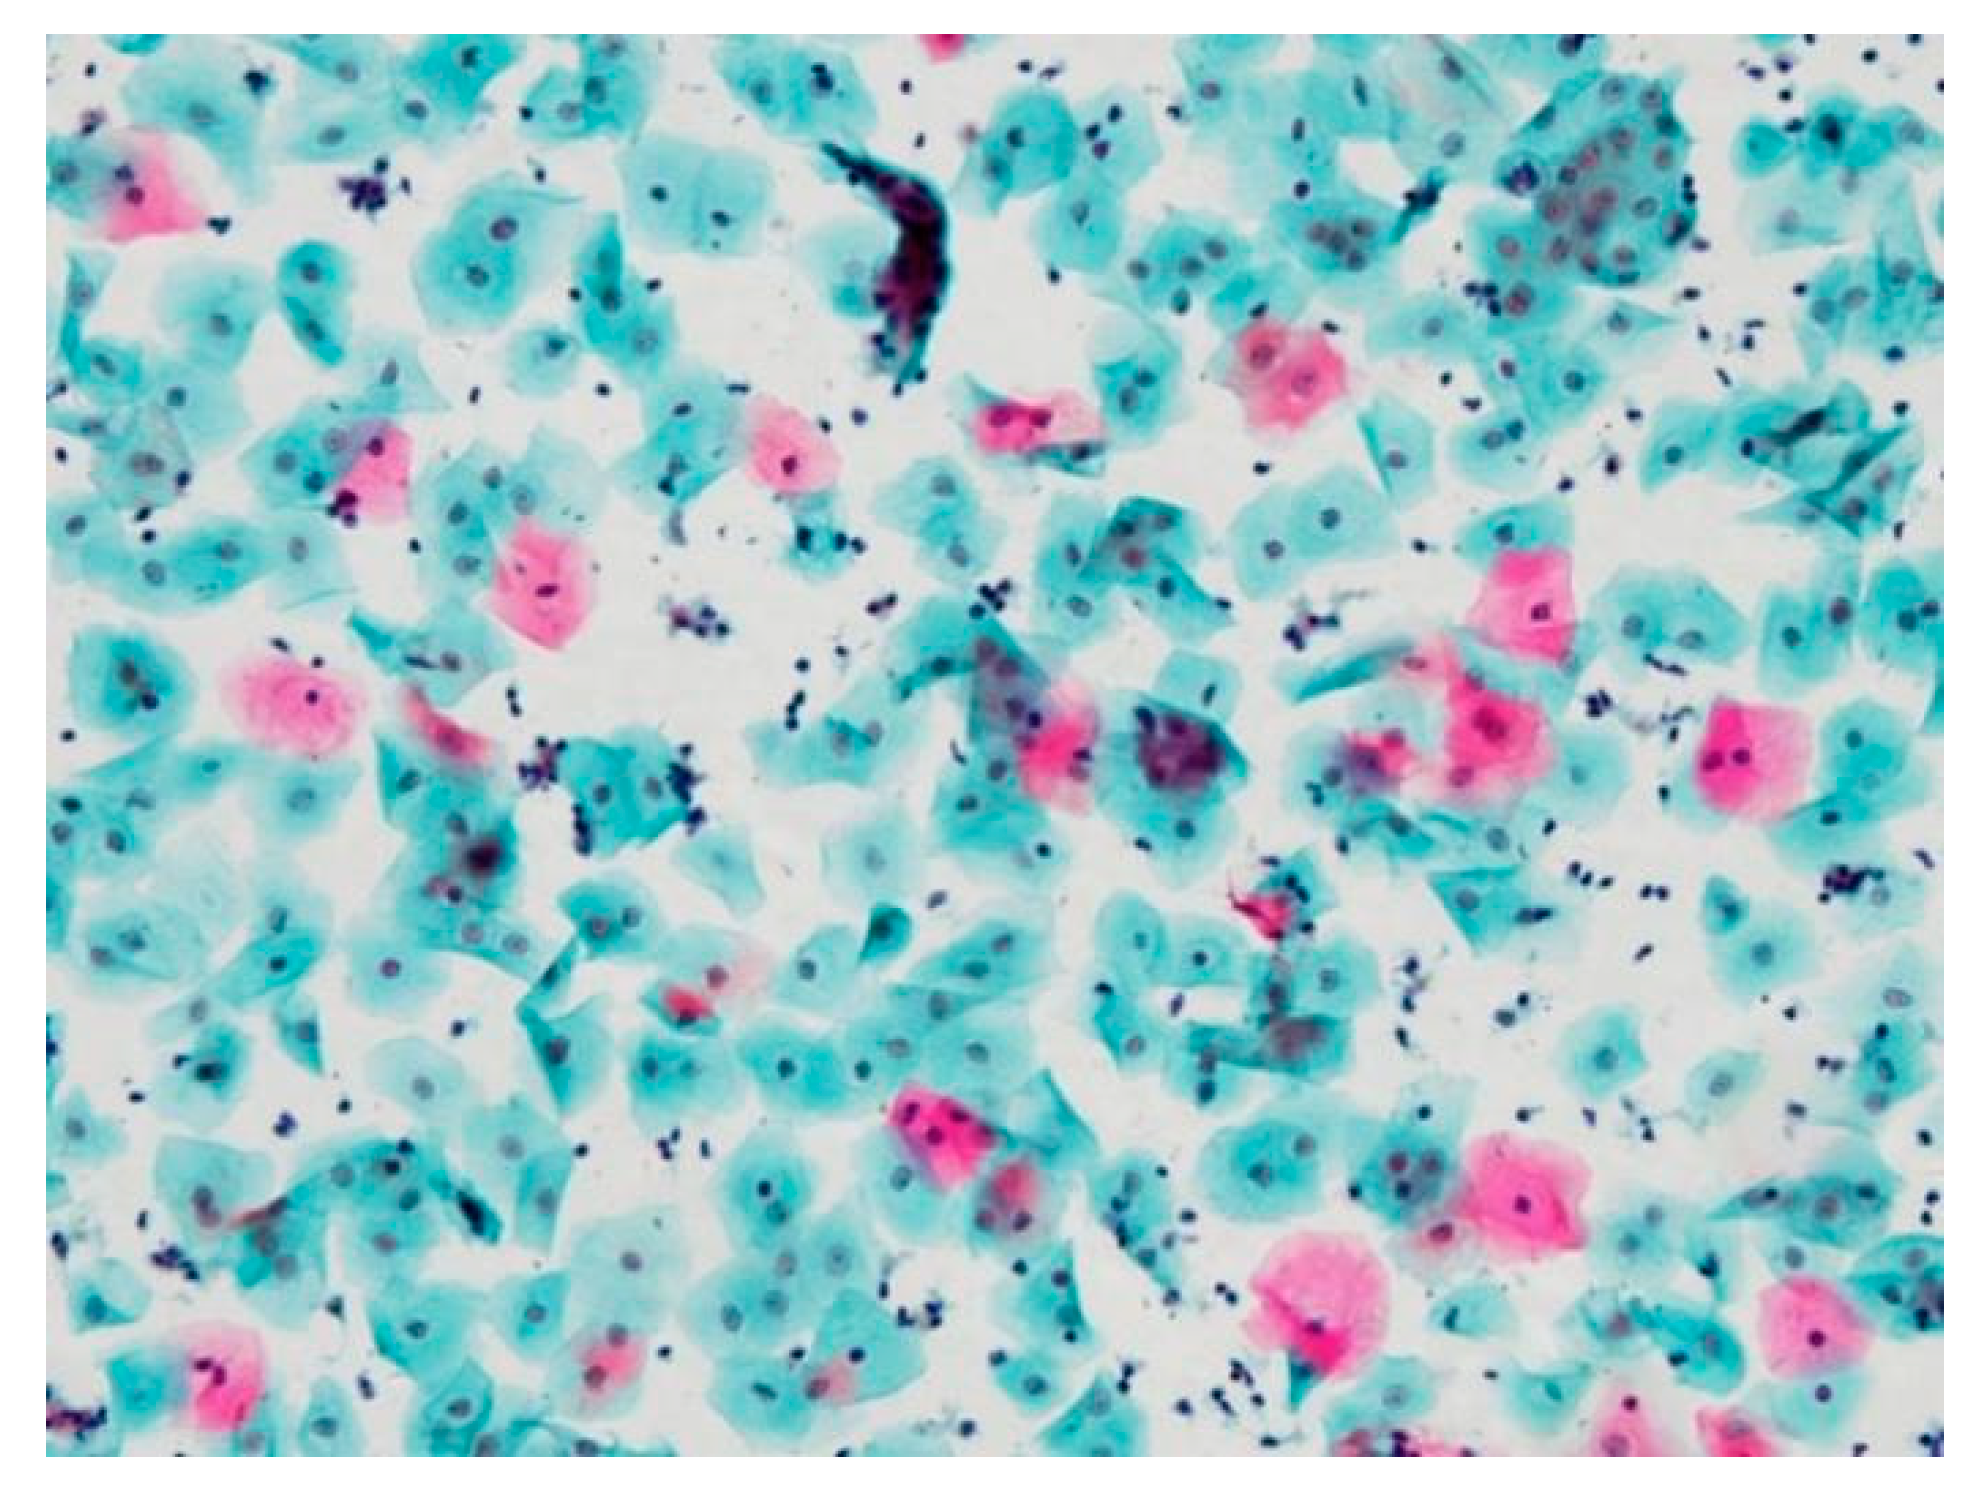
Figure 5 is the pseudo-color image synthesized by using the original images of lights with the wavelengths of 620 nm, 520 nm and 460 nm. Through first collecting the image’s gray value of each direct light source (no slide), the pseudo-color image could be synthesized after calculating each band’s weight, based on the absorbance-unmixing model, as expressed in Equation (4).
It can be observed that the color of this image is bright, the nuclei in the image are clearly visible and the edge of the cytoplasm is explicit. The pseudo-color image was sent to pathological doctors who, after reviewing, concluded that, compared with Papanicolaou smear, there was no significant difference in the background and color of the cytoplasm; the color of nuclei in the pseudo-color image was darker because the nuclei in this smear were Fuelgen-stained. However, this would not cause an interference or be an obstacle to TBS classification.
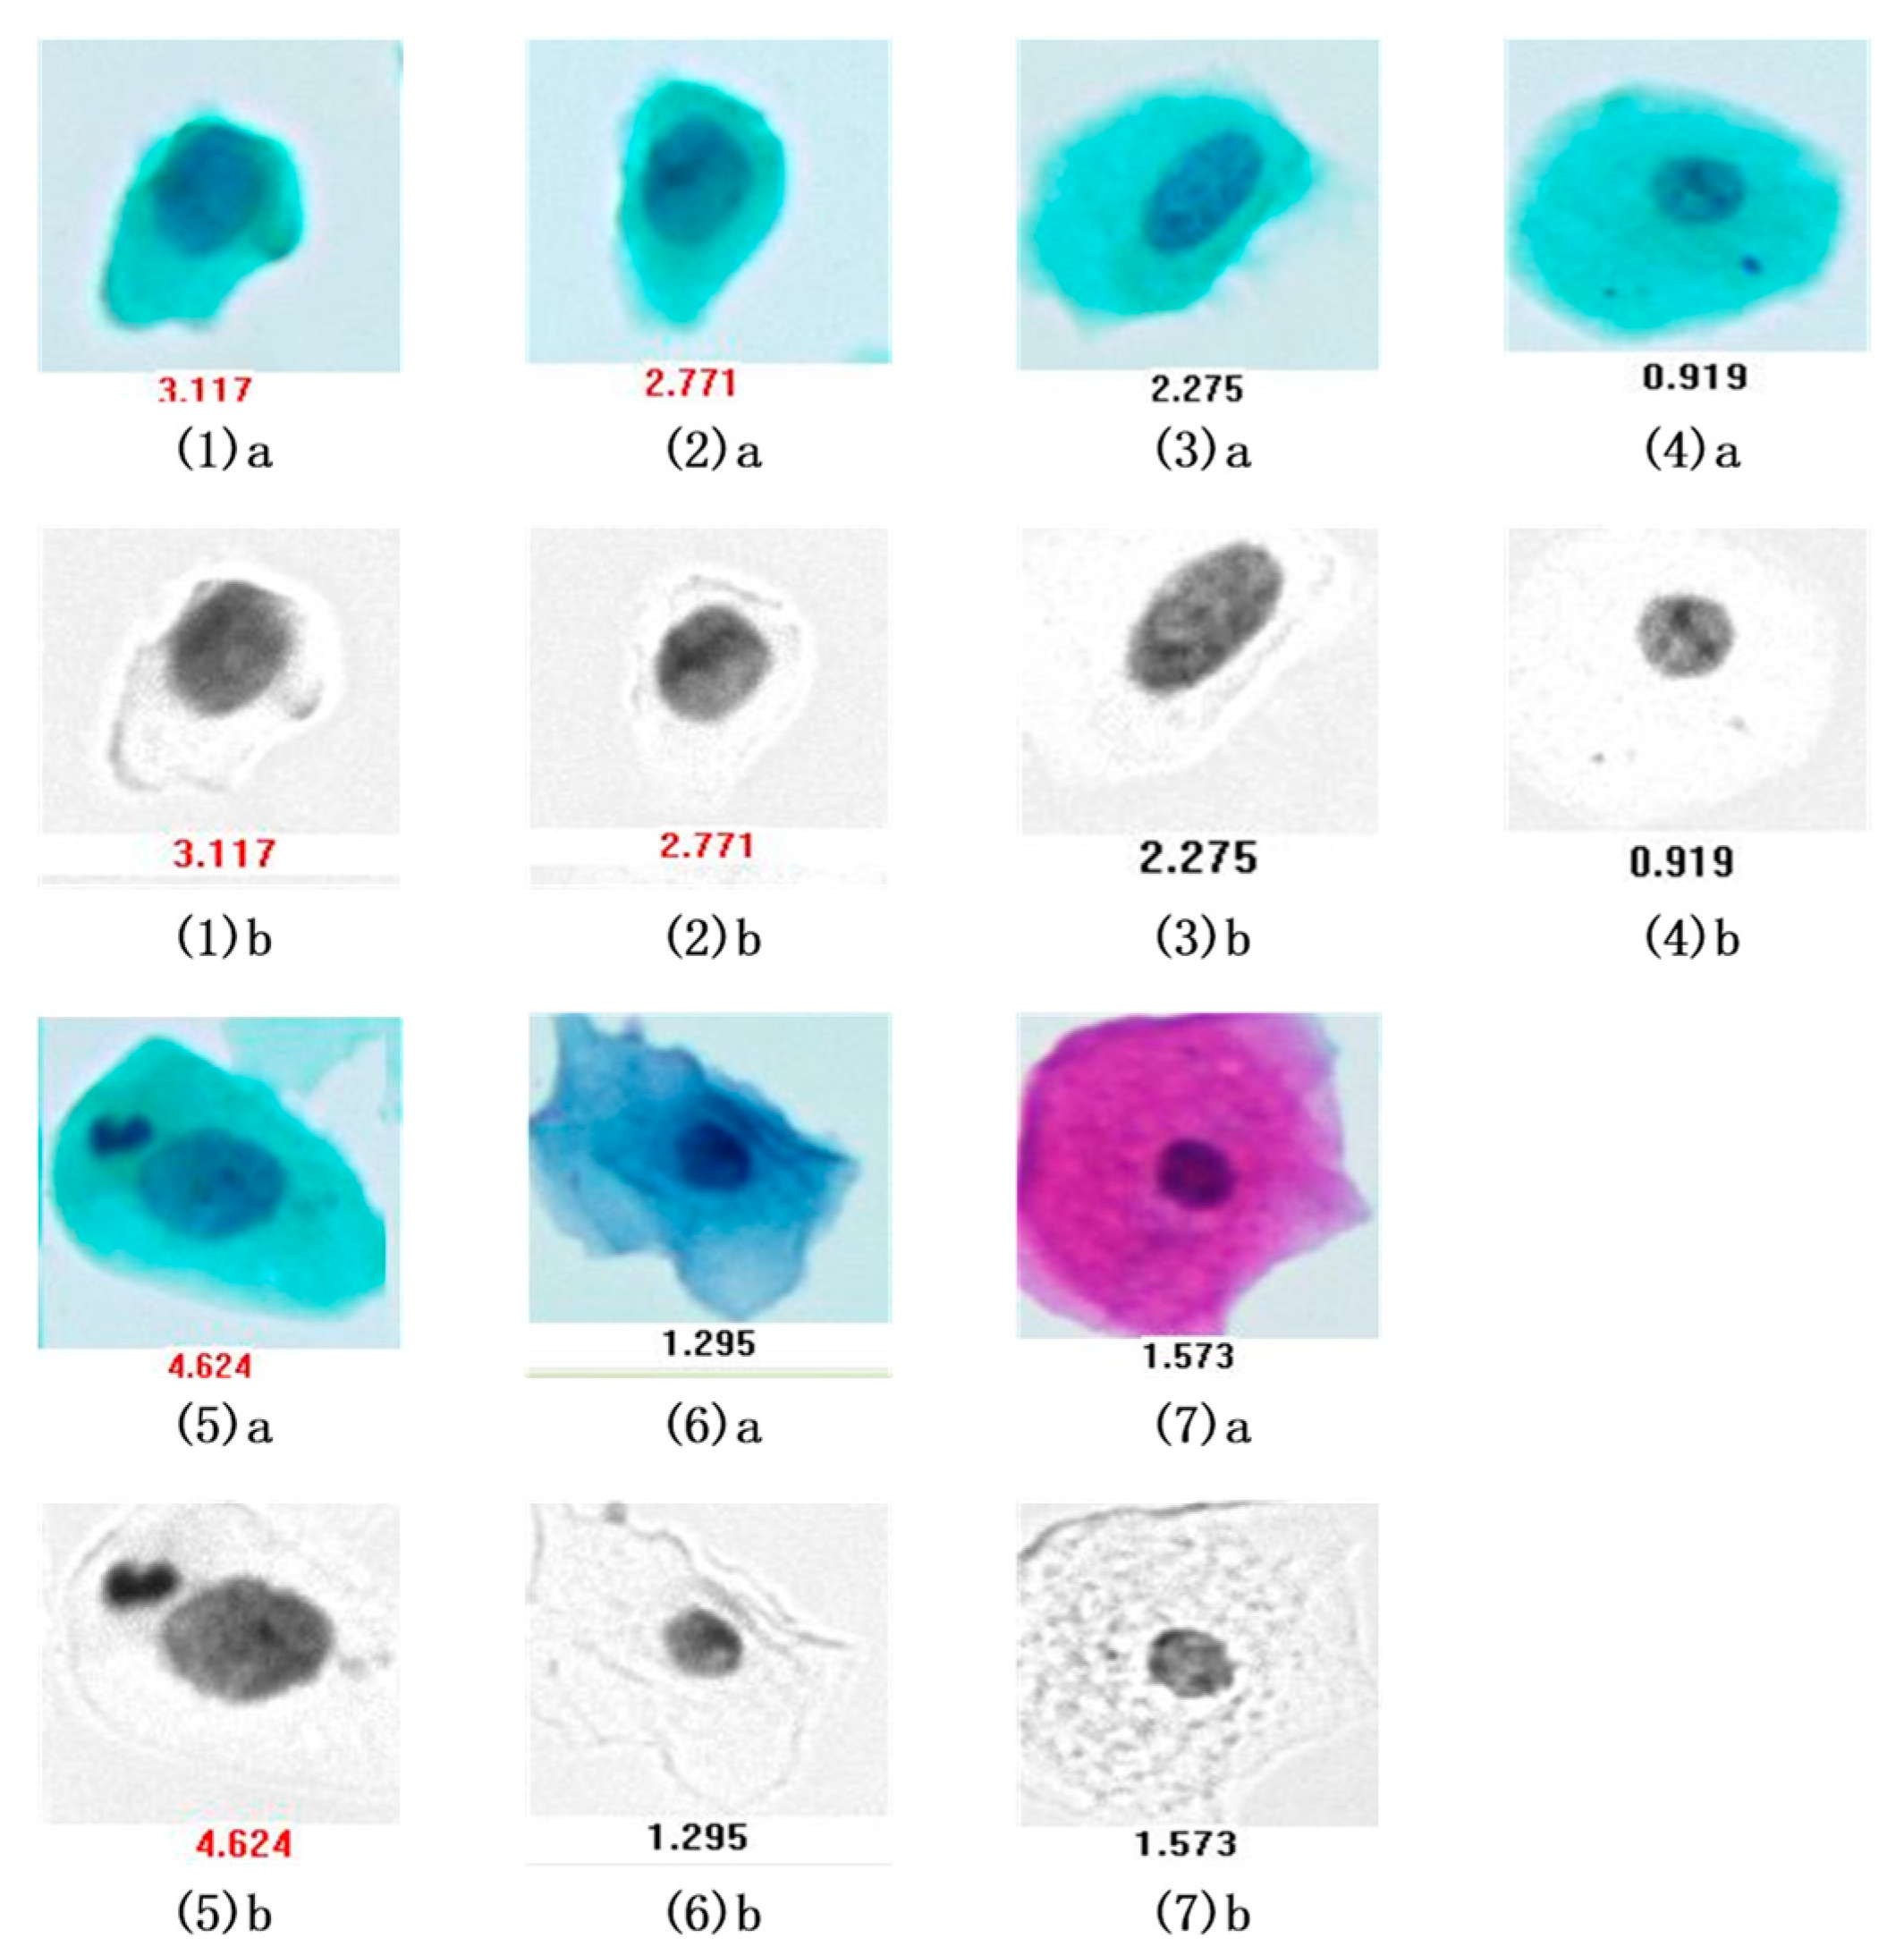
The microspectral images used to reflect absorbance-unmixing results are illustrated in Figure 6. Figure 6(1a–7a) shows the images of co-stained cytoplasms and nuclei, while Figure 6(1b–7b) shows the grayscale images of cell nuclei after absorbance unmixing. The value under each figure is the corresponding DI index of the cell. It can be seen that the morphology of the entire cell is clear, providing a promising way to analyze the relative size of the cytoplasm and the nucleus. According to the observed grayscale images, the DNA content could be further analyzed through using the nucleus after unmixing. DNA content in the image represents the integrated optical density. The DNA index is obtained through using the ratio of the integrated optical density of a single cell to the reference integrated optical density. It should be known that DNA index is a significant indicator for representing the content of the cell nucleus, further representing the number of ploidy in the process of cell proliferation, and reflecting the CV of nuclear content in the process of cell classification.

3.2. Verification Test of DNA Quantitative Analysis

The coexistence of polyploidy nuclei, such as diploid(2c), tetraploid(4c), octoploid(8c), etc., is a significant characteristic of hepatocyte; therefore, the performance of DNA quantitative analysis by this multi-spectral imaging system can be evaluated by examining whether the measured DNA index accords with the polyploid features of hepatocyte.
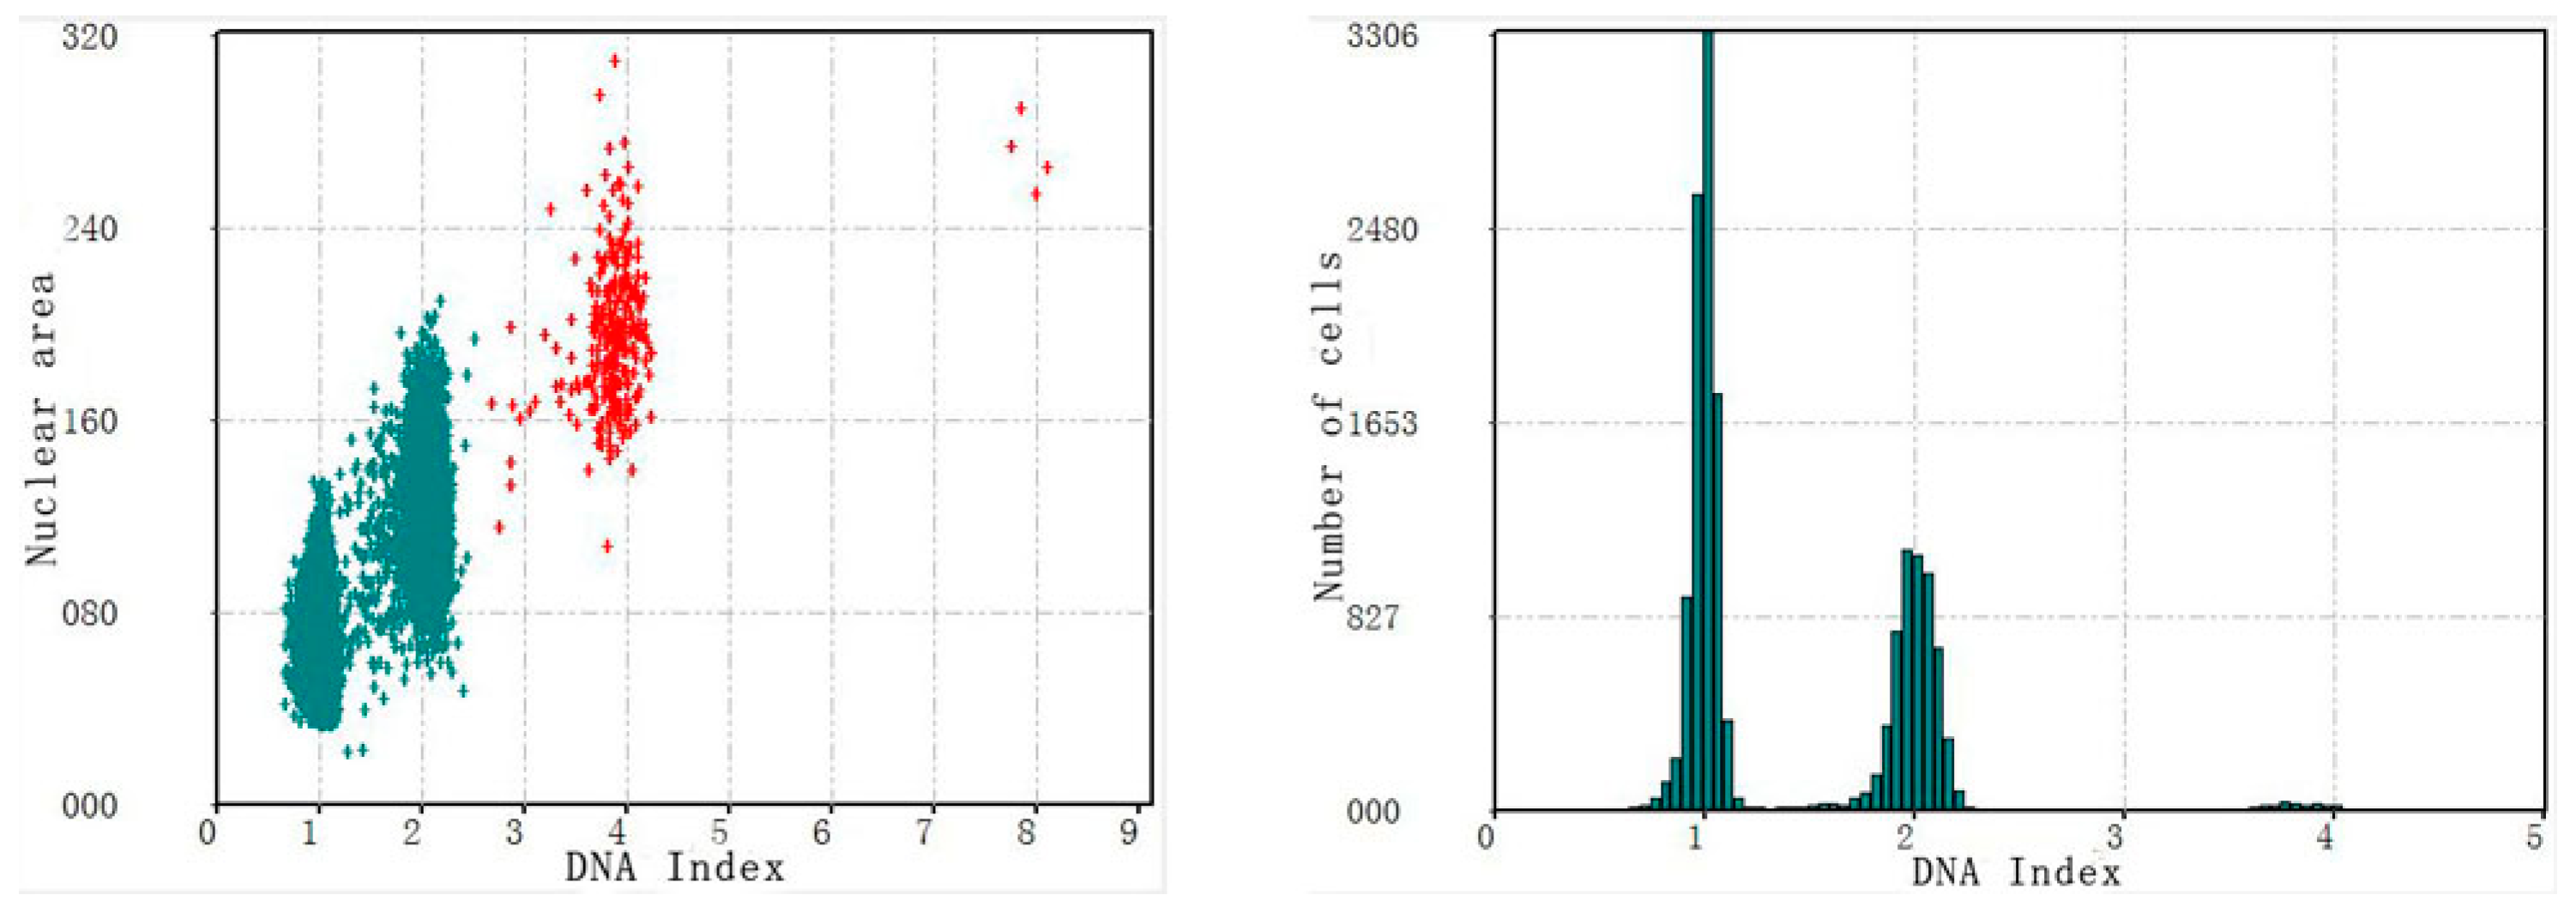
A Feulgen-stained mouse liver smear was examined by the multi-spectral imaging system. Figure 7 is the scatter plot and histogram of measured DNA indices of mouse hepatocytes. In the scatter plot, each point represents a cell, and it can be noticed that the measured cells are essentially distributed where the DNA index is 1, 2 and 4; there are obvious 2c, 4c and 8c cell peaks in the histogram. It is proved that the DNA indices of measured cells are consistent with the polyploidy characteristics of hepatocytes; the results are, therefore, accurate.

3.3. The Performance of Cervical Cell Screening

Twenty cervical cases from the Maternal and Child Health Hospital of Hubei Province were analyzed. Two cervical smears were made for each case: one smear was Fuelgen-stained and analyzed by traditional single-band DNA equipment, while the other one was stained by the compound staining method and analyzed by the multi-spectral imaging system.
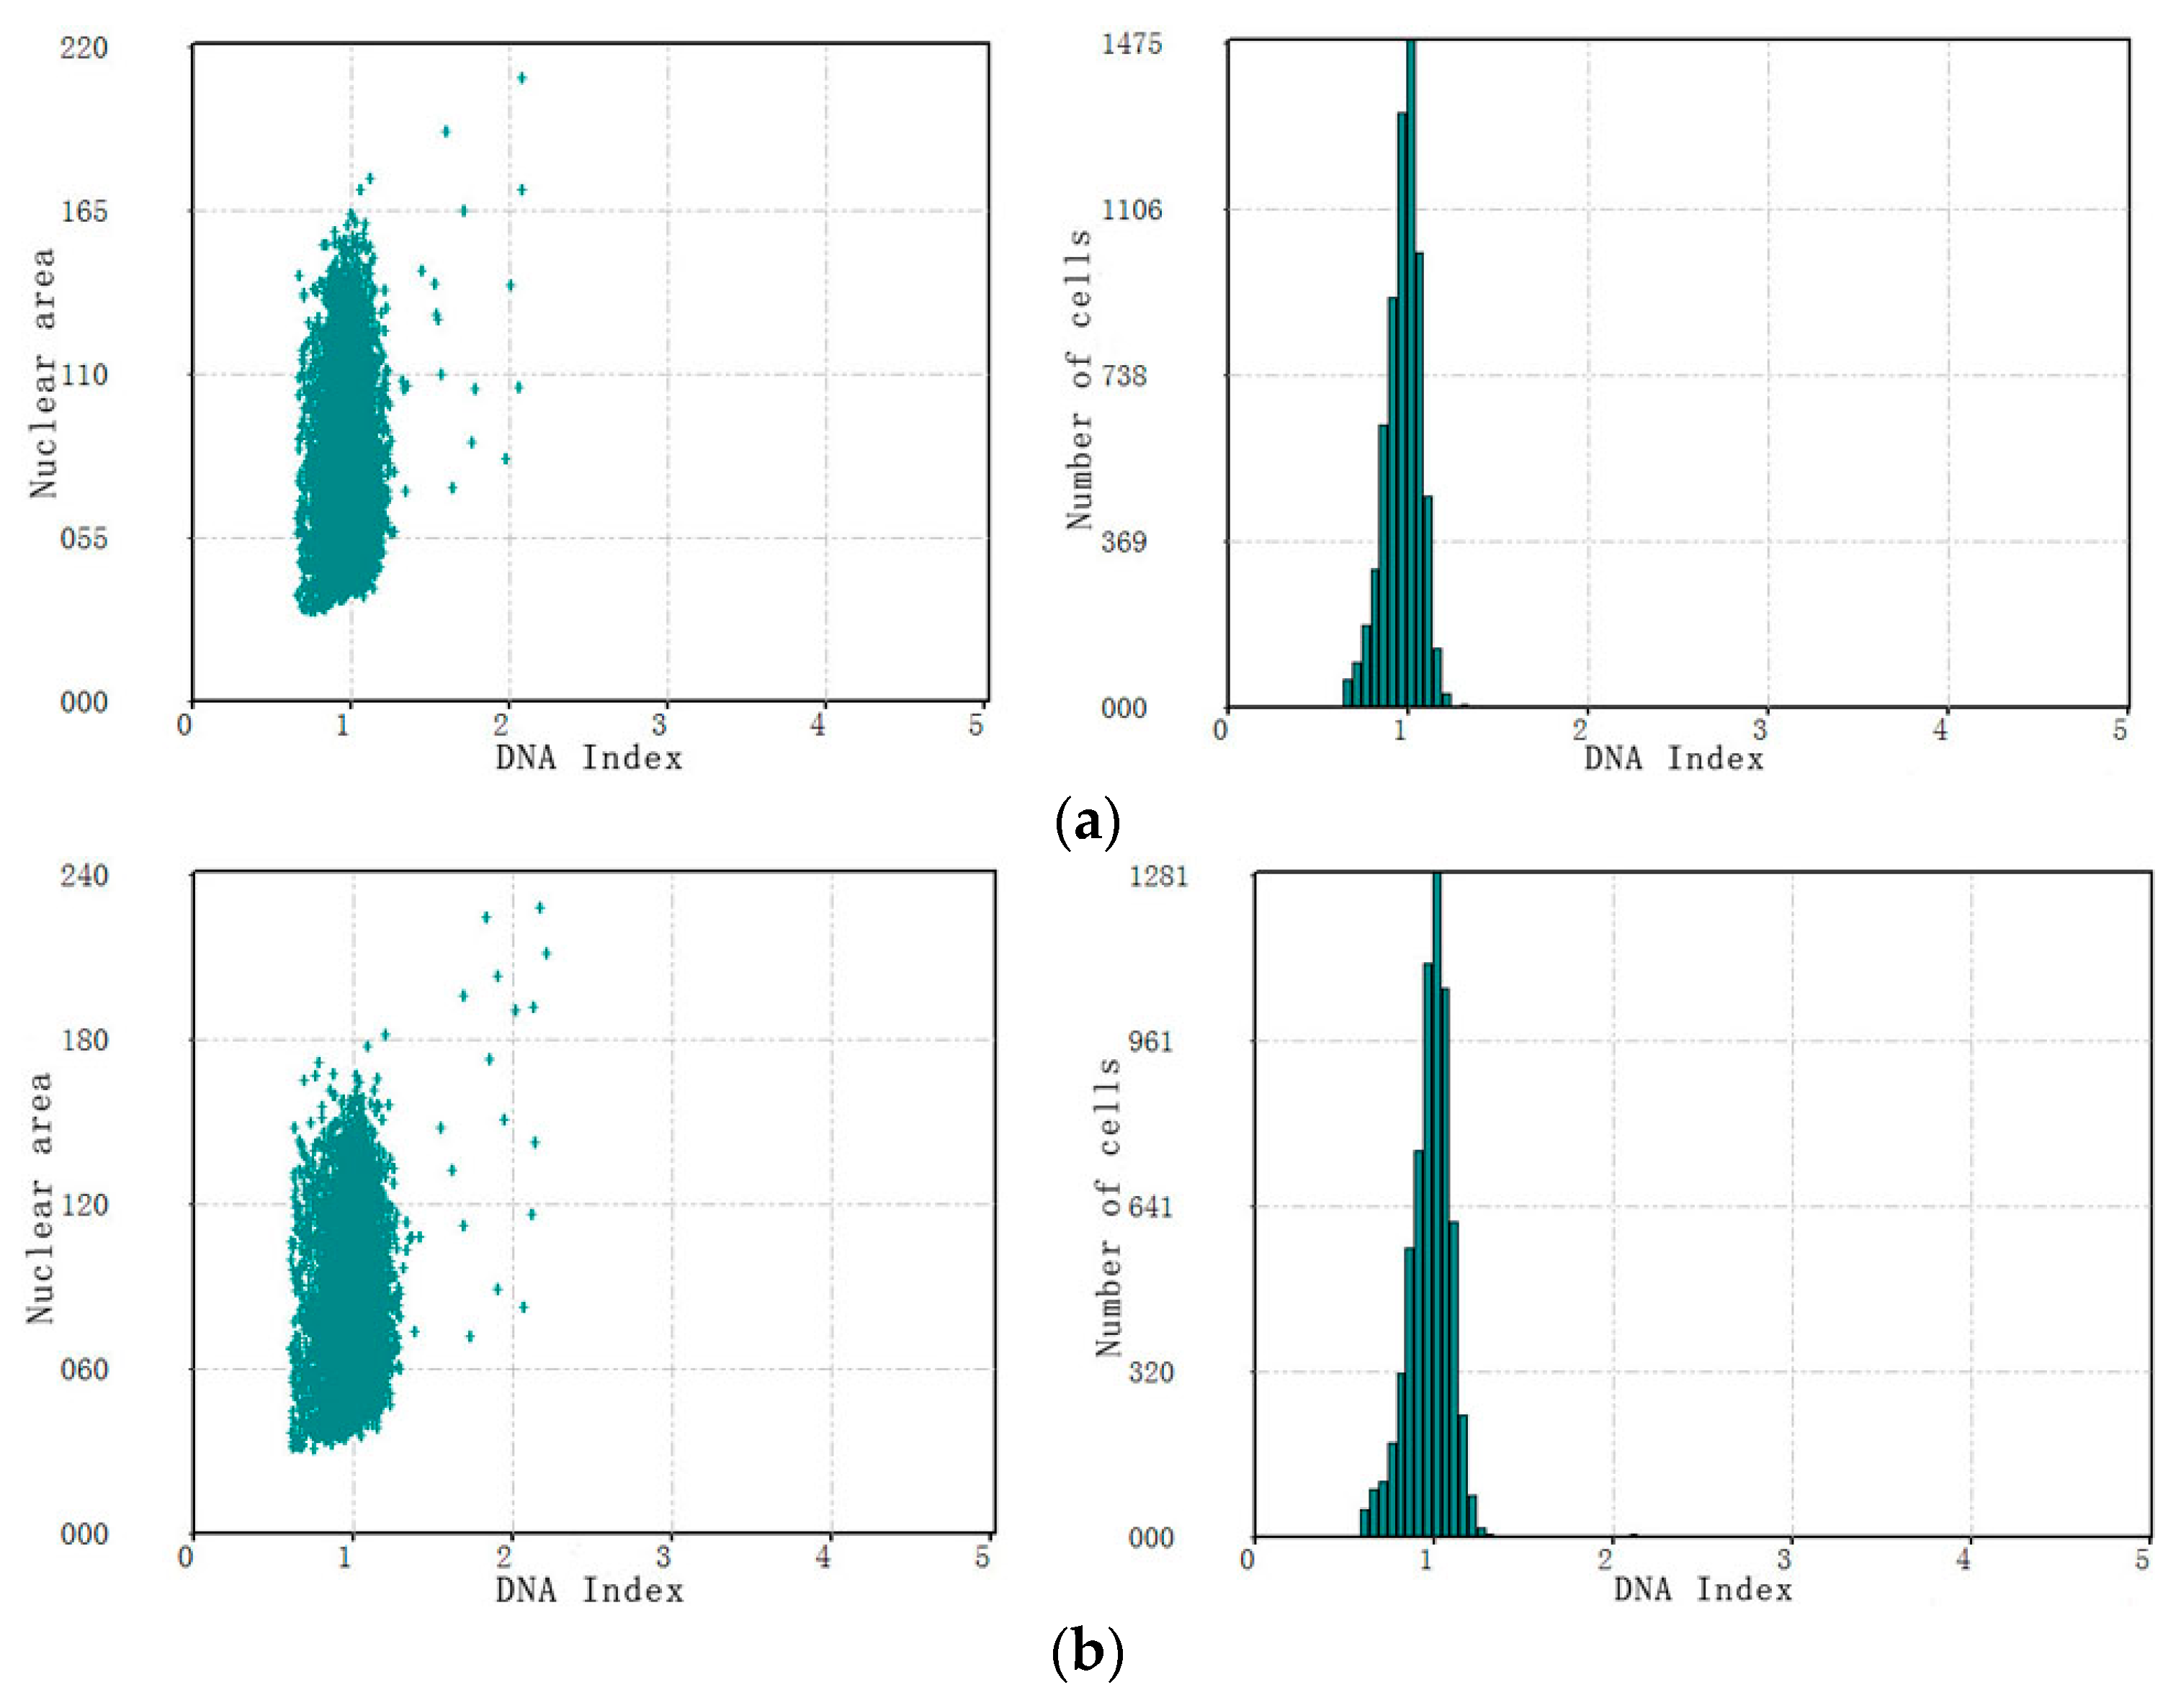
Figure 8 shows the scatter plots and histograms of one negative case obtained by two methods of analysis. Table 1 presents the quantity, mean of DI, standard deviation and CV of cells, in this case, obtained by two methods. Through analyzing the experimental results of the multi-spectral imaging system by mathematical statistics at a 95% confidence level, the confidence interval of the DNA indices of diploid cells is (0.998, 1.002), while the confidence interval of the DNA indices of tetraploid cells is (1.939, 2.179).
Figure 9 shows the scatter plots and histograms of one positive case obtained by two methods of analysis. Table 2 presents the quantity, mean of DI, standard deviation and Coefficient of Variation (CV) of cells obtained by two methods. At a 95% confidence level, the confidence interval of the DNA indices for diploid cells calculated by the multi-spectral imaging system is (1.023, 1.029); the confidence interval of the DNA indices for tetraploid cells is (2.020, 2.058).
To judge whether there is a negative case or a positive case at a 95% confidence level, the upper limit of the confidence intervals for tetraploid cells calculated by the multi-spectral imaging system is less than 2.5, so a miscalculation will not happen. Comparing the results of the DNA quantitative analysis of three cases between two methods, as shown in the figures, most cells in this case that are distributed in the position of the DNA index are 1 and 2. There is a small number of positive cells with DI > 2.5 in Figure 8. Positive cells can be identified by both systems, the shape of the cells distribution is similar, and the results of the two methods are also basically consistent.
It can be seen from Table 2 that CV of the high ploidy cells for the compound-stained smear measured by multi-spectral system is larger than that of the Feulgen-stained smear measured by single-band DNA equipment. The main reason for this is that the traditional method uses only one spectral waveband, there are fewer sources of error in the compound-staining method, and it has greater accuracy, especially in the calculation of high-ploidy cells with a higher gray level of the nucleus. However, the mean values of DNA indices of diploid cells and tetraploid cells calculated by both methods are basically consistent, and cells with a DNA index greater than 2.5 can be detected by both methods. Therefore, this multi-spectral imaging system still provides high accuracy and reliability in screening cervical cells.

4. Conclusions

This proposed system realizes the simultaneous application of TBS classification and DNA quantitative analysis to the same cell smear. Some advantages can be observed, such as: (1) only one material extraction and one film production are required, which greatly reduces the production cost; (2) the simultaneous implementation of two screening methods can realize the complementary advantages of each method, significantly improving diagnostic accuracy; (3) automatic scanning based on PCs allows for a high degree of automation, which would greatly improve the screening diagnosis speed and reduce operators’ work intensity. In summary, the microscopic multi-spectral imaging system provides high accuracy and reliability, providing wide application prospects in early diagnosis of cervical cancer.
In this system, images of cervical smears are captured via a monochrome CMOS image sensor. In further works, a color-image sensor with a higher resolution, higher frame rate and lager pixel size could be utilized to further improve the real-time accuracy of this system.

Author Contributions

Conceptualization, methodology, writing-original draft preparation R.F.; data curation, L.Z.; writing-review and editing, F.Y. All authors have read and agreed to the published version of the manuscript.

Funding

This research received no external funding.

Institutional Review Board Statement

Not applicable.

Informed Consent Statement

Not applicable.

Acknowledgments

This work was supported by the National Science & Technology Support Plan Projects of China (Grant No. 2011BAF02B02).

Conflicts of Interest

The authors declare that there is no conflict of interest regarding the publication of this paper.

References

  1. Malagon, T.; Drolet, M.; Boily, M.C.; Laprise, J.F.; Brisson, M. Changing inequalities in cervical cancer: Modeling the impact of vaccine uptake, vaccine herd effects, and cervical cancer screening in the post-vaccination era. Cancer Epidemiol. Biomark. Prev. 2015, 24, 276–285. [Google Scholar] [CrossRef] [Green Version]
  2. Gupta, R.; Gupta, S.; Mehrotra, R.; Sodhani, P. Cervical Cancer Screening in Resource Constrained Countries: Current Status and Future Directions. Asian Pac. J. Cancer Prev. 2017, 18, 1461–1467. [Google Scholar]
  3. Ferlay, J.; Soerjomataram, I.; Dikshit, R.; Eser, S.; Mathers, C.; Rebelo, M.; Parkin, D.M.; Forman, D.; Bray, F. Cancer incidence and mortality worldwide: Sources, methods and major patterns in GLOBOCAN 2012. Int. J. Cancer 2015, 136, E359–E386. [Google Scholar] [CrossRef]
  4. Rosa, C.; Patrick, P.; Gabriel, D.; Pierre, V. Cervical cancer screening in developing countries at a crossroad: Emerging technologies and policy choices. World J. Clin. Oncol. 2015, 6, 281–290. [Google Scholar]
  5. Peto, J.; Gilham, C.; Fletcher, O.; Matthews, F.E. The cervical cancer epidemic that screening has prevented in the UK. Lancet 2004, 364, 249–256. [Google Scholar] [CrossRef]
  6. Remmerbach, T.W.; Weidenbach, H.; Pomjanski, N.; Knops, K.; Mathes, S.; Hemprich, A.; Bocking, A. Cytologic and DNA-cytometric early diagnosis of oral cancer. Anal. Cell. Pathol. 2001, 22, 211–221. [Google Scholar] [CrossRef] [Green Version]
  7. Solomon, D.; Davey, D.; Kurman, R.; Moriarty, A.; O’Connor, D.; Prey, M.; Raab, S.; Sherman, M.; Wilbur, D.; Young, N.; et al. The 2001 Bethesda System—Terminology for reporting results of cervical cytology. JAMA J. Am. Med. Assoc. 2002, 287, 2114–2119. [Google Scholar] [CrossRef] [PubMed]
  8. Guillaud, M.; Benedet, J.L.; Cantor, S.B.; Staerkel, G.; Follen, M.; MacAulay, C. DNA ploidy compared with human papilloma virus testing (Hybrid capture-II) and conventional cervical cytology as a primary screening test for cervical high-grade lesions and cancer in 1555 patients with biopsy confirmation. Cancer 2006, 107, 309–318. [Google Scholar] [CrossRef] [PubMed]
  9. Demirel, D.; Akyurek, N.; Ramzy, I. Diagnostic and prognostic significance of image cytometric DNA ploidy measurement in cytological samples of cervical squamous intraepithelial lesions. Cytopathology 2013, 24, 105–112. [Google Scholar] [CrossRef] [PubMed]
  10. Grote, H.J.; Nguyen, H.V.Q.; Leick, A.G.; Bocking, A. Identification of progressive cervical epithelial cell abnormalities using DNA image cytometry. Cancer Cytopathol. 2004, 102, 373–379. [Google Scholar] [CrossRef] [PubMed]
  11. Bocking, A.; Nguyen, V.Q. Diagnostic and prognostic use of DNA image cytometry in cervical squamous intraepithelial lesions and invasive carcinoma. Cancer 2004, 102, 41–54. [Google Scholar] [CrossRef] [PubMed]
  12. Fleskens, S.J.H.M.; Takes, R.P.; Otte-Holler, I.; van Doesburg, L.; Smeets, A.; Speel, E.J.M.; Slootweg, P.J.; Van Der Laak, J.A. Simultaneous assessment of DNA ploidy and biomarker expression in paraffin-embedded tissue sections. Histopathology 2010, 57, 14–26. [Google Scholar] [CrossRef] [PubMed]
  13. Levenson, R.M.; Mansfield, J.R. Multispectral imaging in biology and medicine: Slices of life. Cytom. Part A 2006, 69, 748–758. [Google Scholar] [CrossRef] [PubMed]
  14. Carcagni, P.; Della Patria, A.; Fontana, R.; Greco, M.; Mastroianni, M.; Materazzi, M.; Pampaloni, E.; Pezzati, L. Multispectral imaging of paintings by optical scanning. Opt. Lasers Eng. 2007, 45, 360–367. [Google Scholar] [CrossRef]
  15. Bautista, P.A.; Yagi, Y. Localization of eosinophilic esophagitis from H & E stained images using multispectral imaging. Diagn Pathol. 2011, 6 (Suppl. 1), S2. [Google Scholar]
  16. Lu, R.F. Multispectral imaging for predicting firmness and soluble solids content of apple fruit. Postharvest Biol. Technol. 2004, 31, 147–157. [Google Scholar] [CrossRef]
  17. Jakovels, D.; Spigulis, J. 2-D mapping of skin chromophores in the spectral range 500–700 nm. J. Biophotonics 2010, 3, 125–129. [Google Scholar] [CrossRef]
  18. Basiri, A.; Nabili, M.; Mathews, S.; Libin, A.; Groah, S.; Noordmans, H.J.; Ramella-Roman, J.C. Use of a multi-spectral camera in the characterization of skin wounds. Opt. Express 2010, 18, 3244–3257. [Google Scholar] [CrossRef] [Green Version]
  19. Crane, L.M.; Themelis, G.; Pleijhuis, R.G.; Harlaar, N.J.; Sarantopoulos, A.; Arts, H.J.; van der Zee, A.G.; Vasilis, N.; van Dam, G.M. Intraoperative Multispectral Fluorescence Imaging for the Detection of the Sentinel Lymph Node in Cervical Cancer: A Novel Concept. Mol. Imaging Biol. 2010, 13, 1043–1049. [Google Scholar] [CrossRef] [Green Version]
  20. Hedley, D.W.; Rugg, C.A.; Gelber, R.D. Association of DNA Index and S-Phase Fraction with Prognosis of Nodes Positive Early Breast-Cancer. Cancer Res. 1987, 47, 4729–4735. [Google Scholar]
  21. Hiddemann, W.; Schumann, J.; Andreef, M.; Barlogie, B.; Herman, C.J.; Leif, R.C.; Mayall, B.H.; Murphy, R.F.; Sandberg, A.A. Convention on Nomenclature for DNA Cytometry. Cancer Genet. Cytogenet. 1984, 13, 181–183. [Google Scholar] [CrossRef]
  22. Colditz, G.A.; Crawley, J. DNA Cytometry Testing for Cervical Cancer Screening: Approaches and Reporting Standards for New Technologies. Clin. Cancer Res. 2011, 17, 6971–6972. [Google Scholar] [CrossRef] [PubMed] [Green Version]
  23. Kallioniemi, O.P.; Blanco, G.; Alavaikko, M.; Hietanen, T.; Mattila, J.; Lauslahti, K.; Lehtinen, M.; Koivula, T. Improving the Prognostic Value of DNA Flow-Cytometry in Breast-Cancer by Combining DNA Index and S-Phase Fraction—A Proposed Classification of DNA Histograms in Breast-Cancer. Cancer 1988, 62, 2183–2190. [Google Scholar] [CrossRef]
  24. Kallioniemi, O.P.; Koivula, T.; Punnonen, R.; Mattila, J.; Lehtinen, M. Prognostic-Significance of DNA Index, Multiploidy, and S-Phase Fraction in Ovarian-Cancer. Cancer 1988, 61, 334–339. [Google Scholar] [CrossRef]
  25. Wu, Z.; Zeng, L.B.; Wu, Q.S. Study of cervical exfoliated cell’s DNA quantitative analysis based on multi-spectral imaging technology. Spectrosc. Spectr. Anal. 2016, 36, 496–501. [Google Scholar]
  26. Biesterfeld, S.; Beckers, S.; Cadenas, M.D.V.; Schramm, M. Feulgen Staining Remains the Gold Standard for Precise DNA Image Cytometry. Anticancer Res. 2011, 31, 53–58. [Google Scholar]
  27. Nghiem, V.T.; Davies, K.R.; Beck, J.R.; Follen, M.; MacAulay, C.; Guillaud, M.; Cantor, S.B. Economic evaluation of DNA ploidy analysis vs liquid-based cytology for cervical screening. Br. J. Cancer 2015, 112, 1951–1957. [Google Scholar] [CrossRef] [Green Version]
  28. Carriere, R. The growth of liver parenchymal nuclei and its endocrine regulation. Int. Rev. Cytol. 1969, 25, 201–277. [Google Scholar]
  29. Styles, J.A. Measurement of Ploidy and Cell-Proliferation in the Rodent Liver. Environ. Health Perspect. 1993, 101, 67–71. [Google Scholar]
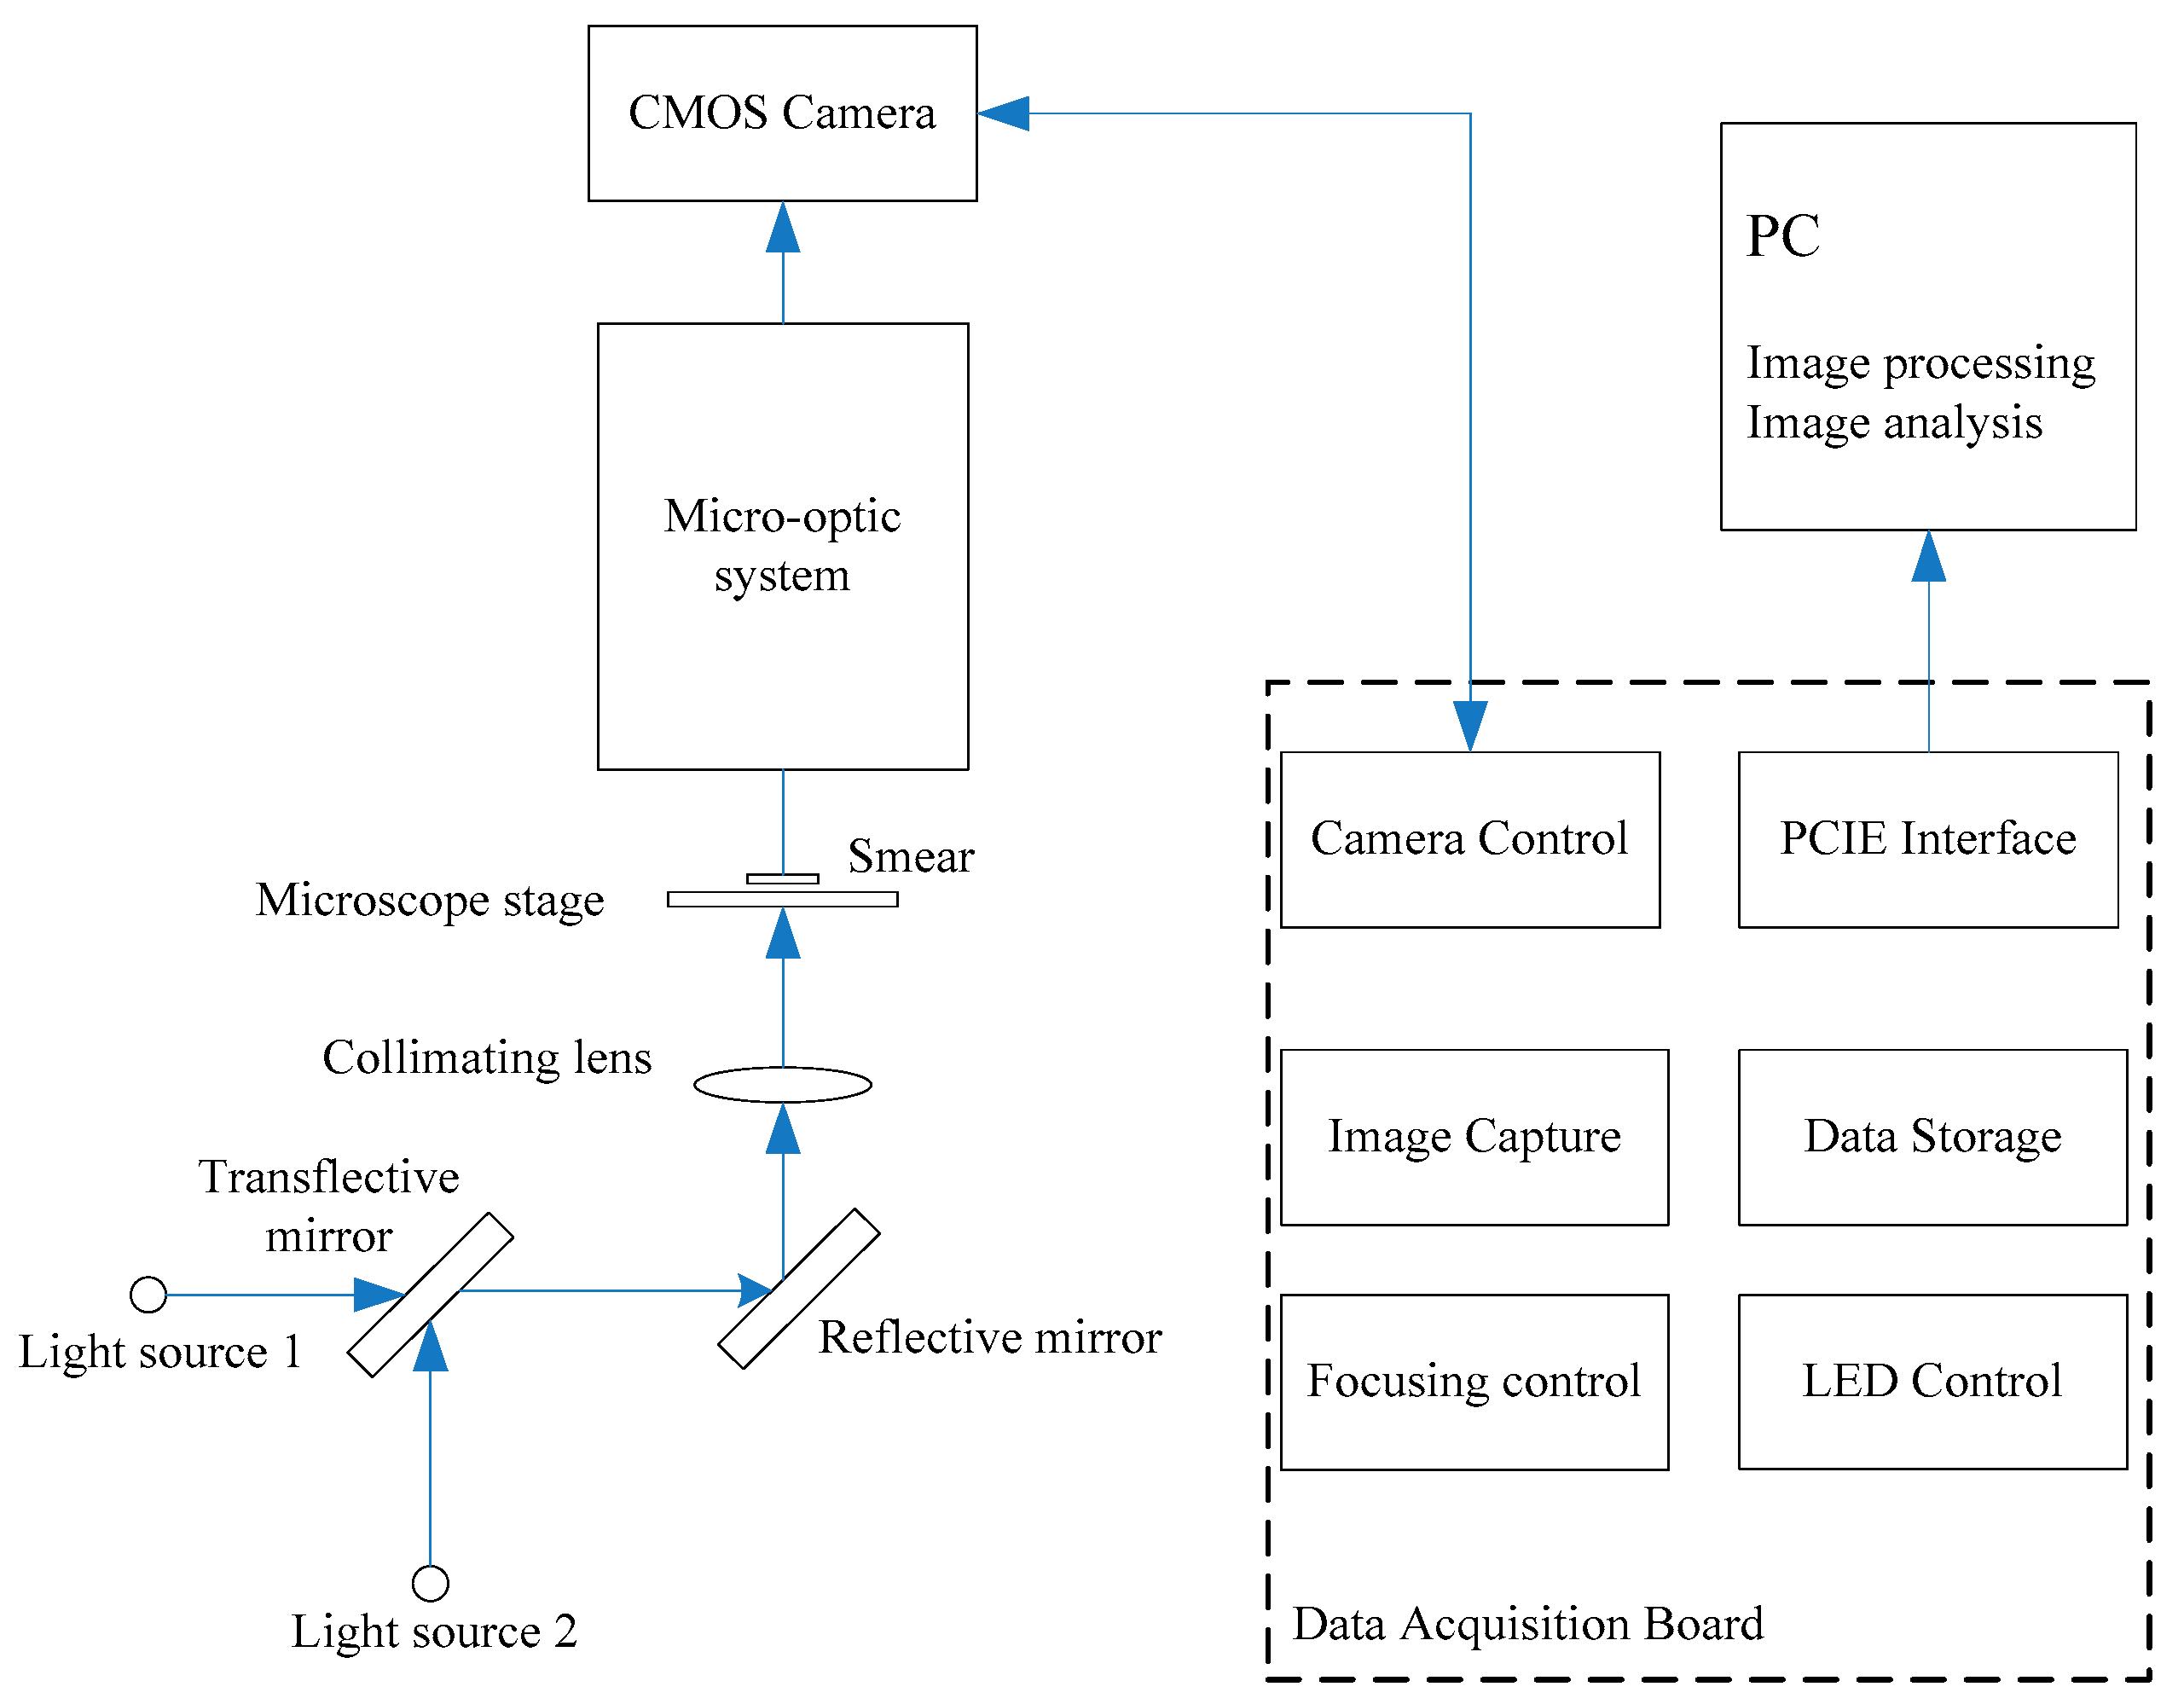
Figure 1. Schematic diagram of microscopic multi-spectral imaging system.
Applsci 11 05628 g001
Figure 2. The absorbance curves of absorbent materials.
Applsci 11 05628 g002
Figure 3. Original images obtained under monochromatic light sources; (a) the image of the wavelength of 620 nm, (b) the image of the wavelength of 520 nm, (c) the image of the wavelength of 460 nm, (d) the image of the wavelength of 570 nm.
Applsci 11 05628 g003
Figure 4. The image after absorbance unmixing.
Applsci 11 05628 g004
Figure 5. The pseudo-color image.
Applsci 11 05628 g005
Figure 6. The microspectral images of DNA unmixing results; (1a7a) the images of co-stained cytoplasms and nuclei, (1b7b) the grayscale images of cell nuclei after absorbance unmixing.
Applsci 11 05628 g006
Figure 7. The evaluation result using the mouse liver smear.
Applsci 11 05628 g007
Figure 8. The analysis results of negative case; (a) the results of Feulgen staining method, (b) the results of compound staining method.
Applsci 11 05628 g008
Figure 9. The analysis results of positive case; (a) the results of Feulgen-staining method, (b) the results of compound-staining method.
Applsci 11 05628 g009
Table 1. Contrast data of negative case.
Analysis MethodCell TypesQuantityMean of DIStandard DeviationCV
Feulgen staining methodDiploid cells64210.9890.0899.043
Tetraploid cells61.9830.1025.126
Aneuploid cells151.4730.15410.427
High ploidy cells0000
Compound staining method of this paperDiploid cells61531.0000.0979.744
Tetraploid cells122.0090.1276.305
Aneuploid cells291.3510.14110.433
High ploidy cells0000
Table 2. Contrast data of positive case.
Analysis MethodCell TypesQuantityMean of DIStandard DeviationCV
Feulgen staining methodDiploid cells35171.0340.0928.918
Tetraploid cells2432.0320.1286.276
Aneuploid cells861.3530.1349.934
High ploidy cells323.4240.42912.544
Compound staining method of this paperDiploid cells37801.0260.0949.111
Tetraploid cells2102.0390.1416.921
Aneuploid cells901.3770.15211.063
High ploidy cells303.4400.46313.462
Publisher’s Note: MDPI stays neutral with regard to jurisdictional claims in published maps and institutional affiliations.