Article

Prediction of Size Distribution and Mass Concentration of Smoke Particles on Moisture Content and Combustion Period from Para Rubber Wood Burning

by
Wachara Kalasee
and
Panya Dangwilailux
*
King Mongkut’s Institute of Technology Ladkrabang, Prince of Chumphon Campus, Chumphon 86160, Thailand
*
Author to whom correspondence should be addressed.
Appl. Sci. 2021, 11(12), 5649; https://doi.org/10.3390/app11125649
Submission received: 21 March 2021 / Revised: 11 June 2021 / Accepted: 11 June 2021 / Published: 18 June 2021
(This article belongs to the Special Issue Pollution Control Chemistry)

Abstract

:
The size distribution and total particle mass concentration (TPMC) of smoke particles from para rubber wood (Hevea brasiliensis) combustion in the ribbed smoked sheet (RSS) process were studied. In this experiment, temperature data values of para rubber wood combustion were recorded at 500 mm above the base of the fire by K-type thermocouples. The wood moisture content and wood combustion period were used to find and improve an equation of smoke particle size distribution (SPSD) and TPMC by the response surface method (RSM). An eight-stage Andersen air sampler and a high-volume sampler were used to measure and calculate SPSD and TPMC, respectively. Resulting data in this experiment showed that TPMC ranged from 3.12 to 77.42 mg/m3. SPSD was single mode in which MMAD, mass median aerodynamic diameter, ranged from 0.64 to 1.27 microns for para wood with moisture content ranging from 31.5 to 89.7% dry weight basis. The combustion period and moisture content of para wood have a direct effect on the change of temperature data above the base of the fire and the TPMC and MMAD values. For predicting TPMC and MMAD values by the para wood moisture contents in each combustion period, the results found that the second-degree model was a better plot than the first-degree model, confirmed by higher values of the coefficient of determination (R2).

1. Introduction

Currently, biomass is the most important source of renewable energy in the world [1,2,3]. Particularly in the south of Thailand, para rubber wood (Hevea brasiliensis) has been popular for use both in the community and industry. Exhaust from the wood combustion contains water vapor and gases, including CO2, CO, and N2; soot particles; smoke; and ash residue [4,5]. As the moisture content of the wood is increased, the water vapor present rises. Smoke and soot are composed of the small particles resulting incomplete combustion. The small particles principally contain carbon and other combustible materials: for instance, polycyclic aromatic hydrocarbons or PAHs [6,7], tar, and volatile [8,9,10,11]. In the drying process of ribbed smoked sheet (RSS) production, hazardous air pollutants from para rubber wood combustion, such as smoke particles, cause worker and neighborhood health problems. In addition, smoke particles from para rubber wood burning has a negative effect on the quality of RSS [12,13] and thus lowers the price. In order to manage the smoke particles appropriately, a study of their characteristics was necessary.
Many researchers [14,15,16,17] have studied smoke and soot particle characteristics. The report of Chomanee et al. [18] is the only study on the mass concentration of smoke particles from para rubber wood combustion under different moisture contents (37.4%, 69.8%, and 73.6% dry weight basis (d.b.)) and burning time periods.
The reports by Chomanee et al. [18] and Kalasee et al. [1] showed that the condensation in an eight-stage Andersen air sampler had a direct effect on the MMAD of para rubber wood combustion. Increased water vapor condensation increased the MMAD value. Currently, there has been no research studying aerosol and smoke particles parameters and predicting the effect of the influence of parameters on TPMC and MMAD values from para rubber wood burning.
Therefore, the purpose of this research was to study and predict the change of TPMC and MMAD values, which is related to para rubber wood moisture content value, time periods of combustion, and temperature values above the base of the fire. This study would be useful for solving environmental workplace problems and worker risk in the future.

2. Materials and Methods

This section clarifies the methods used to merge, consider, and analyze smoke particle samples from a burner. Figure 1 shows the burner that was used to study TPMC and MMAD values of para rubber wood combustion.

2.1. Biomass Fuel Used

The twenty-five-year-old [14,19] para rubber wood used as fuel in this study was from the Agriculture, Food, and Energy Center, King Mongkut’s Institute of Technology Ladkrabang, Prince of Chumphon Campus, Chumphon, Thailand, with an initial moisture content from 31.5% to 89.7% d.b. To determine the moisture content of the wood samples, 5-piece samplers were placed in positions next to the wood log front, middle, back, between front and middle, and between middle and back, respectively; they were weighed and put on aluminum trays for moisture content determination (AOAC, 2005) in an electric air oven (Mammert, 400) at 103 °C until a constant weight was obtained [1,13,17].

2.2. Sampling Methods

In the experiment, 145 logs of para rubber wood samples were randomly taken from the Agriculture, Food, and Energy Center. The length, weight, and moisture content of all samples were measured and recorded. Dependent on the wood samples’ initial average moisture condition, they were divided into five groups of 31.5, 35.4, 42.5, 54.8, and 89.7% d.b. Every experimental group for the samples was repeated five times. The wood samples (25 kg or about 5–6 logs of wood) for every experiment were burned in a burner constructed from bricks and mortar, with dimensions of 0.5 × 0.7 × 1.5 m. During combustion, the wood samples, having a length of about 0.50 m, were fed into the furnace by placing them at the base of the oven. Air flows into the burner via a gap in the bottom of the furnace gate. Source smoke and soot particles from the furnace were sampled by two groups of an apparatus to determine TPMC and MMAD values (Figure 1). Thus, the 250 data (5 run × 10 time × 5 repeat) were used for the construction of the models.

2.3. Temperature Data Value Recording

The temperature data values of the para rubber wood combustion were recorded at 500 mm above the base of the fire by using K-type thermocouples and a data logger (Data-Taker, DT500). The data logger recorded the temperatures at 1-min intervals to ensure a continuous reading. The temperature data for analyses was considered after the para rubber wood was burned for 15, 30, 60, 75, 120, 135, 150, and 165 min, respectively.

2.4. Particles Size Distribution

Size distribution of the smoke particles and the geometric standard deviation (GSD) value from para rubber wood combustion were determined by collecting particles using an 8-stage Andersen air sampler [Dylec, AN200]. This sampler had cut sizes of 0.43, 0.65, 1.1, 2.1, 3.3, 4.7, 7.0, and 11.0 microns. A backup filter was placed on the bottom stage of the sampler; it was used to collect smoke particles which had dimensions of less than 0.43 microns. The sampling flow rate was set at 28.3 lpm by the flow experiment set control (Figure 1). An 80-m diameter of quartz-type fibrous filter [ADVENTEC, QR-100] was placed on a glass plate and used to collect smoke particles at each stage of the air sampler. The sampling gas temperature ranged between 100 and 200 °C; therefore, the Andersen impactors and tubing were insulated with glass fiber to prevent condensation. This sampling tube had a length of 3.0 m. The gas temperature decreased by less than 50 °C before entering the air sampler, preventing system condensation. The smoke particle size distribution was measured after the para rubber wood had burned for 15, 30, 60, 75, 120, 135, and 150 min, and each sampling was taken over 10 min. The MMAD value was defined as the aerodynamic diameter at 50% of the cumulative oversize percentage of the smoke particles, and the GSD value of the smoke particles was written as [20]
G S D = d 84.1 % d 50 % = d 50 % d 15.9 %

2.5. Total Smoke Particle Mass Concentration

The total particle mass concentration (TPMC) of smoke particles from para rubber wood combustion was determined by collecting particles using a vacuum air sampler [Daikawa, 2VP-120L]. A quartz-type fibrous filter [ADVENTEC, QR-100] having a diameter of 110 mm was placed in the filter holder. The sampling flow rate was set at 100 lpm by the flow experiment set control (Figure 1). The relationship between TPMC and time periods was determined and measured under the same conditions as the smoke particle size distribution.

2.6. Modelling by Response Surface Method

RSM or the response surface method was a technique for learning the relationship between a response of interest (y) and input parameters (x). For an equation to predict MMAD and TPMC value changes during para rubber wood burning, wood moisture content (MR) and drying time (t) would be the input variables. Thus, the functions were specified by Equation (2) for MMAD and TPMC values.
M M A D   o r   T P M C = F ( M R , t )
It is agreeable to assume the random experimental error value was zero. The first- and second-degree prediction models of MMAD and TPMC value changes could be written as follows:
The first-degree prediction models could be calculated from
M M A D   o r   T P M C = p 0 + p 1 M R + p 2 t
The second degree prediction models could be calculated from
M M A D   o r   T P M C = p 0 + p 1 M R + p 2 t + p 3 M R 2 + p 4 t 2 + p 5 M R t

3. Results and Discussion

3.1. Temperature Variation

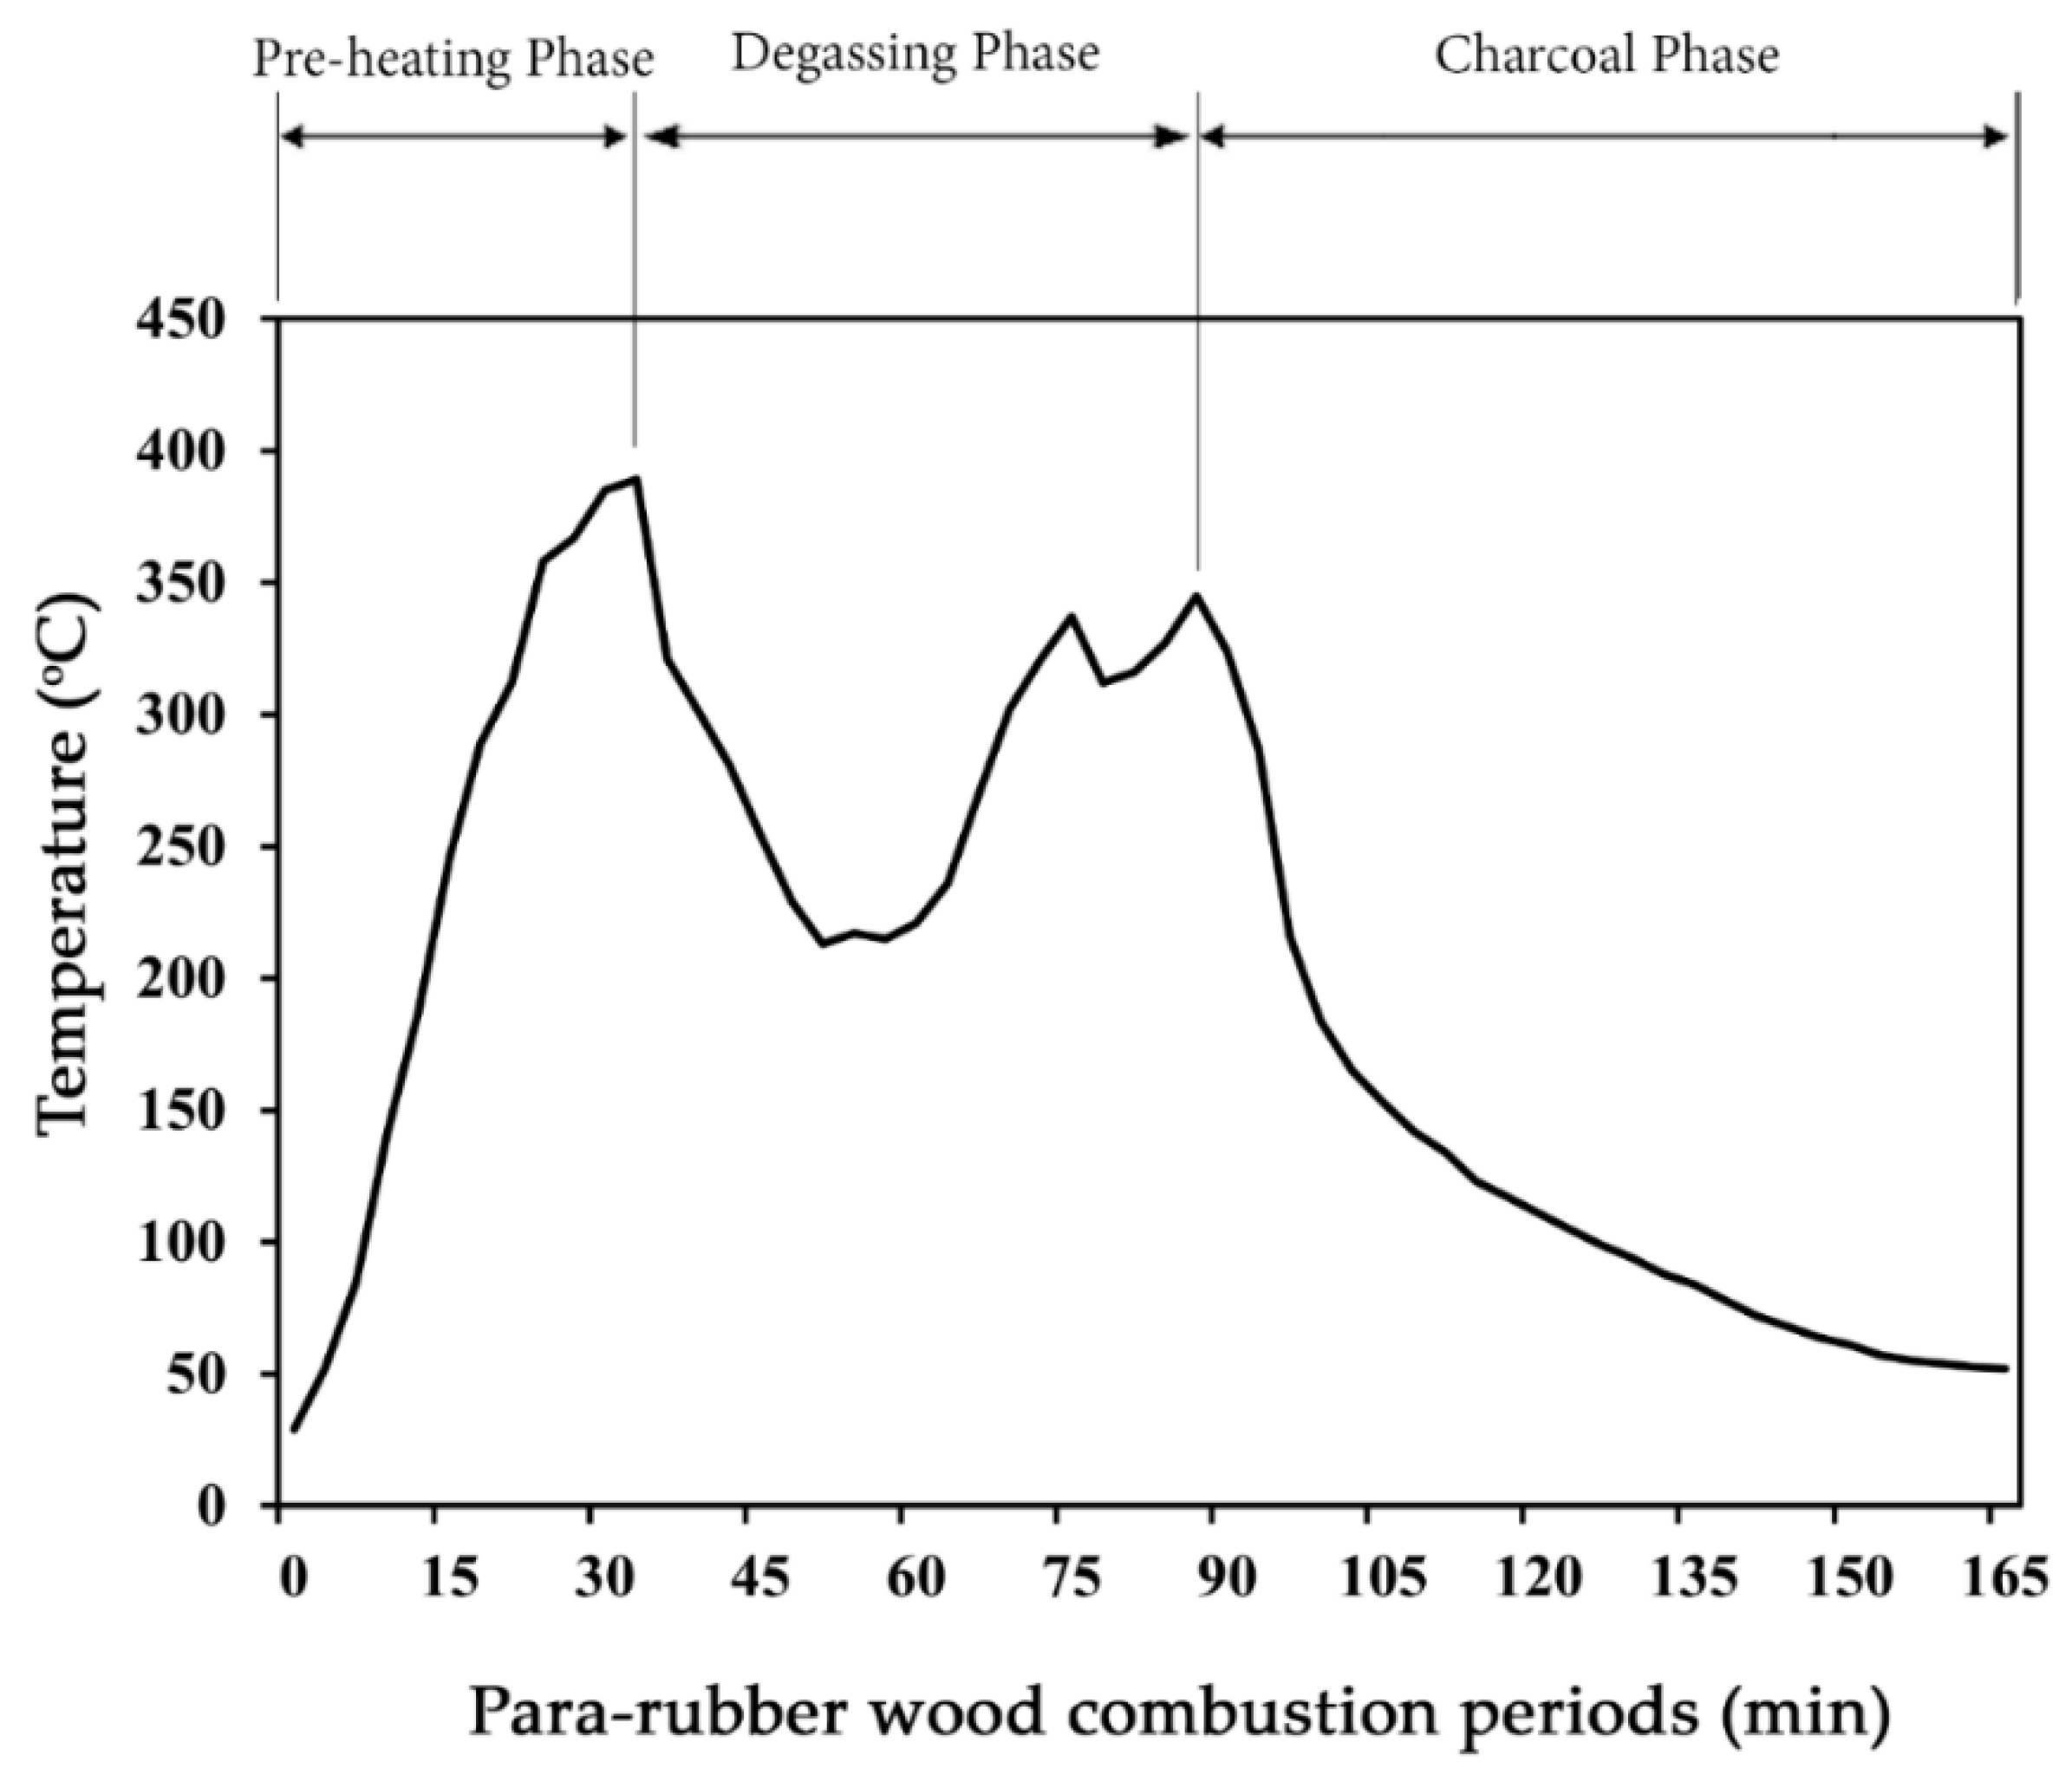
Figure 2 shows the results of the effect of the wood combustion period and the temperature data values above the base of the fire. Figure 2 illustrates that the para rubber wood combustion had three phases: preheating, degassing, and charcoal. It agrees with the results reported by [21,22,23], which studied the time and temperature combustion profiles of various woods, such as pine wood and eucalyptus wood. In the preheating phase, temperature values rose quickly from the initial combustion period to about 15–30 min after initial combustion. Temperature values increased with decreasing the moisture content. In the second phase (degassing), temperature values dropped during the first part, and the values increased during the second part after most of the tar and volatile particles dissolved [21,23,24,25]. Finally, at the charcoal phase, the temperature values decreased to 50–52 °C.
Figure 3 illustrates that the para rubber wood moisture content had a prime influence on increasing temperature data values above the base of the fire. Thus, it shows the highest temperature value of about 475 °C was found at the lowest wood moisture content, 31.5% d.b., in the preheating phase. The wood combustion period in the degassing phase, 89.7% d.b., was the longest because 89.7% d.b. had the highest wood moisture content value and had the most tar and volatile particles [21,22,23]. In the charcoal phase, the results showed that 89.7% d.b. took the shortest time because it had the least heartwood after burning in the first and second phases of the wood combustion stages [21,24,25].

3.2. Smoke Particle Size Distribution

Table 1 presents the comparison of the MMAD and TPMC value results, measured from a normal and modified eight-stage Andersen air sampler system. For the modified system, the Andersen impactors and tubing were insulated with glass fiber to prevent condensation, but for the normal system, these were not insulated. The results showed the MMAD value results measured from the modified system were less than the normal system by about 10–15%, but TPMC was not significantly different. For this reason, the modified system was improved to prevent its condensation.
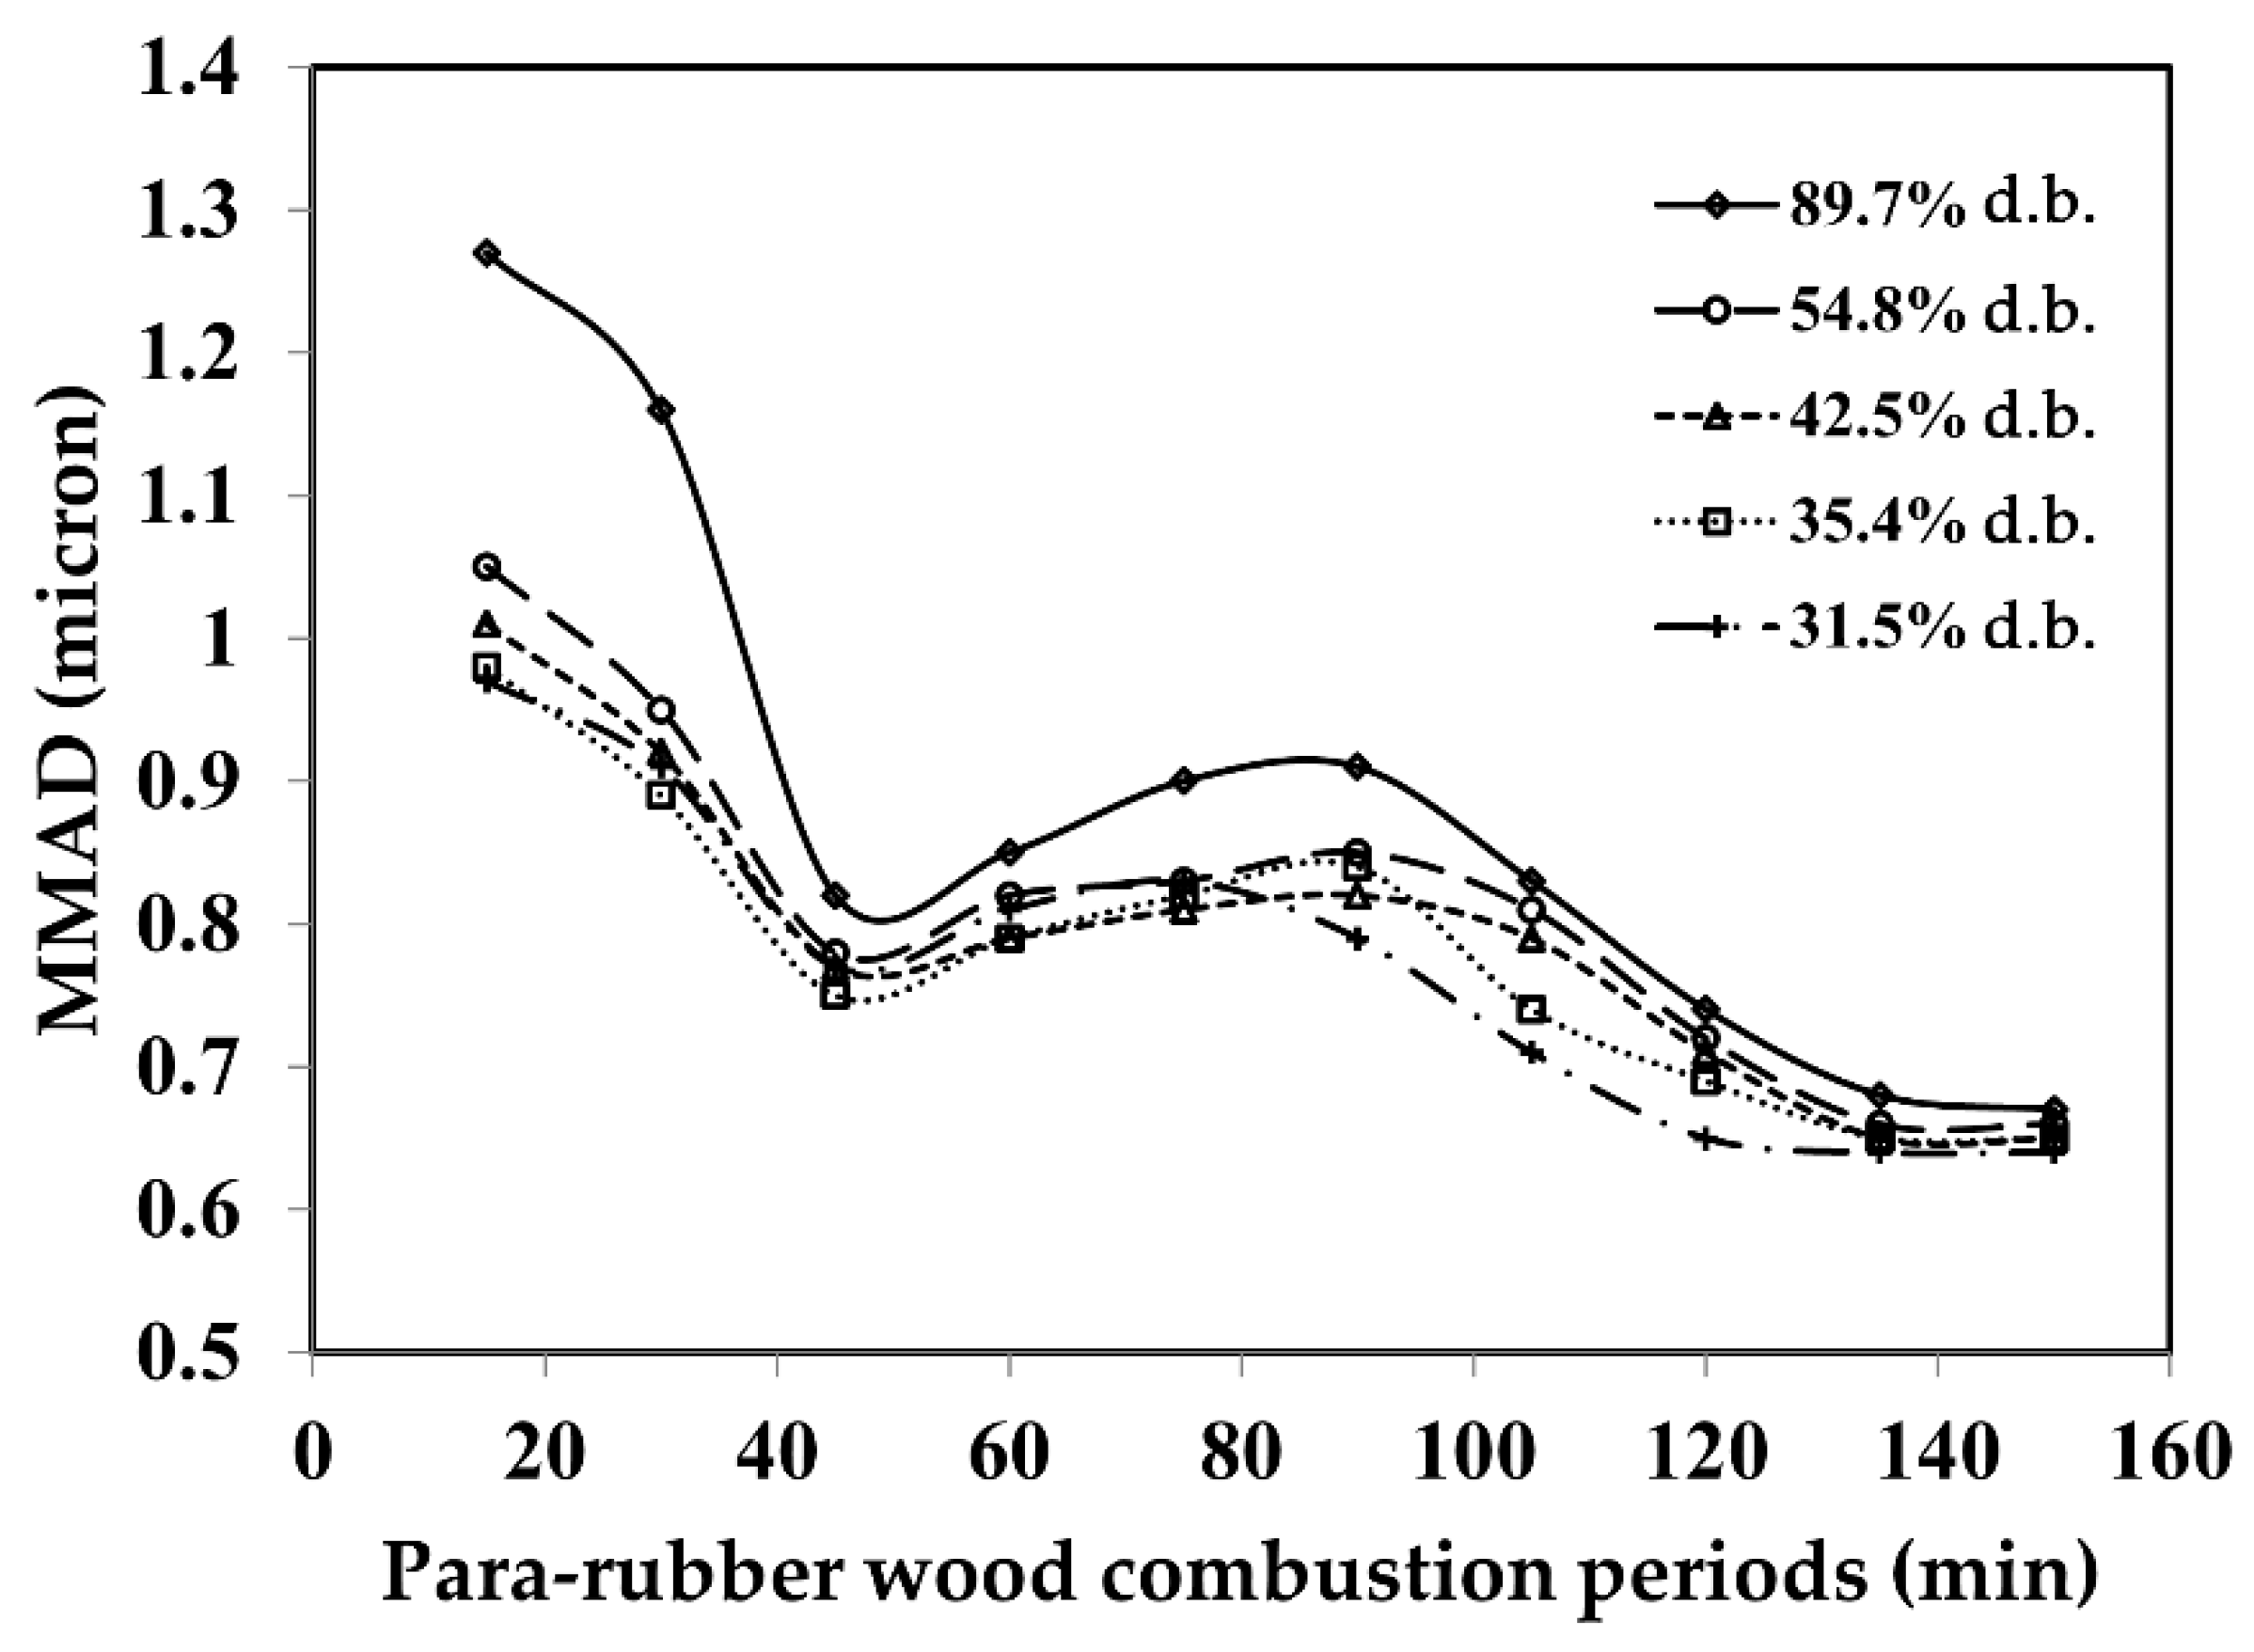
Figure 4 shows the effect of the wood combustion period and moisture content on the smoke particle distribution measurement results using an eight-state Andersen sampler from five samples with moisture content varying from 31.5% to 89.7% d.b. The results showed that the increase in moisture content level had a strong influence on increasing smoke particle size distribution. The smoke particle size distribution indicated a single-mode behavior, suggesting that most of the particles were associated with small particles. This agreed with the results reported by [1,2,16,18,26].
The mass median aerodynamic diameter (MMAD) values were found to be 0.62 to 1.27 microns throughout different wood burning periods and with different moisture contents, as shown in Figure 4. The highest MMAD values were found to be 0.97 to 1.25 microns at the initial combustion period, having the highest para rubber wood moisture content. As shown in Figure 4, at 89.7% d.b., the MMAD values decreased rapidly at 15 to 45 min after the wood’s initial combustion. This result illustrated that the vapor from wood combustion caused the size of smoke particles to be larger than normal from addition and impaction. After 90 min, the MMAD values reduced to 0.79 to 0.91 microns. In the final period (after 150 min after initial combustion), MMAD values reduced to 0.64 to 0.67 microns. The results showed that the time increase had a high influence on decreasing the MMAD values because the degree of incomplete burning is decreased after the evaporation of the water in every type of wood [27,28,29,30,31], including para rubber wood in this experiment.

3.3. Total Particle Mass Concentration of the Smoke Particles

Figure 5 presents the results of total particle mass concentration (TPMC) of smoke particles from para rubber wood combustion. In the initial combustion period, TPMC values were found to be 31.25 to 77.42 mg/m3. After 90 min from initial combustion, the TPMC values reduced to 16.52 to 25.29 microns. In the final period (150 min after initial combustion), the TPMC values reduced to 3.12 to 7.21 microns. The results showed that the increase of time periods had a prime influence on decreasing the TPMC values, synonymous with the MMAD values.

3.4. Prediction of MMAD Values Change

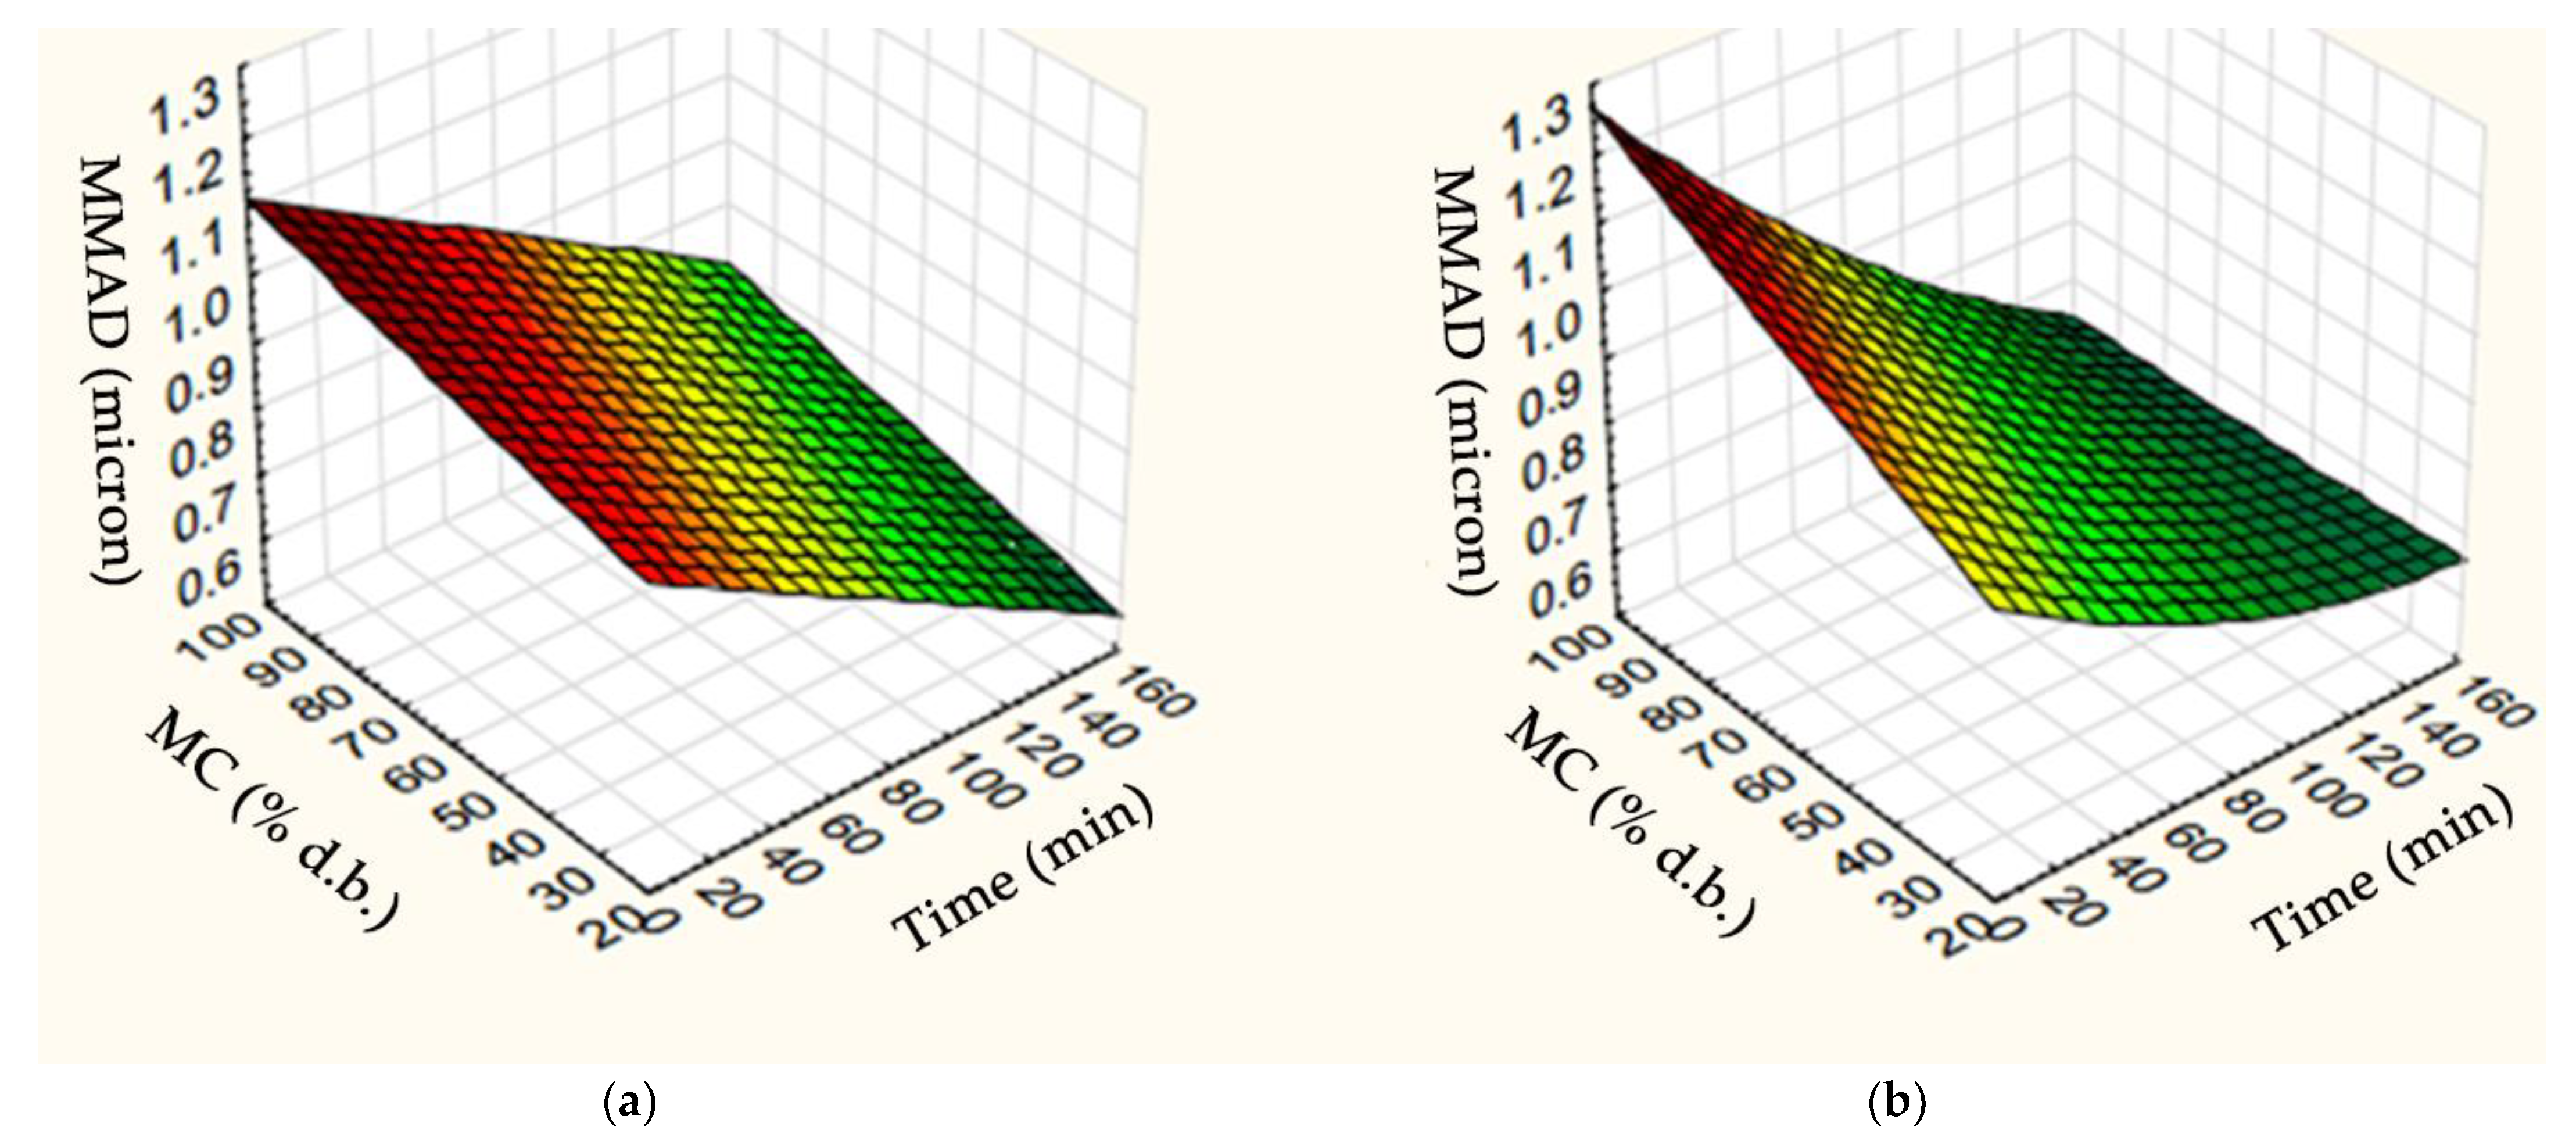
In order to fit a good model, the least-squares technique was used to calculate the coefficient values of the expressed rate constant at various combustion temperatures and orders. Figure 6a,b shows the MMAD values’ 3D surface plots by the first- and second-degree models or Equations (3) and (4). The x-axis and y-axis present the para rubber wood moisture content and the burning time period, respectively, while the z-axis shows the MMAD values. These results show that the moisture content of para rubber wood affected the MMAD values when compared with the burning time. Table 2 presents the p coefficient values calculated by the least-squares method. As seen in Figure 6a,b, at the combustion period, the response of both models presents a decreased trend of MMAD values as the combustion time increases, although only the clear response of the second-degree model presented the effect of moisture content on decreasing the MMAD value as the combustion time progressed, relating to the results. Comparing the MMAD data between the experimental results and prediction values, the second-degree model had a better fit in predicting than the first-degree model; this result is confirmed by the higher mean of the coefficient of determination (Figure 7a,b), respectively. Although the second-degree model had a better fit in prediction than the first-degree model, the mean of the coefficient of determination, or R2, was 0.8267, which is a rather low value. It is probable that in the future, high (third, fourth, fifth, sixth) polynomial degree models will be a very interesting research method to study.

3.5. Prediction of TPMC Values Change

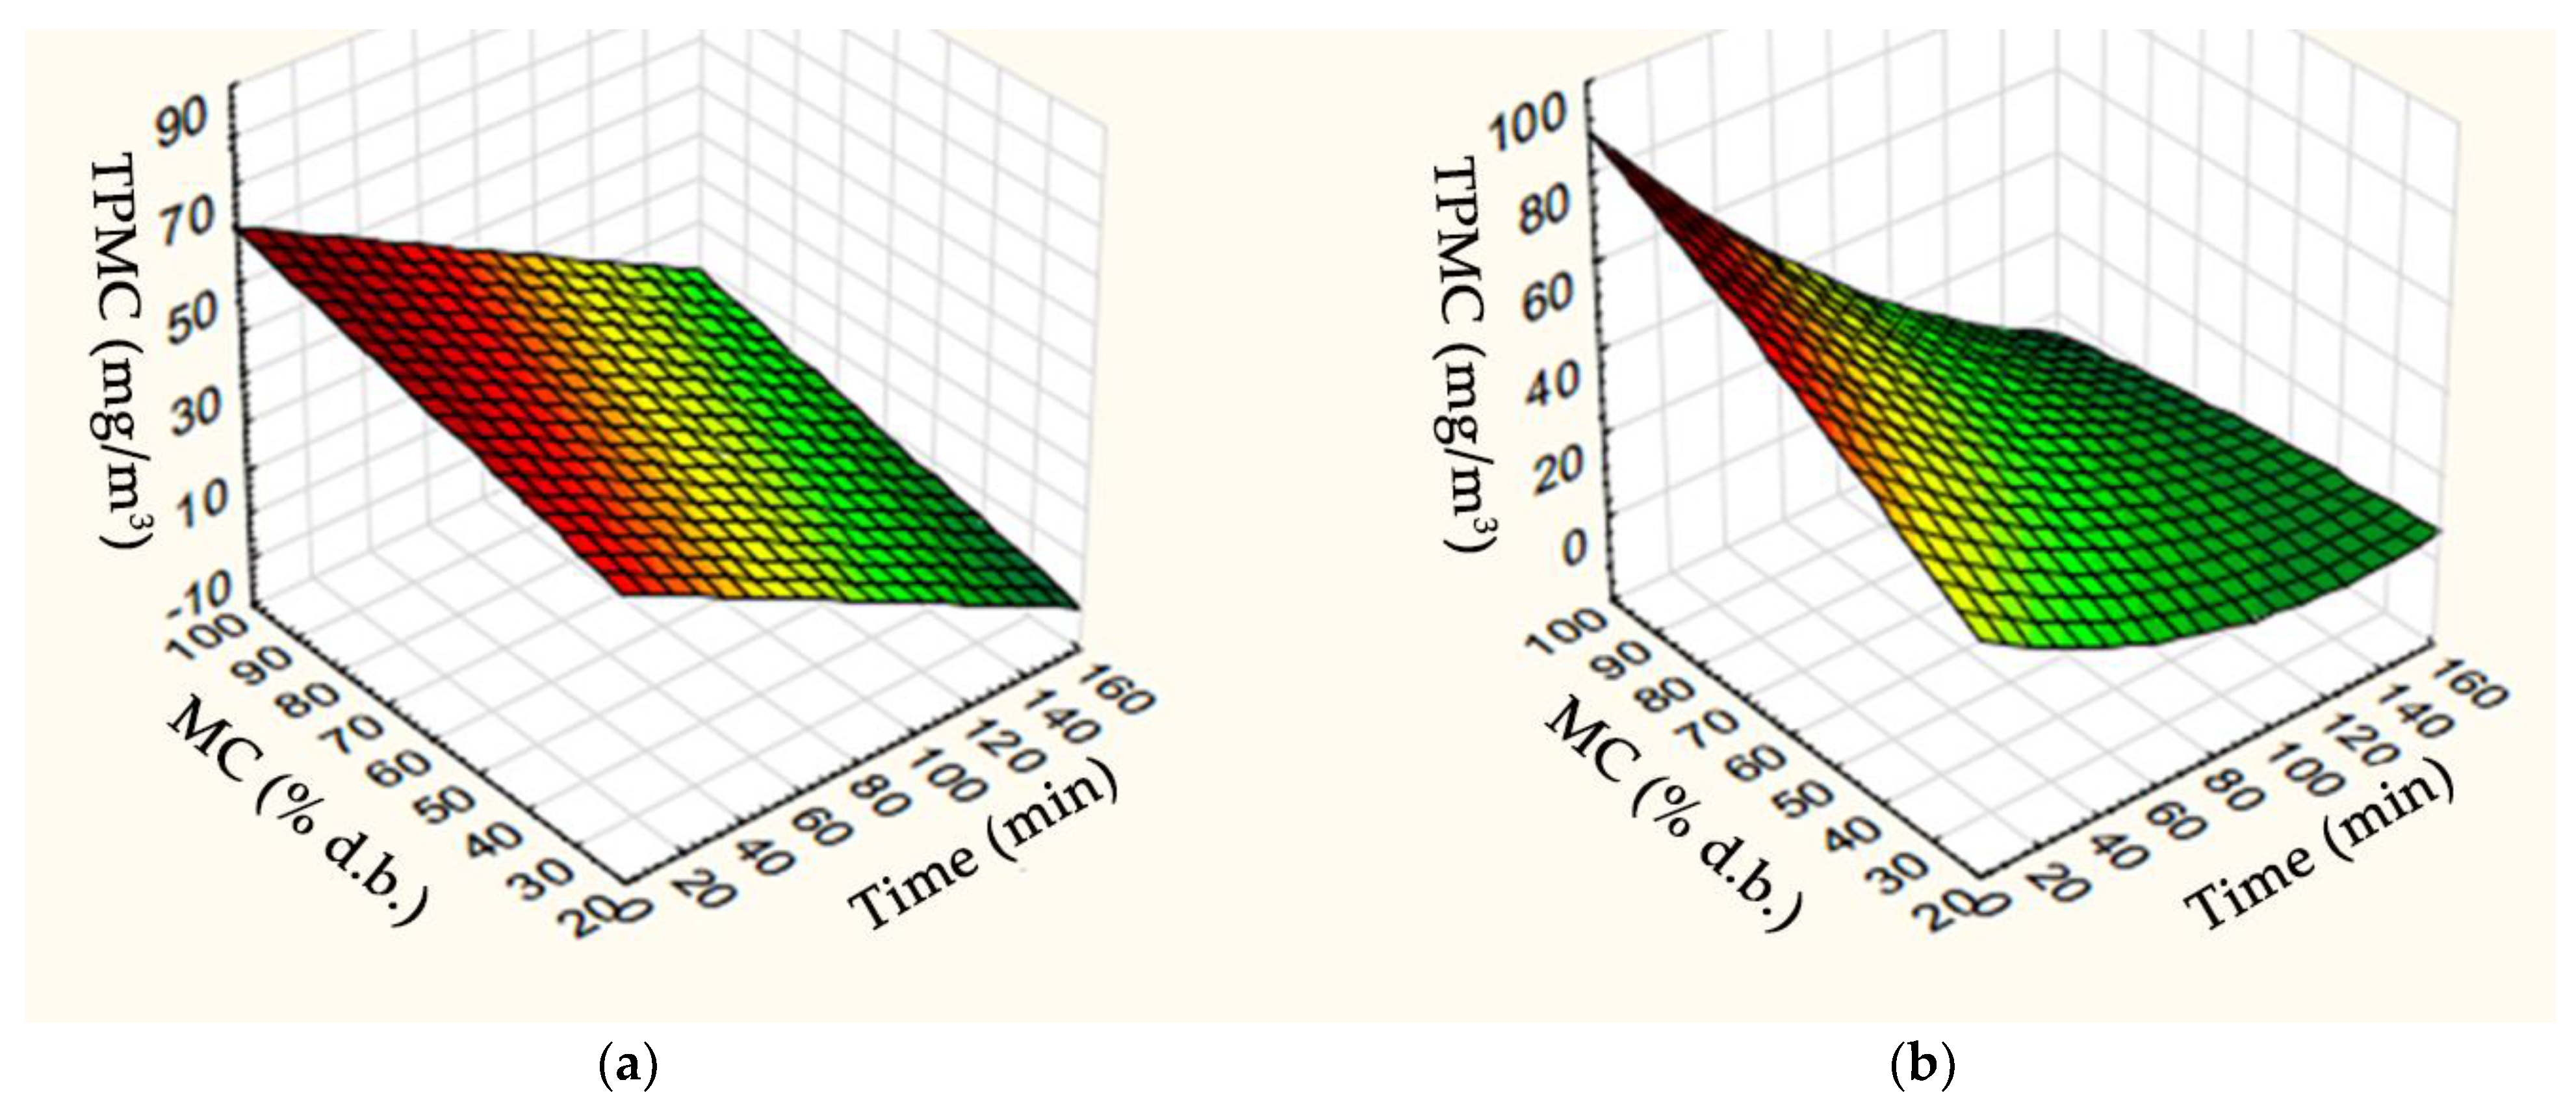
The TPMC values’ 3D surface plots by the first- and second-degree models or Equations (3) and (4) are presented in Figure 8a,b. The x-axis and y-axis present the para rubber wood moisture content and burning time, respectively, while the z-axis shows TPMC values. These results showed that the moisture content of para rubber wood affected TPMC values when compared with the burning time. The p coefficient values in Table 3 were calculated by the least-squares method. As seen in Figure 8a,b, at the combustion period, the response of both models showed a decreasing trend of the TPMC values as the combustion time progressed, synonymous with the MMAD value. The response of the second-degree model showed the effect of moisture content decreasing the TPMC value as the combustion time progressed.
Comparing the TPMC data between the experimental results and prediction values, the second-degree model had a better fit in predicting than the first-degree model, similar to the MMAD data comparison; this result was confirmed by the higher mean of the coefficient of determination (Figure 9a,b), respectively.
Besides wood moisture content and drying time, there may be other combustion rate variables that should be considered, such as air flow rate, pressure, atmosphere relative humidity, oxygen concentration in the atmosphere, and others. For example, water vapor, CO2, N2, and polyaromatic hydrocarbons (PAHs) are usually the result of a fuel-rich combustion at high temperatures (over 900 °C) [32,33,34]. Conversely, this is different from combustion at low temperatures (under 700 °C), resulting in CO, volatile organic compounds, smoke species, and soot coated in oxidized PAHs [32,35].

4. Conclusions

The results conclude that the smoke particle size distribution indicated a single-mode behavior. The highest MMAD and TPMC values were found in the initial combustion period with the highest moisture content for the para rubber wood. The moisture content and wood combustion period affected the change of temperature above the base of the fire. The MMAD and TPMC values increased with an increasing moisture content and a decreasing wood combustion period. In addition, between the first- and second-degree models of the MMAD and TPMC value prediction, it was found that the second-degree model was a better fit, with R2 of 0.8267 and 0.9891, respectively. Future work for this modeling has been improved in the best prediction. The combustion rate, air flow rate, pressure, atmospheres relative humidity, and oxygen concentrations in atmospheres have been considered and analyzed.

Author Contributions

Conceptualization, W.K. and P.D.; writing—Original draft preparation, W.K.; resources, W.K.; writing—Review and editing, P.D. All authors have read and agreed to the published version of the manuscript.

Funding

This research received no external funding.

Institutional Review Board Statement

Not applicable.

Informed Consent Statement

Not applicable.

Acknowledgments

The author thanks King Mongkut’s Institute of Technology Ladkrabang (KMITL), Prince of Chumphon Campus, for providing the opportunity to perform this research. Thanks also go to Chakree Teekapakvisit for proofreading the English and providing suggestions.

Conflicts of Interest

The authors declare no conflict of interest.

References

  1. Kalasee, W.; Tekasakul, S.; Otani, Y.; Tekasakul, P. Characteristic of soot particles produced from rubber-wood combustion. In Proceedings of the 2nd Asian Particle Technology Symposium, Penang, Malaysia, 17–19 December 2003. [Google Scholar]
  2. Tekasakul, P.; Furuuchi, M.; Tekasakul, S.; Chomanee, J.; Otani, Y. Characteristics of PAHs in particles in the atmospheric environment of Hat Yai city, Thailand, and relationship with rubber-wood burning in rubber sheet production. Aerosol Air Qual. Res. 2008, 8, 265–278. [Google Scholar] [CrossRef] [Green Version]
  3. Ekburanawat, J. Biomass pellets electrical power generation system by using gasification technology. RMUTI J. Sci. Technol. 2018, 11, 32–42. [Google Scholar]
  4. Simonelt, B.R.T.; Rogge, W.F.; Mazurek, M.A.; Standley, L.J.; Hildemann, L.M.; Cass, G.R. Lignin pyrolysis products, Lignans, and Resin Acids as specific tracers of plant classes in emissions from biomass combustion. Environ. Sci. Technol. 1993, 27, 2533–2541. [Google Scholar] [CrossRef]
  5. McDonald, J.; Zielinska, B.; Fujita, E.; Sagebiel, J.; Chow, G.; Watson, J. Fine Particle and Gaseous Emission Rates from Residential Wood Combustion. Environ. Sci. Technol. 2000, 34, 2080–2091. [Google Scholar] [CrossRef]
  6. Venkataraman, C.; Negi, G.; Sardar, S.B.; Rastogi, R. Size distributions of polycyclic aromatic hydrocarbons in aerosol emission from biofuel combustion. J. Aerosol Sci. 2002, 33, 503–518. [Google Scholar] [CrossRef]
  7. Shen, G.; Preston, W.; Ebersviller, S.; Williams, C.; Faircloth, J.; Jetter, J.; Hay, M. Polycyclic aromatic hydrocarbons in fine particulate matter emitted from burning kerosene, liquid petroleum gas, and wood fuels in household cook-stoves. Energy Fuels 2017, 31, 3081–3090. [Google Scholar] [CrossRef]
  8. Choosong, T.; Furuuchi, M.; Tekasakul, P.; Tekasakul, S.; Chomanee, J.; Jinno, T.; Hata, M.; Otani, Y. Working environment in a rubber sheet smoking factory polluted by smoke from biomass fuel burning and health influences to worker. J. Ecotechnol. Res. 2007, 13, 91–96. [Google Scholar]
  9. Xu, X.; Cook, R.; Ilacqua, V.; Kan, H.; Talbott, E.; Kearney, G. Studying associations between urinary metabolites of polycyclic aromatic hydrocarbons (PAHs) and cardiovascular diseases in the United States. Sci. Total Environ. 2010, 408, 4943–4948. [Google Scholar] [CrossRef] [PubMed]
  10. Langton, A.R.; Romero, M.T.; Boman, G.V.; Brooks, B.; Wilson, A.J.; Atika, F.; Bartle, K.; Jones, J.M.; Williams, A. A study of smoke formation from wood combustion. Fuel Process. Technol. 2015, 137, 327–332. [Google Scholar] [CrossRef]
  11. Pham, C.; Boongla, Y.; Nghiem, T.; Le, H.; Tang, N.; Toriba, A.; Hayakawa, K. Emission characteristics of polycyclic aAromatic hydrocarbons and nitro-polycyclic aromatic hydrocarbons from open burning of rice straw in the north of Vietnam. Int. J. Environ. Res. Public Health 2019, 16, 2343. [Google Scholar] [CrossRef] [Green Version]
  12. Kalasee, W. Improvement soot particles separation equipments for rubber smoking chamber. Aerosol Air Qual. Res. 2009, 9, 333–341. [Google Scholar] [CrossRef] [Green Version]
  13. Rattanamechaiskul, C.; Junka, N.; Potichalung, J.; Wingwon, T.; Boontum, W.; Srisang, N. Whiteness index prediction of para rubber sheet during hot air drying. KKU Eng. J. 2016, 43, 331–333. [Google Scholar]
  14. Kalasee, W. Improvement of Rubber Smoke Room by Hot Gas Filtration of the Smoke Prior to Direct Heat Transfer with Rubber Sheets. Master’s Thesis, Prince of Songkla University, Songkhla, Thailand, 2005. [Google Scholar]
  15. Furuuchi, M.; Tekasakul, P.; Murase, T.; Otani, Y.; Tekasakul, S.; Bai, Y. Characteristics of particulates emitted from rubber-wood burning. J. Ecotechnol. Res. 2006, 12, 135–139. [Google Scholar]
  16. Choosong, T.; Chomanee, J.; Tekasakul, P.; Tekasakul, S.; Otani, Y.; Hata, M.; Furuuchi, M. Workplace environment and personal exposure of PM and PAHs to workers in natural rubber sheet factories contaminated by wood burning smoke. Aerosol Air Qual. Res. 2010, 10, 8–21. [Google Scholar] [CrossRef]
  17. Hata, M.; Chomanee, J.; Thongyen, T.; Bao, L.; Tekasakul, S.; Tekasakul, P.; Otani, Y.; Furuuchi, M. Characteristics of nanoparticles emitted from burning of biomass fuels. J. Environ. Sci. 2014, 26, 1913–1920. [Google Scholar] [CrossRef] [PubMed]
  18. Chomanee, J.; Tekasakul, S.; Tekasakul, P.; Furuuchi, M.; Otani, Y. Effects of moisture content and burning period on concentration of smoke particles and particle-bound polycyclic aromatic hydrocarbons from rubber-wood combustion. Aerosol Air Qual. Res. 2009, 9, 404–411. [Google Scholar] [CrossRef] [Green Version]
  19. Riyaphan, J.; Phumichai, T.; Neimsuwan, T.; Witayakran, S.; Sungsing, K.; Kaveeta, R.; Phumichai, C. Variability in chemical and mechanical properties of para rubber (Hevea brasiliensis) trees. Sci. Asia 2015, 41, 251–258. [Google Scholar] [CrossRef] [Green Version]
  20. Hinds, W.C. Aerosol Technology, 2nd ed.; John Wiley & Sons: New York, NY, USA, 1999. [Google Scholar]
  21. Smit, H.C.; Meincken, M. Time/temperature combustion profiles of various wood-baseed biofuels. Biomass Bioenergy 2012, 39, 317–323. [Google Scholar] [CrossRef]
  22. Hagen, B.C. Onset of Smoldering and Transition to Flaming. Ph.D. Thesis, University of Bergen, Bergen, Norway, 2013. [Google Scholar]
  23. Meincken, M.; Funk, S. Burning Characteristics of low-cost safety charcoal briquettes made from wood residues and soil for domestic use. Agrofor. Syst. 2015, 89, 357–363. [Google Scholar] [CrossRef]
  24. Munalula, F.; Meincken, M. An evaluation of South African fuelwood with regards to calorific value and environmental impact. Biomass Bioenergy 2009, 33, 415–420. [Google Scholar] [CrossRef]
  25. Mwampamba, T.H.; Owen, M.; Pigaht, M. Opportunities, challenges and way forward for the charcoal briquette industry in sub-Saharan Africa. Energy Sustain. Dev. 2013, 17, 158–170. [Google Scholar] [CrossRef]
  26. Tekasakul, S.; Tantichaowanan, M.; Otani, Y.; Kuruhongsa, P.; Tekasakul, P. Removal of soot particles in rubber smoking chamber by electrostatic precipitator to improve rubber sheet color. Aerosol Air Qual. Res. 2006, 6, 1–14. [Google Scholar] [CrossRef] [Green Version]
  27. Kocbach, A.; Johansen, B.V.; Schwarze, P.E.; Namork, E. Analytical electron microscopy of combustion particles: A comparison of vehicle exhaust and residential wood smoke. Sci. Total. Environ. 2005, 346, 231–243. [Google Scholar] [CrossRef] [PubMed] [Green Version]
  28. Tissari, J.; Hytonen, K.; Lyyränen, J.; Jokiniemi, J. A novel field measurement method for determining fine particle and gas emissions from residential wood combustion. Atmos. Environ. 2007, 41, 8330–8344. [Google Scholar] [CrossRef]
  29. Wiinikka, H.; Gebart, R.; Boman, C.; Bostrom, D.; Ohman, M. Influence of fuel ash composition on high temperature aerosol formation in fixed bed combustion of woody biomass pellets. Fuel 2007, 86, 181–193. [Google Scholar] [CrossRef]
  30. Mopoung, S.; Udeye, V. Characterization and evaluation of charcoal briquettes using banana peel and banana bunch waste for household heating. Am. J. Eng. Appl. Sci. 2017, 10, 353–365. [Google Scholar] [CrossRef] [Green Version]
  31. Bolling, A.; Pagels, J.; Yttri, K.; Barregard, L.; Sallsten, G.; Schwarze, P.; Boman, C. Health effects of residential wood smoke particles: The importance of combustion conditions and physicochemical particle properties. Part. Fibre Toxicol. 2009, 6, 1–6. [Google Scholar]
  32. Battin-Leclerc, F.; Simmie, J.M.; Blurock, E. Cleaner Combustion: Developing Detailed Chemical Kinetic Models, 1st ed.; Springer: New York, NY, USA, 2013; ISBN 978-1-4471-6909-3. [Google Scholar]
  33. Song, M.; Lee, K.; Oh, S.-H.; Bae, M.-S. Impact of polycyclic aromatic hydrocarbons (PAHs) from an asphalt mix plant in a suburban residential area. Appl. Sci. 2020, 10, 4632. [Google Scholar] [CrossRef]
  34. Song, M.; Park, C.; Choi, W.; Park, M.; Lee, K.; Park, K.; Park, S.; Bae, M.-S. Organic molecular marker from regional biomass burning—direct application to source apportionment model. Appl. Sci. 2020, 10, 4449. [Google Scholar] [CrossRef]
  35. Williams, A.; Jones, J.M.; Ma, L.; Pourkashanian, M. Pollutants from the combustion of solid biomass fuels. Prog. Energy Combust. Sci. 2012, 38, 113–137. [Google Scholar] [CrossRef]
Figure 1. Schematic diagram of smoke particle sampling methods for TPMC and MMAD value calculation.
Applsci 11 05649 g001
Figure 2. The phase change temperature in para rubber wood combustion.
Applsci 11 05649 g002
Figure 3. The temperature at 500 mm above the base of the fire for the different para rubber wood moisture contents.
Applsci 11 05649 g003
Figure 4. MMAD emission from the para rubber wood combustion for different wood moisture contents.
Applsci 11 05649 g004
Figure 5. TPMC emission from the para rubber wood combustion for different wood moisture contents.
Applsci 11 05649 g005
Figure 6. MMAD values’ 3D surface plots by the first- and second-degree models: (a) First-degree model; (b) Second-degree model.
Applsci 11 05649 g006
Figure 7. Comparison of predicted and experimental MMAD values: (a) First-degree model; (b) Second-degree model.
Applsci 11 05649 g007
Figure 8. TPMC values’ 3D surface plots by the first- and second-degree models: (a) First-degree model; (b) Second-degree model.
Applsci 11 05649 g008
Figure 9. Comparison of predicted and experimental TPMC values: (a) First-degree model; (b) Second-degree model.
Applsci 11 05649 g009
Table 1. The comparison of MMAD and TPMC value results measured from a normal and modified 8-stage Andersen air sampler system.
Type of Andersen Air Sampler SystemMoisture Content (% d.b.)Burning Period (min)MMAD (Micron)TPMC (mg/m3)
Normal89.70%151.3779.28
301.2962.59
450.9149.14
Modified89.70%151.2577.42
301.1661.51
450.8248.23
Table 2. Coefficient values of first- and second-degree models of MMAD prediction.
Degree in ModelCoefficient
P 0 P 1 P 2 P 3 P 4 P 5
First0.9205−0.00250.0019---
Second0.8661−0.00270.00369.09 × 10−6−2.69 × 10−54.12 × 10−6
Table 3. Coefficient values of first- and second-degree models of TPMC prediction.
Model DegreeCoefficient
P 0 P 1 P 2 P 3 P 4 P 5
First36.1114−0.32610.2518---
Second18.6865−0.33990.83320.0017−0.0051−0.0013
Publisher’s Note: MDPI stays neutral with regard to jurisdictional claims in published maps and institutional affiliations.