Abstract
In otology, visualization and vibratory analysis have been crucial to enhance the success of diagnosis and surgical operation. Optical coherence tomography (OCT) has been employed in otology to obtain morphological structure of tissues non-invasively, owing to the ability of measuring the entire region of tympanic membrane, which compensates the limitations of conventional methods. As a functional extension of OCT, Doppler OCT, which enables the measurement of the motion information with structural data of tissue, has been applied in otology. Over the years, Doppler OCT systems have been evolved in various forms to enhance the measuring sensitivity of phase difference. In this review, we provide representative algorithms of Doppler OCT and various applications in otology from preclinical analysis to clinical experiments and discuss future developments.
1. Introduction
Visualization and functional analysis for vibratory properties of the ear structure (e.g., middle and inner ear) are required to diagnose various ear-related diseases (e.g., acute otitis media, hearing loss, middle ear effusion, bullous myringitis, and traumatic perforation of the tympanic membrane (TM)) in otology [1,2,3,4,5]. As an aspect of the conventional techniques to visualize otologic pathology for otolaryngologists, otoscopes and surgical microscopes have been utilized as diagnostic and operative tools [6,7]. Although otoscopy has been utilized as one of the preferred methods to visualize the surface of TM, field-of-view and visualization of middle ear are limited, which leads to low diagnostic accuracy for ear-related diseases [8]. Though the surgical microscope has made progressed in otological visualization, it is hard to provide the anatomical structure of the middle ear sub-surface, which is essential to succeed a subjective surgical procedure [9]. To provide the structural information in otology to assist the surgery, computed tomography (CT) has been employed to detect the abnormalities of bone [10], and magnetic resonance imaging (MRI) has been utilized to measure the differences of soft tissue [11]. However, applications of these methods are limited because of the low differentiation ability of soft tissue, required radiation exposure, low resolution to visualize the microstructure of TM (MRI), and poor patient tolerance.
Optical coherence tomography (OCT) is a non-invasive and high-resolution imaging technique, which provides three-dimensional morphological information of biological tissues in real-time [12,13,14]. OCT has been widely utilized in various fields, such as ophthalmology [15,16,17], dentistry [18,19,20], otolaryngology [21,22,23,24], industrial fields [25,26,27,28], and even in agriculture [29,30]. Among various otolaryngology applications, OCT has been readily applied in otology, owing to its several advantages over the current standard imaging techniques for TM and the middle ear structure [31,32,33]. Since the resolution of OCT (around 10 μm in the lateral direction and 1 μm to over 10 μm in the axial direction) is comparably higher than other otological methods, such as ultrasound imaging (150 μm with 10 MHz probe), MRI (300 μm), and CT (400 μm), OCT enables characterization of the TM and middle ear structure without the radiation exposure of CT and the impedance matching medium of ultrasound imaging [34,35]. In addition, measuring the anatomical structure of the middle ear is limited using ultrasound imaging due to the highly attenuated ultrasound signal in the air [35].
Doppler OCT has been widely studied as one of the functional OCT modalities to provide movement information of a sample by detecting the phase shift of the obtained interfered signal in addition to the morphological structure [36,37]. The initially proposed Doppler OCT, which was developed in a time-domain, was involved in the imaging of the dynamic blood flow in vivo [36] and bi-directional color Doppler imaging for the visualization of blood flow in tissues [37]. Following the initial introduction of the Doppler technique to OCT, various approaches to calculate the velocity with phase-resolved measurement were investigated [38,39,40]. After the introduction of Fourier-domain OCT (FD-OCT) [41,42], the scanning speed and sensitivity of Doppler OCT were significantly improved [43,44]. Since the initiation of Doppler OCT in the otology field, it has been widely studied and applied to the simulation of membrane-resembled samples [45,46], ex vivo studies including small animal and human cadaveric experiments [47,48], and in vivo experiments for both animals and humans [49,50], while providing a morphological structure with motion information of tissue.
As an aspect of the methodology of Doppler OCT, numerous approaches to improve the sensitivity of the measurement have been demonstrated, including phase-resolved color Doppler [51,52,53], phase-resolved Doppler variance [54,55,56], intensity-based Doppler variance [57,58,59], and optical coherence vibrometry (OCV) [60,61,62]. Phase-resolved color Doppler is one of the widely utilized methods, and extracts the Doppler frequency shift by comparing the phase differences of adjacent A-lines [36]. To utilize both intensity and phase information, there are other phase-resolved techniques, such as phase-resolved Doppler variance [54,55] and filtering-based operations to the original signal [63,64]. The phase-resolved Doppler variance is an autocorrelation algorithm-based method, which uses the complex Doppler signal of each position. The intensity-based Doppler variance method involves both intensity and phase data, while increasing the time interval of each A-line [57,58]. Moreover, OCV enables the measurement of the motion of the cellular structure on a sub-nanometer scale, which uses the phase changes of localized tissue motion by applying a Fourier transform analysis [65].
In this review, we present the representative applications of Doppler OCT for otology from preliminary studies using a phantom membrane to in vivo experiments, including a brief description of each representative principle of the method. Furthermore, we focus on timely updated clinical applications of Doppler OCT in otology and discuss the potential of preclinical and clinical imaging.
2. Principles of Doppler OCT for Otology
The measured interfered spectrum () is simply expressed by subtracting the DC term:
where , is the in-depth coordinate direction, is the random phase noise, and and are the obtained back-scattered signals from the reference arm and sample arm, respectively. To obtain an A-scan of OCT, which is a depth-resolved signal, a Fourier transform is applied to over into the time-domain interfered signal ():
where is the depth and can be expressed as ( is the speed of light and the refractive index of the sample is assumed as 1). In addition, and are the amplitude and the phase of signals located at depth . The optical phase angle is expressed as:
where and are the amplitude and vibration frequency, respectively, and is the center wavelength of the source. To extract the value of Doppler phase shift, Doppler OCT uses the following equation:
where and are phases of the obtained signal at the z pixel in-depth direction of and and is the time interval between adjacent A-lines. Moreover, the equation of the Doppler frequency shift is expressed after differentiation of Equation (3) as:
where is the intrinsic phase noise, which is comparably larger than , and is reciprocal of the sampling frequency. According to the autocorrelation algorithm, Equation (4) becomes:
where and are the real and imaginary parts of the obtained complex signal, respectively. As shown in Equation (6), the phase-resolved Doppler OCT method utilized the calculated phase information to extract a Doppler frequency shift.
To enhance the signal-to-noise ratio (SNR) of the Doppler system, the averaging mask, which consists of multiple sequential A-lines in the transverse direction with pixels in the axial direction, was applied to Equation (6). Averaging in the lateral (temporal) direction for N lines and in the depth direction for M lines can be expressed as:
By averaging for both directions (lateral and depth), Equation (7) reduces the background subtle noise, which leads to the image quality enhancement. Though a larger size of the phase mask ( and ) increases SNR, it requires a large processing time and reduces resolution. Therefore, the appropriate size of the phase mask is needed to choose according to applications.
As another approach to enhance the sensitivity for measuring phase changes, the Fourier frequency analysis approach is applied to Equations (5) and (7). Fourier transformed Equation (5) becomes:
where is the frequency variable and and are the magnitude and the phase of the vibration at the specific frequency, respectively. Therefore, the magnitude of the vibration source at a specific frequency () is expressed as:
By applying a Fourier transform to Equation (7), the obtained phase noise of the system was able to be assumed as the Gaussian noise and phase data were chosen by the applied specific frequency () of the input sound, which enhances SNR for the signal of interest. Therefore, the signal of the region-of-interest was amplified without effect on Gaussian noise, which enables to measure the phase changes at a subnanometer scale [60,61,62].
In this section, we briefly introduced principles of phase-resolved Doppler OCT methods to measure the phase difference and magnitude of vibration in otology. There are various methods of Doppler-related OCT techniques, such as phase-resolved color Doppler, phase-resolved Doppler variance, intensity-based Doppler variance, and optical coherence vibrometry. The phase-resolved color Doppler technique was the first introduced method of Doppler OCT. However, phase-resolved color Doppler is based on time-domain OCT, which has a comparable low scanning speed that is comparably slow. Therefore, other methods of Doppler OCT have been widely studied to compensate for these limitations. Phase-resolved Doppler variance, which applied an autocorrelation algorithm for complex data of each position, has been introduced to measure the phase variance of the sample. In addition, intensity-based Doppler variance was presented, which increases the time interval between adjacent A-lines, to enhance the sensitivity. However, variance-based Doppler methods have been primarily applied to measure the flow. Therefore, we focused on the vibration-related phase and magnitude differences, which are appropriate for otology applications.
3. Doppler OCT for Otology Applications
3.1. Preclinical Simulations Using a Phantom Membrane
To evaluate the Doppler OCT system performance and characterize the effects of the external sound pressure on the membrane, phantom-based simulations are required. As an approach of phantom simulation in otology, the latex membrane, which mimics TM, was utilized as a representative sample with external stimulating speakers. As an initial approach to measure the vibrating pattern of the phantom membrane, Chang et al. [45] captured the rapid periodic oscillating motions of latex membrane using OCV, with a sub-nanometer scale for the motion sensitivity and a micro-second scale for the temporal resolution. By using the experimental configuration shown in Figure 1a, a homogeneous vibrating pattern was measured at opposite vibration phases (0 and π) and a cutaway view (Figure 1b,c), respectively. This study demonstrated the feasibility of Doppler OCT to visualize the vibrating mode according to the external sound stimulation.
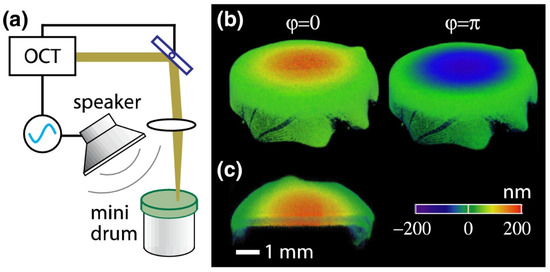
Figure 1.
(a) Schematic of the setup with a latex drum. (b) Vibrography snapshot images (0 and π motion phases) of the vibrating drum at the fundamental frequency of 800 Hz. (c) A cutaway image showing the motion in a cross-section of the membrane. Reprinted with permission from Ref. [45]. © The Optical Society.
To evaluate the performance of the developed Doppler OCT, Jeon et al. [66] preliminarily measured the vibrating patterns of the latex membrane, while the obtained results were compared with in vivo assessments. Before the in vivo experiment, a preliminary study using a latex drum was conducted to evaluate the performance of the Doppler OCT system. Additionally, this result was employed for analysis data to improve the objectivity of the obtained experimental results.
As a different approach to compensate the equivalent anatomical structural characteristics of the latex membrane, a set of two speakers were utilized to make a localized sound distribution to evoke distinct characteristics of the phantom membrane by external sound stimulation by Seong et al. [46]. Measured phase differences of each cross-sectional image and combined enface phase map by Doppler OCT are shown in Figure 2a–c and Figure 2d, respectively. According to the increasing applied frequency of sound (2, 2.2, 2.8, 3.1, and 3.2 kHz), an escalation of the order of circular mode was measured as shown in Figure 2e–h. This study showed the feasibility of Doppler OCT for measuring a complex micro-vibration of the membrane.
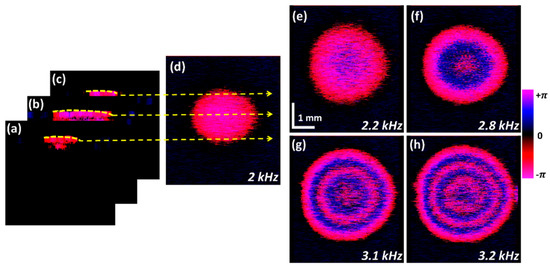
Figure 2.
Process to obtain 2D-ODT enface image representations. (a–d) Process of 2D-ODT enface image extraction. (a–c) depict acquisition of uppermost cross-sectional information. (d) Total ODT-enface representation at 2 kHz frequency. (e–h) show the ODT enface image variations according at 2.2 kHz, 2.8 kHz, 3.1 kHz and 3.2 kHz frequencies, respectively; ODT, optical Doppler tomography. Reprinted with permission from Ref. [46].
3.2. Ex Vivo Studies
Following the results of phantom simulations, ex vivo experiments, including small animals and human cadaveric samples, have proceeded, as a clinical application of Doppler OCT.
3.2.1. Small Animal Studies
Hong et al. [67] initially measured the cochlea of small animal (Mongolian gerbil) ex vivo using Doppler optical coherence microscopy (OCM). In addition to the obtained anatomical structure of the middle ear using OCT, the functional vibrating motion of the middle ear is captured by applying the Doppler technique. This experiment presented the ability of Doppler OCM to discriminate the motion of the cochlea structure (basilar membrane, tectorial membrane, reticular lamina, and outer hair cells).
In addition to the measured two-dimensional (2D) cross-sectional motion data of cochlea in [67], Chang et al. [68] measured the three-dimensional (3D) vibrating pattern of the TM and ossicles of the chinchilla ear using OCV with sub-nanometer scale sensitivity. By measuring the volumetric vibrating information of the manubrium, the distinctive characteristic of each region was obtained. This study revealed the different simulated pathologies derived from the simultaneously measured ossicular motion information with the movement of the TM.
As an aspect of the sensitivity of the Doppler OCT system, Park et al. [69] demonstrated phase-sensitive OCT with a Vernier-tuned distributed Bragg reflector swept laser and measured the vibrations of the mouse middle ear to validate the sensitivity enhancement. Since sensitivity is one of the crucial factors of Doppler OCT performance, multiple attempts have been made to study and improve the sensitivity. Unlike conventional algorithm-based research to enhance the performance, Park et al. [69] utilized a swept laser, which provides a highly linear sweeping rate with high stability and repeatability. Based on these advantages of the Vernier-tuned distributed Bragg reflector swept laser, a simplified systematic design was used and demonstrated the near shot-noise-limited phase sensitivity.
To overcome the frequency limit of applied sound and random phase noise drift, Ramier et al. [47] developed an OCT system for the precise measurement of the phase delay. With this system, both the sound-induced vibrating motion of the TM and ossicles of the chinchilla ear can be simultaneously measured and visualized. As shown in Figure 3, different characteristics of the prominent structures (i.e., manubrium of the malleus, incus, and stapes) were measured according to the applied frequencies (0.5, 6.4, and 15.0 kHz). This study revealed an undescribed vibration mode of chinchilla ossicles measured at high frequencies.
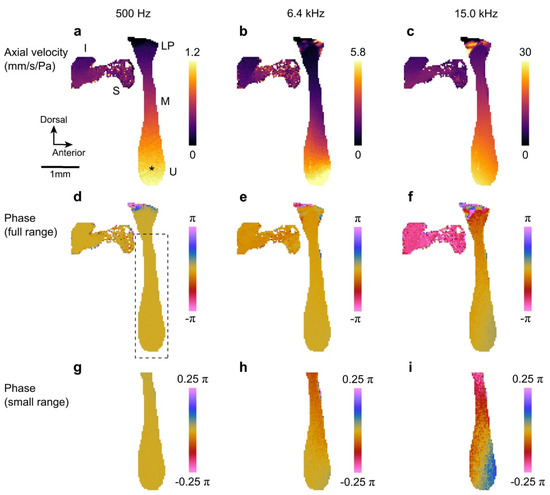
Figure 3.
Projection view of the ossicular chain at 500 Hz (100 dB SPL), 6.4 kHz (108 dB SPL), and 15 kHz (103 dB SPL). (a–c) Axial velocity maps. (d–f) Phase maps relative to the umbo. (g–i) Phase maps of the manubrium (dashed box in d) relative to the umbo. The range of the colormap is reduced to help visualize phase gradients along the manubrium. Labels: manubrium (M), incus (I), stapes (S), lateral process (LP), and umbo (U); * shows the umbo location used as phase reference. Reprinted with permission from Ref. [47]. © The Optical Society.
3.2.2. Human Cadaveric Experiments
Subhash et al. [62] initially employed phase-sensitive OCT to detect the micro-vibrations in the TM and ossicular chain of the cadaveric temporal bone. This study demonstrated the possibility of Doppler OCT to diagnose the middle ear abnormalities by comparing the corresponding vibrating pattern of normal and ossicle-fixed cadavers.
In addition to the obtained 2D vibration data in [62], the 3D vibration patterns of a human cadaver using Doppler OCT with repeated sound stimuli was presented in Burkhardt et al. [48]. As shown in Figure 4, different characteristic of each typical point (e.g., umbo and manubrium of malleus) was measured according to the applied external sound pressure, which is one of the factors to distinguish the normal and abnormal condition. Based on these results, the feasibility of Doppler OCT as a promising technique to investigate and diagnose in otology was verified.
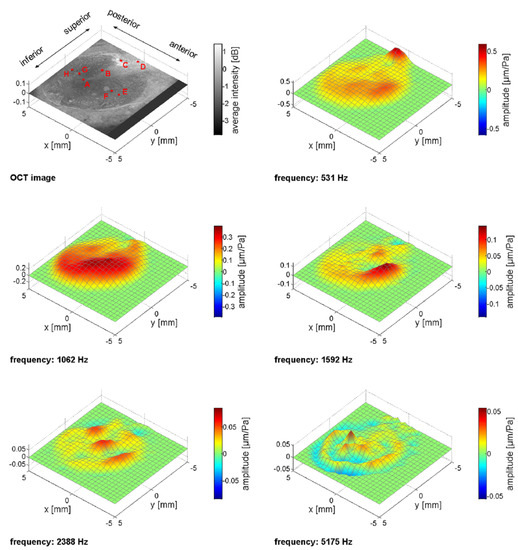
Figure 4.
The upper left image shows the projection (average intensity) of the OCT stack. The quantitative evaluation in Figure 4 was carried out for the red marked points A–H. Point A represents the umbo, the line along A–B–C corresponds to the manubrium of malleus (MM), D indicates the pars flaccida, and E–F–A–G–H show the orientation perpendicular to the MM. The other images present the instantaneous displacement for five characteristic frequencies, where prominent patterns became visible. The scale of the patterns varies between each plot, because of a variation of the amplitude in the order of one magnitude over the whole frequency range. Reprinted with permission from Ref. [48].
Moreover, in terms of detecting the effusions in the tympanic cavity, which is required to choose the appropriate therapeutic strategies, Kirsten et al. [70] demonstrated the possibility of Doppler OCT as a tool to indirectly measure the scattering and transparent fluids. Since non-invasive detection of the fluid in the tympanic cavity is difficult when using otoscopy and tympanometry, the selection of proper therapeutic strategy depends on the expertise of the physician. In contrast, by applying Doppler OCT, oscillation of the TM is able to be non-invasively measured, which enables to detect the scattered and transparent fluids of the tympanic cavity. This study showed the possibility of Doppler OCT as a tool for classifying the effusion in the tympanic cavity.
To provide the functional movement information using otoscopy, the new probe, combining otoscopy with phase-sensitive OCT, was presented in Park et al. [71]. Otoscopy has been widely utilized as a conventional diagnostic tool in otology providing superficial information of the middle ear with limited range. The results of this study obtained using a cadaveric human temporal bone model demonstrated the capability of visualizing the middle ear anatomy on a micro-scale and measuring the vibration on a sub-nanometer scale.
To verify the effect of the moisture degree on the TM, and to understand how it relates to chronic otorrhea and abnormal TM, Jeon et al. [72] analyzed the dependency of the moisture degree with the vibrating phase. As shown in Figure 5, the homogenously moisturized cadaveric TM was exposed and the Doppler signal to each frequency was measured every 30 min. This study revealed a depth-dependent vibration tendency of the applied frequencies according to the declined moisture level on the TM.
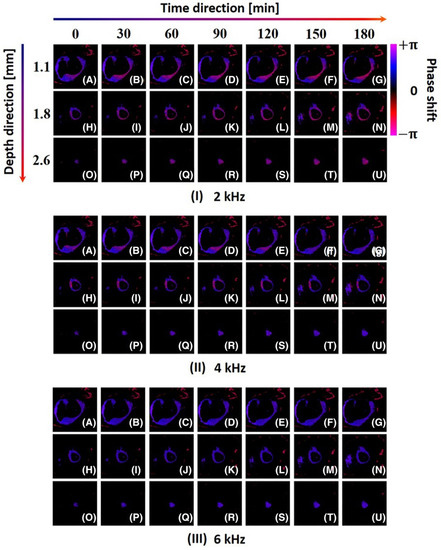
Figure 5.
Depth-dependent enface ODV representation of TM for multiple experimental trials. I (A–G): enface ODV images at 2 kHz frequency and 1.1 mm depth. I (H–N): enface ODV images at 2 kHz frequency and 1.8 mm depth. I (O–U): enface ODV images at 2 kHz frequency and 2.6 mm depth. II (A–G): enface ODV images at 4 kHz frequency and 1.1 mm depth. II (H–N): enface ODV images at 4 kHz frequency and 1.8 mm depth. II (O–U): enface ODV images at 4 kHz frequency and 2.6 mm depth. III (A–G): enface ODV images at 6 kHz frequency and 1.1 mm depth. III (H–N): enface ODV images at 6 kHz frequency and 1.8 mm depth. III (O–U): enface ODV images at 6 kHz frequency and 2.6 mm depth; ODV, optical Doppler vibrography. Reprinted with permission from Ref. [72].
3.3. In Vivo Experiments
As clinical applications of Doppler OCT to otology, various in vivo experiments from mouse to human have been presented.
3.3.1. Small Animal Studies
Gao et al. [73] presented the first measurement of vibrating motion from the apex of an intact mouse cochlea in vivo. To minimize the motion artifact caused by animal motion, a pre-experiment of collecting the data of six different sound stimulus levels and nine frequencies for averaging was conducted. This study demonstrated the advantage of phase-sensitive OCT to detect vibrations of intracochlear tissues in vivo without the risk of opening compared to the laser Doppler vibrometry.
In an attempt to apply proper systems with a different lateral resolution for each application, Page et al. [74] complementary utilized Doppler OCT and Doppler OCM to measure the micromechanical mechanisms of the mammalian middle ear. The cochlear apexes of the gerbil, mouse, and guinea pig were well-measured by cross-section, motion, and phase map, which verified the applicability of Doppler OCT and Doppler OCM to in vivo vibration measurements.
To measure the wide-range dynamics and vibration distribution of tissues, the multi-frequency swept-source OCM using wide-field heterodyne detection was developed in Choi et al. [75]. To capture a full-field volumetric TM data and mapping the spatial information of vibration (i.e., amplitude and phase), an ultrahigh-speed CMOS camera and working-distance enhanced microscope were utilized. The results of this study showed the applicability of multi-frequency swept-source OCT for vibration measurement in vivo experiments and surgeries.
In addition to the obtained wide-range in vivo vibrating motion data of the middle ear, Jeon et al. [76] measured the relative vibrating distribution of distinctive sections of the TM (e.g., malleus, thick region, and thin region) by applying external sound from 1 to 8 kHz. This study demonstrated the feasibility of Doppler OCT for measuring the vibration tendency and analyze the characteristics of each section in the middle ear according to the frequency of externally induced sound.
To verify the feasibility of Doppler OCT as a tool for functional and structural assessment, Jeon et al. [66] measured the vibrating motion of both normal and pathologic TM, as well as the ossicles of rats in vivo. As shown in Figure 6, 3D reconstructed phase shift maps were obtained at the contact area (between the TM and malleus) in the normal condition and in the simulated effusion condition. The results of this study verify the possibility of Doppler OCT extracting the signal-by-signal demodulation method, which enables to distinguish the normal and abnormal bio-tissues.
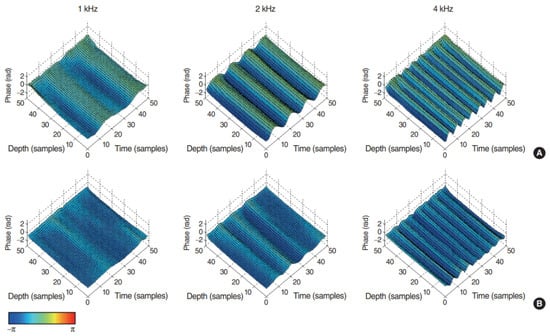
Figure 6.
Three-dimensional reconstruction images of the detected phase shift on the contact area between tympanic membrane (TM) and malleus in (A) normal TM and (B) simulated effusion condition stimulated by 1 kHz, 2 kHz, and 4 kHz pure tone stimuli. Reprinted with permission from Ref. [66].
3.3.2. In Vivo Human Experiments
As a first approach to measure the Doppler OCT signal of the live human middle ear, highly phase-stable Vernier-tuned distributed Bragg-reflector laser with a graphics processing unit were utilized by MacDougall et al. [49]. As shown in Figure 7, representative cross-sectional image and 3D reconstructed volume data were clearly obtained with vibration displacement on the sub-nanometer scale in vivo. The results of this study suggested the clinical applicability of Doppler OCT to detect the vibrating motion of tissues.
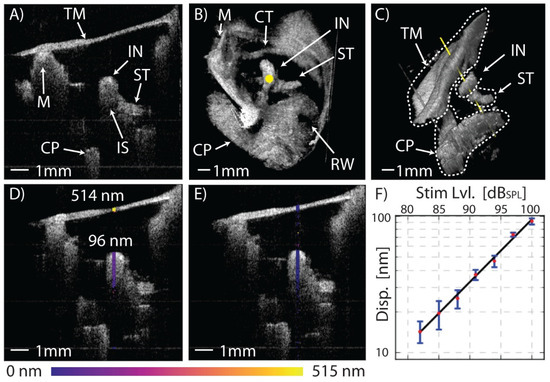
Figure 7.
In vivo, real-time functional imaging of a normal left ear’s response at 1030 Hz. (A) A 1 × 1 cm2 2D cross-section of the middle ear in the transverse plane. (B) A 1 × 1 × 1 cm3 3D volume render of the middle ear as seen from the perspective of the ear canal with the TM digitally removed, and (C) from an inferior-posterior perspective with the TM in place showing the axis of Doppler measurement along the yellow line passing through the incus at the stapedius tendon. Functional measurements of the TM and incus’ peak-to-peak vibrational response at 1 kHz (D) with a 100 dB SPL tone applied to the ear and (E) without a stimulus. (F) Plot of the displacement response versus the sound pressure level showing excellent linearity from 80 dB SPL to 100 dB SPL. Error bars represent ± one standard deviation of the response over the pixels along the axial length of the incus. Tympanic membrane (TM), malleus (M), incus (IN), incudo-stapedial joint (IS), stapedius tendon (ST), chorda tympani nerve (CT), cochlear promontory (CP), round-window niche (RW). Reprinted with permission from Ref. [49]. © The Optical Society.
In addition, the clinical results for distinguishing normal, otosclerosis TM using Doppler OCT was presented in MacDougall et al. [77]. Following the condition of the TM (i.e., normal and otosclerosis), the ratio of umbo to incus vibration level was well-distinguished by comparing the obtained data of each group. This study demonstrated the feasibility of Doppler OCT as a clinical tool of diagnosis and investigation of the status of the middle ear non-invasively.
Moreover, in terms of the scanning range of endoscopic Doppler OCT, an endoscopic phase-resolved Doppler OCT with a wide field-of-view, which allows 3D visualization of the nearly entire TM and measurement of the vibrating motion, was presented in Kirsten et al. [50]. As shown in Figure 8, distinctive oscillating patterns were measured according to the externally induced sound frequencies. This study demonstrated the imaging capability of Doppler OCT as a promising tool of diagnosis in otology.
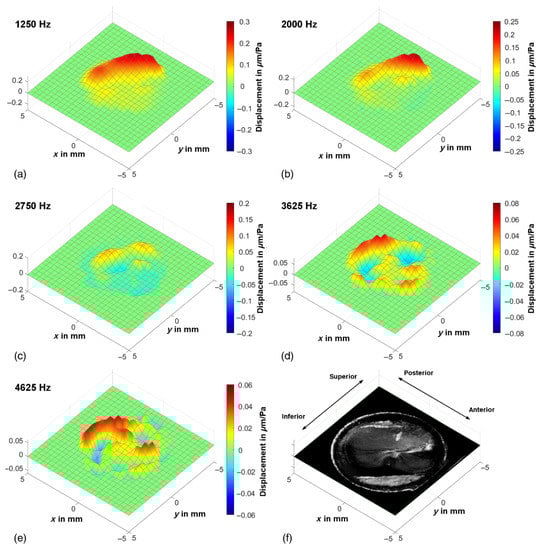
Figure 8.
(a–e) Exemplary oscillation patterns in vivo at characteristic frequencies, which were calculated by postprocessing of one functional OCT measurement, show the deflection of the tympanic membrane. The displacement scale and color map are adjusted to the maximum amplitude of each oscillation pattern. (f) Depth projection of the corresponding OCT volume scan for comparison. The x and y scales are applicable for the working distance of 8 mm. Reprinted with permission from Ref. [50].
As an aspect of the clinical application of Doppler OCT, MacDougall et al. [78] demonstrated the comparison results between normal control and ears with an otosclerotic stapes fixation. By combining the cross-sectional structural imaging with vibration measurement, the reduction of vibration motion with otosclerosis was measured at umbo. The results of this study verified the clinical feasibility of Doppler OCT compared to laser Doppler vibrometry, which has been a widely utilized method in otology.
In addition to the clinical applications with Doppler OCT as a diagnostic tool, Kim et al. [79] presented the highly phase-stable OCV, which was attached to a surgical microscope as an accessory to apply for clinical diagnosis and surgeries in the operation room. The phase sensitivity of this system is under five picometers, which sufficiently exploits the tuning curve of the human TM according to the threshold of hearing. This study demonstrated the possibility of Doppler OCT for providing vibrational information with simultaneous monitoring.
4. Discussion and Conclusions
In otology, OCT has been developed as a promising tool for optical biopsy to diagnose and investigate the ear condition based on the obtained morphological volume data. In addition, as a functional approach to otology applications, Doppler OCT was introduced to identify the vibrating motion of biofilm with anatomical information. Unlike other conventional techniques, including laser Doppler vibrometry (LDV) and stroboscopic holography, Doppler OCT non-invasively provides phase variance data of the large area of the ear with precise targeting in a comparably short time to process. Vibrations stimulated by external sound are not only different for each part of the ear, but also vary depending on various factors, including the condition of the ear, thickness, degree of moisture, and the presence of disease. Therefore, as an aspect of importance for measuring the vibration-related information in otology, based on these advantages, Doppler OCT has demonstrated the potential of a tool, which is based on the phase variance differences of tissue, for clinical applications including rapid diagnosis and assessment of conductive hearing loss (i.e., otosclerosis and tympanosclerosis), cholesteatoma, dimeric TM, hyperkeratosis, cochlear mechanics, and other ossicular diseases. Moreover, Doppler OCT has the capability of emphasizing vibration-based ear condition evaluating factor for hearing-related tests based on the various experimental results, including phantom simulations, ex vivo, and in vivo studies. Due to the fast scanning rate of Doppler OCT, the ear’s responses to the stimulus sound are identified, and these findings enable the feasibility of the method as a new diagnostic approach in otology.
Although continuous development has been studied and various pathologies have been conducted, many other challenges remain to be improved to be able to apply Doppler OCT to the clinical approach of otology. First, the SNR of the system should be improved to obtain a high phase stability, which is degraded by the limited penetration in soft and hard tissue of OCT. Second, selecting an appropriate scanning interval and noise floor level for each system is required to enhance the accuracy of the measuring phase data. Third, the scanning and processing time to obtain vibrating information need to be shortened to provide data in real-time, which is required in otologic surgery. Fourth, reducing the effect of motion artifact of the patient, caused by heartbeat, respiration, and body movement, needs to be addressed. In spite of these challenges, Doppler OCT in otology can be pushed forward through further studies by many research groups on the common clinical use.
In this review, we introduced recent advances of Doppler OCT in otology for clinical and preclinical approaches from a phantom simulation to in vivo experiments. Doppler OCT has been developed over the years to enhance the image contrast, sensitivity, and imaging speed and reduce the processing time. Various experimental development using Doppler OCT has been reported to diagnose and operate in otology, whereas many other challenges remain. Nevertheless, Doppler OCT provides vibration-related information with anatomical morphology for preclinical and clinical diagnosis in otology, which is one of the factors to validate the ear condition. According to the preclinical and clinical recent results of Doppler OCT in the otology field, the potential of Doppler OCT for investigating ear-related diseases and discriminating ear conditions was verified. Therefore, with further technological development focused on the clinical application, Doppler OCT will provide meaningful data for physicians to conduct diagnosis and operations in otology.
Author Contributions
Conceptualization, D.S., C.L., M.J., and J.K.; writing—original draft preparation, D.S.; writing—review and editing, D.S., C.L., M.J., and J.K.; supervision, M.J.; project administration, M.J. and J.K.; funding acquisition, M.J. and J.K. All authors have read and agreed to the published version of the manuscript.
Funding
This research was supported by the Bio & Medical Technology Development Program of the NRF funded by the Korean government, MSIP (2017M3A9E2065282), and was also supported by the Korea Medical Device Development Fund grant funded by the Korean government (the Ministry of Science and ICT, the Ministry of Trade, Industry and Energy, the Ministry of Health & Welfare, the Ministry of Food and Drug Safety) (Project Number: KMDF_PR_20200901_0055, 202011C13).
Institutional Review Board Statement
Not applicable.
Informed Consent Statement
Not applicable.
Data Availability Statement
All data related to the review manuscript are presented in the manuscript in the form of tables and figures.
Conflicts of Interest
The authors declare no conflict of interest.
References
- MacDougall, D.; Landry, T.; Bance, M.; Brown, J.; Adamson, R. Optical coherence tomography for clinical otology. Can. Acoust. 2015, 43, 92–93. [Google Scholar]
- Lieberthal, A.S.; Carroll, A.E.; Chonmaitree, T.; Ganiats, T.G.; Hoberman, A.; Jackson, M.A.; Joffe, M.D.; Miller, D.T.; Rosenfeld, R.M.; Sevilla, X.D. The diagnosis and management of acute otitis media. Pediatrics 2013, 131, e964–e999. [Google Scholar] [CrossRef]
- Ahmed, S.; Shapiro, N.L.; Bhattacharyya, N. Incremental health care utilization and costs for acute otitis media in children. Laryngoscope 2014, 124, 301–305. [Google Scholar] [CrossRef] [PubMed]
- Lin, F.R.; Niparko, J.K.; Ferrucci, L. Hearing loss prevalence in the United States. Arch. Intern. Med. 2011, 171, 1851–1853. [Google Scholar] [CrossRef]
- Liu, X.; Yan, D. Ageing and hearing loss. J. Pathol. J. Pathol. Soc. Great Br. Irel. 2007, 211, 188–197. [Google Scholar] [CrossRef]
- Pelton, S.I. Otoscopy for the diagnosis of otitis media. Pediatric Infect. Dis. J. 1998, 17, 540–543. [Google Scholar] [CrossRef] [PubMed]
- Vartiainen, E.; Kansanen, M. Tympanomastoidectomy for chronic otitis media without cholesteatoma. Otolaryngol. Head Neck Surg. 1992, 106, 230–234. [Google Scholar] [CrossRef]
- Blomgren, K.; Pitkäranta, A. Current challenges in diagnosis of acute otitis media. Int. J. Pediatric Otorhinolaryngol. 2005, 69, 295–299. [Google Scholar] [CrossRef]
- Gantz, B.J.; Wilkinson, E.P.; Hansen, M.R. Canal wall reconstruction tympanomastoidectomy with mastoid obliteration. Laryngoscope 2005, 115, 1734–1740. [Google Scholar] [CrossRef]
- Ruivo, J.; Mermuys, K.; Bacher, K.; Kuhweide, R.; Offeciers, E.; Casselman, J.W. Cone beam computed tomography, a low-dose imaging technique in the postoperative assessment of cochlear implantation. Otol. Neurotol. 2009, 30, 299–303. [Google Scholar] [CrossRef]
- Crane, B.T.; Gottschalk, B.; Kraut, M.; Aygun, N.; Niparko, J.K. Magnetic resonance imaging at 1.5 T after cochlear implantation. Otol. Neurotol. 2010, 31, 1215–1220. [Google Scholar] [CrossRef]
- Huang, D.; Swanson, E.A.; Lin, C.P.; Schuman, J.S.; Stinson, W.G.; Chang, W.; Hee, M.R.; Flotte, T.; Gregory, K.; Puliafito, C.A. Optical coherence tomography. Science 1991, 254, 1178–1181. [Google Scholar] [CrossRef]
- Fercher, A.F. Optical coherence tomography. J. Biomed. Opt. 1996, 1, 157–173. [Google Scholar] [CrossRef] [PubMed]
- Fercher, A.F.; Drexler, W.; Hitzenberger, C.K.; Lasser, T. Optical coherence tomography-principles and applications. Rep. Prog. Phys. 2003, 66, 239. [Google Scholar] [CrossRef]
- Drexler, W.; Morgner, U.; Ghanta, R.K.; Kärtner, F.X.; Schuman, J.S.; Fujimoto, J.G. Ultrahigh-resolution ophthalmic optical coherence tomography. Nat. Med. 2001, 7, 502–507. [Google Scholar] [CrossRef] [PubMed]
- Geitzenauer, W.; Hitzenberger, C.K.; Schmidt-Erfurth, U.M. Retinal optical coherence tomography: Past, present and future perspectives. Br. J. Ophthalmol. 2011, 95, 171–177. [Google Scholar] [CrossRef] [PubMed]
- Seong, D.; Han, S.; Jeon, D.; Kim, Y.; Wijesinghe, R.E.; Ravichandran, N.K.; Lee, J.; Lee, J.; Kim, P.; Lee, D.-E. Dynamic Compensation of Path Length Difference in Optical Coherence Tomography by an Automatic Temperature Control System of Optical Fiber. IEEE Access 2020, 8, 77501–77510. [Google Scholar] [CrossRef]
- Hsieh, Y.-S.; Ho, Y.-C.; Lee, S.-Y.; Chuang, C.-C.; Tsai, J.-c.; Lin, K.-F.; Sun, C.-W. Dental optical coherence tomography. Sensors 2013, 13, 8928–8949. [Google Scholar] [CrossRef]
- Lenton, P.; Rudney, J.; Chen, R.; Fok, A.; Aparicio, C.; Jones, R.S. Imaging in vivo secondary caries and ex vivo dental biofilms using cross-polarization optical coherence tomography. Dent. Mater. 2012, 28, 792–800. [Google Scholar] [CrossRef] [PubMed]
- Lee, J.; Saleah, S.A.; Jeon, B.; Wijesinghe, R.E.; Lee, D.-E.; Jeon, M.; Kim, J. Assessment of the Inner Surface Roughness of 3D Printed Dental Crowns via Optical Coherence Tomography Using a Roughness Quantification Algorithm. IEEE Access 2020, 8, 133854–133864. [Google Scholar] [CrossRef]
- Djalilian, H.R.; Ridgway, J.; Majestic Tam, A.S.; Chen, Z.; Wong, B.J. Imaging the human tympanic membrane using optical coherence tomography in vivo. Otol. Neurotol. 2008, 29, 1091. [Google Scholar] [CrossRef] [PubMed]
- Bibas, A.G.; Podoleanu, A.G.; Cucu, R.G.; Dobre, G.M.; Odell, E.; Boxer, A.B.; O’Connors, A.F.; Gleeson, M.J. Optical coherence tomography in otolaryngology: Original results and review of the literature. In Proceedings of the Lasers in Surgery: Advanced Characterization, Therapeutics, and Systems XIV, San Jose, CA, USA, 13 July 2004; pp. 190–195. [Google Scholar]
- Lee, J.; Wijesinghe, R.E.; Jeon, D.; Kim, P.; Choung, Y.-H.; Jang, J.H.; Jeon, M.; Kim, J. Clinical utility of intraoperative tympanomastoidectomy assessment using a surgical microscope integrated with an optical coherence tomography. Sci. Rep. 2018, 8, 1–8. [Google Scholar] [CrossRef] [PubMed]
- Wijesinghe, R.E.; Lee, J.; Jeon, D.; Kim, P.; Han, S.; Lee, J.; Seong, D.; Lee, D.-E.; Jang, J.H.; Jeon, M. Non-Invasive Optical Screening of Streptococcus Pneumonia Based Inflammatory Changes of the Tympanic Membrane and Mastoid Mucosa in Guinea Pig Otitis Media Using Optical Coherence Tomography. IEEE Photonics J. 2020, 12, 1–11. [Google Scholar] [CrossRef]
- Su, R.; Kirillin, M.; Chang, E.W.; Sergeeva, E.; Yun, S.H.; Mattsson, L. Perspectives of mid-infrared optical coherence tomography for inspection and micrometrology of industrial ceramics. Opt. Express 2014, 22, 15804–15819. [Google Scholar] [CrossRef]
- Prykäri, T.; Czajkowski, J.; Alarousu, E.; Myllylä, R. Optical coherence tomography as an accurate inspection and quality evaluation technique in paper industry. Opt. Rev. 2010, 17, 218–222. [Google Scholar] [CrossRef]
- Seong, D.; Jeon, D.; Wijesinghe, R.E.; Park, K.; Kim, H.; Lee, E.; Jeon, M.; Kim, J. Ultrahigh-speed spectral domain optical coherence tomography up to 1 MHz A-scan rate using space-time division multiplexing. IEEE Trans. Instrum. Meas. 2021, 70, 1–8. [Google Scholar] [CrossRef]
- Wijesinghe, R.E.; Park, K.; Jung, Y.; Kim, P.; Jeon, M.; Kim, J. Industrial resin inspection for display production using automated fluid-inspection based on multimodal optical detection techniques. Opt. Lasers Eng. 2017, 96, 75–82. [Google Scholar] [CrossRef]
- Lee, J.; Lee, S.-Y.; Han, S.; Seong, D.; Wijesinghe, R.E.; Kim, P.; Jeon, M.; Jung, H.-Y.; Kim, J. Multi-directional Morphological Assessment of Single Bacterial Colonies Through Non-invasive Optical Imaging. Ann. Biomed. Eng. 2020, 48, 3014–3023. [Google Scholar] [CrossRef]
- Ravichandran, N.K.; Wijesinghe, R.E.; Shirazi, M.F.; Park, K.; Lee, S.-Y.; Jung, H.-Y.; Jeon, M.; Kim, J. In vivo monitoring on growth and spread of gray leaf spot disease in capsicum annuum leaf using spectral domain optical coherence tomography. J. Spectrosc. 2016, 2016. [Google Scholar] [CrossRef]
- Van der Jeught, S.; Dirckx, J.J.; Aerts, J.R.; Bradu, A.; Podoleanu, A.G.; Buytaert, J.A. Full-field thickness distribution of human tympanic membrane obtained with optical coherence tomography. J. Assoc. Res. Otolaryngol. 2013, 14, 483–494. [Google Scholar] [CrossRef] [PubMed]
- Hubler, Z.; Shemonski, N.D.; Shelton, R.L.; Monroy, G.L.; Nolan, R.M.; Boppart, S.A. Real-time automated thickness measurement of the in vivo human tympanic membrane using optical coherence tomography. Quant. Imaging Med. Surg. 2015, 5, 69. [Google Scholar]
- Monroy, G.L.; Pande, P.; Nolan, R.M.; Shelton, R.L.; Porter, R.G.; Novak, M.A.; Spillman, D.R.; Chaney, E.J.; McCormick, D.T.; Boppart, S.A. Noninvasive in vivo optical coherence tomography tracking of chronic otitis media in pediatric subjects after surgical intervention. J. Biomed. Opt. 2017, 22, 121614. [Google Scholar] [CrossRef]
- Tan, H.E.I.; Santa Maria, P.L.; Wijesinghe, P.; Francis Kennedy, B.; Allardyce, B.J.; Eikelboom, R.H.; Atlas, M.D.; Dilley, R.J. Optical coherence tomography of the tympanic membrane and middle ear: A review. Otolaryngol. Head Neck Surg. 2018, 159, 424–438. [Google Scholar] [CrossRef]
- Landry, T.G.; Rainsbury, J.W.; Adamson, R.B.; Bance, M.L.; Brown, J.A. Real-time imaging of in-vitro human middle ear using high frequency ultrasound. Hear. Res. 2015, 326, 1–7. [Google Scholar] [CrossRef]
- Chen, Z.; Milner, T.E.; Srinivas, S.; Wang, X.; Malekafzali, A.; van Gemert, M.J.; Nelson, J.S. Noninvasive imaging of in vivo blood flow velocity using optical Doppler tomography. Opt. Lett. 1997, 22, 1119–1121. [Google Scholar] [CrossRef]
- Izatt, J.A.; Kulkarni, M.D.; Yazdanfar, S.; Barton, J.K.; Welch, A.J. In vivo bidirectional color Doppler flow imaging of picoliter blood volumes using optical coherence tomography. Opt. Lett. 1997, 22, 1439–1441. [Google Scholar] [CrossRef] [PubMed]
- Westphal, V.; Yazdanfar, S.; Rollins, A.M.; Izatt, J.A. Real-time, high velocity-resolution color Doppler optical coherence tomography. Opt. Lett. 2002, 27, 34–36. [Google Scholar] [CrossRef]
- Yazdanfar, S.; Rollins, A.M.; Izatt, J.A. In vivo imaging of human retinal flow dynamics by color Doppler optical coherence tomography. Arch. Ophthalmol. 2003, 121, 235–239. [Google Scholar] [CrossRef] [PubMed][Green Version]
- Yang, V.X.; Gordon, M.L.; Qi, B.; Pekar, J.; Lo, S.; Seng-Yue, E.; Mok, A.; Wilson, B.C.; Vitkin, I.A. High speed, wide velocity dynamic range Doppler optical coherence tomography (Part I): System design, signal processing, and performance. Opt. Express 2003, 11, 794–809. [Google Scholar] [CrossRef]
- Choma, M.A.; Sarunic, M.V.; Yang, C.; Izatt, J.A. Sensitivity advantage of swept source and Fourier domain optical coherence tomography. Opt. Express 2003, 11, 2183–2189. [Google Scholar] [CrossRef] [PubMed]
- Wojtkowski, M.; Srinivasan, V.J.; Ko, T.H.; Fujimoto, J.G.; Kowalczyk, A.; Duker, J.S. Ultrahigh-resolution, high-speed, Fourier domain optical coherence tomography and methods for dispersion compensation. Opt. Express 2004, 12, 2404–2422. [Google Scholar] [CrossRef] [PubMed]
- Leitgeb, R.A.; Schmetterer, L.; Drexler, W.; Fercher, A.; Zawadzki, R.; Bajraszewski, T. Real-time assessment of retinal blood flow with ultrafast acquisition by color Doppler Fourier domain optical coherence tomography. Opt. Express 2003, 11, 3116–3121. [Google Scholar] [CrossRef] [PubMed]
- Leitgeb, R.; Schmetterer, L.F.; Wojtkowski, M.; Hitzenberger, C.K.; Sticker, M.; Fercher, A.F. Flow velocity measurements by frequency domain short coherence interferometry. In Proceedings of the Coherence Domain Optical Methods in Biomedical Science and Clinical Applications VI, San Jose, CA, USA, 14 June 2002; pp. 16–21. [Google Scholar]
- Chang, E.W.; Kobler, J.B.; Yun, S.H. Subnanometer optical coherence tomographic vibrography. Opt. Lett. 2012, 37, 3678–3680. [Google Scholar] [CrossRef]
- Seong, D.; Kwon, J.; Jeon, D.; Wijesinghe, R.E.; Lee, J.; Ravichandran, N.K.; Han, S.; Lee, J.; Kim, P.; Jeon, M. In situ characterization of micro-vibration in natural latex membrane resembling tympanic membrane functionally using optical doppler tomography. Sensors 2020, 20, 64. [Google Scholar] [CrossRef]
- Ramier, A.; Cheng, J.T.; Ravicz, M.E.; Rosowski, J.J.; Yun, S.-H. Mapping the phase and amplitude of ossicular chain motion using sound-synchronous optical coherence vibrography. Biomed. Opt. Express 2018, 9, 5489–5502. [Google Scholar] [CrossRef]
- Burkhardt, A.; Kirsten, L.; Bornitz, M.; Zahnert, T.; Koch, E. Investigation of the human tympanic membrane oscillation ex vivo by Doppler optical coherence tomography. J. Biophotonics 2014, 7, 434–441. [Google Scholar] [CrossRef]
- MacDougall, D.; Farrell, J.; Brown, J.; Bance, M.; Adamson, R. Long-range, wide-field swept-source optical coherence tomography with GPU accelerated digital lock-in Doppler vibrography for real-time, in vivo middle ear diagnostics. Biomed. Opt. Express 2016, 7, 4621–4635. [Google Scholar] [CrossRef]
- Kirsten, L.; Schindler, M.; Morgenstern, J.; Erkkilä, M.T.; Golde, J.; Walther, J.; Rottmann, P.; Kemper, M.; Bornitz, M.; Neudert, M. Endoscopic optical coherence tomography with wide field-of-view for the morphological and functional assessment of the human tympanic membrane. J. Biomed. Opt. 2018, 24, 031017. [Google Scholar] [CrossRef] [PubMed]
- White, B.R.; Pierce, M.C.; Nassif, N.; Cense, B.; Park, B.H.; Tearney, G.J.; Bouma, B.E.; Chen, T.C.; De Boer, J.F. In vivo dynamic human retinal blood flow imaging using ultra-high-speed spectral domain optical Doppler tomography. Opt. Express 2003, 11, 3490–3497. [Google Scholar] [CrossRef]
- Zhao, Y.; Chen, Z.; Saxer, C.; Xiang, S.; de Boer, J.F.; Nelson, J.S. Phase-resolved optical coherence tomography and optical Doppler tomography for imaging blood flow in human skin with fast scanning speed and high velocity sensitivity. Opt. Lett. 2000, 25, 114–116. [Google Scholar] [CrossRef]
- Zhao, Y.; Brecke, K.M.; Ren, H.; Ding, Z.; Nelson, J.S.; Chen, Z. Three-dimensional reconstruction of in vivo blood vessels in human skin using phase-resolved optical Doppler tomography. IEEE J. Sel. Top. Quantum Electron. 2001, 7, 931–935. [Google Scholar] [CrossRef][Green Version]
- Zhao, Y.; Chen, Z.; Saxer, C.; Shen, Q.; Xiang, S.; de Boer, J.F.; Nelson, J.S. Doppler standard deviation imaging for clinical monitoring of in vivo human skin blood flow. Opt. Lett. 2000, 25, 1358–1360. [Google Scholar] [CrossRef] [PubMed]
- Ren, H.; Brecke, K.M.; Ding, Z.; Zhao, Y.; Nelson, J.S.; Chen, Z. Imaging and quantifying transverse flow velocity with the Doppler bandwidth in a phase-resolved functional optical coherence tomography. Opt. Lett. 2002, 27, 409–411. [Google Scholar] [CrossRef] [PubMed]
- Ren, H.; Ding, Z.; Zhao, Y.; Miao, J.; Nelson, J.S.; Chen, Z. Phase-resolved functional optical coherence tomography: Simultaneous imaging of in situ tissue structure, blood flow velocity, standard deviation, birefringence, and Stokes vectors in human skin. Opt. Lett. 2002, 27, 1702–1704. [Google Scholar] [CrossRef] [PubMed]
- Liu, G.; Chou, L.; Jia, W.; Qi, W.; Choi, B.; Chen, Z. Intensity-based modified Doppler variance algorithm: Application to phase instable and phase stable optical coherence tomography systems. Opt. Express 2011, 19, 11429–11440. [Google Scholar] [CrossRef] [PubMed]
- Liu, G.; Jia, W.; Sun, V.; Choi, B.; Chen, Z. High-resolution imaging of microvasculature in human skin in-vivo with optical coherence tomography. Opt. Express 2012, 20, 7694–7705. [Google Scholar] [CrossRef]
- Kuo, W.C.; Kuo, Y.M.; Syu, J.P.; Wang, H.L.; Lai, C.M.; Chen, J.W.; Lo, Y.C.; Chen, Y.Y. The use of intensity-based Doppler variance method for single vessel response to functional neurovascular activation. J. Biophotonics 2018, 11, e201800017. [Google Scholar] [CrossRef] [PubMed]
- Wang, R.K.; Nuttall, A.L. Phase-sensitive optical coherence tomography imaging of the tissue motion within the organ of Corti at a subnanometer scale: A preliminary study. J. Biomed. Opt. 2010, 15, 056005. [Google Scholar] [CrossRef]
- Lin, N.C.; Hendon, C.P.; Olson, E.S. Signal competition in optical coherence tomography and its relevance for cochlear vibrometry. J. Acoust. Soc. Am. 2017, 141, 395–405. [Google Scholar] [CrossRef]
- Subhash, H.M.; Jacques, S.L.; Nguyen-Huynh, A.T.; Nuttall, A.L.; Wang, R.K.; Choudhury, N. Feasibility of spectral-domain phase-sensitive optical coherence tomography for middle ear vibrometry. J. Biomed. Opt. 2012, 17, 060505. [Google Scholar] [CrossRef]
- Yuan, Z.; Luo, Z.; Ren, H.; Du, C.; Pan, Y. A digital frequency ramping method for enhancing Doppler flow imaging in Fourier-domain optical coherence tomography. Opt. Express 2009, 17, 3951–3963. [Google Scholar] [CrossRef]
- Tao, Y.K.; Davis, A.M.; Izatt, J.A. Single-pass volumetric bidirectional blood flow imaging spectral domain optical coherence tomography using a modified Hilbert transform. Opt. Express 2008, 16, 12350–12361. [Google Scholar] [CrossRef]
- Choma, M.A.; Ellerbee, A.K.; Yang, C.; Creazzo, T.L.; Izatt, J.A. Spectral-domain phase microscopy. Opt. Lett. 2005, 30, 1162–1164. [Google Scholar] [CrossRef]
- Jeon, D.; Cho, N.H.; Park, K.; Kim, K.; Jeon, M.; Jang, J.H.; Kim, J. In vivo vibration measurement of middle ear structure using Doppler optical coherence tomography: Preliminary study. Clin. Exp. Otorhinolaryngol. 2019, 12, 40. [Google Scholar] [CrossRef]
- Hong, S.S.; Freeman, D.M. Doppler optical coherence microscopy for studies of cochlear mechanics. J. Biomed. Opt. 2006, 11, 054014. [Google Scholar] [CrossRef]
- Chang, E.W.; Cheng, J.T.; Röösli, C.; Kobler, J.B.; Rosowski, J.J.; Yun, S.H. Simultaneous 3D imaging of sound-induced motions of the tympanic membrane and middle ear ossicles. Hear. Res. 2013, 304, 49–56. [Google Scholar] [CrossRef]
- Park, J.; Carbajal, E.F.; Chen, X.; Oghalai, J.S.; Applegate, B.E. Phase-sensitive optical coherence tomography using an Vernier-tuned distributed Bragg reflector swept laser in the mouse middle ear. Opt. Lett. 2014, 39, 6233–6236. [Google Scholar] [CrossRef]
- Jeon, B.; Lee, J.; Jeon, D.; Kim, P.; Jang, J.H.; Wijesinghe, R.E.; Jeon, M.; Kim, J. Functional assessment of moisture influenced cadaveric tympanic membrane using phase shift-resolved optical Doppler vibrography. J. Biophotonics 2020, 13, e201900202. [Google Scholar] [CrossRef] [PubMed]
- Kirsten, L.; Baumgärtner, S.; Erkkilä, M.T.; Golde, J.; Kemper, M.; Stoppe, T.; Bornitz, M.; Neudert, M.; Zahnert, T.; Koch, E. Doppler optical coherence tomography as a promising tool for detecting fluid in the human middle ear. Curr. Dir. Biomed. Eng. 2016, 2, 443–447. [Google Scholar] [CrossRef]
- Park, J.; Cheng, J.T.; Ferguson, D.; Maguluri, G.; Chang, E.W.; Clancy, C.; Lee, D.J.; Iftimia, N. Investigation of middle ear anatomy and function with combined video otoscopy-phase sensitive OCT. Biomed. Opt. Express 2016, 7, 238–250. [Google Scholar] [CrossRef] [PubMed]
- Gao, S.S.; Raphael, P.D.; Wang, R.; Park, J.; Xia, A.; Applegate, B.E.; Oghalai, J.S. In vivo vibrometry inside the apex of the mouse cochlea using spectral domain optical coherence tomography. Biomed. Opt. Express 2013, 4, 230–240. [Google Scholar] [CrossRef] [PubMed]
- Page, S.; Ghaffari, R.; Freeman, D.M. Doppler optical coherence microscopy and tomography applied to inner ear mechanics. AIP Conf. Proc. 2015, 1703, 040002. [Google Scholar] [CrossRef]
- Choi, S.; Sato, K.; Ota, T.; Nin, F.; Muramatsu, S.; Hibino, H. Multifrequency-swept optical coherence microscopy for highspeed full-field tomographic vibrometry in biological tissues. Biomed. Opt. Express 2017, 8, 608–621. [Google Scholar] [CrossRef] [PubMed]
- Jeon, D.; Kim, J.K.; Jeon, M.; Kim, J. Measurement of vibrating tympanic membrane in an in vivo mouse model using Doppler optical coherence tomography. J. Imaging 2019, 5, 74. [Google Scholar] [CrossRef]
- Mac Dougall, D.; Morrison, C.; Bance, M.; Morris, D.; Adamson, R.B. Clinical Doppler-mode optical coherence tomography of the middle ear. AIP Conf. Proc. 2018, 1965, 110001. [Google Scholar] [CrossRef]
- MacDougall, D.; Morrison, L.; Morrison, C.; Morris, D.P.; Bance, M.; Adamson, R.B. Optical coherence tomography doppler vibrometry measurement of stapes vibration in patients with stapes fixation and normal controls. Otol. Neurotol. 2019, 40, e349–e355. [Google Scholar] [CrossRef] [PubMed]
- Kim, W.; Kim, S.; Huang, S.; Oghalai, J.S.; Applegate, B.E. Picometer scale vibrometry in the human middle ear using a surgical microscope based optical coherence tomography and vibrometry system. Biomed. Opt. Express 2019, 10, 4395–4410. [Google Scholar] [CrossRef]


Publisher’s Note: MDPI stays neutral with regard to jurisdictional claims in published maps and institutional affiliations. |
© 2021 by the authors. Licensee MDPI, Basel, Switzerland. This article is an open access article distributed under the terms and conditions of the Creative Commons Attribution (CC BY) license (https://creativecommons.org/licenses/by/4.0/).