Article

Effects of Garden Amendments on Soil Available Lead and Plant Uptake in a Contaminated Calcareous Soil

1
Department of Plant Sciences, University of Wyoming, 1000 E. University Ave., Laramie, WY 82071-3354, USA
2
Program in Ecology, University of Wyoming, 1000 E. University Ave., Laramie, WY 82071-3354, USA
*
Author to whom correspondence should be addressed.
Appl. Sci. 2021, 11(13), 5777; https://doi.org/10.3390/app11135777
Submission received: 1 June 2021 / Revised: 16 June 2021 / Accepted: 19 June 2021 / Published: 22 June 2021
(This article belongs to the Special Issue Novel Technologies for Heavy Metals Removal from Contaminated Soil)

Abstract

:
Gardeners use organic and inorganic substances to enhance plant growth, which can inadvertently impact soil solubility and plant uptake of unknown contaminants. Consequently, human exposure can increase through gardening and consumption of produce grown in potentially contaminated soils. A greenhouse experiment was established to examine the effects of biochar, compost, and common inorganic fertilizer on soil lead (Pb) availability for radish (Raphanus sativus, L.) and lettuce (Lactuca sativa, L.) grown in a calcareous soil containing excessively high lead (Pb), along with Pb accumulation in radish tissue. Results indicate that soil amended with biochar and planted to radish saw an 18% reduction in available Pb and an 11% decrease in plant tissue content when compared to the control. Compost showed an 8% reduction in available Pb, but a 19% increase in tissue content. In contrast, soil with inorganic fertilizer planted to radish increased in both soil Pb availability by 11% and Pb tissue content by 40%. Adding water-soluble inorganic fertilizers to contaminated calcareous soils without added organic matter enhances soil Pb availability and often asymptomatic plant Pb bioaccumulation. In conclusion, gardeners are encouraged to test their soils for contamination and apply biochar in combination with compost, as this combination is recommended to improve soil health and aid in overcoming initial N deficiencies induced by biochar.

1. Introduction

Urban gardening has historically been an intricate part of the global food supply, including in the United States (U.S.). As an example, urban gardening was promoted by the U.S. government during the Great Depression and both World Wars as means to reduce food shortages [1,2]. More recently, urban population growth coupled with economic and political changes have increasingly undermined urban food distribution networks and created food deserts, thus inspiring a renewed interest in urban gardening [3].
Gardening as an activity plays an important role in alleviating many issues that are amplified by social isolation (COVID-19 restrictions, for example), or are often driven by economic instability. Research suggests a variety of benefits for both individuals and the community, including: (1) reduced carbon (C) “food-print” [4]; (2) health benefits from increased physical activity [1,2,5]; (3) improved psychological and social well-being [1,5,6]; and (4) improved nutrition [3], food security [1,3], and access to fresh food [1]. It can be especially beneficial to community-building and connectivity in loose-knit urban environments by facilitating improved networks and organizational capacity in lower income and minority neighborhoods [1,6].
However, the benefits of urban gardening should be balanced with potential risks of exposure to contaminants, such as heavy metals like lead (Pb). Heavy metals do not decompose biologically or chemically, but instead accumulate over time in the soil matrix and soil organisms where they can persist indefinitely, posing a risk to human health [7,8]. Though heavy metals exist naturally in the environment, their concentrations are often elevated in urban areas. For example, Pb occurs naturally in the Earth’s crust at concentrations below 50 mg kg−1 [9], but concentrations of Pb in urban soils can reach 150 mg kg−1 or greater, with some soils having total Pb concentrations in excess of 1000 mg kg−1 [3,10].
The main sources of heavy metals in urban soils are atmospheric fallout from coal and fuel combustion, vehicle emissions, mining activities, fertilizer use, municipal solid waste disposal, and industrial waste [11,12,13,14]. Lead specifically was historically used in Pb-based paints, leaded gasoline, and pest and weed control chemicals. Although the threat posed by Pb-based paint, which was common in the U.S. until 1978, is generally well-known, research on urban gardeners suggests a low level of awareness of soil pollutants [15]. For example, a survey of 121 urban farmers and gardeners from Kansas, Missouri, and Washington states, found that over 80% were interested in learning more about soil contamination and testing in urban areas [16].
Lead primarily accumulates in the surface layer of urban soils [9]. It exists as a free metal ion—the most available form for plants—in the soil solution and can also complex with organic and inorganic soil constituents, like humic acid and carbonate (CO32−), respectively [9]. Unlike some heavy metals (cadmium, for instance), which have high water solubility and mobility in soil due to weak sorption to organic matter [17,18], Pb has a high affinity for particle surfaces [9]. As a result, it strongly binds to organic and colloidal materials, limiting its solubility [9]. For this reason, only a small amount of the total Pb present in soil is available for plant uptake [9].
Exposure to Pb, which has no known biological function in animals or plants [9], occurs via inhalation, dermal contact, and ingestion, typically through food crops grown in contaminated soils [3,19,20,21]. Plants sometimes accumulate heavy metals in concentrations that are detrimental to humans before phytotoxic effects are visible [22]. Even low-level exposure to Pb is associated with many adverse effects in humans, especially in children, who are particularly at risk due to increased direct contact with soils and associated hand-to-mouth play [3,23]. These include neurological disorders, such as depression and schizophrenia, the effects of which are particularly concerning in children because they can impair learning and memory, affect behavior and mood, and alter neuromotor and neurosensory functions [23].
Lead is also known to impair plant growth, root elongation, seed germination, seedling development, transpiration, chlorophyll production, lamellar organization in the chloroplast, and cell division [9]. In a study on the effects of two different Pb concentrations (0.1 and 0.5 mM) on radish (Raphanus sativus, L.), Gopal et al. (2008) observed a 30–50% reduction in dry weight compared with the control, along with decreased chlorophyll concentrations [24]. However, the impact of Pb on plants varies by species and depends on several factors, including Pb concentration, duration of exposure, and stage of plant development [9]. For most species, the majority of absorbed lead (approximately 95% or more) is accumulated in the roots [9]. Some plants, specifically expanded hypocotyl root vegetables, are more likely to accumulate Pb in their core [3]. These include popular root vegetables among gardeners, like Daucus carota, L. (carrot), Brassica rapa, L. (turnip), Beta vulgaris, L. (beets), and radish [3].
Evidence also suggests that heavy metals have serious adverse effects on soil health through changes in microbiota populations and community structures, and can inhibit important microbial metabolic processes like respiration, denitrification, and enzymatic activity [25]. Moreover, heavy metals can negatively impact soil physicochemical properties, including soil organic C sequestration and degradation [7,26]. Lead contaminated soils are often associated with low soil organic matter (OM); low soil fertility, including nitrogen (N) and phosphorous (P) availability; and micronutrient imbalances [27].
Gardeners apply a variety of substances (hereinafter “amendments”) to their gardens to improve vegetable production, stabilize pH, and to condition the soil. These amendments effect the physicochemical properties of the soil in different ways, which can, in turn, influence Pb availability in soil, along with plant uptake [28,29]. Soil pH, for example, is one of the most important factors determining heavy metal availability in soil [30,31]. In general, for cationic metal species like Pb+2, a higher pH results in decreased availability, while anions (e.g., arsenic (As−3)) become more available [19]. Organic matter (OM) content is also a significant factor influencing the availability of heavy metals and can reduce the mobility of many heavy metals through sorption to surfaces, along with precipitation and complexation reactions [7]. Other important soil factors affecting heavy metal availability include: (1) clay content, and thus cation exchange capacity (CEC), as clays are negatively charged [19]; (2) time, which results in heavy metals gradually shifting into less-accessible soil pools as they move into clay interlayer regions and form inner-sphere surface complexes with clay lattices [19,32]; (3) soil texture, wherein coarse-textured soils (greater sand content) are expected to have greater availability than fine-textured soils (greater clay content) [19]; (4) amount of heavy metal(s) present [33]; (5) metal ion speciation and, in particular, the concentration of free metal ions present [34,35]; and (6) soil oxidation-reduction (redox) potential, particularly in flooded soils [19,36].
Biochar is a carbon-rich organic material produced through pyrolysis of straw, manure, wood, and other agricultural wastes under a limited or no-oxygen environment [37,38]. Interest in biochar has grown significantly in recent years as demand increases for low-cost, environmentally-friendly technologies to address soil and water contamination, and to increase soil health. Used in a variety of applications, research shows that biochar can play an important role in increasing soil C sequestration [39], reducing NO2 emissions [40], and can decrease fertilizer needs and nutrient leaching [41]. It also has significant capacity for adsorption of both organic and inorganic compounds, including heavy metals [7,42]. A recent meta-analysis of 74 scientific papers found that amendment with biochar resulted in overall decreases in soil bioavailable metal concentrations of Cd, Pb, and Cu by 52%, 46%, and 29%, respectively, and reductions in the average concentrations in plant tissues by 38%, 39%, and 25% [43].
Persisting in soil for centuries [39], biochar is highly recalcitrant due to its stable, aromatic structure [44] and has a large surface area and porosity [43,45]. The total surface area correlates with sorption and retention of both nutrients and contaminants, while pore volume affects water availability and soil aeration [46]. Oxygen-containing functional groups, especially carboxyl groups, on biochar’s surface result in a net negative charge, increasing soil cation exchange capacity (CEC) and adsorption capacity [7,42].
Pyrolysis temperature is one of the most important factors influencing the molecular structure, nutrient composition, and physicochemical properties of biochar [46,47]. In general, surface area increases at greater pyrolysis temperatures [46,47], as does pore volume [46]. Higher pyrolysis temperatures also produce greater ash and carbon content and a higher pH [46,47], but lower N content [47]. The nutrient composition of biochar is also strongly influenced by its feedstock source [46]. A meta-data analysis of over 5400 peer-reviewed journal articles suggests that the greatest total N content, along with total P, K, Ca, and Mg, are found in biochar produced from manures/biosolids, whereas wood biochar typically has the lowest concentrations [46].
Compost, a relatively popular soil amendment among urban gardeners, consists of both readily decomposable materials and humic substances derived from raw organic materials, such as manure and plant biomass. Like biochar, negatively charged functional groups on its surface can help limit heavy metal availability [48]. Further, compost is rich in humic substances, which are responsible for many complex chemical reactions in soil due to their ability to interact with metal ions, minerals, oxides, hydroxides, and organic contaminants to form water-soluble and water-insoluble complexes [8,19,48]. Evidence suggests that humic substances like humic and fulvic acids enhance plant growth and stimulate nutrient uptake [49]. Compost has also been shown to reduce the available portion of heavy metals in both soil and plant tissue [50,51,52]. For instance, one study on the influence of green waste compost applied at 2%, 5%, and 10% (w/w) to soils spiked with 500 mg kg−1 of lead nitrate showed a reduction of up to 1.6-fold in Pb uptake by pak choi cabbage (Brassica campestris, L.) as compared to the control soil [53]. The same study also found that the concentration of available Pb in soil decreased by 35% in comparison to a control when compost was applied at a rate of 10% (w/w).
Many gardeners also augment their soil nutrient status through application of inorganic fertilizers. Studies on inorganic fertilizers present mixed findings with respect to changes in soil properties and effect on heavy metal availability, likely due to the wide range of chemical forms and nutrient ratios, effects on soil pH, and because heavy metals interact differently with different nutrients [54]. It is generally suggested that Pb mobility is increased by inorganic fertilizers containing ammonium (NH4), while phosphates have been found to increase the negative charge of soil, which in turn enhances heavy metal sorption, decreasing Pb availability [55,56]. In contrast, He et al. (2018) suggest that K may exchange with Pb ions on soil surfaces, increasing Pb availability [57].
Gardening is a popular local practice in Laramie, the fourth largest town in Wyoming [58]. The region is characterized by very low temperatures (average of 4.4 °C) and precipitation (<300 mm annually), along with a typical growing season of only 85 to 115 days. Nevertheless, Albany County, where Laramie is situated, has over 450 farms, resulting in over 6.3 million dollars in crop sales annually [59]. Residents of Laramie commonly use hoop and greenhouses to extend the growing season, particularly for specialty and warm-season crops, along with managed irrigation. The city is also home to several smallholder farms that sell produce through the farmers market and offer community-supported agriculture (CSA) programs to residents.
Exposure to Pb, especially over time, causes serious injury to both humans and the environment, including impaired crop performance and damage to overall soil health. Gardeners in Laramie and other urban areas may be unaware of the risks for exposure through vegetable production in their yards, community gardens, and other cultivatable city spaces like alleys, as well as the influence of common amendments on Pb availability in soil. It is therefore imperative to investigate and educate gardeners on effective, economical technologies that are widely available, and which can reduce transfer of Pb from soil to crops while also addressing damage to soil function caused by heavy metals like Pb. The main objective of this study was to quantify the effects of three locally-produced soil amendments on the physicochemical properties and Pb availability of a native calcareous soil, as well as assess their impact on plant uptake.

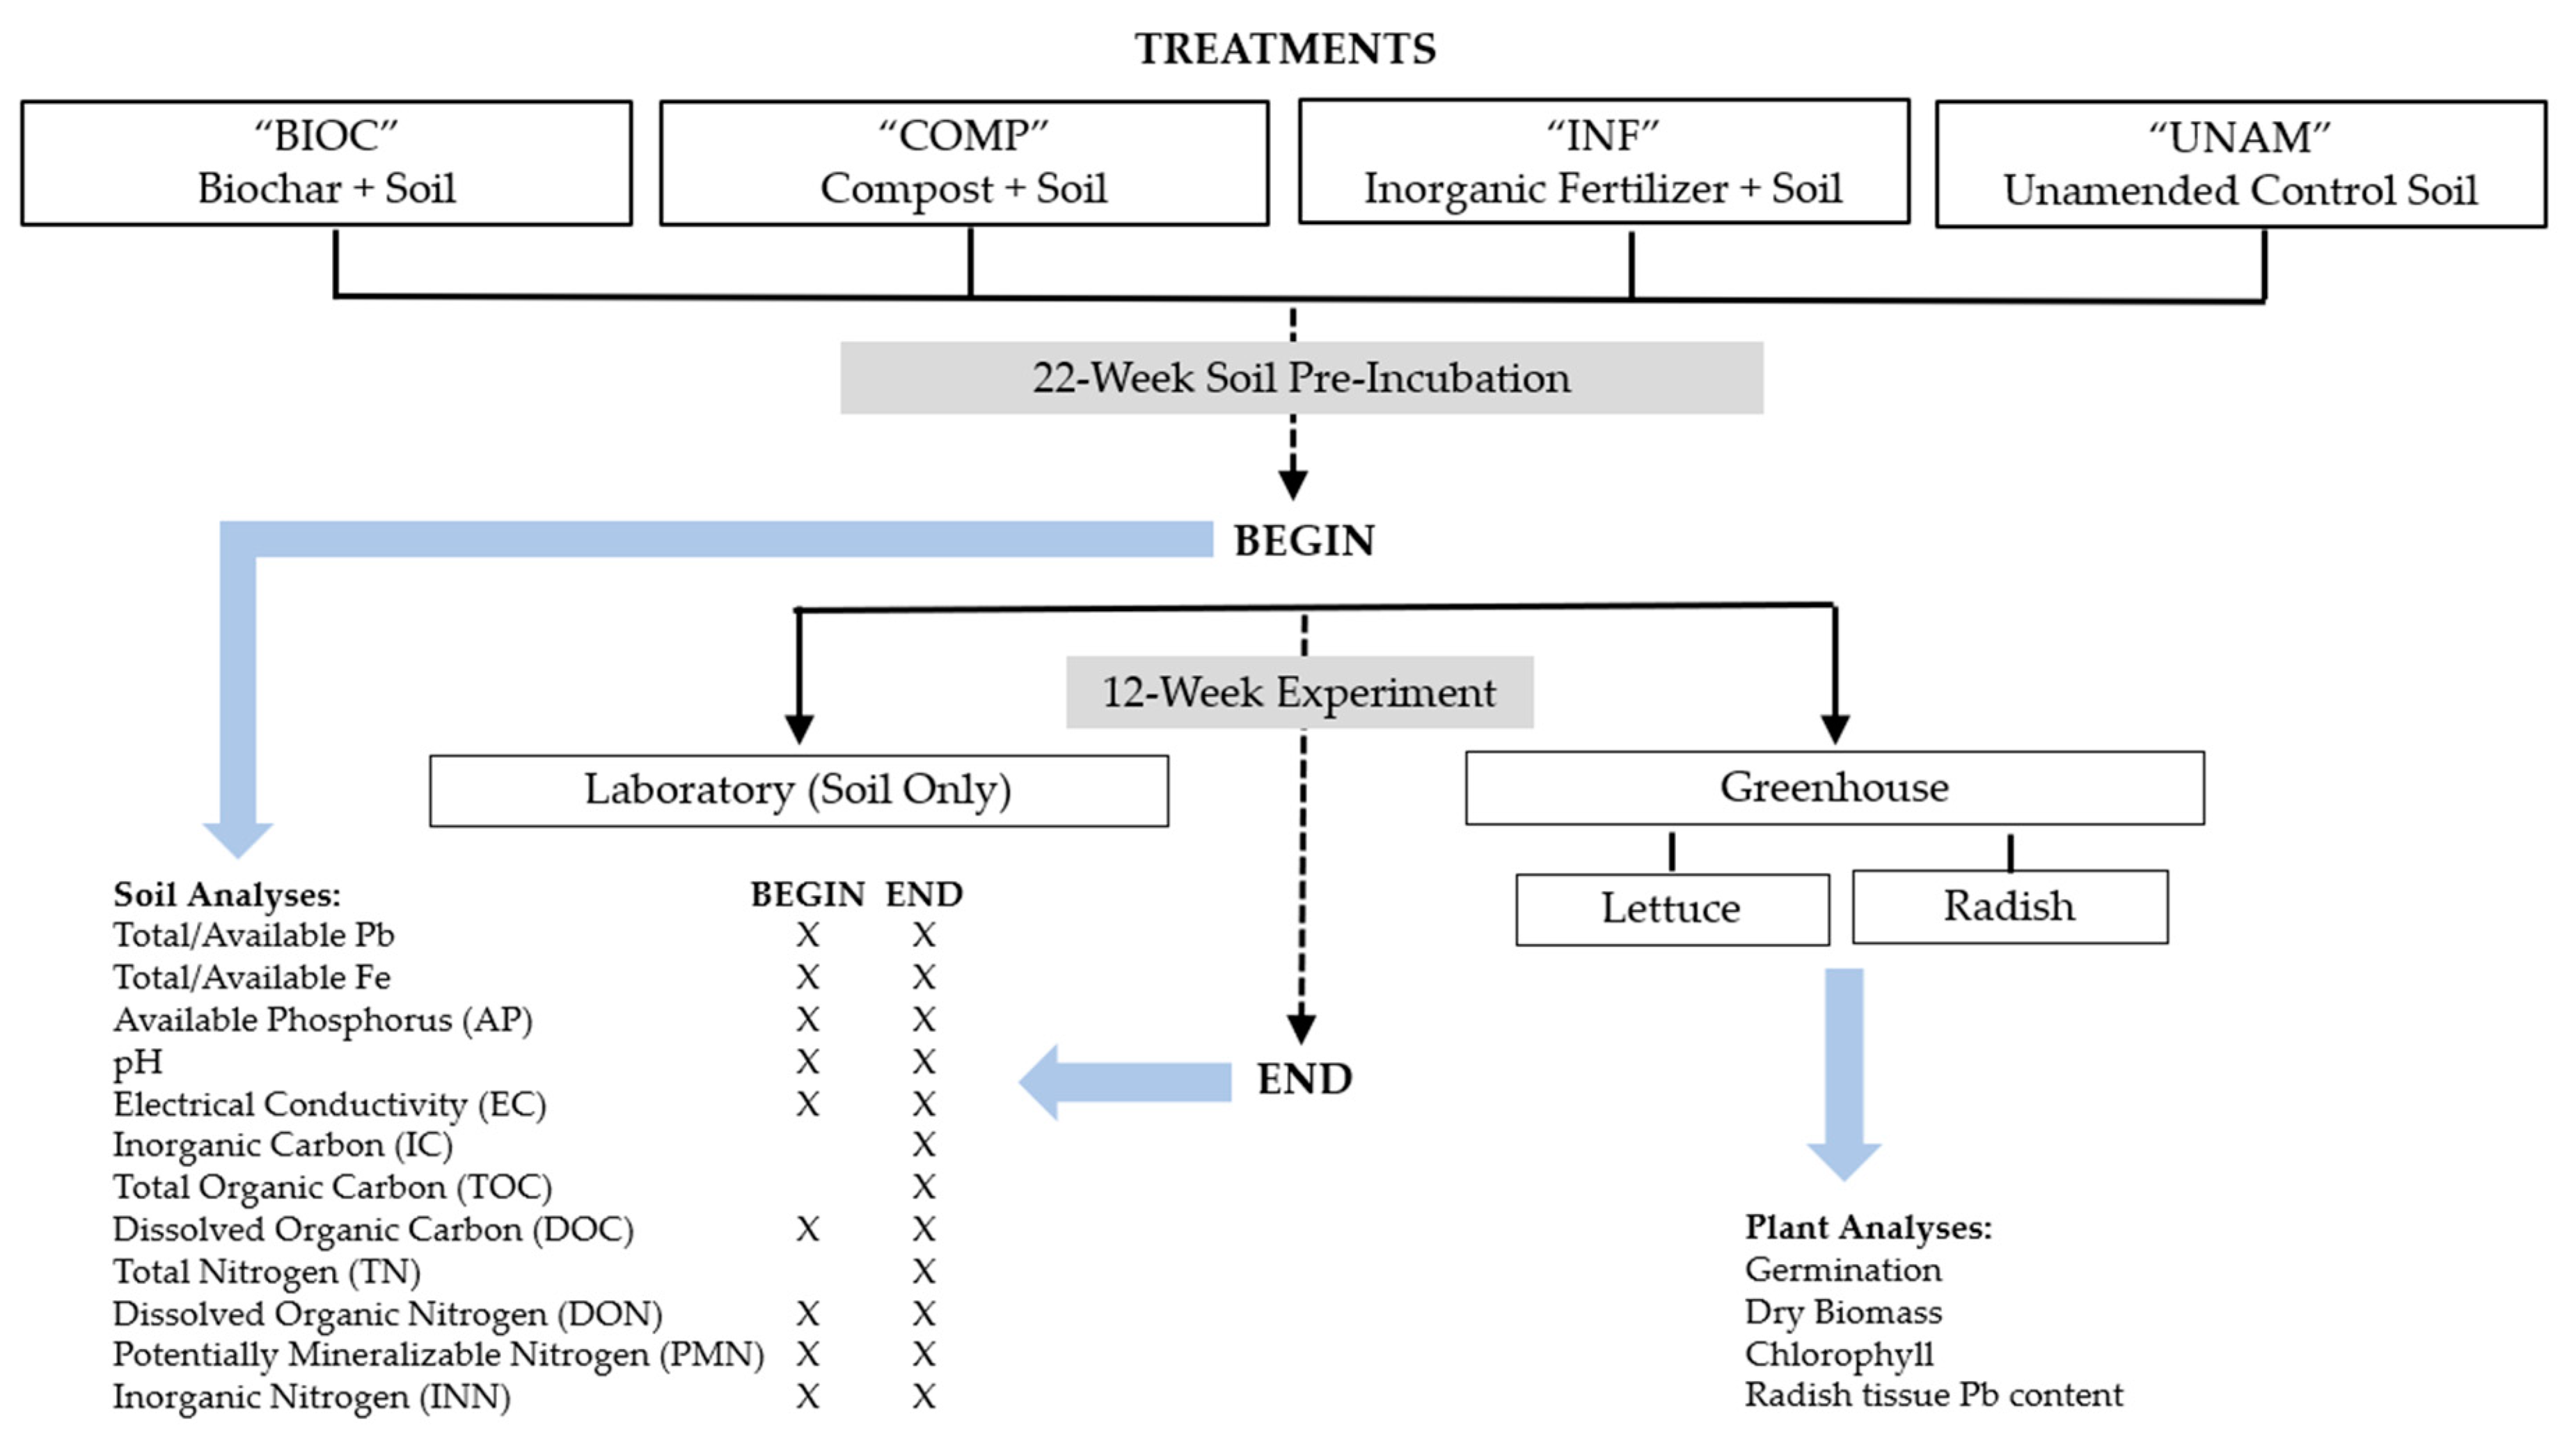
2. Materials and Methods

2.1. Site Description

The study was conducted in Laramie, Wyoming (41.31° N LAT, 105.59° W LONG, 2214 m above sea level elevation). The area has a semi-arid climate, with an average annual precipitation of 286 mm [60]. The average temperature for the area is 4.4 °C, with a temperature maximum of 12.4 °C and minimum of −3.7 °C [60]. Laramie experiences strong winds, with an average daily wind speed of 19.3 km h−1 and a maximum daily average wind speed of 53 km h−1 [60]. Soils are predominantly sandy clay loams and classified as fine-loamy, mixed, superactive, frigid Ustic Haplargids developed from a mixture of slope wash materials from limestone and red sandstone [61].
Soil samples (0–10 cm depth) were collected from an area approximately 20 m away from a World War II-era factory built by the federal government to process aluminum-bearing ore and later converted to a gravel aggregate production facility [62]. The factory was operational until 1985, when it was used to recover arsenic acid from smokestack sludge and flue dust, both byproducts of power plants [62]. These byproducts were stockpiled outside the facility until processing and resulted in highly elevated concentrations of both soil and water contaminants [63]. Laboratory tests conducted showed moderately alkaline pH, low OM, low electrical conductivity (EC), low concentrations of available phosphorous (P), inorganic nitrogen (INN), and elevated total Pb concentrations (Table 1).

2.2. Soil Pre-Incubation

Collected soil was sieved to <2 mm particle size and thoroughly homogenized by hand. Biochar, air-dried composted manure, and an inorganic fertilizer were applied to the soil as one-time applications at the beginning of a pre-incubation period, resulting in three “soil + amendment” treatments (BIOC, COMP, and INF, respectively), plus an unamended control soil (UNAM). Table 2 summarizes the chemical properties of the amendments. The biochar was obtained from High Plains Biochar in Laramie, WY, produced via pyrolysis of urban tree waste, primarily Populus deltoides L. (Plains Cottonwood), at 760–815 °C for 10–15 min. The biochar was further treated with an EM-1® microbial inoculant produced by Teraganix, along with worm casting tea and humic acid. The compost consisted of cow and horse manure mixed during stockpiling and aged outdoors for at least one year. It was sourced from the Livestock Unit of the University of Wyoming Laramie Research and Education Center. The inorganic fertilizer applied was commercially available water-soluble Miracle-Gro All Purpose Plant Food™.
Biochar and compost were both added at a rate equivalent to 7.5% of the total weight of the soil + amendment mixture (925 g soil: 75 g amendment). The treatments were thoroughly mixed by hand and, together with the unamended control, tap water was added to increase the moisture content to about 23% total moisture by weight, with native soil averaging about 4% moisture (w/w) prior to amendment. Inorganic fertilizer was applied at a rate of 0.0075% crystals to soil (w/w), or 0.75 g crystals: 10,000 g soil. A level tablespoon of crystals was weighed six times, establishing an average weight of 12.40 g of crystals per tablespoon. The crystals were dissolved in tap water at the manufacturer’s recommended rate of one tablespoon per gallon for outdoor plants, or 12.40 g per 3785.41 mL, then incorporated into soil to achieve 23% total moisture by weight.
The treatments were stored in plastic trays loosely covered with plastic wrap to reduce evaporation and kept in a dark room at 21 °C for a pre-incubation period of 22 weeks. Soil moisture was monitored twice a week and additional tap water was added as needed to bring the moisture to about 23%. No drainage was allowed in order to avoid leaching of nutrients or metals during pre-incubation.

2.3. Lab Incubation and Greenhouse Experiment

After pre-incubation, the amended soils were transported to the University of Wyoming College of Agriculture and Natural Resources Research and Extension Center Greenhouse Complex in Laramie, Wyoming. The temperature in the greenhouse was set to 21.1 °C and 18.3 °C during the day and night, respectively, with no supplemental lighting. Sixty-four plastic cone-tainers were filled with approximately 670 cubic centimeters of soil and planted with two varieties of vegetable seeds: a leafy green, Lactuca sativa L. (lettuce), and a root vegetable, Raphanus sativus L. (radish). The lettuce (“Emerald Jewel” cultivar) was obtained from Burpee in Warminster, Pennsylvania, and the radish (Rover F1 cultivar) was obtained from Johnny’s Selected Seeds in Winslow, Maine. Both were kindly provided by Dr. Urszula Norton (University of Wyoming, Laramie, Wyoming).
The plants were chosen due to their commonality among local home gardeners and as representative species for above and belowground biomass, respectively. The cone-tainers had limited perforation at the bottom, allowing for leaching of the soil solution with minimal loss of treated soil. To increase the likelihood of germination for each replicate, cone-tainers planted with lettuce were seeded with four seeds and those with radish with two seeds. All cone-tainers were thinned to one plant per cone-tainer within a week of seedling emergence, except for those in which germination did not occur. The cone-tainers were arranged in an 8 cone-tainer × 8 cone-tainer square using a completely randomized design. One additional layer of cone-tainers planted with radish were also placed on the outside of the experiment perimeter to act as an edge row and help reduce potential moisture loss.
Soil moisture was monitored and adjusted every one-to-two days to reach 20–30% (w/w). This was achieved by comparing the weight of a cone-tainer at the ideal moisture content (“par weight”) for the treatment type against the average weight (g) of two reference cone-tainers for each treatment and plant species combination. The average reference weight was subtracted from the ideal par weight to estimate moisture loss, then an equivalent amount of tap water was added as needed to each cone-tainer to bring it back up to the par weight for its species and treatment type. The experiment was terminated, and plants were harvested after 12 weeks in the greenhouse.
Concurrent to the greenhouse experiment, a portion of the treated soils (“Lab Inc”) continued to be incubated in the lab. This was done to assess soil microbially-driven transformations without the presence of plants. That portion of the treated soil continued to be stored and water content was monitored and adjusted using the same method as for pre-incubation until the greenhouse experiment was terminated (Figure 1).

2.4. Soil Analyses

Soil chemical analyses on both the native and treated included EC, pH, INN, potentially mineralizable nitrogen (PMN), dissolved organic carbon (DOC), dissolved organic nitrogen (DON), total inorganic carbon (TOC), total nitrogen (TN), inorganic C (IC), plant-available phosphorus (AP), and total and available Pb and iron (Fe). Soil pH and EC were measured for greenhouse and lab-incubated soils at the beginning of the incubation, but only greenhouse soils at the end. Soil DOC and DON were tested at the beginning and end of the experiment. Inorganic C, TN, and TOC were only sampled once at the end of the experiment. Total and plant-available Pb and Fe concentrations were determined at the beginning of the incubation period, and available Pb and Fe were also measured at termination. All soil data were expressed on an oven-dried basis prior to statistical analysis.
Soil pH and EC were determined using a glass electrode and an Oakton 2700 series benchtop meter at a 1:2 soil-to-water ratio. Inorganic nitrogen content was calculated by combining soil ammonium (NH4+) and nitrate (NO3-) into one parameter. Ten grams of fresh soil were added to 25 mL of two molar potassium chloride (2 M KCl), placed on a shaker for 30 min, and filtered through ash-free filter paper (Q5 Fischer Scientific, Waltham, MA, USA) [64]. The extract was then analyzed on a spectrophotometer microplate reader (UV-VIS Biotek Instruments, Highland Park, IL, USA) for NH4+ using sodium salicylate (Reagent A) and two percent bleach mixed with 1.5 M sodium hydroxide (Reagent B) [64]. Soil NO3 was also extracted using 2 M KCl and analyzed on the microplate reader following the vanadium chloride method [65]. Potentially mineralizable nitrogen (PMN) was assessed by incubating five grams of fresh soil in 12.5 mL of deionized water for 14 days at 25 °C to create an anaerobic environment [66]. Oxygen present in the headspace of the centrifuge tube was flushed with dinitrogen (N2) gas prior to sealing the tube. After two weeks, 12.5 mL of 0.5 M K2SO4 was added, the mixture was shaken for 30 min, and filtered through ash-free filter paper (Q5 Fischer Scientific, Waltham, MA, USA). The resulting extract was then analyzed using a spectrophotometer microplate reader (UV-VIS Biotek Instruments, Highland Park, IL, USA), with PMN calculated as the difference between pre- and post-incubation NH4+ concentrations.
A subsample of dried biomass was finely ground with a Willey Mill (Willey Laboratory Mill, Model 4, Arthur H. Thomas Co., Philadelphia, PA, USA) and passed through a 1 mm screen. Ground plant material was wrapped in tin capsules and analyzed for total carbon (TC) and total nitrogen (TN) by dry combustion using a Carlo Erba CN 2100 CN analyzer (Carlo Erba Instruments, Milan, Italy). Soil TN comprised organic N, ammonia (NH3), NH4+, NO3, and nitrite (NO2). Dissolved organic carbon (DOC) and dissolved organic nitrogen (DON) concentrations were analyzed using the Newcomb-Carrillo method (2011) [67], with 1:2.5 soil:0.5 M K2SO4 shaken for 30 min, stored at 4 °C overnight, and filtered through ashless filter paper (Q5 Fisher Scientific, Waltham, MA, USA). Samples were analyzed on a total organic carbon (TOC) analyzer (Shimadzu TOC-VCPH with TNM-1, Kyoto, Japan). Soil IC was determined via the pressure-calcimeter method outlined by Sherrod et al. (2002) [68]. Total organic carbon was calculated as the difference between total C and IC. Available P was estimated using the Olsen P method [69].
Available concentrations of Pb and Fe were quantified through DTPA extraction [70] and analyzed using inductively coupled plasma-optical emission spectrometry (ICP-OES). Total Pb and Fe contents were quantified using an Olympus Vanta™ X-ray fluorescence analyzer (XRF) after grinding 20–30 g of treated soil to a fine powder with a mortar and pestle.

2.5. Plant Analyses

Three chlorophyll measurements were taken and averaged on the first fully developed radish or lettuce leaf using a Konica Minolta SPAD 502 Plus meter. After measuring chlorophyll, the plants were gently removed from soil, rinsed with tap water to remove treatment residues, and separated by aboveground (stem and leaves) and belowground (root tissue) biomass by severing the plants at the base of the stem. For radish, root tissue refers to the tuberous portion. Samples were oven-dried at 65 °C for 24 h and the dry weights were recorded.
Lettuce did not produce enough biomass to conduct elemental analysis. Lead concentrations for above and below-ground tissue in radish were quantified using a dry ashing procedure [71]. Composite samples were used to produce as many unique root and shoot observations as possible for each treatment. One gram of dried, homogenized radish tissue was placed in a porcelain crucible soaked overnight in nitric acid (HNO3). The tissue was then ashed at 500 °C in a muffle furnace for four hours. Once cooled, ten drops of deionized (DI) water and 2 mL of 50% (v/v) nitric acid were added to each crucible and evaporated to dryness on a hot plate. The samples were ashed again for another 30 min at 450 °C, with the remaining ash dissolved in 2 mL of 20% (v/v) HNO3 on a hot plate heated to about 100 °C. The solution was filtered through Whatman No. 42 filter paper, with the first two mL of filtrate discarded. Extracts were analyzed using ICP-OES.

2.6. Plant Lead Uptake Indicators

As a proxy for the amount of the Pb taken up by an individual radish plant within a treatment, a tissue “mass load” was calculated as follows (Equation (1)):
Mass   load   ( µ g plant ) = Average   Tissue   Pb   ( mg kg ) ×   Plant   Biomass   ( kg ) × 10 9
A bioconcentration factor (BCF), or measure of a plant’s uptake relative to its level of soil exposure, was calculated for each treatment using a modified version of the approach described by Antonangeli and Zhang (2020) [72] and Ahmad et al. (2018) [73] (Equation (2)):
BCF = Root   Pb   Concentration   +   Average   Shoot   Pb   Concentration Average   Total   Soil   Pb   Concentration  
To calculate BCF, we added the average composite radish shoot concentration (mg kg−1) for the treatment to each composite radish root sample obtained to approximate total Pb concentration. An average shoot concentration was used because there were limited representative samples (n = 3 per treatment) for radish shoot tissue. The total concentration was then divided by the total amount of Pb present in the soil at that beginning of the experiment. We also calculated a translocation factor (TF) for each treatment, which characterizes a plant’s ability to translocate Pb from roots to shoots. We adapted the equation from Ahmad, et al. (2018) [73] by substituting plant mass load for tissue concentration (Equation (3)):
TF = Shoot   Pb   Mass   Load Root   Pb   Mass   Load

2.7. Statistical Analyses

The experimental design included eight replicates of the four treatments for both radish and lettuce, along with lab incubated soil. All analyses were performed in R version 3.6.2 (The R Foundation for Statistical Computing). The effects of amendment and plant species/Lab-Inc on available Pb, key soil, and plant parameters, and changes in available Pb over time, were assessed using a two-way Analysis of Variance (ANOVA). Data were tested for normality using the Shapiro–Wilk test. Transformations were used to achieve normality for data that were not normally distributed. Tukey HSD was used to determine treatment significance at p ≤ 0.05. If data were unable to normalize, a Kruskal-Wallis rank sum test was performed using a Dunn’s test to determine means separation for statistically significant results. Pearson’s correlation test was used to measure the strength of associations between soil available Pb, BCF, and mass load against the soil and plant parameters described above. Observations were considered significant at p ≤ 0.05. All data presented in this chapter are untransformed. Correlations were analyzed three ways: using the dataset as a whole, inclusive of all data points from radish, lettuce, and lab-incubated samples, and with no separation by treatment; by treatment, using all data points from radish, lettuce, and lab-incubated samples available for that treatment; and by treatment with data points from radish or lettuce only.

3. Results

3.1. Beginning of the Experiment

Soil pH was greatest in BIOC (8.4) as compared to other treatments (Table 3). Remaining treatments were comparable to each other (7.8). Soil EC was the greatest in COMP (1209 μS cm−1) and twice as great as EC in UNAM (537 μS cm−1).
Soil INN in soil amended with BIOC was the lowest (15.2 mg kg−1) compared to other treatments (183.4 mg kg−1) (Table 4) and soil PMN was very low to negligible. The BIOC treatment also had the least DON (12.5 mg kg−1) while DON in INF was the greatest (101.5 mg kg−1). Soil DOC demonstrated an opposite pattern with the greatest concentrations observed in BIOC (398.9 mg kg−1) and least in INF (163.0 mg kg−1).
The COMP treatment had the greatest AP (0.6 mg kg−1) compared to UNAM (0.3 mg kg−1) while AP concentrations in the other treatments fell in between. Soil available and total Fe concentrations averaged 8.6 mg kg−1 and 21,177 mg kg−1, respectively, across all treatments. Available and total Pb concentrations averaged 104.5 mg kg−1 and 772 mg kg−1, respectively.

3.2. Experiment Termination

3.2.1. Soil Physicochemical Properties

Soil pH and EC remained unchanged over time. Soil inorganic C (measured only at the end of the experiment) averaged 16,802 mg kg−1 across all treatments. Total organic C, also only measured at the end of the experiment, was significantly greater in BIOC (78,043 mg kg−1) than the other treatments, which averaged 33,443 mg kg−1. The C:N ratio was the greatest in BIOC (42:1), and nearly twice as much as in the other treatments (23:1).
In lab-incubated soil, TN differed between treatments and followed the order of: COMP (2820 mg kg−1) ≥ BIOC (2330 mg kg−1) ≥ INF = UNAM (averaged 1937 mg kg−1). Among greenhouse samples, soil TN differed between treatments planted to radish and followed the order of: COMP (2279 mg kg−1) ≥ BIOC = UNAM (averaged 2178 mg kg−1) ≥ INF (2064 mg kg−1) and in treatments planted to lettuce: COMP (2528 mg kg−1) > BIOC = INF (averaged 2175 mg kg−1) ≥ UNAM (2022 mg kg−1).

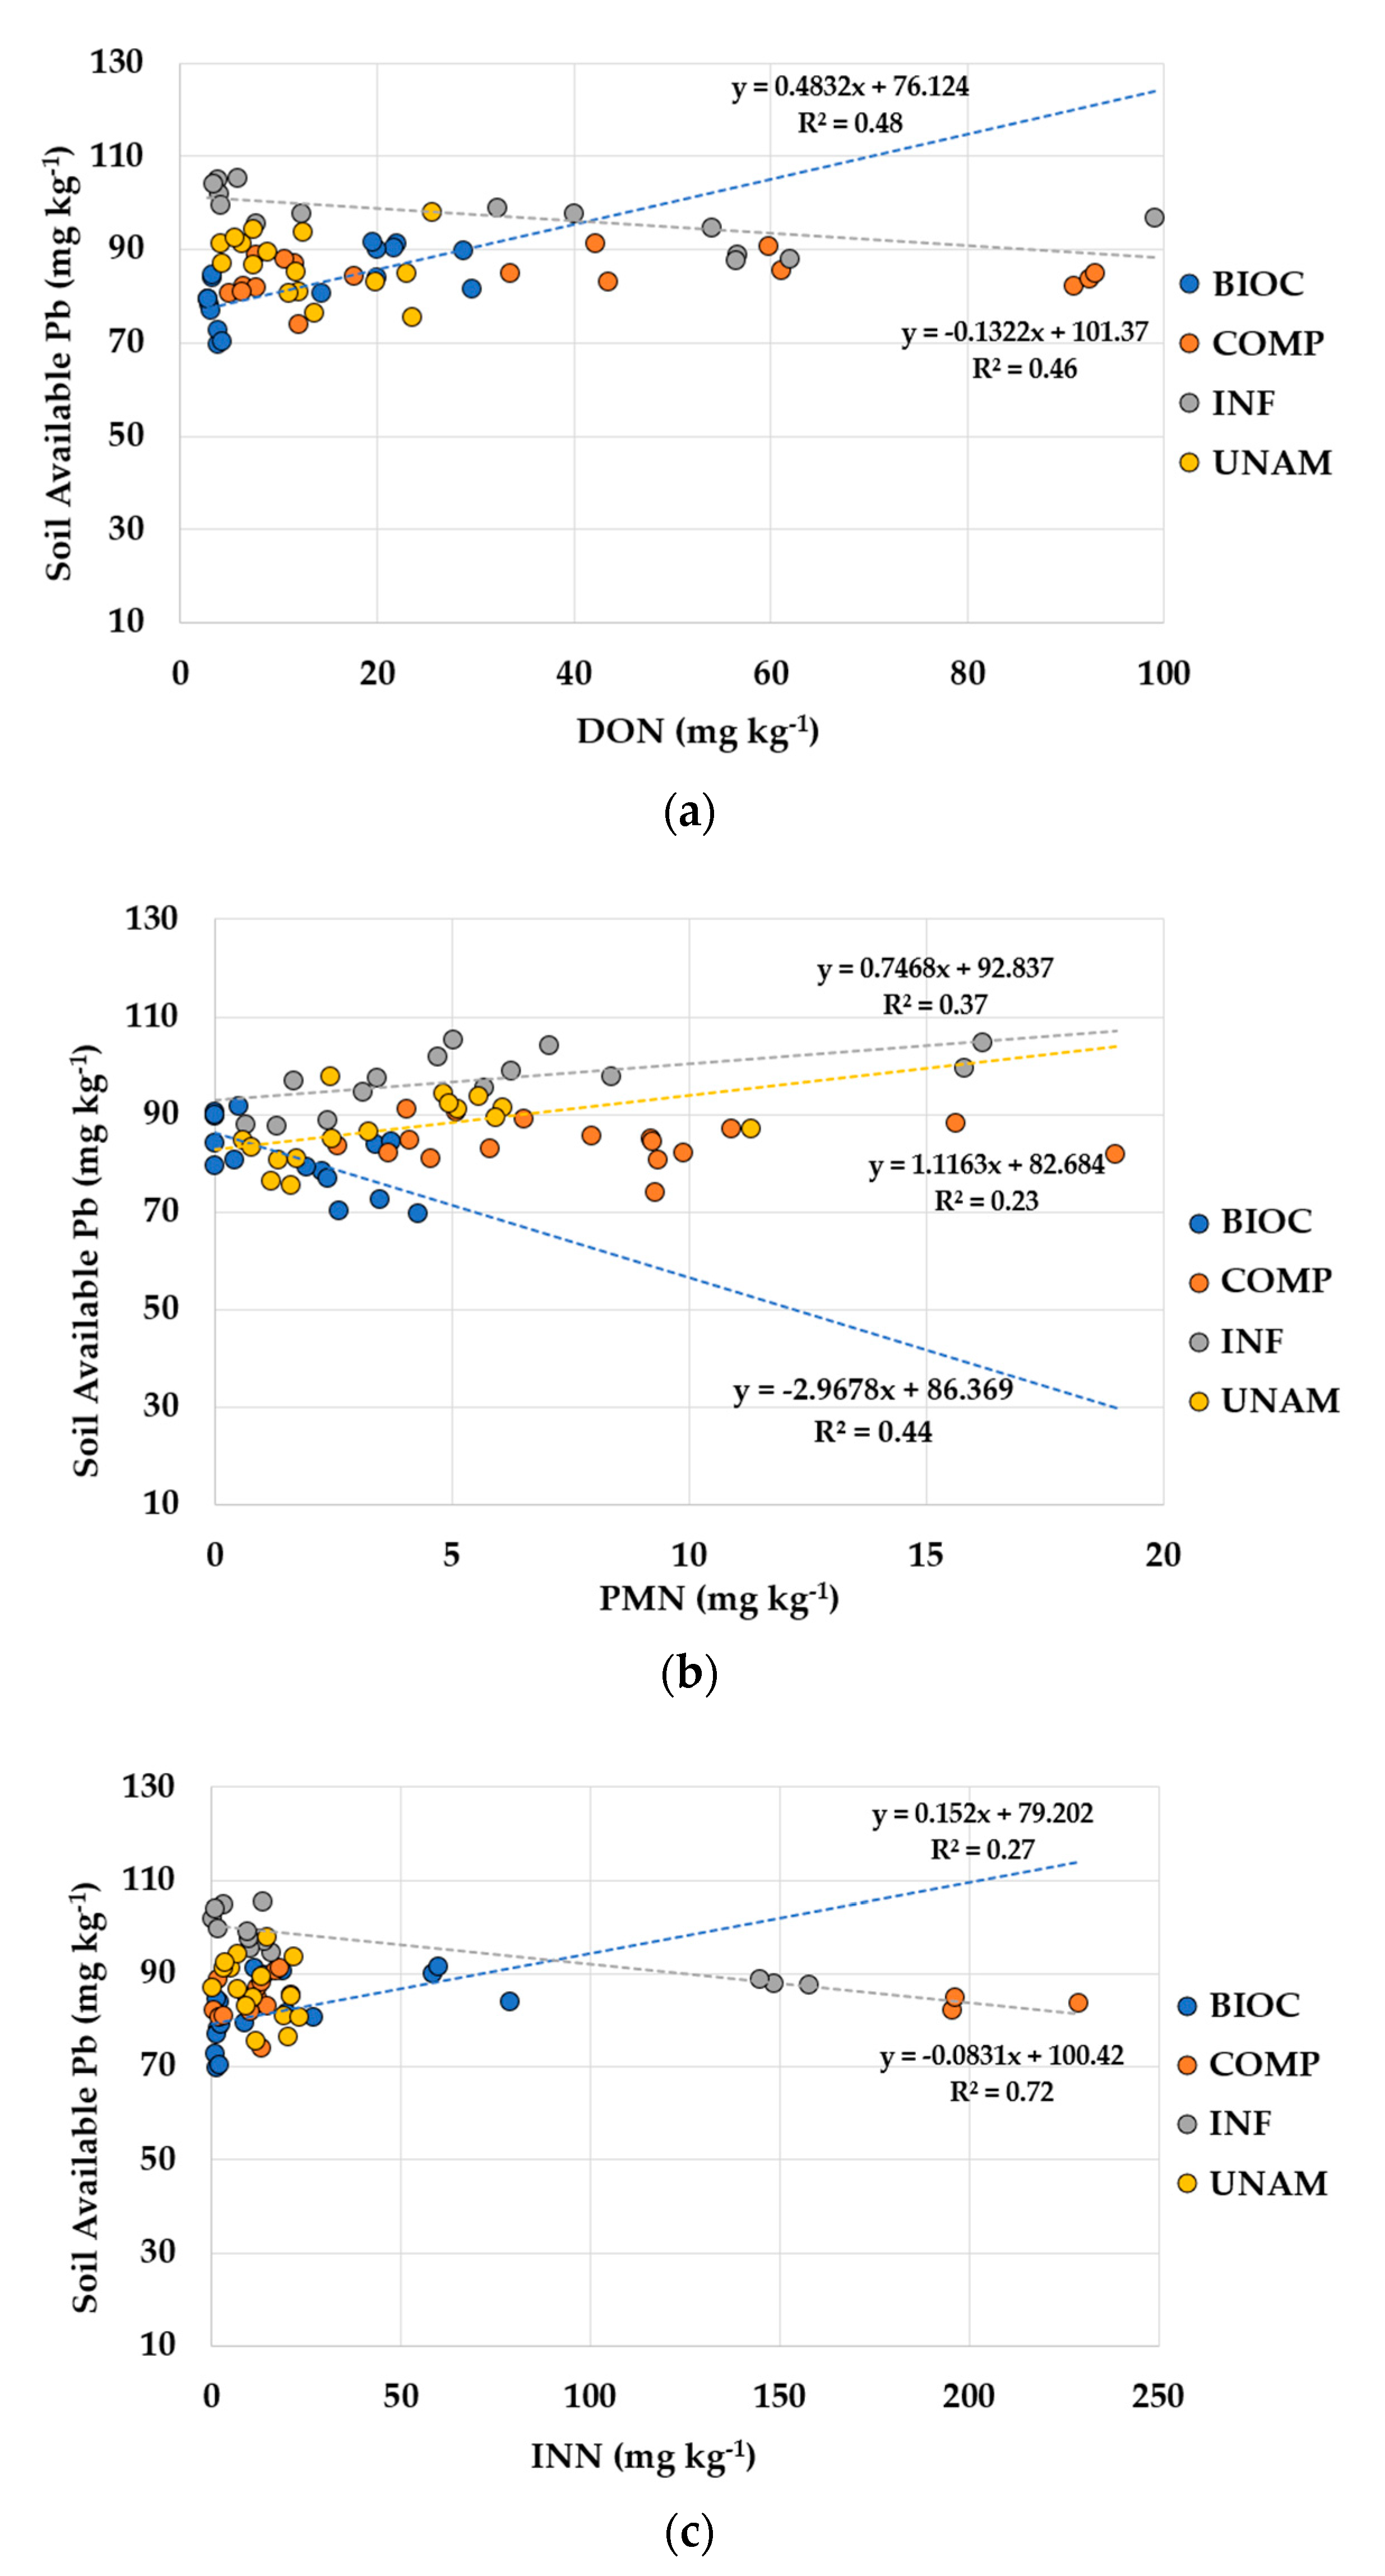
3.2.2. Soil Labile Nitrogen and Carbon

Among lab-incubated samples, INN concentrations quadrupled in BIOC, declined by fivefold in UNAM, and no significant changes were observed in COMP and INF. Soil PMN decreased, regardless of treatment, with the greatest concentrations in COMP (3.45 mg kg−1) and the least in BIOC (0.36 mg kg−1). Soil DON increased in COMP only and resulted in the greatest concentration of all treatments (92.08 mg kg−1), unlike DON concentrations in UNAM, which decreased to 11.8 mg kg−1 and became the lowest. Significant reductions occurred in all treatments except for COMP.
Among greenhouse samples, INN declined in all treatments except for BIOC planted to lettuce. Soil PMN demonstrated no change except for a decline in UNAM also planted to lettuce. At the end of the experiment, the greatest PMN concentrations were observed in COMP and was the least in BIOC. Soil DON declined in all treatments planted to radish (between 91% in INF and 69% in UNAM) and in COMP planted to lettuce only (44.2%). Soil DON concentrations were consistently greater in treatments planted to lettuce than radish. Soil DOC declined in all treatments except in INF and COMP, both planted to radish. The greatest reductions in DOC were observed in BIOC planted to radish (88%) and lettuce (68%). The smallest change in DOC was observed in UNAM. At the end of the experiment, INF planted to radish and COMP planted to lettuce had the greatest DOC concentrations.

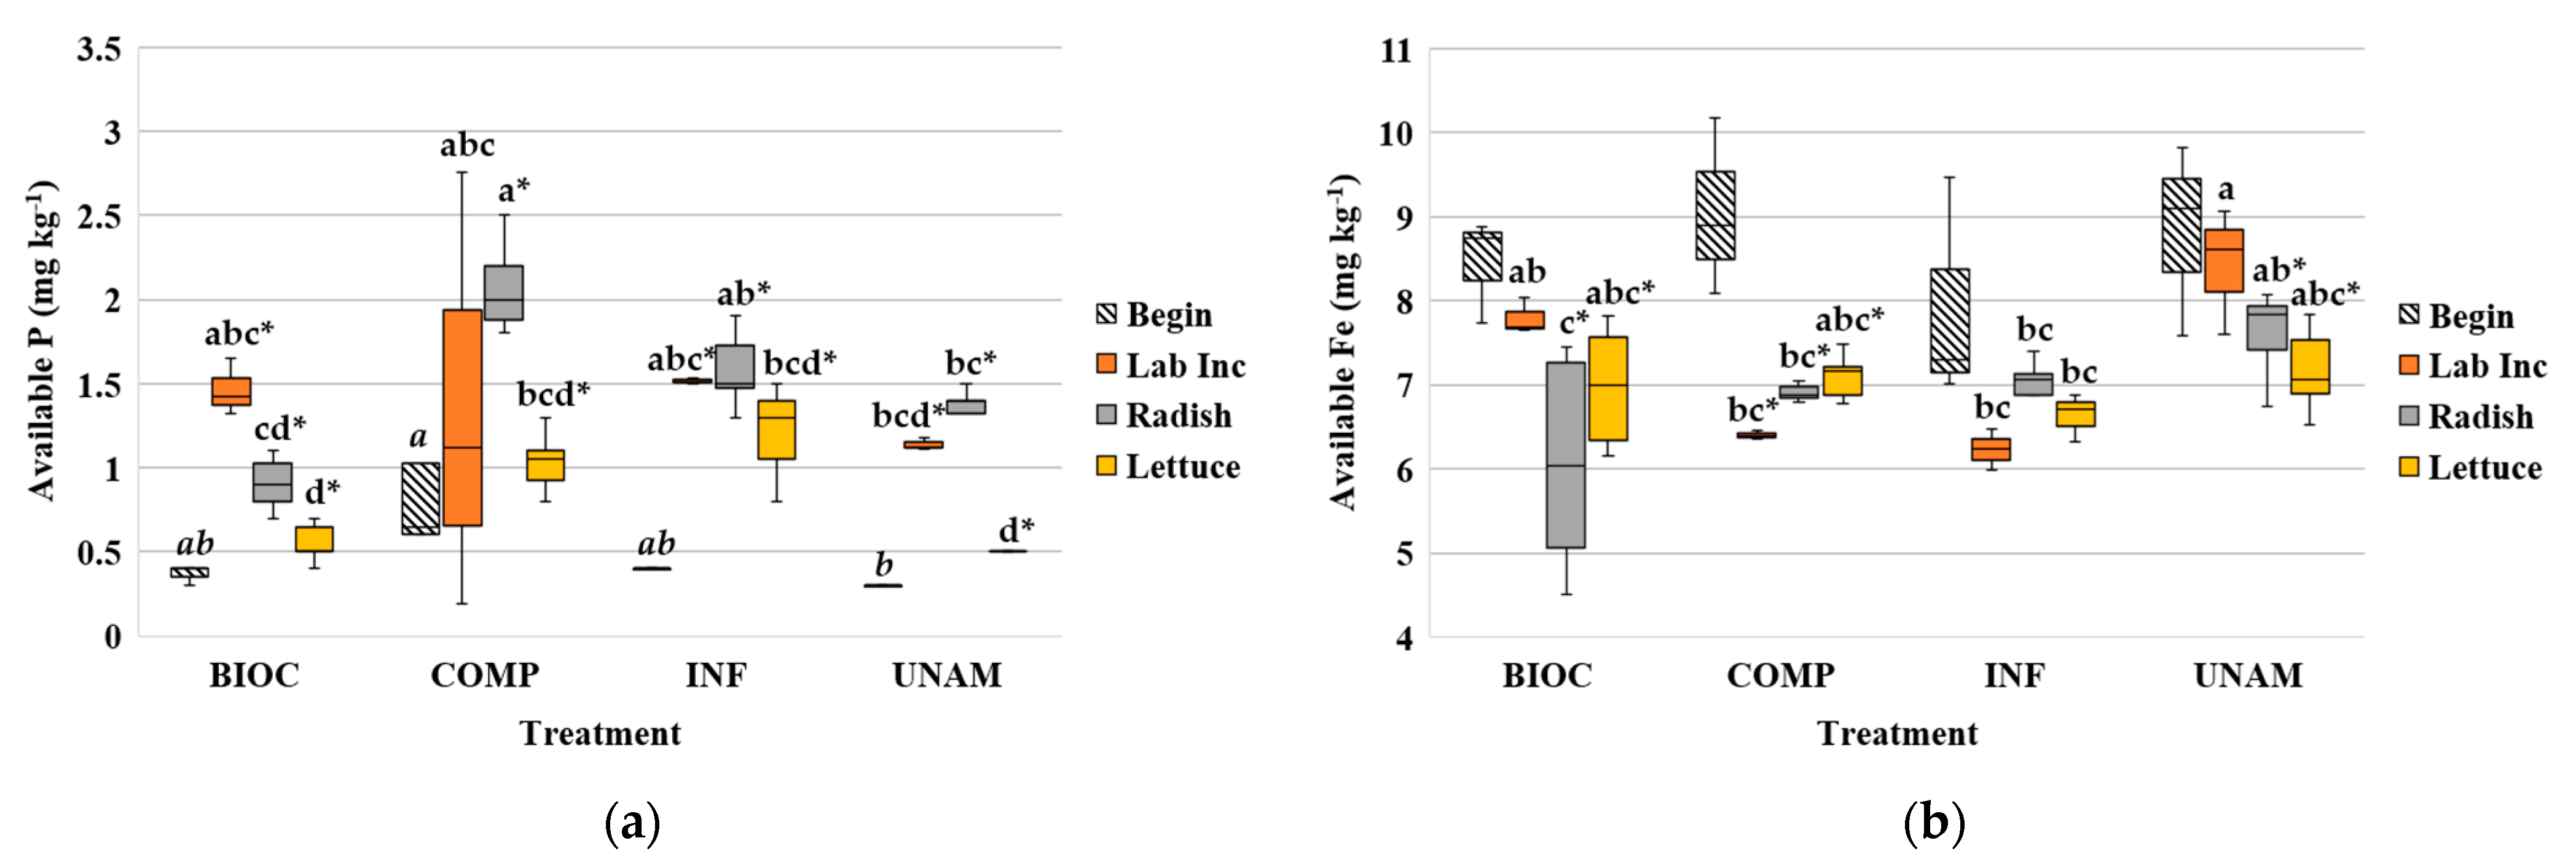
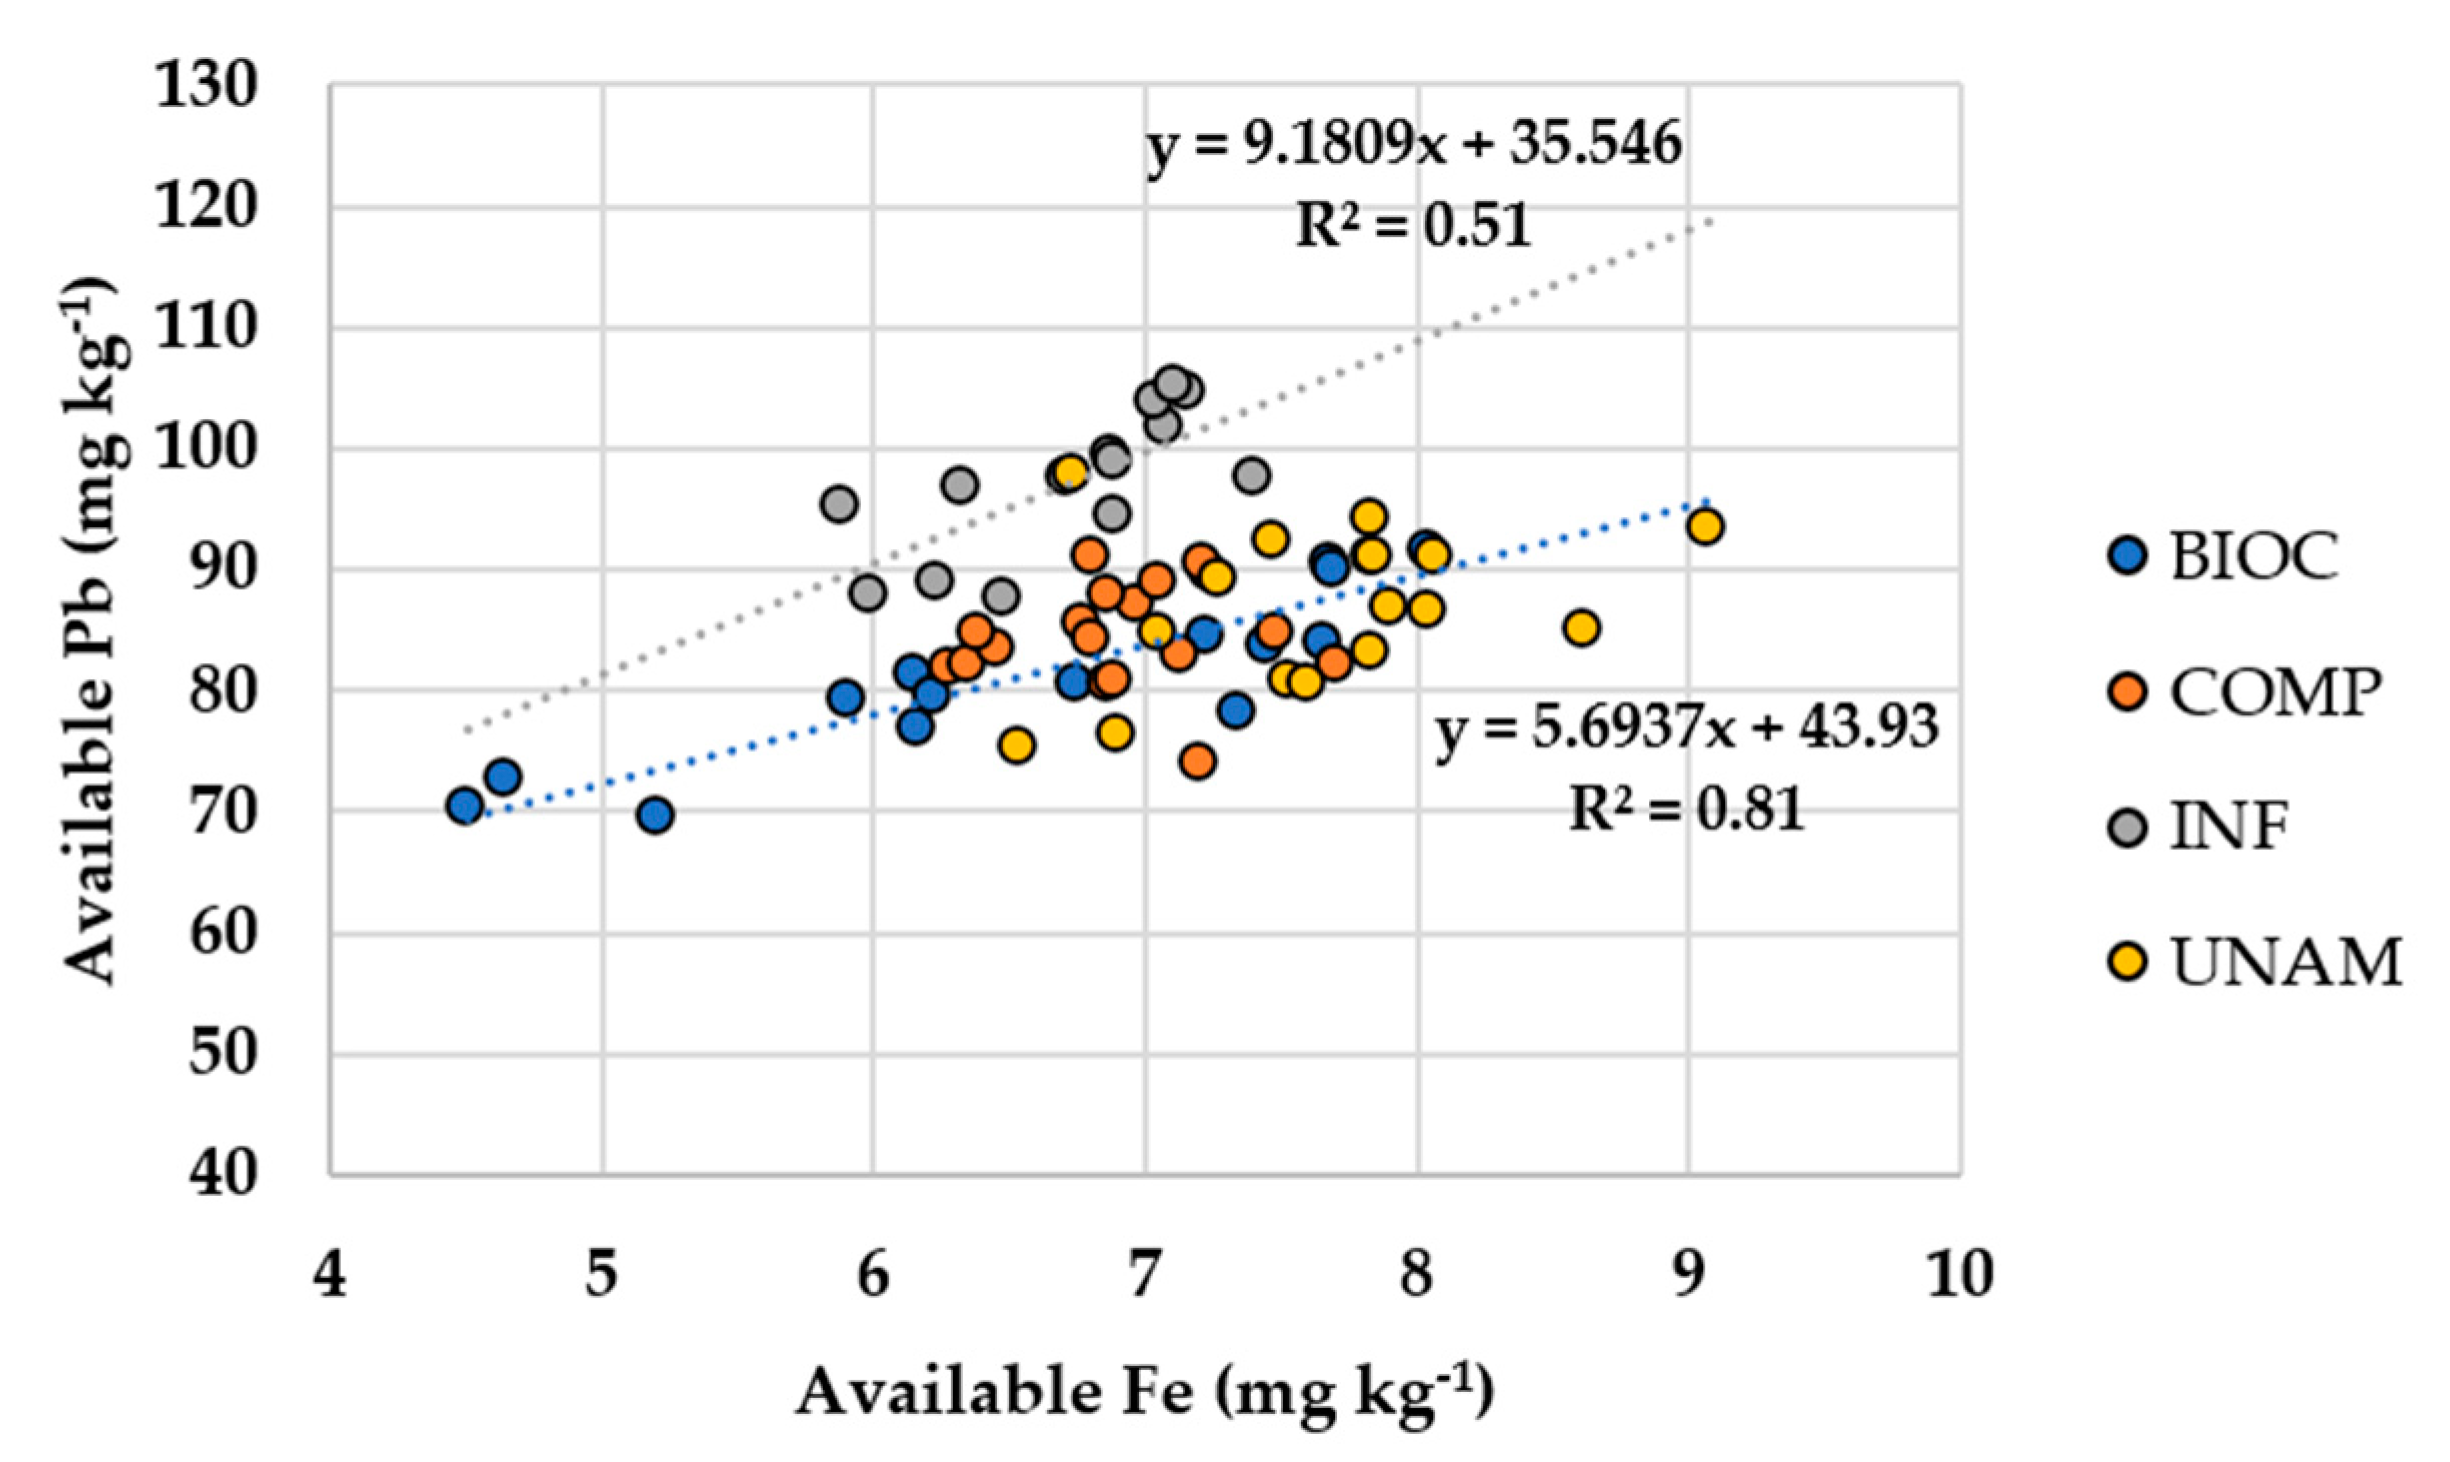
3.2.3. Soil Iron and Phosphorus
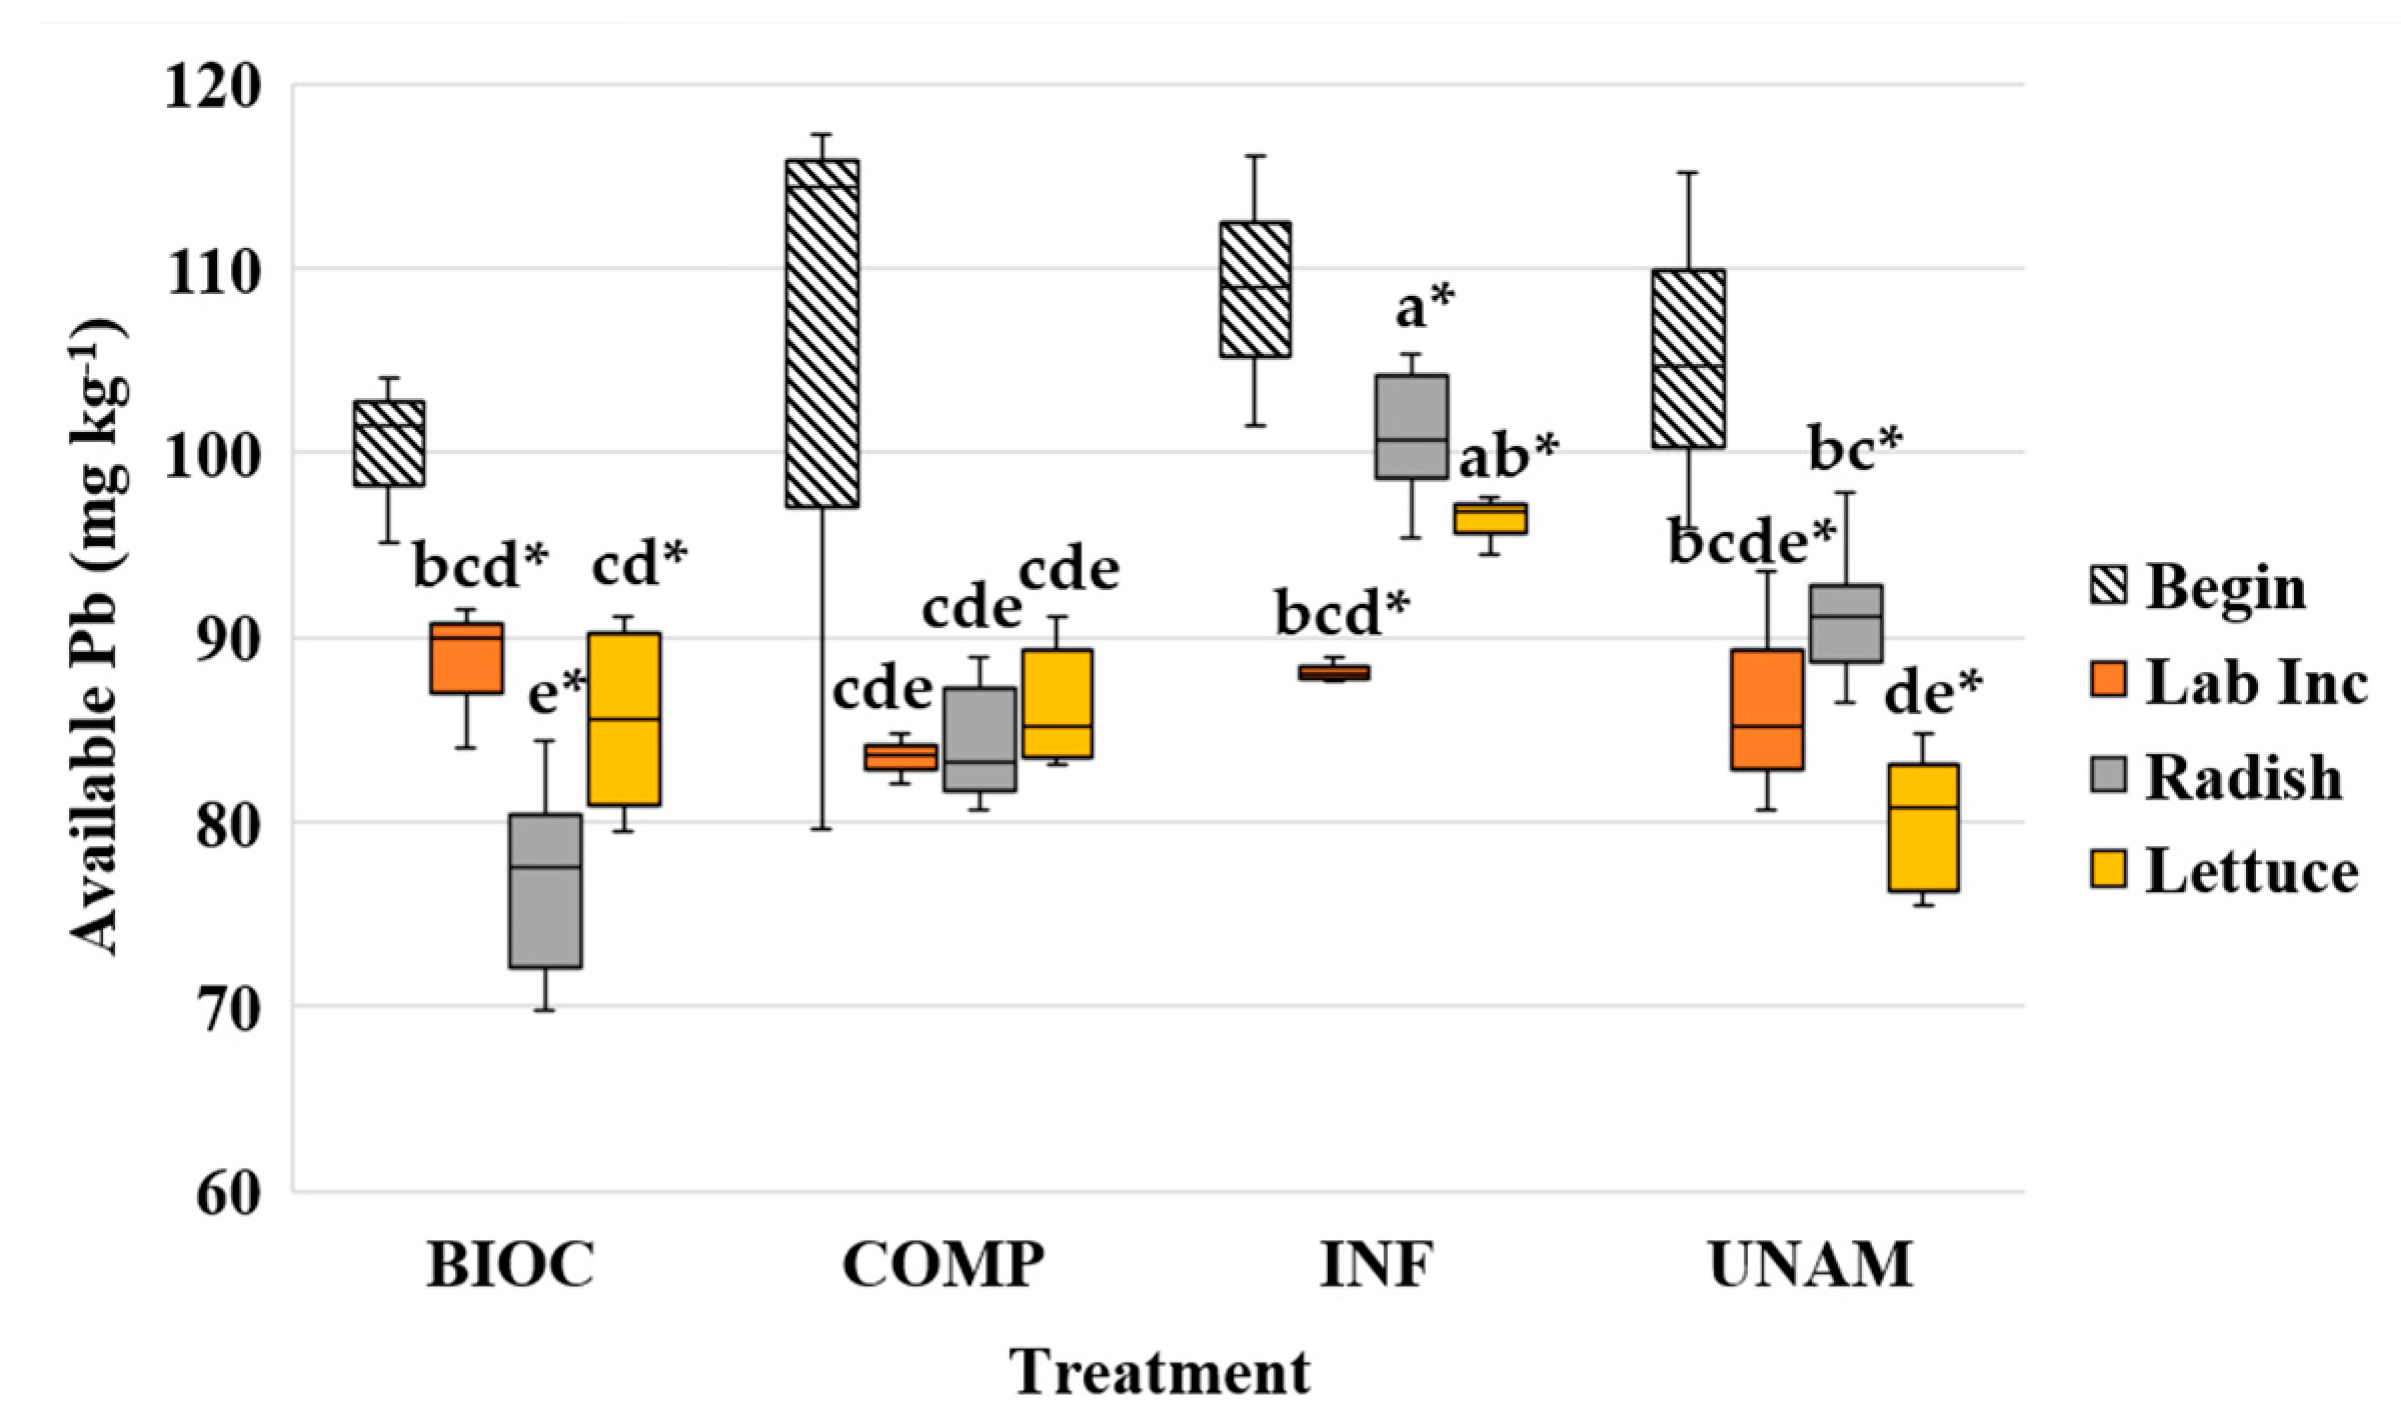
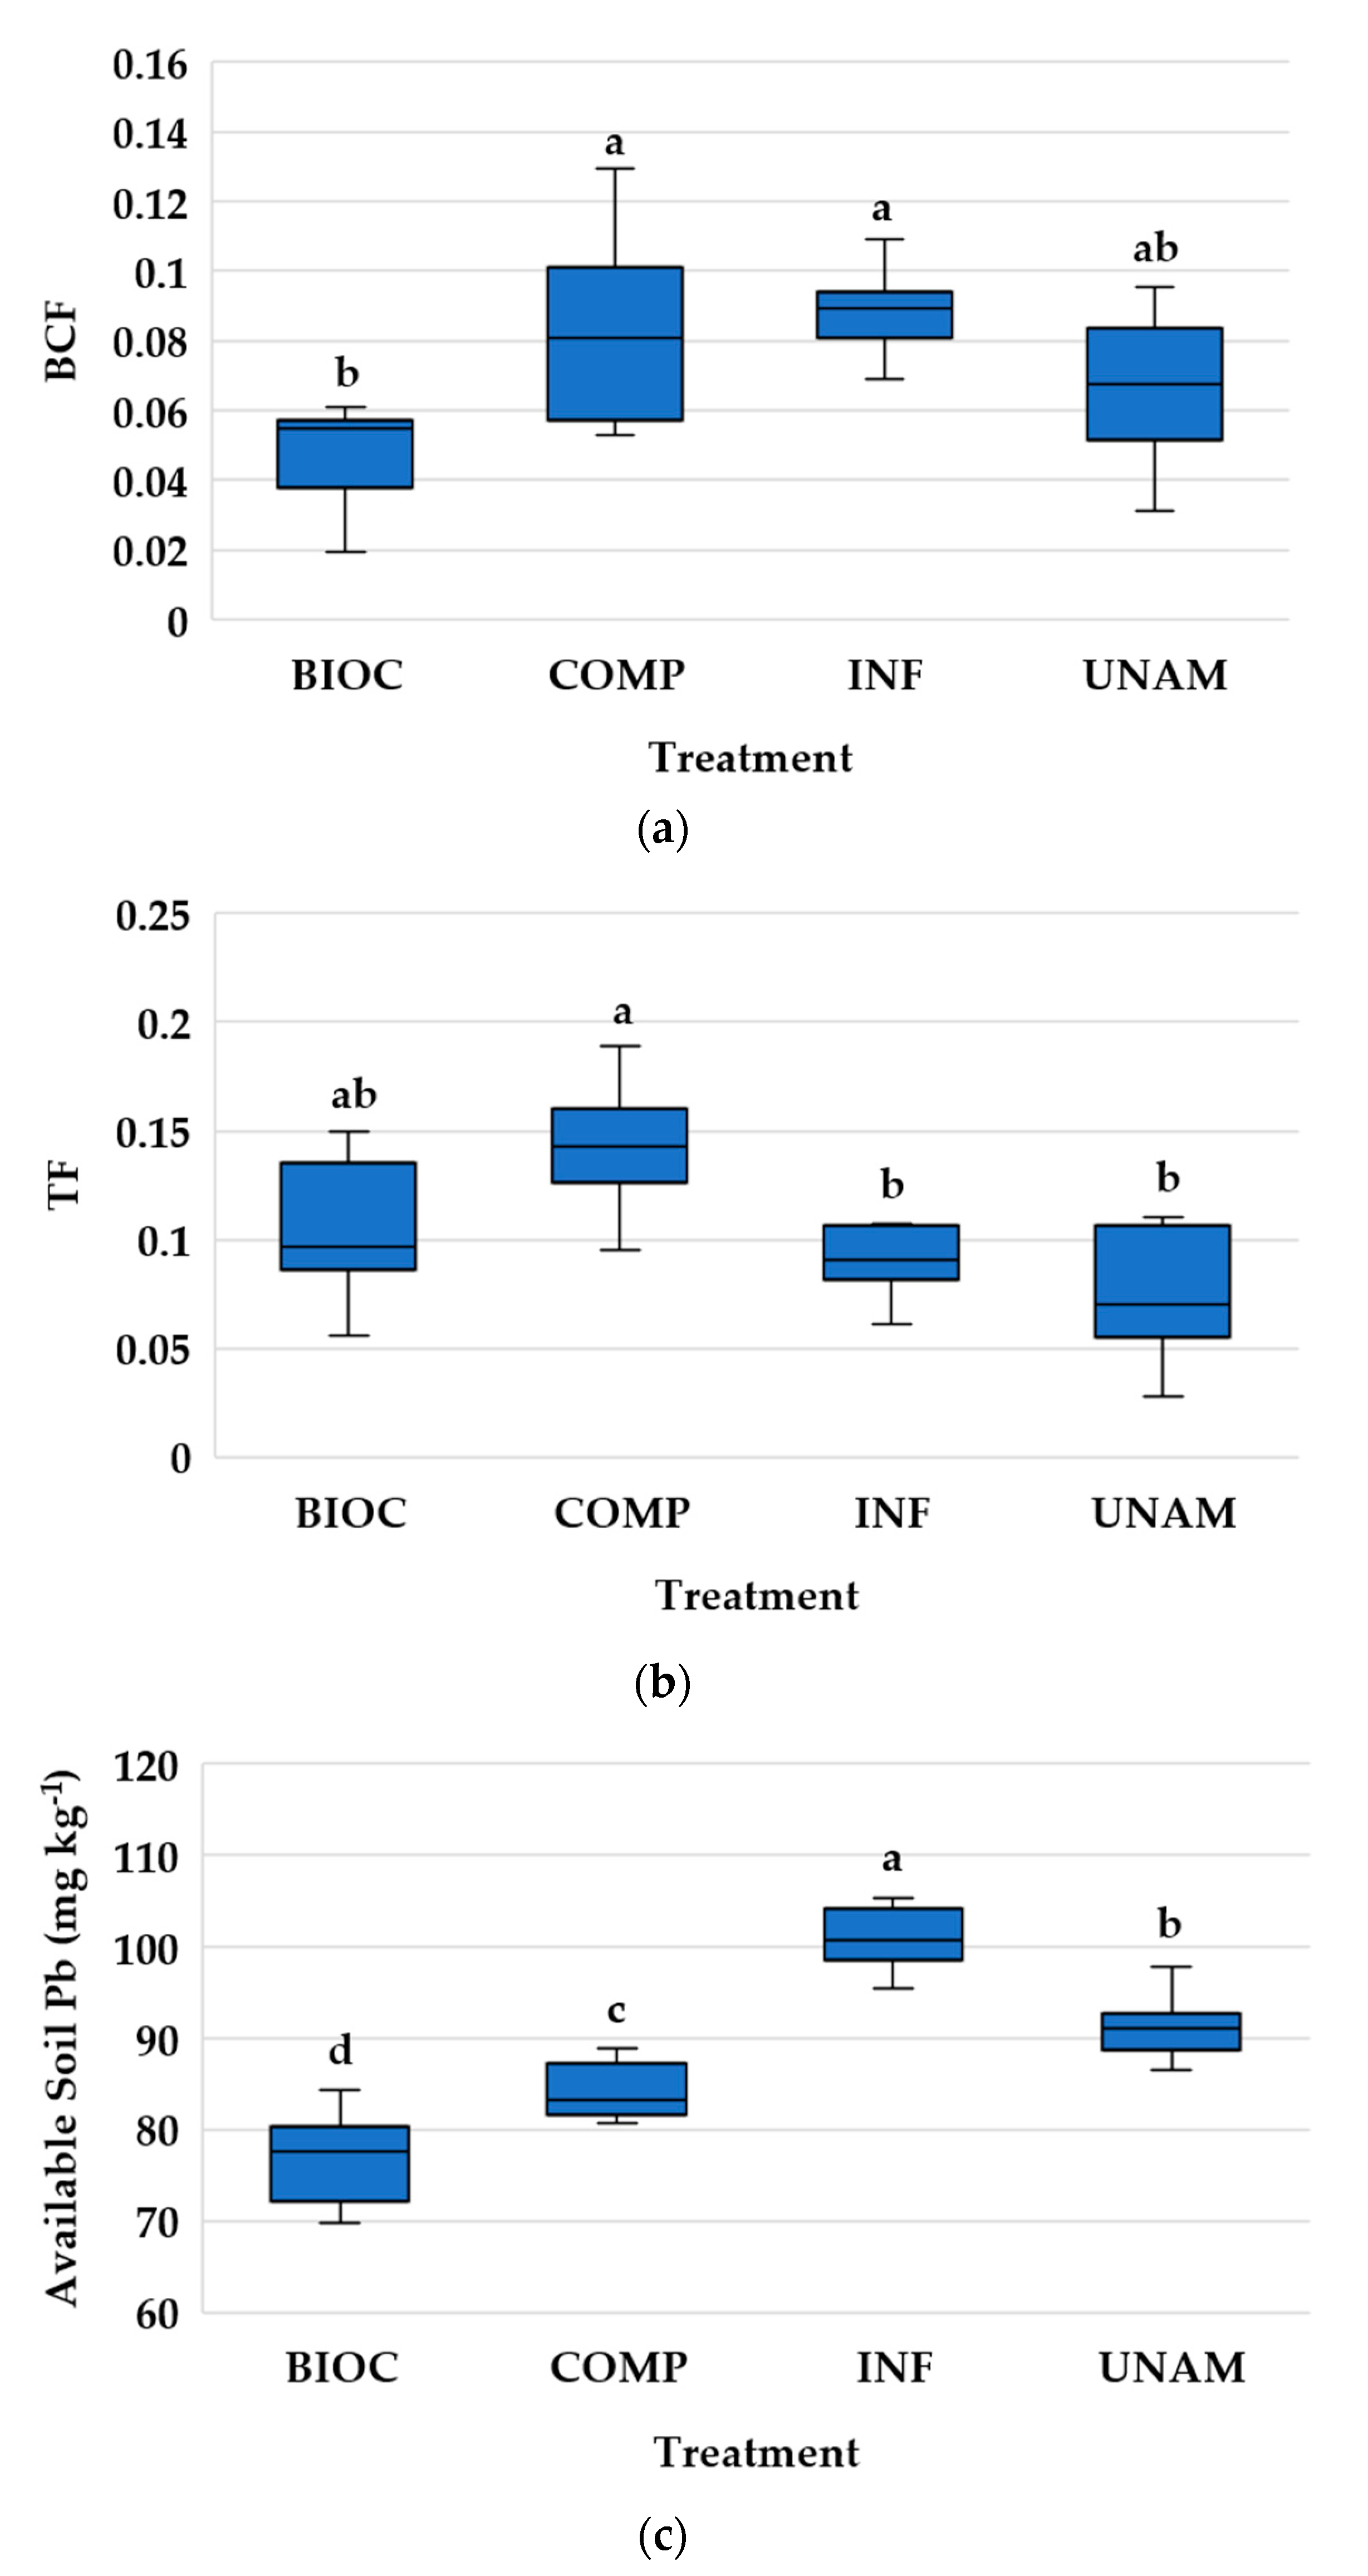
Available P in lab-incubated soil increased significantly over time among all treatments except for COMP, but no statistical differences among treatments were observed at the end (Figure 2a). A significant reduction in available Fe from 8.5 mg kg−1 to 7.8 mg kg−1 was observed in COMP (Figure 2b). Available Fe was the greatest in UNAM and significantly greater than in COMP and INF.
Among greenhouse samples, soil AP significantly increased in all treatments. Specifically, COMP planted to radish had greatest soil AP (2.1 mg kg−1) followed by INF planted to radish (1.6 mg kg−1), with the least soil AP observed in BIOC (0.9 mg kg−1). Lettuce soil AP was the greatest in INF (1.2 mg kg−1) and the least in UNAM (0.50 mg kg−1). In contrast, significant reductions in soil Fe occurred in all treatments except for INF, with no statistical differences among treatments observed at the end.

3.2.4. Soil Lead

Available Pb concentrations were similar between the treatments at the beginning of the experiment and ranged from 83.5 mg kg−1 in COMP to 88.5 mg kg−1 in BIOC (Figure 3). Available Pb concentrations at the end however, differed depending on treatment. The greatest available Pb concentrations were in INF planted to radish and lettuce (100.9 mg kg−1 and 96.3 mg kg−1, respectively) and the lowest available Pb concentrations were observed in BIOC planted to radish (76.9 mg kg−1).
Negative correlations between soil available Pb and soil pH, TOC, and C:N ratio were observed using data from all groups (radish, lettuce, and Lab Inc) and treatments (Table 5). Soil pH measurement included radish and lettuce samples only (Figure 4). The observed relationship between pH and available Pb was driven by BIOC within the high range of pH values and by INF and COMP at the low end of pH values.
Comparing data by individual treatment (Table 6), available Pb was positively correlated with available Fe in both BIOC and INF (Figure 5). Available Pb in BIOC was positively correlated with DON (Figure 6a), negatively correlated with PMN (Figure 6b), and positively correlated with INN (Figure 6c). In contrast, available Pb in INF showed negative correlations with DON and INN, but a positive correlation with PMN, just like Pb in UNAM. Considering radish only, available Pb was correlated with soil TOC (Figure 7a), yet negatively correlated with soil DOC in BIOC and COMP (Figure 7b).

3.2.5. Plant Growth Parameters

A 100% germination rate occurred across all eight replicates among radish samples (Table 7). Root dry biomass in UNAM was the least (1.01 g), while the other treatments averaged 1.65 g. No differences in shoot biomass were observed between all treatments. The resulting root-to-shoot ratio was least in UNAM. Leaf chlorophyll differed between treatments and followed the order of: UNAM > COMP = INF > BIOC.
Among lettuce samples, germination was less successful, ranging between three (INF) and six seedlings (BIOC and COMP) out of eight cone-tainers seeded. Dry leaf biomass was not affected by treatment, but shoot-to-root ratio was the greatest in UNAM and the lowest in BIOC. Leaf chlorophyll followed the order of: UNAM ≥ COMP and INF ≥ BIOC.

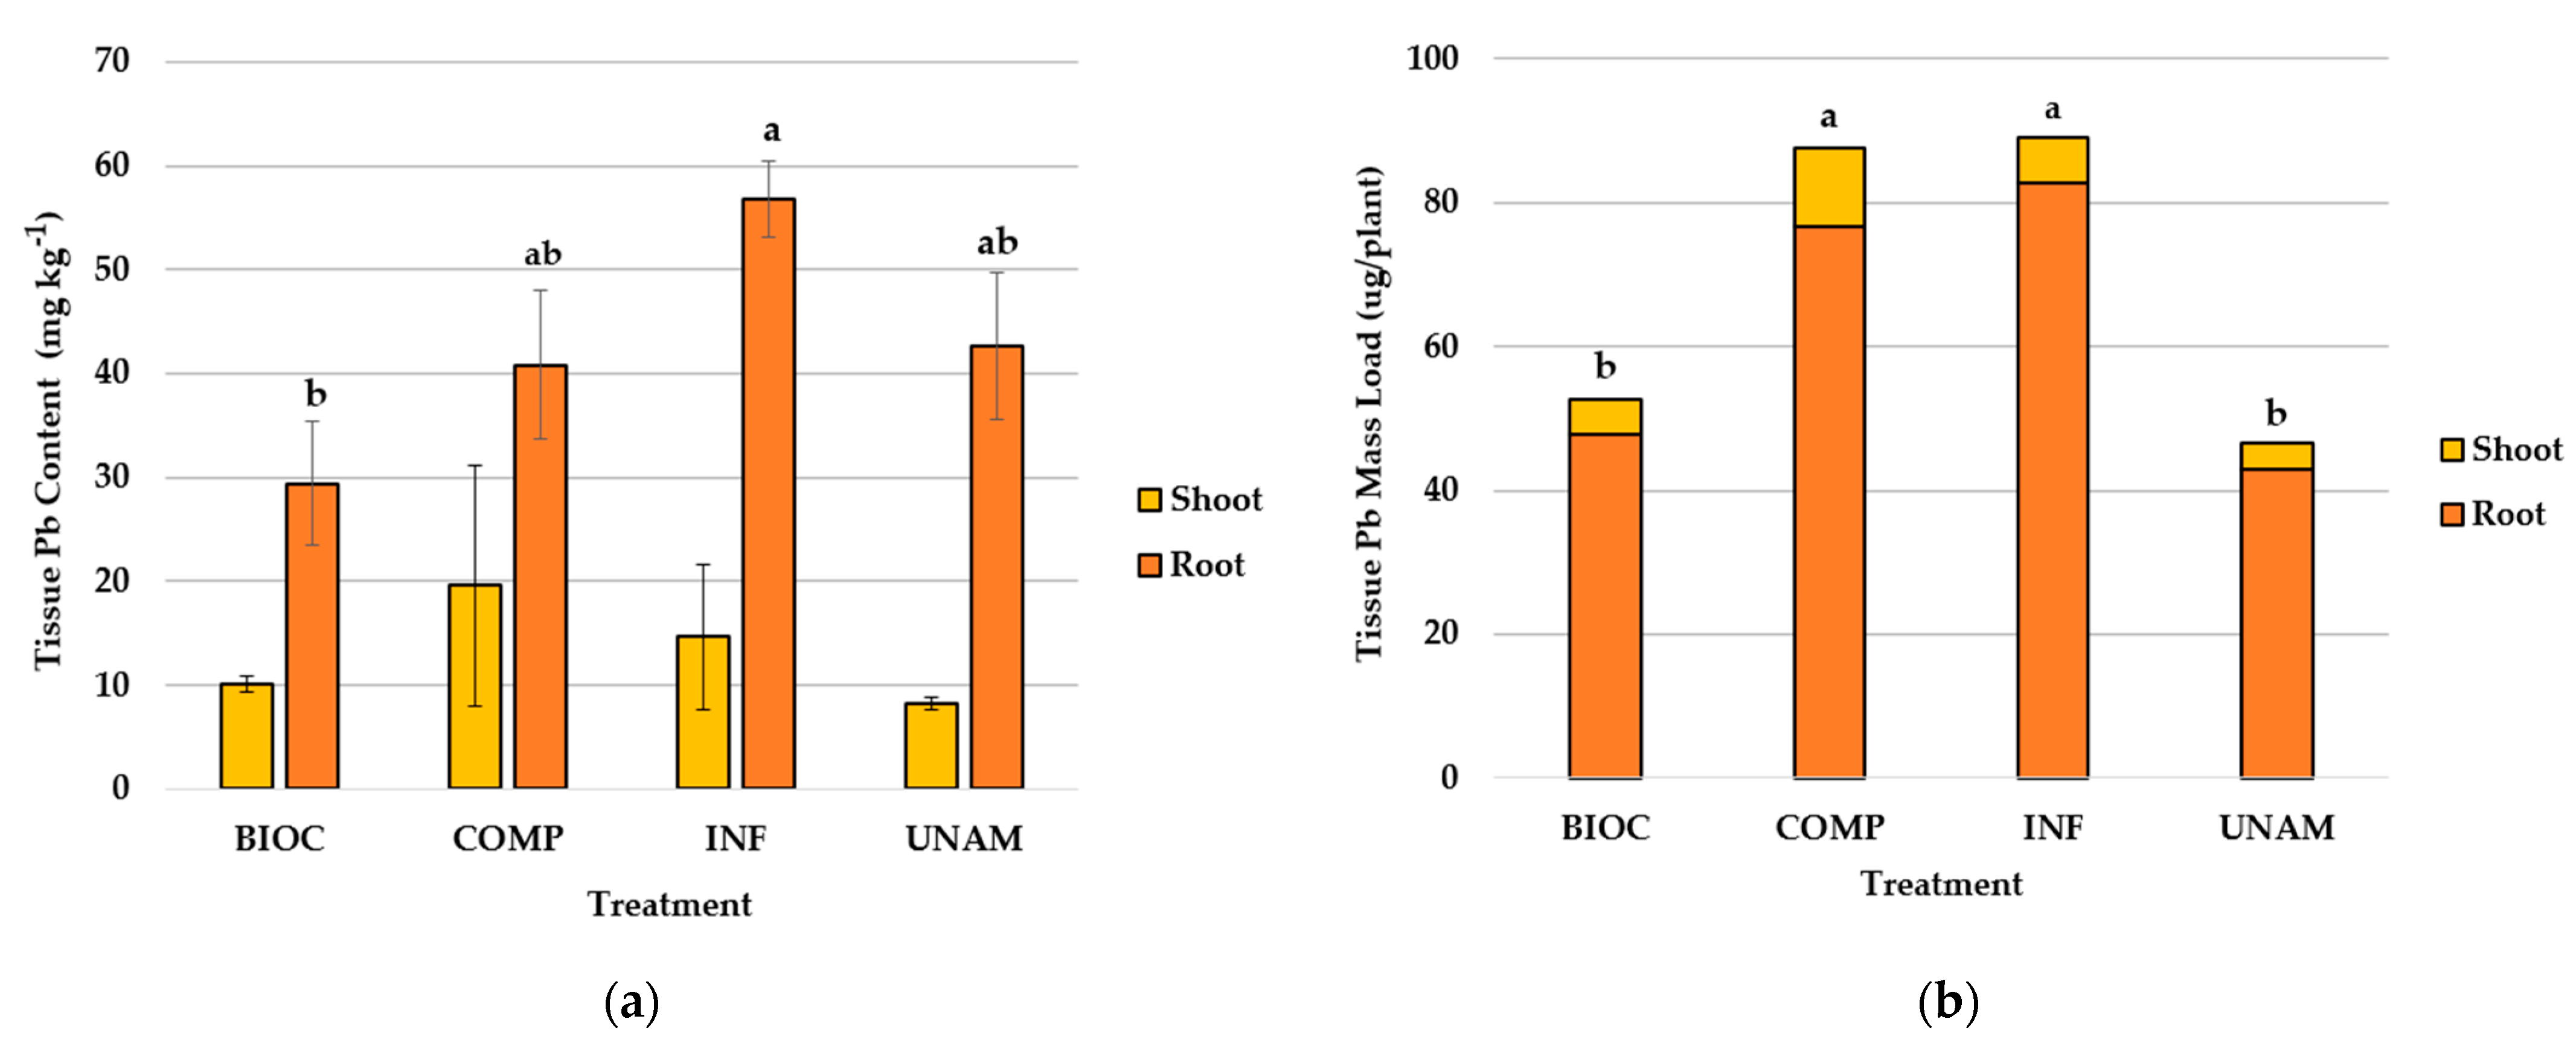
3.2.6. Lead Content and Uptake by Radish

Shoot Pb content did not differ significantly among treatments and averaged 13.2 mg kg−1 (Figure 8a). There were also no significant differences in root Pb content among BIOC (29.4 mg kg−1), COMP (40.8 mg kg−1), and INF (56.8 mg kg−1) relative to UNAM (42.7 mg kg−1). However, root Pb content was significantly lower in BIOC than in INF. Plant Pb uptake, as measured by total mass load, was significantly greater in COMP (87.5 μg) and INF (89.1 μg) than in UNAM (46.7 μg) and BIOC (52.7 μg), which were statistically similar (Figure 8b). The BCF index showed that although none of the treatments were statistically different than UNAM (0.07), the BCF factors for COMP (0.08) and INF (0.09) were significantly greater than BIOC (0.05) (Figure 9a). The TF in COMP (0.14) was significantly greater than in UNAM (0.08) and INF (0.09), while BIOC (0.11) was similar to all treatments (Figure 9b).

4. Discussion

4.1. Amendments and Soil Properties

In general, calcareous soils in arid climates have low OM and nutrient availability, especially available P and available Fe [51], making it difficult to successfully support crop growth without external inputs. Soil laboratory analyses suggest that the soil studied would benefit from the application of amendments rich in plant-available nutrients, particularly orthophosphates and INN, which both fell below optimal ranges for crop production [74,75]. Hence, the addition of amendments, such as locally produced biochar and composted manure, along with other additives like store-bought fertilizers, is a common step that many gardeners take to address these challenges.

4.1.1. Soil Physicochemical Properties

Amending soil did not affect IC concentrations. Amendments, however, affected soil pH and EC. It should be noted that changes to EC and pH occurred upon amendment application, with no significant changes to EC after the 22-week pre-incubation. Biochar was the only amendment that affected soil pH by making soil more alkaline. Greater biochar pH is generally correlated with greater ash content, which increases with increased pyrolysis temperatures [46]. Ippolito et al. (2020) suggest that the greater the pyrolysis temperature, the greater the loss of acidic functional groups, along with increased formation of Ca-, Mg-, Na, and K-bearing oxide, hydroxide, and carbonate mineral phases that can raise pH [46]. Because increased soil alkalinity can reduce the availability of certain nutrients (e.g., Fe), the change in pH in BIOC underscores the importance of selecting a biochar made using an appropriate pyrolysis temperature and feedstock for the intended purpose and soil environment in which it will be used [46,47].
The addition of compost and inorganic fertilizer doubled the EC compared to UNAM and BIOC. Lack of EC response in BIOC may be due to the capacity of charcoal to sorb salts [76]. The increases observed in COMP and INF highlight the utility of amendments in increasing EC in low nutrient soils, where plant health and growth may be adversely impacted through nutrient deficiency. However, it also points to the potential for excessive EC levels through over-application of soil amendments. Excessive EC can prevent effective nutrient uptake by increasing the osmotic pressure of the nutrient solution and also promotes losses of nutrients through leaching [77].

4.1.2. Biogeochemistry in the Absence of Plants

Adding organic amendments modified soil TOC, TN, and the corresponding C:N ratio. Composition of these amendments depends on many factors. As noted above, biochar composition is heavily influenced by pyrolysis temperature and feedstock choice [46]. Our biochar originated from cottonwood chipped material and contained very high TOC (65.1%) and very low TN (only 0.42%). Consequently, BIOC had over double the soil TOC as UNAM. Knowing the chemical composition of biochar is therefore critical for making application recommendations. The high C:N ratio of the biochar used in this study (157) suggests that inherently low TN in native soil combined with low TN in biochar added will likely result in microbial N immobilization due to the initial stimulation of microbial growth that often accompanies the introduction of biochar-delivered DOC [45,52]. This scenario can induce plant N deficiencies. This was further supported by the fact that the application of biochar to native soil in this study (7.5% w/w) resulted in a C:N ratio that was twice as high as the UNAM soils.
Compost TOC and TN contents depend on the length of time the compost ages and whether it originates from animal or plant organic materials [78]. In general, compost applications result in short-term increases in TN, which depends on the frequency of application and the quantity applied [79,80], along with the organic residue material from which it is derived [81]. The aged livestock manure used in this study contained three times as much TN and eight times less TOC than biochar. The compost addition therefore resulted in the greatest soil TN of all treatments, but similar TOC to INF and UNAM. High TN and low TOC in compost resulted in a very low C:N ratio (7) and hence stimulated rapid mineralization and formation of INN. However, by the end of the experiment, the C:N ratio of COMP was statistically similar to that of both UNAM and INF, suggesting that much of the readily decomposable content in COMP amendment had been mineralized. Alternatively, an application rate greater than 7.5% might have been required to substantively change the C:N ratio relative to UNAM.
Soil incubation in the absence of amendments or plants (UNAM Begin and UNAM End Lab Inc) resulted in significant declines to INN and DON over time. Local native soils are known to have high nitrification potential; hence the majority of INN represents soil nitrate (unpublished data). Inorganic N was comparable between COMP and INF, but it is unclear how the low soil C:N ratio of the native soil predetermines soil N mineralization given UNAM had a similar C:N ratio to COMP and INF. Native soil enriched with organic amendments high in N (COMP and INF) had comparable INN and DON concentrations at the beginning of the experiment, however it was clear that COMP was more effective than INF in promoting soil labile N and N mineralization through decomposition (ca. 20–30% annually), as demonstrated by the significantly greater concentrations of INN and DOC at the end of the experiment. In contrast, the trend observed in INF with respect to reductions in labile N over time, though not significant, point to the lack of a continual source of DON and INN without OM or an alternative slow-release N source.
The high soil C:N ratio in BIOC can partially explain the lowest INN and labile DON concentrations in the absence of plants at the beginning of the experiment. Biochar is also known to sequester labile forms of N, particularly NO3-N, primarily through sorption to base functional groups on the biochar surface [82,83] generated during pyrolysis. For this reason, we do not recommend that gardeners use most biochar as a primary N source. Instead, a supplemental source of N may be necessary to offset potential deficiency among crops. Nonetheless, significant increases in INN and DON suggests that, even though concentrations were the lowest of all treatments, biochar underwent decomposition and N mineralization. Variations among biochars can also affect the N mineralization-immobilization process differently [83]. For instance, manure biochar is more likely than plant-based biochar to stimulate N mineralization due to a lower C:N ratio [84]. Additionally, in a study of biochar made from four feedstocks (wood pellets, soft wood bark, switchgrass (Panicum virgatum L.) straw, and anaerobically digested fiber) and amended at three rates, Streubel et al. (2011) showed that soil type has a direct influence on N mineralization, in addition to application rate and feedstock [38].
As mentioned above, native soils appeared to have INN concentrations comparable to COMP and INF at the beginning of the experiment, following the 22-week pre-incubation. This points to the potential of native OM N priming in UNAM during pre-incubation. Nitrogen priming is a change in the soil mineralization process set off by a specific “trigger,” like the addition of N, mechanical disruption, or rhizodeposition, that increases or decreases microbial mineralization [85]. Thus, disruption of native soil and the addition of water that occurred during pre-incubation could have resulted in priming, followed by declines in INN and DON over time, as seen in UNAM.

4.1.3. Soil Iron and Phosphorous in Absence of Plants

Phosphorus and Fe are two important nutrients limiting plant growth in calcareous soils [86]. Although their soil total content may be high, both are largely unavailable to plants in this soil environment due to the poor solubility of cations at a high pH. For every pH unit increase, for example, Fe3+ concentration decreases a thousand-fold [87]. Further, the high concentrations of Ca present readily precipitate with P as Ca-phosphate, which is released extremely slowly over time as the mineral weathers and dissolves, and also sorbs to Ca oxides in soil [88,89]. Observed increases in soil available P concentrations, which were similar among all treatments, were likely the result of increased microbial activity [51]. Similar available P increases have been described in other research documenting changes in soil properties through amendment with biochar and compost [51,90] However, using the Olsen P Method [69], an optimal range for available P in soil is 30–50 mg kg−1 [91], thus the increases observed were likely not sufficient to overcome symptoms of deficiency.
Our data suggests that none of the amendments were a significant source of Fe. Further, the availability of Fe was largely unaffected by the higher pH in BIOC, which was unexpected. Nonetheless, the difference in pH between BIOC and the other treatments did not appear to affect ecologically meaningful differences in terms of Fe availability. General decreases in available Fe observed across all treatments were also observed by Ippolito et al. (2014) [92]. Given the high concentrations of DOC and DON in COMP at the end of the experiment, the significant decrease in Fe in COMP and INF may be attributable to microbial immobilization and microbial biomass decomposition.

4.1.4. Soil Biogeochemical Properties after Plant Harvest

Growing vegetables resulted in a drawdown of soil labile N, indicative of plant uptake. This was particularly evident in soils planted to radish, which exhibited significant decreases in INN and DON uniformly across all treatments. In amended treatments, INN concentrations declined by 25–33 times compared to soils in Lab Inc and only three times in UNAM. Similarly, soil DON declined six times in BIOC and INF and 10 times in COMP compared to Lab Inc. Less of a difference was observed in soils planted to lettuce, where the overall INN and DON concentrations remained much greater compared with soils planted to radish. Greater concentrations in lettuce compared to radish could suggest soil labile N accumulation in excess of plant demand or possible plant stunting (inability to take up N) caused by other growing conditions unrelated to N, including exposure to Pb or nutrient deficiency.
Growing plants also decreased soil DOC concentrations in almost all treatments except for radish in INF and lettuce in COMP. The declines may be associated with heterotrophic rhizosphere microorganisms, which are typically supported by the carbon rich environment created through root exudates [93]. The symbiotic relationship between plants and rhizosphere microbes often facilitates microbially-mediated processes of soil OM immobilization and mineralization [94]. The lack of a decline in DOC in COMP planted to lettuce points to the sustained presence of OM from compost. This contrasts with INF planted to radish, where the lack of significant change in DOC could reflect an increase in root exudation in the acquisition of nutrients other than N.

4.1.5. Soil Phosphorus and Iron after Plant Harvest
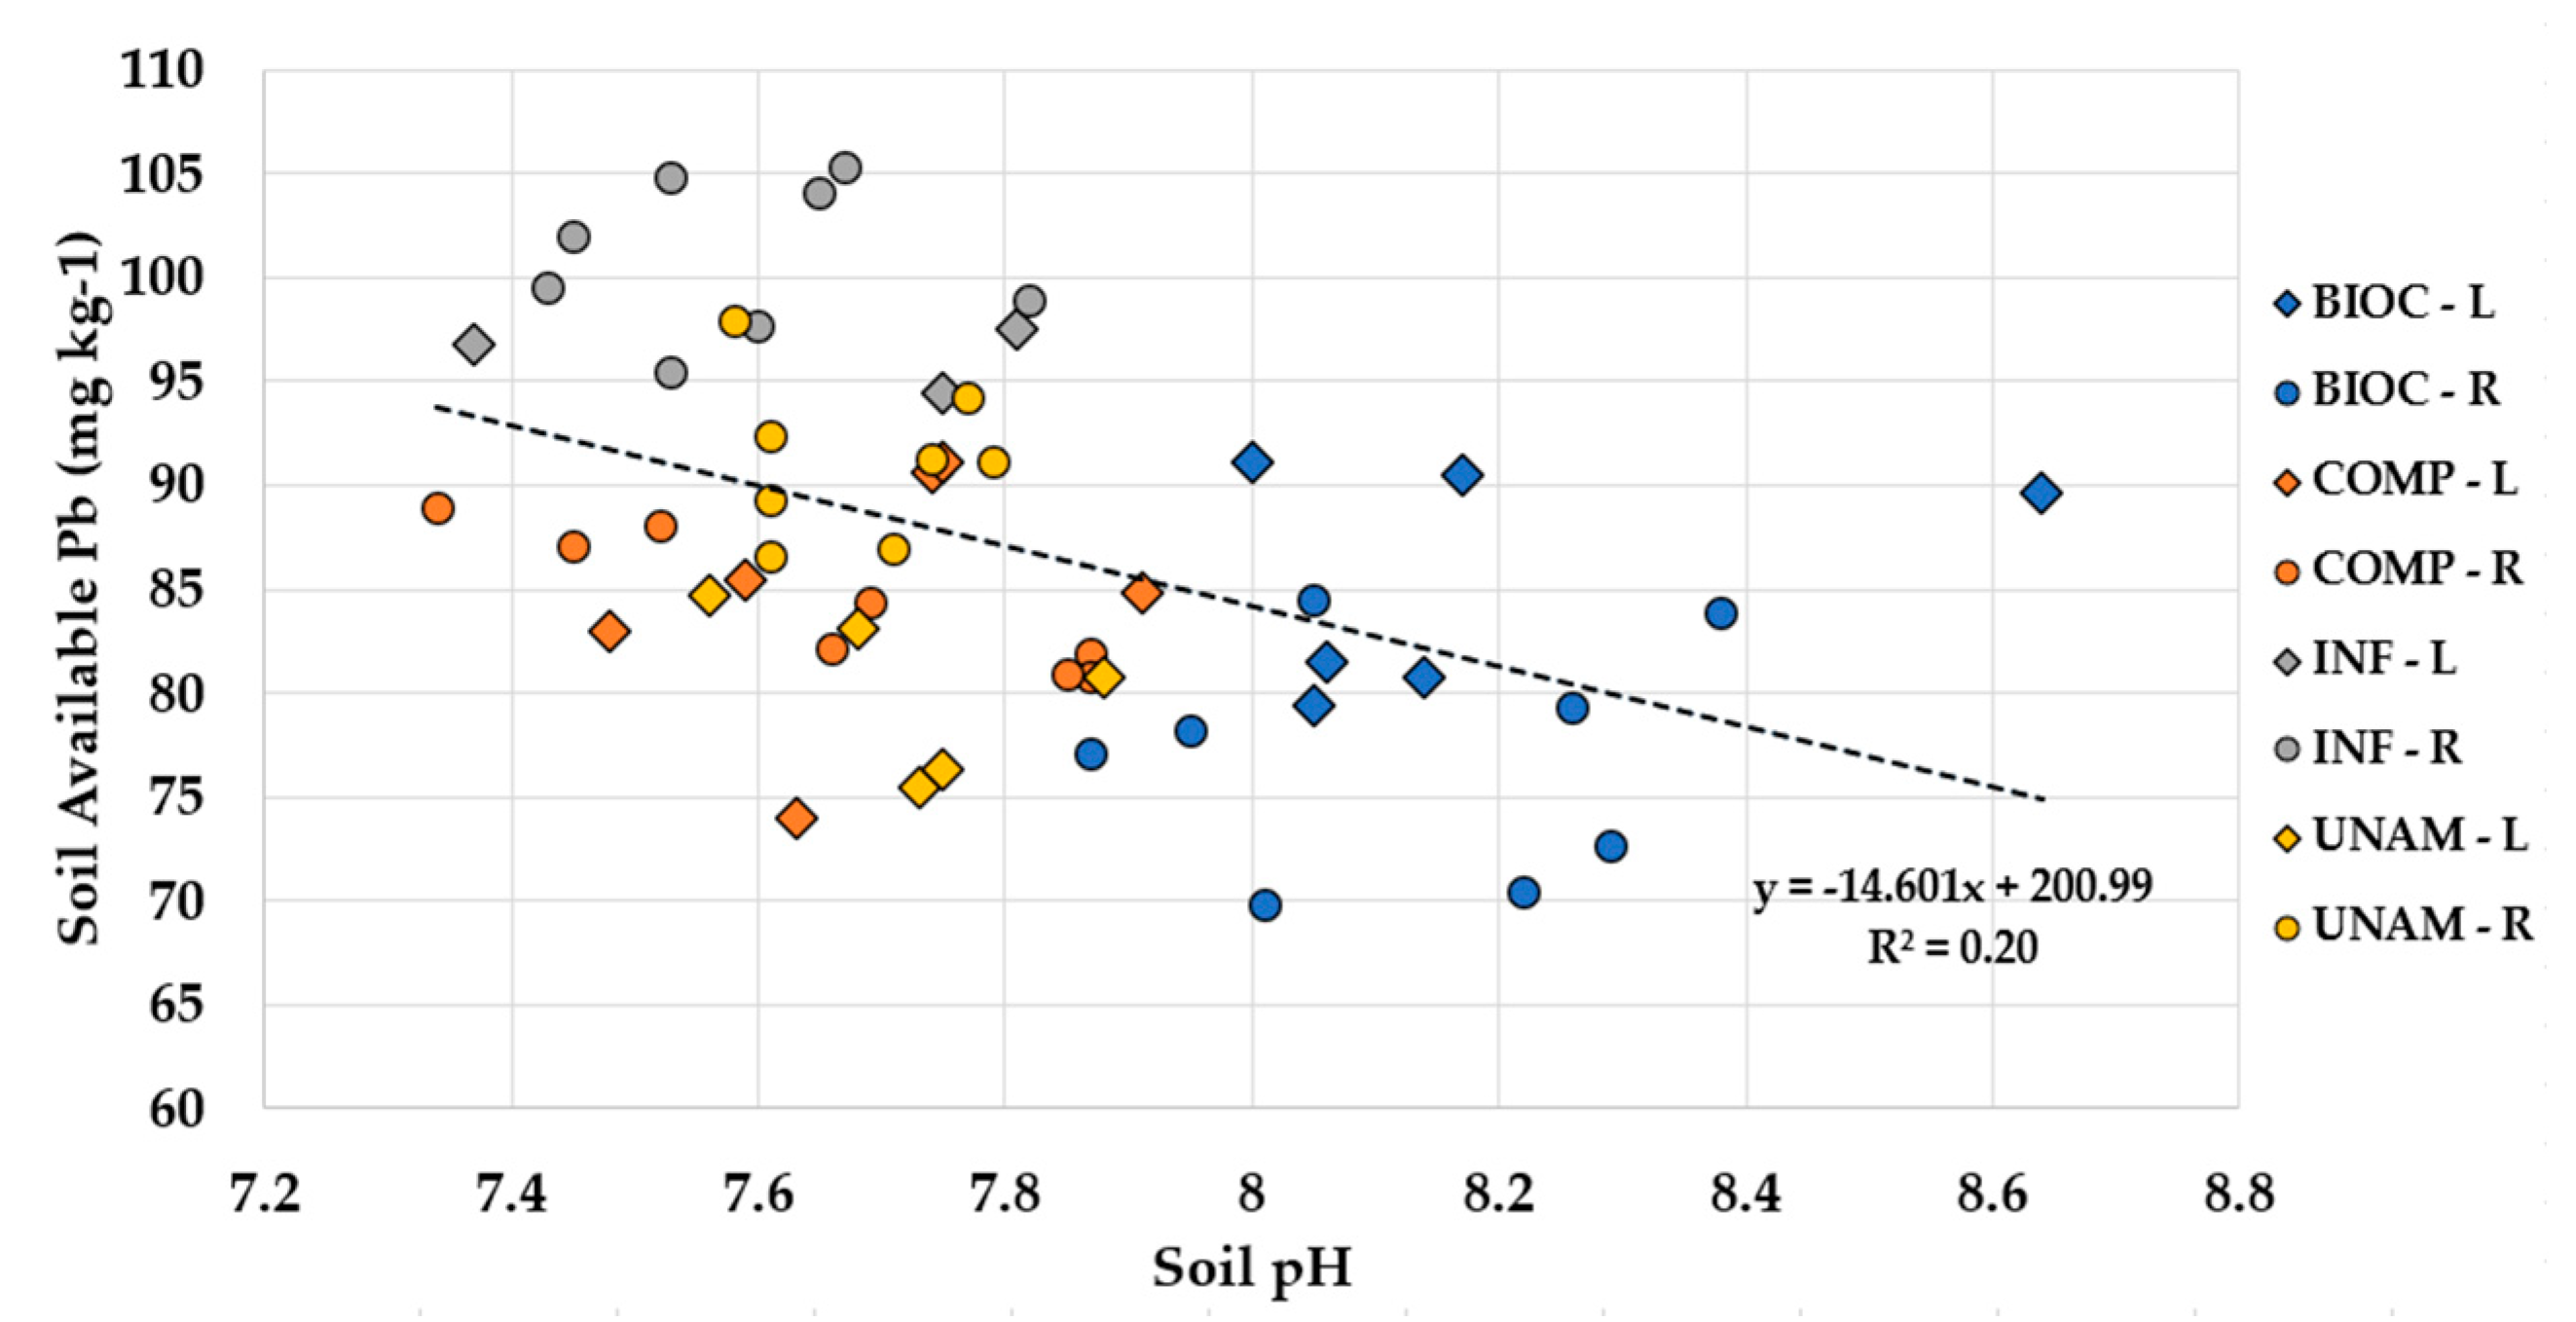
In general, soils experienced small increases in available P concentrations, which was especially evident across all treatments in soils in which radish was grown. This could have been associated with greater root biomass relative to lettuce, and hence production of root exudates that fueled rhizosphere microorganisms in support of P mobilization and mineralization, particularly in COMP. Further, root exudates in the form of organic acids like DOC can electrostatically repel phosphates, thereby increasing P availability in soil [95]. These responses appeared to be suppressed in BIOC, where soil available P was much lower relative to lab incubated, BIOC-treated soil. This could point to biochar-induced plant P deficiency. A study on P sorption from biochar produced from the fast pyrolysis of corn stover (Zea mays L.), Ponderosa pine (Pinus ponderosa Lawson and C. Lawson) wood residue, and switchgrass (Panicum virgatum L.) found that corn stover sorped 79% of bicarbonate-extractable P, while switchgrass biochar sorbed 76%, and Ponderosa pine wood biochar sorbed 31% [96]. The authors speculated that P sorption by biochar occurs mainly due to the exchange between anions of P in solution with the oxygenated functional groups on surface of biochar. Hence, some portion of P mobilized through root exudate may be readily sorbed. The effect of radish and lettuce on available Fe in soil was nominal, though the greater average concentrations in UNAM planted to radish can be probably explained by reduced plant uptake, which corresponds with less root biomass production in radishes grown in unamended soil.

4.2. Soil Lead

4.2.1. Soil Lead Concentrations in Absence of Plant Growth

Amending soils with biochar and compost had no effect on Pb availability at the beginning of the experiment, which was unexpected. Although their influence can vary based on factors like application rate, source materials, and soil type, both are generally known for their capacity to immobilize soil contaminants [37,43,52]. Organic matter interacts with heavy metal ions in soil through three key mechanisms: sorption to surfaces; precipitation with organic acids and other elements; and complexation with precipitates [7,43,90,97]. Biochar’s effectiveness in reducing available heavy metals is often attributed to its large surface area, highly microporous structure, and active organic functional groups, in addition to generally high pH and CEC [37]. Further, biochar contains (hydr)oxides and carbonate phases that cause heavy metals to precipitate [98]. In contrast, compost is more easily decomposable and contains a greater proportion of humic substances, which are responsible for many chemical reactions in soil due to their ability to complex with metal ions, minerals, and hydro(oxides) [8,19,49].
The significant increase in soil pH brought about by the addition of biochar was also expected to correspond more closely with decreased Pb availability. In their meta-analysis on the effects of biochar on metal availability, Chen et al. (2018) noted that increases in soil pH cause metal precipitation, decrease metal availability, and promote adsorption onto soil because of increases in pH-dependent negative charges [43]. Our research did suggest a weak negative correlation with pH in general across all treatments, however the difference in pH between BIOC and the other treatments did not appear to affect significant differences in Pb availability. It is likely that the magnitude of that effect in terms of immobilization would have been more pronounced in an acidic soil than the native alkaline soil used for this experiment [99].
Soil available Pb was probably influenced more directly by native soil properties than the amendments. Calcareous soil is high in CaCO3 and the alkaline pH coupled with carbonate buffering can result in the formation of metal-carbonate precipitate complexes that decrease metal availability [100]. Further, Fe and Pb behave similarly in soils due to commonalities in electronegativity and covalent index (thus the strong correlation observed in this study), and Pb is also known to form complexes with Fe hydro(oxides), particularly in high pH soils [101]. This may explain some of the reductions seen in both Pb and Fe over time.

4.2.2. Soil Lead Concentrations after Plant Harvest

Results showed that the effects of the amendments on Pb availability in soil are modulated by interactions with plants. The negative correlation between available Pb and DOC in BIOC planted to radish suggests that a significant portion of Pb was effectively chelated by the DOC present and sorbed, reducing its availability in soil. Conversely, radish and lettuce grown in INF mobilized significantly more available Pb in soil than their respective species in other treatments. Although the inorganic fertilizer used did contain about 4.15 mg kg−1 of added Pb [102], this concentration was not sufficient to explain the differences. Despite ample N in INF, many soil nutrient deficiencies are known to trigger secretion of root exudates as nutrient chelates, which can also increase the availability of heavy metals [103]. High concentrations of N likely prompted improved plant growth in INF relative to UNAM, perhaps further increasing the plants’ ability to mobilize nutrients, along with available Pb, compared to the control.
Research suggests that greater application rates of compost may improve outcomes in terms of reducing plant Pb uptake. While it is possible that similar releases of available Pb occurred in BIOC and COMP, our data suggest the OM buffered them through sorption and chemical processes. Further, fertilizers containing ammonium have also been shown to increase soil acidity [104], which may also have contributed to greater overall concentrations of available Pb in INF, as it had the lowest pH among all treatments at the end of the experiment.

4.2.3. Lead Uptake in Radish

The three amendments produced statistically similar Pb tissue content (mg kg−1) in radish relative to the unamended control. However, Pb mass load may be a more useful metric for most home gardeners, as it quantifies Pb on a per plant basis. Guidance from the U.S. Food and Drug Administration on maximum daily intake is also provided on a μg/day basis, specifying a maximum intake of 3 µg per day for children and 12.5 µg for adults [105]. While Pb content in radishes grown in COMP was, on average, lower than in INF, average biomass was greater in COMP, hence total plant uptake was nearly identical for both. Similarly, average Pb content in radishes grown in BIOC was lower than in UNAM, but the radishes had comparable mass loads due to greater biomass production in BIOC.
These results suggest that the amendments can have an undesired effect by increasing plant Pb uptake, which is likely attributable to the improved plant growth that often accompanies the incorporation of humic substances [49], along with nutrients in general into low-fertility soils. For instance, in a study on the effects of green waste compost, wheat straw biochar, and a combination thereof applied at 5% and 10% (v/w) and planted to five leafy greens, Medyńska-Juraszek et al. (2020) found that application of compost alone increased the accumulation of Cu, Pb, Cd, and Cr, in Spinacia oleracea L. (spinach) and Anethum graveolens L. (dill) [52]. The study also found that application of biochar often reduced the content of trace elements in tissues, which we observed as well with respect to a modest (22%) difference between the tissue content (mg kg−1) of radishes grown in BIOC versus UNAM, although the difference was not statistically significant. Medyńska-Juraszek et al. (2020) noted that the most effective amendment was a combination of biochar and compost at 10% (v/w) each, which reduced both Pb and Cd uptake in nearly all tested plant species, with reductions of Pb in spinach, dill, and lettuce by 42%, 44%, ad 57%, respectively.
The BCFs suggest that radishes grown in BIOC are significantly less likely than those in COMP and INF to take up Pb relative to exposure. This finding is unsurprising given the tissue mass load findings. Medyńska-Juraszek et al. (2020) observed a similar trend with plants grown in compost displaying a greater BCF (also referred to “bioaccumulation factor,” or “BAC”) than those grown in biochar. The authors noted that application of organic amendments at high rates (10%) decreased the BCF of the metals they tested in comparison to the control [52].
It is interesting to consider radish BCF and mass load in combination with soil available Pb at the end of the experiment (Figure 9c). Although biomass production in BIOC was similar to COMP and INF, radishes grown in BIOC took up significantly less Pb. This suggests that the lower BCF and related mass load were a result of successful immobilization of soil available Pb over the course of the experiment, which prevented radish uptake. Compost had a similar BCF to both UNAM and INF, but significantly greater mass load than UNAM in combination with significantly less soil available Pb than both UNAM and INF. Although the addition of compost resulted in increased Pb uptake, the reduction in soil available Pb through plant uptake was sustained over the course of the experiment. This suggests that compost could be an effective amendment in combination with soil phytoremediation efforts. In contrast, radishes grown in INF had a significantly greater mass load than UNAM and BIOC in addition to greater soil available Pb than all other treatments at the end of the experiment, indicating that despite high plant uptake, the inorganic fertilizer used also continued to contribute to soil Pb availability.
For most plant species, the majority of Pb accumulates in the roots [9], as was observed in this study. This may be an important factor for gardeners in determining which crops to grow in potentially Pb contaminated soil or in managing safe daily consumption levels of home-grown vegetables. Radishes grown in COMP demonstrated the greatest capacity for Pb translocation to shoots, followed by BIOC. Translocation is influenced by many factors, including species, physiological factors, and characteristics of individual metals, and is also known to increase in the presence of organic chelators like EDTA and DTPA [9,53]. In a study on Pb uptake by Brassica campestris L., (pak choi cabbage) after treatment with green waste compost applied at 2%, 5%, and 10% (w/w), Liu et al. (2020) suggest that humic and fulvic acids decomposed from compost played a role as chelators to form Pb complexes, which influenced translocation in tissues. Our data seem to support these findings [53]. High Pb concentrations are also known to destroy the physical barrier formed by the Casparian strip [9].
Low chlorophyll concentrations in plants grown in BIOC were likely not directly linked to Pb uptake given the low tissue Pb status relative to COMP and INF, but could point to the early onset of N deficiency. Radish and lettuce samples both displayed symptoms often associated with Pb exposure, which included severe stunting, chlorosis, poor root development, and lowered rates of germination. However, it was not possible to discern whether the observations we observed, such as stunting, were caused by Pb exposure or a nutrient deficiency, which can be expressed similarly. High concentrations of heavy metals can also amplify existent nutrient deficiencies in calcareous soils by interfering with plant nutrient uptake and transportation. For example, Pb has been shown to reduce Fe2+ concentrations in radish leaves [24]. Further, the soil used in the study was known to be contaminated with multiple contaminants [unpublished data], which also limited our ability to specifically attribute visual symptoms of toxicity to Pb. This highlights the difficulty many gardeners may encounter in discerning the difference, and underscores the need for soil testing in potentially contaminated sites.

4.3. Limitations and Future Opportunities

An overarching goal of this experiment was to provide information and recommendations for small-scale urban gardeners on effective, affordable options to reduce potential exposure to Pb through consumption of contaminated crops. Our results suggest that a combination of biochar and compost is a promising approach for achieving desired crop production combined with reduced plant Pb uptake. Awareness and use of locally-sourced compost is commonplace; however, despite its accessibility in most parts of the U.S., use of biochar is not widespread among gardeners. The lack of broad adoption may be partly attributed to many producers in the U.S. having only small to medium-scale production and marketing capacity. At the same time, the promotion of biochar among small-scale urban gardeners as a cost-effective and environmentally sustainable solution is also predicated on the use of locally-available resources, suggesting a need for additional producers at the local level. Secondary to general awareness and wide-spread adoption of biochar, many consumers are likely unfamiliar with how factors like feedstock and pyrolysis process can influence desired soil outcomes. Compost can be produced at home and is frequently available free of cost through city municipalities. In contrast, the average retail price of biochar is around $3.08/kg in the U.S. [106], presenting another limitation for some urban gardeners. Nonetheless, the biochar industry shows promise. A recent analysis valued the U.S. biochar sales in 2019 at $97.8 million [107], suggesting a growing market exists among gardeners as demand for organic and sustainable products increases.
Future research would be benefited by field studies, as a majority of data on biochar has been collected through laboratory and greenhouse experiments. Additionally, as studies on biochar plus compost mixes are becoming more popular, further research on optimal application ratios for reduction of soil Pb and other contaminants should be explored. Another promising area of study in the combination of biochar and compost pertains to timing of applications, namely whether best results are achieved through mixing at the time of soil amendment or if sequential applications are more beneficial (e.g., addition of biochar followed by compost after pre-incubation period or mixture of biochar with feedstock prior to composting).

5. Conclusions

In general, amendments selected for this experiment and incubated in absence of plants do not impact soil available Pb. However, amended soils planted to food crops respond differently, not only in terms of soil available Pb, but also in regard to differences in plant uptake. Amending potentially contaminated garden soils with biochar appears to be a reliable method to reduce the risk of Pb exposure among urban gardeners. Significant declines in both soil Pb availability and plant bioaccumulation (almost 20% and 11%, respectively) in native soils amended with biochar point to effective Pb immobilization and reduced uptake by plants. Not as effective as biochar, compost nonetheless reduces soil available Pb by 8% when planted to radish, although this may primarily be a reflection of removal through plant uptake. The observed 19% increase in tissue content of radish grown in soil amended with compost is of concern, however, particularly for those growing root crops. In contrast, the water-soluble inorganic fertilizer used in this study has a detrimental impact in all respects. Not only does it mobilize soil Pb by 11%, but it also enhances plant uptake and bioaccumulation in radish by as much as 40%. This is likely due to a lack of key chemical reactions (adsorption, complexation, and precipitation) largely associated with the presence of organic matter that are known to reduce soil Pb availability. Further, because the added nutrients are in an exclusively plant-available form, plants grown in soil treated with an inorganic fertilizer produce significantly greater biomass than those in an unamended soil, increasing the amount of Pb deposited in plant tissues on a per plant basis. For these reasons, use of water-soluble inorganic fertilizer should be avoided in potentially Pb contaminated garden soils, especially those low in organic matter. Gardeners are encouraged to test their soils for contamination and carefully consider crop selection, avoiding root crops. When needed, they should apply biochar in combination with compost. This combination of treatments is recommended to overcome a potential for initial N deficiency induced by biochar, which is alleviated by compost. More information on remediation of garden contaminated soils should be broadly available to audiences interested converting open urban areas into garden spaces.

Author Contributions

Conceptualization, U.N.; methodology, T.G. and U.N.; software, T.G. and U.N.; validation, T.G. and U.N.; formal analysis, T.G.; investigation, T.G.; resources, U.N.; data curation, T.G.; writing—original draft preparation, T.G. and U.N.; writing—review and editing, T.G. and U.N.; visualization, T.G. and U.N.; supervision, U.N.; project administration, U.N.; funding acquisition, U.N. All authors have read and agreed to the published version of the manuscript.

Funding

This research was funded by Hatch Multistate Research Fund (Grant No. 10047928) and the University of Wyoming, Department of Plant Sciences.

Institutional Review Board Statement

Not applicable.

Informed Consent Statement

Not applicable.

Data Availability Statement

The data presented in this study are openly available in FigShare at doi:10.6084/m9.figshare.14703483.

Acknowledgments

The authors would like to thank the Wyoming State Geological Survey, the Colorado State University Soil, Water, and Plant Testing Lab, and Ward Laboratories, Inc. of Kearney, NE, USA for the use of lab instruments and technical support. The authors would also like to thank the anonymous peer reviewers for their valuable input on the final document.

Conflicts of Interest

The authors declare no conflict of interest. The funders had no role in the design of the study; in the collection, analyses, or interpretation of data; in the writing of the manuscript, or in the decision to publish the results.

References

  1. Armstrong, D. A survey of community gardens in upstate New York: Implications for health promotion and community development. Health Place 2000, 6, 319–327. [Google Scholar] [CrossRef]
  2. Twiss, J.; Dickinson, J.; Duma, S.; Kleinman, T.; Paulsen, H.; Rilveria, L. Community Gardens: Lessons Learned from California Healthy Cities and Communities. Am. J. Public Health 2003, 93, 1435–1438. [Google Scholar] [CrossRef]
  3. Brown, K.H.; Jameton, A.L. Public Health Implications of Urban Agriculture. J. Public Health Policy 2000, 21, 20–39. [Google Scholar] [CrossRef]
  4. Coelho, F.; Coelho, E.; Egerer, M. Local food: Benefits and failings due to modern agriculture. Sci. Agric. 2018, 75, 84–94. [Google Scholar] [CrossRef] [Green Version]
  5. Berg, A.E.; Winsum-Westra, M.V.; Vries, S.D.; Dillen, S.M. Allotment gardening and health: A comparative survey among allotment gardeners and their neighbors without an allotment. Environ. Health A Glob. Access Sci. Source 2010, 9, 1–12. [Google Scholar] [CrossRef] [Green Version]
  6. Blair, D.; Giesecke, C.C.; Sherman, S. A dietary, social and economic evaluation of the Philadelphia urban gardening project. J. Nutr. Educ. 1991, 23, 161–167. [Google Scholar] [CrossRef]
  7. Lwin, C.S.; Seo, B.H.; Kim, H.U.; Owens, G.; Kim, K.R. Application of soil amendments to contaminated soils for heavy metal immobilization and improved soil quality—A critical review. Soil Sci. Plant Nutr. 2018, 156–167. [Google Scholar] [CrossRef]
  8. Zaccone, C.; Caterina, R.D.; Rotunno, T.; Quinto, M. Soil—Farming System—Food—Health: Effect of conventional and organic fertilizers on heavy metal (Cd, Cr, Cu, Ni, Pb, Zn) content in semolina samples. Soil Tillage Res. 2010, 107, 97–105. [Google Scholar] [CrossRef]
  9. Pourrut, B.; Shahid, M.; Dumat, C.; Winterton, P.; Pinelli, E. Lead uptake, toxicity, and detoxification in plants. Rev. Environ. Contam. Toxicol. 2011, 113–136. [Google Scholar] [CrossRef] [Green Version]
  10. Angelone, M.; Bini, C. Trace elements concentrations in soils and plants of western Europe. In Biogeochemistry of Trace Metals, 1st ed.; Adriano, D.C., Ed.; Lewis Publishers: Boca Raton, FL, USA, 1992; pp. 19–60. [Google Scholar]
  11. Atafar, Z.; Mesdaghinia, A.; Nouri, J.; Homaee, M.; Yunesian, M.; Ahmadimoghaddam, M.; Mahvi, A.H. Effect of fertilizer application on soil heavy metal concentration. Environ. Monit. Assess. 2008, 160, 83–89. [Google Scholar] [CrossRef] [PubMed]
  12. Liu, X.; Zhang, A.; Ji, C.; Joseph, S.D.; Bian, R.; Li, L.; Pan, G.; Paz-Ferreiro, J. Biochar’s effect on crop productivity and the dependence on experimental conditions—A meta- analysis of literature data. Plant Soil 2013, 373, 583–594. [Google Scholar] [CrossRef]
  13. Meuser, H. Causes of soil contamination in the urban environment. In Contaminated Urban Soils, 1st ed.; Alloway, B., Trevors, T.J., Eds.; Springer: Heidelberg, Germany, 2010; Volume 18, pp. 29–94. [Google Scholar]
  14. Wei, B.; Yang, L. A review of heavy metal contaminations in urban soils, urban road dusts and agricultural soils from China. Microchem. J. 2010, 94, 99–107. [Google Scholar] [CrossRef]
  15. Kim, B.F.; Poulsen, M.N.; Margulies, J.D.; Dix, K.L.; Palmer, A.M.; Nachman, K.E. Urban Community Gardeners’ Knowledge and Perceptions of Soil Contaminant Risks. PLoS ONE 2014, 9, 1–9. [Google Scholar] [CrossRef] [PubMed]
  16. Harms, A.M.; Presley, D.R.; Hettiarachchi, G.M.; Thien, S.J. Assessing the Educational Needs of Urban Gardeners and Farmers on the Subject of Soil Contamination. J. Ext. Educ. 2013, 51, 1FEA10. [Google Scholar]
  17. McBride, M.B. Environmental Chemistry of Soils; Oxford University Press: New York, NY, USA, 1994; pp. 308–341. [Google Scholar]
  18. Pinto, A.; Mota, A.; Varennes, A.D.; Pinto, F. Influence of organic matter on the uptake of cadmium, zinc, copper and iron by sorghum plants. Sci. Total Environ. 2004, 326, 239–247. [Google Scholar] [CrossRef]
  19. Antoniadis, V.; Levizoua, E.; Shaheen, S.M.; Ok, Y.S.; Sebastian, A.; Baume, C.; Prasad, M.N.V.; Rinklebeg, J. Trace elements in the soil-plant interface: Phytoavailability, translocation, and phytoremediation—A review. Earth-Sci. Rev. 2017, 171, 221–245. [Google Scholar] [CrossRef]
  20. Huang, Y.; Chen, Q.; Deng, M.; Japenga, J.; Li, T.; Yang, X.; He, Z. Heavy metal pollution and health risk assessment of agricultural soils in a typical peri-urban area in southeast China. J. Environ. Manag. 2018, 207, 159–168. [Google Scholar] [CrossRef]
  21. Al-Heety, E.A.M.S.; Yassin, K.H.; Abd-Alsalaam, S. Health risk assessment of some heavy metals in urban community garden soils of Baghdad City, Iraq. Hum. Ecol. Risk Assess. 2017, 23, 225–240. [Google Scholar] [CrossRef]
  22. Khan, D.; Frankland, B. Effects of cadmium and lead on radish plants with particular reference to movement of metals through soil profile and plant. Plant Soil 1983, 70, 335–345. [Google Scholar] [CrossRef]
  23. Abadin, H.; Ashizawa, A.; Stevens, Y.-W.; Llados, F.; Diamond, G.; Sage, G.; Swarts, S.G. Toxicological Profile for Lead. U.S. Department of Health and Human Services. Available online: https://www.atsdr.cdc.gov/toxprofiles/tp13.pdf (accessed on 21 June 2021).
  24. Gopal, R.; Botany, A.H. Excess lead alters growth, metabolism and translocation of certain nutrients in radish. Chemosphere 2008, 70, 1539–1544. [Google Scholar] [CrossRef]
  25. Saxena, G.; Purchase, D.; Mulla, S.I.; Saratale, G.D.; Bharagava, R.N. Phytoremediation of Heavy Metal-Contaminated Sites: Eco-environmental Concerns, Field Studies, Sustainability Issues, and Future Prospects. Rev. Environ. Contam. Toxicol. 2019, 249. [Google Scholar] [CrossRef] [Green Version]
  26. Kizilkaya, R.; Akin, T.; Bayrakli, B.; Sǎlam, M. Microbiological characteristics of soils contaminated with heavy metals. Eur. J. Soil Biol. 2004, 40, 95–102. [Google Scholar] [CrossRef]
  27. Ussiri, D.A.; Lal, R. Carbon sequestration in reclaimed mine soils. CRC Crit. Rev. Plant Sci. 2005, 24, 151–165. [Google Scholar] [CrossRef]
  28. Walker, D.; Clemente, R.; Roig, A.; Bernal, M. The effects of soil amendments on heavy metal bioavailability in two contaminated Mediterranean soils. Environ. Pollut. 2003, 122, 303–312. [Google Scholar] [CrossRef]
  29. Clemente, R.; Paredes, C.; Bernal, M. A field experiment investigating the effects of olive husk and cow manure on heavy metal availability in a contaminated calcareous soil from Murcia (Spain). Agric. Ecosyst. Environ. 2007, 118, 319–326. [Google Scholar] [CrossRef]
  30. García-Gil, J.; Ceppi, S.; Velasco, M.; Polo, A.; Senesi, N. Long-term effects of amendment with municipal solid waste compost on the elemental and acidic functional group composition and pH-buffer capacity of soil humic acids. Geoderma 2004, 121, 135–142. [Google Scholar] [CrossRef]
  31. Vega, F.; Andrade, M.; Covelo, E. Influence of soil properties on the sorption and retention of cadmium, copper and lead, separately and together, by 20 soil horizons: Comparison of linear regression and tree regression analyses. J. Hazard. Mater. 2010, 174, 522–533. [Google Scholar] [CrossRef]
  32. Dahn, R.; Scheidegger, A.; Manceau, A.; Schlegel, M.; Baeyens, B.; Bradbury, M.; Chateigner, D. Structural evidence for the sorption of Ni(II) atoms on the edges of montmorillonite clay minerals: A polarized X-ray absorption fine structure study. Geochim. Cosmochim. Acta 2003, 67, 1–15. [Google Scholar] [CrossRef]
  33. Bi, X.; Ren, L.; Gong, M.; He, Y.; Wang, L.; Ma, Z. Transfer of cadmium and lead from soil to mangoes in an uncontaminated area, Hainan Island, China. Geoderma 2010, 155, 115–120. [Google Scholar] [CrossRef]
  34. Dumat, C.; Quenea, K.; Bermond, A.; Toinen, S.; Benedetti, M. Study of the trace metal ion influence on the turnover of soil organic matter in cultivated contaminated soils. Environ. Pollut. 2006, 142, 521–529. [Google Scholar] [CrossRef]
  35. Uzu, G.; Sobanska, S.; Aliouane, Y.; Pradere, P.; Dumat, C. Study of lead phytoavailability for atmospheric industrial micronic and sub-micronic particles in relation with lead speciation. Environ. Pollut. 2009, 157, 1178–1185. [Google Scholar] [CrossRef] [Green Version]
  36. Violante, A.; Cozzolino, V.; Perelomov, L.; Caporale, A.; Pigna, M. Mobility and bioavailability of heavy metals and metalloids in soil environments. Soil Sci. Plant Nutr. 2010, 10, 268–292. [Google Scholar] [CrossRef] [Green Version]
  37. Cheng, J.; Li, Y.; Gao, W.; Chen, Y.; Pan, W.; Lee, X.; Tang, Y. Effects of biochar on Cd and Pb mobility and microbial community composition in a calcareous soil planted with tobacco. Biol. Fertil. Soils 2018, 54, 373–383. [Google Scholar] [CrossRef]
  38. Streubel, J.; Collins, H.; Garcia-Perez, M.; Tarara, J.; Granatstein, D.; Kruger, C. Influence of Contrasting Biochar Types on Five Soils at Increasing Rates of Application. Soil Sci. Soc. Am. J. 2011, 75, 1402–1413. [Google Scholar] [CrossRef]
  39. Lehmann, J.; Gaunt, J.; Rondon, M. Biochar Sequestration in Terrestrial Ecosystems—A Review. Mitig. Adapt. Strateg. Glob. Chang. 2006, 11, 403–427. [Google Scholar] [CrossRef]
  40. Bruun, W.W.; Müller-Stöer, D.; Ambus, P.; Hauggaard-Nielsen, H. Application of biochar to soil and N2o emmisions: Potential effects of blending fast-pyrolysis biochar with anaerobically digested slurry. Eur. J. Soil Sci. 2011, 62, 581–589. [Google Scholar] [CrossRef]
  41. Lehmann, J.; da Silva, J.; Steiner, C.; Nehls, T.; Zech, W.; Glaser, B. Nutrient availability and leaching in an archaeological anthrosol and a ferralsol of the central Amazon Basin: Fertilizer, manure and charcoal amendments. Plant Soil 2003, 249, 343–357. [Google Scholar] [CrossRef]
  42. Bian, R.; Joseph, S.; Cui, L.; Pan, G.; Li, L.; Liu, X.; Zhang, A.; Rutlidge, H.; Wong, S.; Chia, C.; et al. A three-year experiment confirms continuous immobilization of cadmium and lead in contaminated paddy field with biochar amendment. J. Hazard. Mater. 2014, 272, 121–128. [Google Scholar] [CrossRef]
  43. Chen, D.; Liu, X.; Bian, R.; Cheng, K.; Zhang, X.; Zheng, J.; Joseph, S.; Crowley, D.; Pan, G.; Li, L. Effects of biochar on availability and plant uptake of heavy metals—A meta-analysis. J. Environ. Manag. 2018, 222, 76–85. [Google Scholar] [CrossRef] [PubMed]
  44. Lehmann, J. Nature. A handful of carbon. Nature 2007, 447, 143–144. [Google Scholar] [CrossRef]
  45. Ippolito, J.A.; Novak, J.M.; Busscher, W.J.; Ahmedna, M.; Rehrah, D.; Watts, D.W. Switchgrass Biochar Affects Two Aridisols. J. Environ. Qual. 2012, 41, 1123–1130. [Google Scholar] [CrossRef]
  46. Ippolito, J.A.; Cui, L.; Kammann, C.; Wrage-Mönnig, N.; Estavillo, J.M.; Fuertes-Mendizabal, T.; Cayuela, M.L.; Sigua, G.; Novak, J.; Spokas, K.; et al. Feedstock choice, pyrolysis temperature and type influence biochar characteristics: A comprehensive meta-data analysis review. Biochar 2020, 2, 421–438. [Google Scholar] [CrossRef]
  47. Gajanan, S.G.; Shinde, S.K.; Kadam, A.A.; Saratale, R.G.; Saratale, G.D.; Kumar, M.; Palem, R.R.; AL-Shwaiman, H.A.; Elgorban, A.M.; Syed, A.; et al. Review on biomass feedstocks, pyrolysis mechanism and physicochemical properties of biochar: State-of-the-art framework to speed up vision of circular bioeconomy. J. Clean. Prod. 2021, 297, 126645. [Google Scholar] [CrossRef]
  48. Pennanen, T.; Srivastava, V.; Sillanpaa, M.; Sainio, T. Compost: Potent biosorbent for the removal of heavy metals from industrial and landfill stormwater. J. Clean. Prod. 2020, 273, 122736. [Google Scholar] [CrossRef]
  49. Trevisan, S.; Francioso, O.; Quaggiotti, S.; Nardi, S. Humic substances biological activity at the plant-soil interface. Plant Signal. Behav. 2010, 5, 635–643. [Google Scholar] [CrossRef] [Green Version]
  50. Haroon, B.; Irshad, M.; Hafeez, F.; Pervez, A. Fractionation of heavy metals in contaminated soil after amendment with composted cow manure and poultry litter. Arab. J. Geosci. 2019, 12. [Google Scholar] [CrossRef]
  51. Karimi, A.; Moezzi, A.; Chorom, M.; Enayatizamir, N. Application of Biochar Changed the Status of Nutrients and Biological Activity in a Calcareous Soil. Soil Sci. Plant Nutr. 2020, 20, 450–459. [Google Scholar] [CrossRef]
  52. Medyńska-Juraszek, A.; Bednik, M.; Chohura, P. Assessing the Influence of Compost and Biochar Amendments on the Mobility and Uptake of Heavy Metals by Green Leafy Vegetables. Int. J. Environ. Res. Public Health 2020, 17, 7861. [Google Scholar] [CrossRef] [PubMed]
  53. Liu, Y.; Sun, X.; Li, S.; Zhou, W.; Ma, Q.; Zhang, J. Influence of green waste compost on Pb-polluted soil remediation, soil quality improvement, and uptake by Pakchoi cabbage (Brassica campestris L. ssp). Environ. Sci. Pollut. Res. 2020, 27, 7693–7701. [Google Scholar] [CrossRef]
  54. Sun, L.; Niu, Z.; Sun, T. Effects of amendments of N, P, Fe on phytoextraction of Cd, Pb, Cu, and Zn in soil of Zhangshi by mustard, cabbage, and sugar beet. Environ. Toxicol. 2007, 22, 565–571. [Google Scholar] [CrossRef]
  55. Lin, C.; Zhu, T.; Liu, L.; Wanga, D. Influences of major nutrient elements on Pb accumulation of two crops from a Pb-contaminated soil. J. Hazard. Mat. 2010, 174, 202–208. [Google Scholar] [CrossRef] [PubMed]
  56. Singh, A.; Agrawala, M.; Marshall, F.M. The role of organic vs. inorganic fertilizers in reducing phytoavailability of heavy metals in a wastewater-irrigated area. Ecol. Eng. 2010, 36, 1733–1740. [Google Scholar] [CrossRef]
  57. He, W.; Yang, X.; Yang, J.; He, Z. Effect of lead on plant availability of phosphorus and potassium in a vegetable–soil system. Environ. Sci. Pollut. Res. 2018, 25, 34793–34797. [Google Scholar] [CrossRef] [PubMed]
  58. United States Census Bureau. 2010. Available online: https://www.census.gov/quickfacts/fact/table/laramiecitywyoming/POP060210 (accessed on 1 April 2021).
  59. 2017 Census of Agriculture, County Profile. USDA National Agricultural Statistics Service. Available online: https://www.nass.usda.gov/Publications/AgCensus/2017/Online_Resources/County_Profiles/Wyoming/cp56001.pdf (accessed on 10 June 2021).
  60. Western Regional Climate Center. Laramie AP, Wyoming. Available online: https://wrcc.dri.edu/cgi-bin/cliMAIN.pl?wy5415 (accessed on 25 May 2021).
  61. U.S. Department of Agriculture, Natural Resources Conservation Service. ALCOVA Series. 2001. Available online: https://soilseries.sc.egov.usda.gov/OSD_Docs/A/ALCOVA.html (accessed on 25 May 2021).
  62. Knight, J. An Eyesore? The U.S. Might Have Needed It—Laramie’s Aluminum Plant a WWII Reminder. Albany County Historical Society. 2019. Available online: https://www.wyoachs.com/larmies-living-history-businesses/2019/3/23/an-eyesore-the-us-might-have-needed-it-laramies-aluminum-plant-a-wwii-reminder (accessed on 25 May 2021).
  63. Tippin, C. DEQ Overseeing Cleanup of Site South of Laramie. Laramie Boomerang. 2017. Available online: https://www.laramieboomerang.com/news/deq-overseeing-cleanup-of-site-south-of-laramie/article_be2471d4-f9c9-593f-8521-f689bb215f45.html (accessed on 25 May 2021).
  64. Bremner, J. Nitrogen Total. In Methods of Soil Analysis Part 3: Chemical Methods; Sparks, D., Ed.; Soil Science Society of America: Madison, WI, USA, 1996; pp. 1085–1122. [Google Scholar]
  65. Doane, T.; Horwath, W. Spectrophotometric determination of nitrate with a single reagent. Anal. Lett. 2003, 39, 2713–2722. [Google Scholar] [CrossRef]
  66. Hart, S.; Stark, J.M.; Davidson, E. Nitrogen mineralization, immobilization, and nitrification. In Methods of Soil Analysis. Part 2: Microbiological and Biochemical Properties, 5.2; Weaver, R.W., Angle, S., Bottomly, P., Eds.; Soil Science Society of America: Madison, WI, USA, 1994; pp. 985–1018. [Google Scholar]
  67. Newcomb, J.; Carrilo, Y. Shimadzu Carbon and Nitrogen Analyzer Protocol; University of Wyoming: Laramie, WY, USA, 2011; unpublished work. [Google Scholar]
  68. Sherrod, L.A.; Dunn, G.; Peterson, G.A.; Kolberg, R.L. Inorganic carbon analysis by modified pressure-calcimeter method. Soil Sci. Soc. Am. J. 2002, 66, 299–305. [Google Scholar] [CrossRef]
  69. Olsen, S.; Cole, C.V.; Watanabe, F.S.; Dean, L.A. Estimation of Available Phosphorus in Soils by Extraction with Sodium Bicarbonate. In United States Department of Agriculture Circular No. 939; United States Department of Agriculture: Washington, DC, USA, 1954. [Google Scholar]
  70. Lindsay, W.; Norvell, W. Development of a DTPA soil test for zinc, iron, manganese, and copper. Soil Sci. Soc. Am. 1978, 42, 421–428. [Google Scholar] [CrossRef]
  71. Soon, Y.K. Determination of Cadmium, Chromium, Cobalt, Lead and Nickel in Plant Tissue. In Handbook of Reference Methods for Plant Analysis, 1st ed.; Kalra, Y.P., Ed.; CRC Press: Boca Raton, FL, USA, 1998; pp. 193–198. [Google Scholar]
  72. Antonangeli, J.A.; Zhang, H. The Use of Biochar as a Soil Amendment to Reduce Potentially Toxic Metals (PTMs) Phytoavailability. In Applications of Biochar for Environmental Safety; Abdelhafez, A.A., Abbas, M.H., Eds.; Intechopen: London, UK, 2020. [Google Scholar] [CrossRef]
  73. Ahmad, M.; Usman, A.R.; Al-Faraj, A.S.; Ahmad, M.; Sallam, A.; Al-Wabel, M.I. Phosphorus-loaded biochar changes soil heavy metals availability and uptake potential of maize (Zea mays L.) plants. Chemosphere 2018, 194, 327–339. [Google Scholar] [CrossRef]
  74. Self, J. Soil Test Explanation—0.502. Colorado State University Extension. 2010. Available online: https://extension.colostate.edu/topic-areas/agriculture/soil-test-explanation-0-502/ (accessed on 25 May 2021).
  75. Swift, C. Vegetable Gardening—Nitrogen Recommendations—7.247. Colorado State University Extension. 2020. Available online: https://extension.colostate.edu/topic-areas/yard-garden/vegetable-gardening-nitrogen-recommendations-7-247/ (accessed on 25 May 2021).
  76. Awan, S.; Ippolito, J.A.; Ullman, J.L.; Ansari, K.; Cui, L.; Siyal, A.A. Biochars reduce irrigation water sodium adsorption ratio. Biochar 2021, 3, 77–87. [Google Scholar] [CrossRef]
  77. Ding, X.; Jiang, Y.; Zhao, H.; Guo, D.; He, L.; Liu, F.; Zhou, Q.; Nandwani, D.; Hui, D.; Yu, J. Electrical conductivity of nutrient solution influenced photosynthesis, quality, and antioxidant enzyme activity of pakchoi (Brassica campestris L. ssp. Chinensis) in a hydroponic system. PLoS ONE 2018, 13. [Google Scholar] [CrossRef]
  78. Zhang, X.; Zhao, Y.; Zhu, L.; Cui, H.; Jia, L.; Xie, X.; Li, J.; Wei, Z. Assessing the use of composts from multiple sources based on the characteristics of carbon mineralization in soil. Waste Manag. 2017, 70, 30–36. [Google Scholar] [CrossRef]
  79. Tambone, F.; Genevini, P.; Adani, F. The Effects of Short-Term Compost Application On Soil Chemical Properties and on Nutritional Status of Maize Plant. Compost. Sci. Util. 2007, 15, 176–183. [Google Scholar] [CrossRef]
  80. Whalen, J.K.; Benslim, H.; Jiao, Y.; Sey, B.K. Soil organic carbon and nitrogen pools as affected by compost applications to a sandy-loam soil in Québec. Can. J. Soil Sci. 2008, 88, 443–450. [Google Scholar] [CrossRef] [Green Version]
  81. Yang, X.; Reynolds, W.D.; Drury, C.F.; Fleming, R.; Tan, C.S.; Denholm, K.; Yang, J. Organic carbon and nitrogen stocks in a clay loam soil 10 years after a single compost application. Can. J. Soil Sci. 2014, 94, 357–363. [Google Scholar] [CrossRef]
  82. Kameyama, K.; Miyamoto, T.; Shiono, T.; Shinogi, Y. Influence of Sugarcane Bagasse-derived Biochar Application on Nitrate Leaching in Calcaric Dark Red Soil. J. Environ. Qual. 2012, 41, 1131–1137. [Google Scholar] [CrossRef]
  83. Nguyen, T.T.; Xu, C.Y.; Tahmasbian, I.; Che, R.; Xu, Z.; Zhou, X.; Wallace, H.M.; Bai, S.H. Effects of biochar on soil available inorganic nitrogen: A review and meta-analysis. Geoderma 2017, 288, 79–96. [Google Scholar] [CrossRef] [Green Version]
  84. Singh, B.; Cowie, A.; Smernik, R. Biochar carbon stability in a clayey soil as a function of feedstock and pyrolysis temperature. Environ. Sci. Technol. 2012, 46, 11770–11778. [Google Scholar] [CrossRef]
  85. Fiorentinoa, N.; Sánchez-Monedero, M.; Lehmann, J.; Enders, A.; Fagnano, M.; Cayuelab, M. Interactive priming of soil N transformations from combining biochar and urea inputs: A 15N isotope tracer study. Soil Biol. Biochem. 2019, 131, 166–175. [Google Scholar] [CrossRef]
  86. United Nations Food and Agriculture Organization (FAO). Management of Calcareous Soils. Available online: http://www.fao.org/soils-portal/soil-management/management-of-some-problem-soils/calcareous-soils/en/#:~:text=Phosphorous%20is%20often%20lacking%20in,be%20in%20water%20soluble%20form (accessed on 25 May 2021).
  87. Havlin, J.L.; Tisdale, S.L.; Nelson, W.L.; Beaton, J.D. Soil Fertility and Fertilizers, 8th ed.; Pearson, Inc.: Boston, MA, USA, 2013; pp. 261–269. [Google Scholar]
  88. Prasad, R.; Chakraborty, D. Phosphorus Basics: Understanding Phosphorus Forms and Their Cycling in the Soil. Alabama A&M and Auburn Universities. Available online: https://www.aces.edu/wp-content/uploads/2019/04/ANR-2535-Phosphorus-Basics_041719L.pdf (accessed on 24 May 2021).
  89. Weng, L.; Vega, F.A.; Van Riemsdijk, W.H. Competitive and synergistic effects in pH dependent phosphate adsorption in soils: LCD modeling. Environ. Sci. Technol. 2011, 45, 8420–8428. [Google Scholar] [CrossRef] [PubMed]
  90. Mohamed, I.; Ahamadou, B.; Li, M.; Gong, C.; Cai, P.; Liang, W.; Huang, Q. Fractionation of copper and cadmium and their binding with soil organic matter in a contaminated soil amended with organic materials. J. Soils Sediments 2010, 10, 973–982. [Google Scholar] [CrossRef]
  91. Beegle, D.B.; Durst, P.T. Managing Phosphorus for Crop Production. Pennsylvania State University. 2002. Available online: https://extension.psu.edu/programs/nutrient-management/educational/soil-fertility/managing-phosphorus-for-crop-production/extension_publication_file (accessed on 25 May 2021).
  92. Ippolito, J.A.; Stromberger, M.E.; Lentz, R.D.; Dungan, R.S. Hardwood Biochar Influences Calcareous Soil Physicochemical and Microbiological Status. J. Environ. Qual. 2014, 43, 681–689. [Google Scholar] [CrossRef] [PubMed] [Green Version]
  93. Morgan, J.A.; Bending, G.D.; White, P.J. Biological costs and benefits to plant–microbe interactions in the rhizosphere. J. Exp. Bot. 2005, 56, 1729–1739. [Google Scholar] [CrossRef] [PubMed] [Green Version]
  94. Sarfraz, R.; Hussain, A.; Sabir, A.; Fekih, I.B.; Ditta, A.; Xing, S. Role of biochar and plant growth promoting rhizobacteria to enhance soil carbon sequestration—A review. Environ. Monit. Assess. 2019, 191. [Google Scholar] [CrossRef]
  95. Fink, J.R.; Inda, A.V.; Tiecher, T.; Barrón, V. Iron oxides and organic matter on soil phosphorus availability. Cienc. Agrotecnol. 2016, 40, 369–379. [Google Scholar] [CrossRef] [Green Version]
  96. Chintala, R.; Schumacher, T.E.; McDonald, L.M.; Clay, D.E.; Malo, D.D.; Papiernik, S.K.; Clay, S.A.; Julson, J.L. Phosphorus Sorption and Availability from Biochars and Soil/Biochar Mixtures. Clean 2014, 42, 626–634. [Google Scholar] [CrossRef]
  97. Ström, L.; Owen, A.G.; Godbold, D.L.; Jones, D.L. Organic acid behaviour in a calcareous soil implication for rhizosphere nutrient cycling. Soil Biol. Biochem. 2005, 37, 2046–2054. [Google Scholar] [CrossRef]
  98. Ippolito, J.A.; Berry, C.M.; Strawn, D.G.; Novak, J.M.; Levine, J.; Harley, A. Biochars Reduce Mine Land Soil Bioavailable Metals. J. Environ. Qual. 2017, 46, 411–419. [Google Scholar] [CrossRef] [PubMed]
  99. Stewart, C.E.; Zheng, J.; Botte, J.; Cotrufo, M.F. Co-generated fast pyrolysis biochar mitigates greenhouse gas emissions and increases carbon sequestration. Glob. Chang. Biol. Bioenergy 2013, 5, 153–164. [Google Scholar] [CrossRef]
  100. Shahkolaie, S.S.; Baranimotlagh, M.; Dordipour, E.; Khormali, F. Cadmium and lead immobilization in a calcareous contaminated soil using the cost-effective amendments. Arab. J. Geosci. 2019, 12. [Google Scholar] [CrossRef]
  101. Dong, Y.; Ma, L.; Rhue, R. Relation of enhanced Pb solubility to Fe partitioning in soils. Environ. Pollut. 2000, 110, 515–522. [Google Scholar] [CrossRef]
  102. Information Registered Fertilizer, Ag Mineral, Ag Amendment, and Lime Products. Oregon Department of Agriculture. Available online: http://oda.state.or.us/dbs/heavy_metal/detail.lasso?-op=eq&product_id=2462 (accessed on 18 February 2021).
  103. Sherene, T. Effect of Dissolved Organic Carbon (DOC) on Heavy Metal Mobility in Soils. Nat. Environ. Pollut. Technol. 2009, 8, 817–821. [Google Scholar]
  104. Guan, W. Effects of Nitrogen Fertilizers on Soil pH. Purdue University, Vegetable Crops Hotline. 2016. Available online: https://vegcropshotline.org/article/effects-of-nitrogen-fertilizers-on-soil-ph/ (accessed on 25 February 2021).
  105. U.S. Food & Drug Administration. Lead in Food, Foodwares, and Dietary Supplements. 2020. Available online: https://www.fda.gov/food/metals-and-your-food/lead-food-foodwares-and-dietary-supplement. (accessed on 25 May 2021).
  106. State of the Biochar Industry 2014. International Biochar Initiative. Available online: https://biochar-international.org/state-of-the-biochar-industry-2014/ (accessed on 15 June 2021).
  107. Grand View Research. U.S. Biochar Market Size, Share & Trend Analysis Report by Technology (Gasification, Pyrolysis), By Application (Agriculture, Animal Feed, Health & Beauty Products), by States, and Segment Forecasts, 2020–2027. Available online: https://www.grandviewresearch.com/industry-analysis/us-biochar-market (accessed on 15 June 2021).
Figure 1. Graphical scheme of study design and analyses conducted.
Applsci 11 05777 g001
Figure 2. Soil available nutrient concentrations: (a) available phosphorus (P) and (b) iron (Fe) in soils amended with biochar (BIOC), compost (COMP), inorganic fertilizer (INF), and unamended control (UNAM) at the beginning of the experiment (Begin) presented next to a stepwise comparison of final concentrations for soils planted to radish, lettuce, and lab-incubated soil (Lab Inc). Lower case letters represent statistically significant differences across all treatments and groups. Asterisks indicate a significant difference within each treatment in concentrations between Begin and end (Lab Inc, Radish and Lettuce). Statistical tests were performed using a two-way Analysis of Variance (ANOVA) or Kruskal-Wallis if data could not be normalized. Tukey HSD and Dunn’s test (non-normal data) were used to determine treatment significance at a p ≤ 0.05.
Applsci 11 05777 g002
Figure 3. Available lead (Pb) concentrations in soils amended with biochar (BIOC), compost (COMP), inorganic fertilizer (INF), and unamended control (UNAM) at the beginning of the experiment (Begin) presented next to a stepwise comparison of final concentrations for soils planted to radish, lettuce, and lab-incubated (Lab Inc). Lower case letters represent statistically significant differences across all treatments and life forms. Asterisks indicate a significant difference within each treatment in concentrations between Begin and end (Lab Inc, Radish, and Lettuce). Statistical tests were performed using a two-way Analysis of Variance (ANOVA) or Kruskal-Wallis if data could not be normalized. Tukey HSD and Dunn’s test (non-normal data) were used to determine treatment significance at a p ≤ 0.05.
Applsci 11 05777 g003
Figure 4. Correlation between soil pH and available soil lead (Pb) among radish (R) and lettuce (L) samples. Colors represent different treatments (biochar, BIOC; compost, COMP, inorganic fertilizer, INF; and unamended control, UNAM) and shapes represent different life forms (diamond for lettuce and circle for radish). Statistical analysis was conducted using Pearson’s correlation test and observations were considered significant at p ≤ 0.05.
Applsci 11 05777 g004
Figure 5. Relationship between soil available iron (Fe) and available lead (Pb) using data from both plant species and lab incubation at the end of the experiment. Colors represent different treatments (biochar, BIOC; compost, COMP, inorganic fertilizer, INF, and unamended control, UNAM). A regression line accompanied by the slope equation and an R-sq value is shown (INF and BIOC only) when significant.
Applsci 11 05777 g005
Figure 6. Relationship between soil available lead (Pb) and soil nitrogen parameters: (a) dissolved organic nitrogen (DON); (b), potentially mineralizable N (PMN); and (c) and inorganic N (ammonium and nitrate). Colors represent different treatments (biochar, BIOC; compost, COMP, inorganic fertilizer, INF, and unamended control, UNAM) when a significant regression line accompanied by the slope equation and an R-sq value is shown for each individual amendment.
Applsci 11 05777 g006
Figure 7. Relationship between soil available lead (Pb) and soil carbon parameters: (a) total organic carbon (TOC); (b) and dissolved organic carbon (DOC). Colors represent different treatments (biochar, BIOC; compost, COMP, inorganic fertilizer, INF, and unamended control, UNAM). When significant, a regression line accompanied by the slope equation and an R-sq value is shown for each individual amendment.
Applsci 11 05777 g007
Figure 8. Radish Pb uptake measurements: (a) root and shoot tissue lead (Pb) average concentrations accompanied by mean error bars; (b) average root and shoot mass loads for plants grown in soils amended with biochar (BIOC), compost (COMP), inorganic fertilizer (INF), and unamended control (UNAM). Lowercase letters on each figure indicate statistically significant differences between treatments. Statistical tests were performed using a two-way Analysis of Variance (ANOVA) or Kruskal-Wallis if data could not be normalized. Tukey HSD or Dunn’s test (non-normal data) were used to determine treatment significance at a minimum of p ≤ 0.05.
Applsci 11 05777 g008
Figure 9. Lead uptake indicators and soil concentrations among radish samples: (a) bioconcentration factor (BCF); (b) translocation factor (TF); and (c) soil available lead (Pb) for radish grown in soils amended with biochar (BIOC), compost (COMP), inorganic fertilizer (INF) and unamended control (UNAM). Lowercase letters indicate statistically significant differences between treatments. Statistical tests were performed using a two-way Analysis of Variance (ANOVA) or Kruskal-Wallis if data could not be normalized. Tukey HSD and Dunn’s test (non-normal data) were used to determine treatment significance at a minimum of p ≤ 0.05.
Applsci 11 05777 g009
Table 1. Characteristics of native soil collected at beginning of pre-incubation. Data presented as average values with standard error in parentheses (n = 3).
Soil MetricsSoil Measurement
TextureSandy Clay Loam
Moisture (g g−1)0.04 (0.01)
pH (1:2 soil: water)7.4 (0.1)
EC (μS cm−1)553 (3)
Total Organic Carbon (TOC) (mg kg−1)36,793 (1638)
Inorganic Carbon (IC) (mg kg−1)17,573 (248)
Total Nitrogen (mg kg−1)2123 (15)
Inorganic Nitrogen (INN) (mg kg−1)9.90 (0.4)
Potentially Mineralizable Nitrogen (PMN) (mg kg−1)1.53 (0.29)
Dissolved Organic Carbon (DOC) (mg kg−1)282 (12)
Dissolved Organic Nitrogen (DON) (mg kg−1)2.09 (0.55)
Available Phosphorus (AP) (mg kg−1)0.27 (0.01)
Total Pb (mg kg−1)733 (29)
Available Pb (mg kg−1)111 (8)
Total Fe (mg kg−1)20,703 (386)
Available Fe (mg kg−1)8.87 (0.48)
Table 2. Chemical properties of amendments prior to addition of native soil and water. The mineral composition of the inorganic fertilizer was sourced from the product label. Results for biochar and composted manure were obtained through laboratory testing. Use of “n/a” in the table indicates that a specific element was not provided with the laboratory report or product label but does not necessarily suggest that the element is entirely absent.
Chemical CompositionBiocharCompostInorganic Fertilizer
Carbon and Nitrogen: ---%---
Total Nitrogen0.421.24n/a
Total Carbon 65.108.57n/a
C-to-N ratio1547n/a
Macronutrients: ---%---
Organic N n/a1.15n/a
Ammonium n/a0.0043.500
Nitrate n/a0.08620.50
Available Phosphorus 0.110.858.00
Potassium n/a2.1316.00
Calcium 3.213.93n/a
Magnesium 0.390.68n/a
Sulfur 0.060.41n/a
Micronutrients:--ppm-----%---
Boron 29.228.4 0.02
Coppern/a23.30.07
Iron 18189330.15
Manganese 51241.60.05
Molybdenum 0.07n/a0.0005
Zinc 5395.70.06
Trace Elements: ---%---
Sodium n/a0.33n/a
Table 3. Soil physicochemical properties: pH, electrical conductivity (EC), inorganic carbon (IC), total organic C (TOC), total nitrogen (TN), and C to N ratio (C:N) in soils amended with biochar (BIOC), compost (COMP), inorganic fertilizer (INF), and from unamended control (UNAM). Values represent mean averages with standard errors in parentheses. Measurements at the beginning of the experiment before plant seeding are denoted as “Begin.” Measurements at the end of the experiment are marked “End.” The data are provided for individual plant species (End Radish and End Lettuce) and lab incubated soil (End Lab Inc.) if statistical differences existed among these groups for each soil treatment or, alternately, presented across all samples if there were no differences between groups (“All”). Lowercase letters indicate statistically significant differences by treatment. If there were no differences between treatments, “ns” is indicated. Statistical tests were performed using a two-way Analysis of Variance (ANOVA) or Kruskal-Wallis if data could not be normalized. Tukey HSD or Dunn’s test were used to determine treatment significance of p ≤ 0.05 at minimum.
Soil Physicochemical PropertiesBIOCCOMPINFUNAMF-Statp-Value
pH (1:2 soil: water)
Begin8.4 (0.10) a7.8 (0.00) b7.7 (0.10) b7.9 (0.00) b26.38≤0.001
End (All)8.2 (0.05) a7.7 (0.04) b7.6 (0.04) b7.7 (0.03) b37.23≤0.001
EC (μS cm−1)
Begin689 (23) bc1209 (84) a956 (49) ab537 (20) c22.67≤0.001
End Radish464 (14) b 615 (32) a 434 (12) b472 (27) b8.86≤0.001
End Lettuce929 (93) ab1057 (110) a908 (65) ab597 (32) b3.97≤0.05
IC (mg kg−1)
End (All)17,457 (714)15,971 (701)16,774 (813)17,007 (559)0.79ns
TOC (mg kg−1)
End (All)78,043 (1778) a35,465 (1422) b30,887 (1252) b33,977 (1247) b32.08≤0.001
TN (mg kg−1)
End Lab Inc2330 (40) b2820 (45) a1927 (53) c1947 (33) c62.15≤0.001
End Radish2221 (29) ab2279 (67) a2064 (37) b2134 (32) ab4.12≤0.05
End Lettuce2220 (35) b2528 (53) a2130 (64) b2022 (23) c21.2≤0.001
Soil C:N Ratio
End (All)42.30 (0.79) a21.11 (0.36) b23.41 (0.32) b25.04 (0.31) b40.80≤0.001
Table 4. Soil Labile carbon (C) and N (N) concentrations: dissolved organic C (DOC), dissolved organic nitrogen (N), potentially mineralizable N (PMN), and inorganic N (nitrate and ammonium; INN) in soils amended with biochar (BIOC), compost (COMP), inorganic fertilizer (INF), and from unamended control (UNAM). Values represent mean averages with standard errors in parentheses. Measurements at the beginning of the experiment before plant seeding are denoted as “Begin.” Measurements at the end of the experiment are labeled as “End.” The data are provided for individual plant species (End Radish, End Lettuce) or lab-incubated (End Lab-Inc) samples if statistical differences existed between the groups or, alternately, across all samples if there were no differences (“All”). Lowercase letters in a row indicate statistically significant differences by treatment within each group. No differences between treatments are marked as “ns.” Asterisks indicate a significant difference between Begin and End concentrations over time. Concentrations below the instrument’s detection limit are marked as “<d.l.” Statistical tests were performed using a two-way Analysis of Variance (ANOVA) or Kruskal-Wallis if data could not be normalized. Tukey HSD or Dunn’s test were used to determine treatment significance at p ≤ 0.05 at minimum.
Soil Labile
C and N
Properties
BIOCCOMPINFUNAMF-Statp-Value
DOC (mg kg−1)
Begin398.85 (58.12) a270.69 (14.38) ab163.03 (13.5) b212.50 (11.91) b7.06≤0.05
End Lab Inc298.97 (23.06) ab389.10 (17.38) a *243.16 (30.09) b188.20 (27.27) b7.89≤0.01
End Radish48.40 (12.10) c *132.68 (11.83) b *198.24 (16.28) a112.20 (9.62) b *17.76≤0.001
End Lettuce126.05 (13.99) b *213.44 (18.12) a111.81 (6.02) b *147.80 (14.43) ab *6.86≤0.01
DON (mg kg−1)
Begin12.45 (0.25) c75.48 (10.88) ab101.50 (15.57) a28.33 (3.23) bc12.21≤0.01
End Lab Inc19.83 (0.11) ab *92.08 (0.51) a58.38 (1.47) ab11.80 (0.35) b *10.39≤0.05
End Radish3.41 (0.17) b *9.13 (1.36) a *9.21 (3.24) a *8.70 (2.31) a *12.31≤0.001
End Lettuce19.91 (3.73) b42.06 (6.78) ab *64.40(14.53) a18.44 (2.13) b4.65≤0.05
PMN (mg kg−1)
Begin1.64 (0.96)5.69 (1.36)<d.l.4.23 (0.61)5.52≤0.05
End Lab Inc0.36 (0.08) b3.45 (0.36) a1.45 (0.41) ab 3.13 (1.03) ab4.54≤0.05
End Radish3.02 (0.27) c10.63 (1.55) a8.64 (1.55) ab 5.49 (0.88) b7.03≤0.01
End Lettuce<d.l. 6.89 (0.83) a2.74 (0.45) b 1.18 (0.20) b *61.10≤0.01
INN (mg kg−1)
Begin15.2 (1.22) b195.16 (17.54) a217.12 (25.10) a137.76 (21.14) a15.75≤0.01
End Lab Inc65.73 (5.36) c *207.11 (9.01) a150.51 (3.13) b22.07 (0.59) d *153.70≤0.001
End Radish1.77 (0.18) *6.68 (1.70) *6.20 (1.71) *6.79 (1.62) *1.91ns
End Lettuce16.70 (2.48) 16.04 (1.25) *14.33 (0.66) *14.28 (2.06) *0.30ns
Table 5. p-Values and correlation coefficients for the relationship between soil available lead (Pb) and pH, total organic carbon (TOC), C to nitrogen (N) ratio (C:N), and available iron (Fe) across all treatments and plant species + lab incubated soil. Statistical analysis was conducted using Pearson’s correlation test and observations were considered significant at p ≤ 0.05.
Soil Parameter Soil Available Pb
p-ValueCorr Coeff
pH (1:2, soil:H2O)≤0.001−0.45
TOC (mg kg−1)≤0.001−0.46
C:N Ratio≤0.01−0.36
Available Fe (mg kg−1)≤0.010.36
Table 6. p-Values and significant values of correlation coefficients representing relationships between soil available lead (Pb) and pH, electrical conductivity (EC), potentially mineralizable N (PMN), inorganic N (ammonium and nitrate, INN), dissolved organic nitrogen (DON), dissolved organic carbon (DOC), available phosphorous (AP), C:N ratio, and available iron (Fe) for both plant species, plus lab incubated soil (All) or Radish and Lettuce separately in soils amended with biochar, BIOC; compost, COMP, inorganic fertilizer, INF, and unamended control, UNAM. Statistical analysis was conducted using Pearson’s correlation test and observations were considered significant at p ≤ 0.05 and analyses were performed on number of observations as indicated in brackets below the column headings.
Soil Parameter CorrelateBIOCCOMPINFUNAM
p-ValueCorr Coeffp-ValueCorr Coeffp-ValueCorr Coeffp-ValueCorr Coeff
All(n = 17)(n = 17)(n = 14)(n = 16)
EC (μS cm−1) ≤0.050.57--≤0.05−0.62--
PMN (mg kg−1)≤0.01−0.67--≤0.050.61≤0.100.48
INN (mg kg−1)≤0.050.52--≤0.001−0.85--
DOC (mg kg−1)≤0.050.51------
DON (mg kg−1)≤0.010.69--≤0.01−0.68--
AP (mg kg−1)- ----≤0.0010.78
C:N Ratio -----≤0.05−0.52
Available Fe (mg kg−1)≤0.0010.90--≤0.010.72--
Radish(n = 8)(n = 8)(n = 8)(n = 8)
DOC (mg kg−1)≤0.05−0.77------
TOC (mg kg−1)≤0.010.94≤0.010.84----
C:N Ratio≤0.050.83------
pH (1:2, soil:H20) --≤0.001−0.94----
DON (mg kg−1)≤0.05−0.72------
Available Fe (mg kg−1)≤0.010.88------
Lettuce(n = 6)(n = 6)(n = 3)(n = 5)
Available Fe (mg kg−1)≤0.010.93------
Table 7. Plant growth parameters: number of plants germinated, dry root biomass, dry shoot biomass, leaf chlorophyll (SPAD), and root-to-shoot/shoot-to-root ratio (root:shoot/shoot:root) reported for radish and lettuce at the end of the experiment for soils amended with biochar (BIOC), compost (COMP), inorganic fertilizer (INF) and unamended control (UNAM). Lower case letters within each row represent statistical differences at a minimum of p ≤ 0.05 or as indicated by F-stat and p-values in the last column. Statistical tests were performed using a two-way Analysis of Variance (ANOVA) or Kruskal-Wallis if data could not be normalized. Tukey HSD and Dunn’s test (non-normal data).
Plant Growth ParametersBIOCCOMPINFUNAMF-Statp-Value
Radish
No. Germinated8888
Dry Root Biomass (g)1.62 (0.10) a1.88 (0.13) a1.46 (0.14) ab1.01 (0.13) b7.41≤0.001
Dry Shoot Biomass (g)0.49 (0.04) 0.55 (0.05) 0.44 (0.08) 0.45 (0.04) 0.77ns
SPAD (SPAD units)29.38 (0.87) c32.88 (0.39) b33 (0.84) b36.97 (1.07) a12.1≤0.001
Root:Shoot 3.59 (0.42) a3.54 (0.29) a4.17 (0.76) a2.22 (0.15) b5.56≤0.01
Lettuce
No. Germinated6635
Dry Root Biomass (g)0.10 (0.04) 0.19 (0.06) 0.17 (0.03) 0.06 (0.03) 3.23ns
Dry Shoot Biomass (g)0.09 (0.03) 0.26 (0.05) 0.24 (0.03) 0.18 (0.10) 2.77ns
SPAD (SPAD units)19.70 (3.49) b30.83 (2.36) ab36.30 (2.59) a26.40 (1.85) ab4.38≤0.05
Shoot:Root 1.23 (0.15) b1.37 (0.90) ab1.46 (1.05) ab3.17 (3.04) a4.25≤0.05
Publisher’s Note: MDPI stays neutral with regard to jurisdictional claims in published maps and institutional affiliations.

