1. Introduction
The global pandemic of COVID-19 has led to confinement in homes in most countries in the world and has caused a change in smartphone usage habits. Undoubtedly, it has increased the time of use of the smartphones and their applications [
1]. Indeed, a greater knowledge of the use of these devices, what applications are used, how the times of use change in the presence of an extraordinary event [
1], etc. are not only a matter of academic interest, but also the key to understanding what mechanisms can effectively improve the users’ experience, plan traffic in telecommunications networks [
2] or help reduce the energy consumption of smartphones [
3].
Today, the use of the smartphone rises at a strong pace [
4] and they have become much more than just a personal communication device. Social networks, leisure applications, games, etc. represent distractions that help users indulge to avoid feeling bored, lonely or depressed. However, screen time abuse and smartphone addiction can be a source of mental and physical problems. Bianchi and Phillips, 2005 [
5], have pointed out that an excessive use of the smartphone may cause health problems such as headaches, fatigue, impaired concentration, insomnia, and hearing problems. It was also reported that some dimensions of personality such as low self-esteem, extraversion, higher approval motivation, and higher self-monitoring were more likely in people who suffer from smartphone addiction. In addition to these problematic behaviors, smartphone addiction can affect individuals’ loneliness and work or academic performance [
6]. An increase in smartphone use also carries an increase in vulnerability to outside security threats [
7], potentially allowing hackers to gain access to personal information or private files, servers and programs.
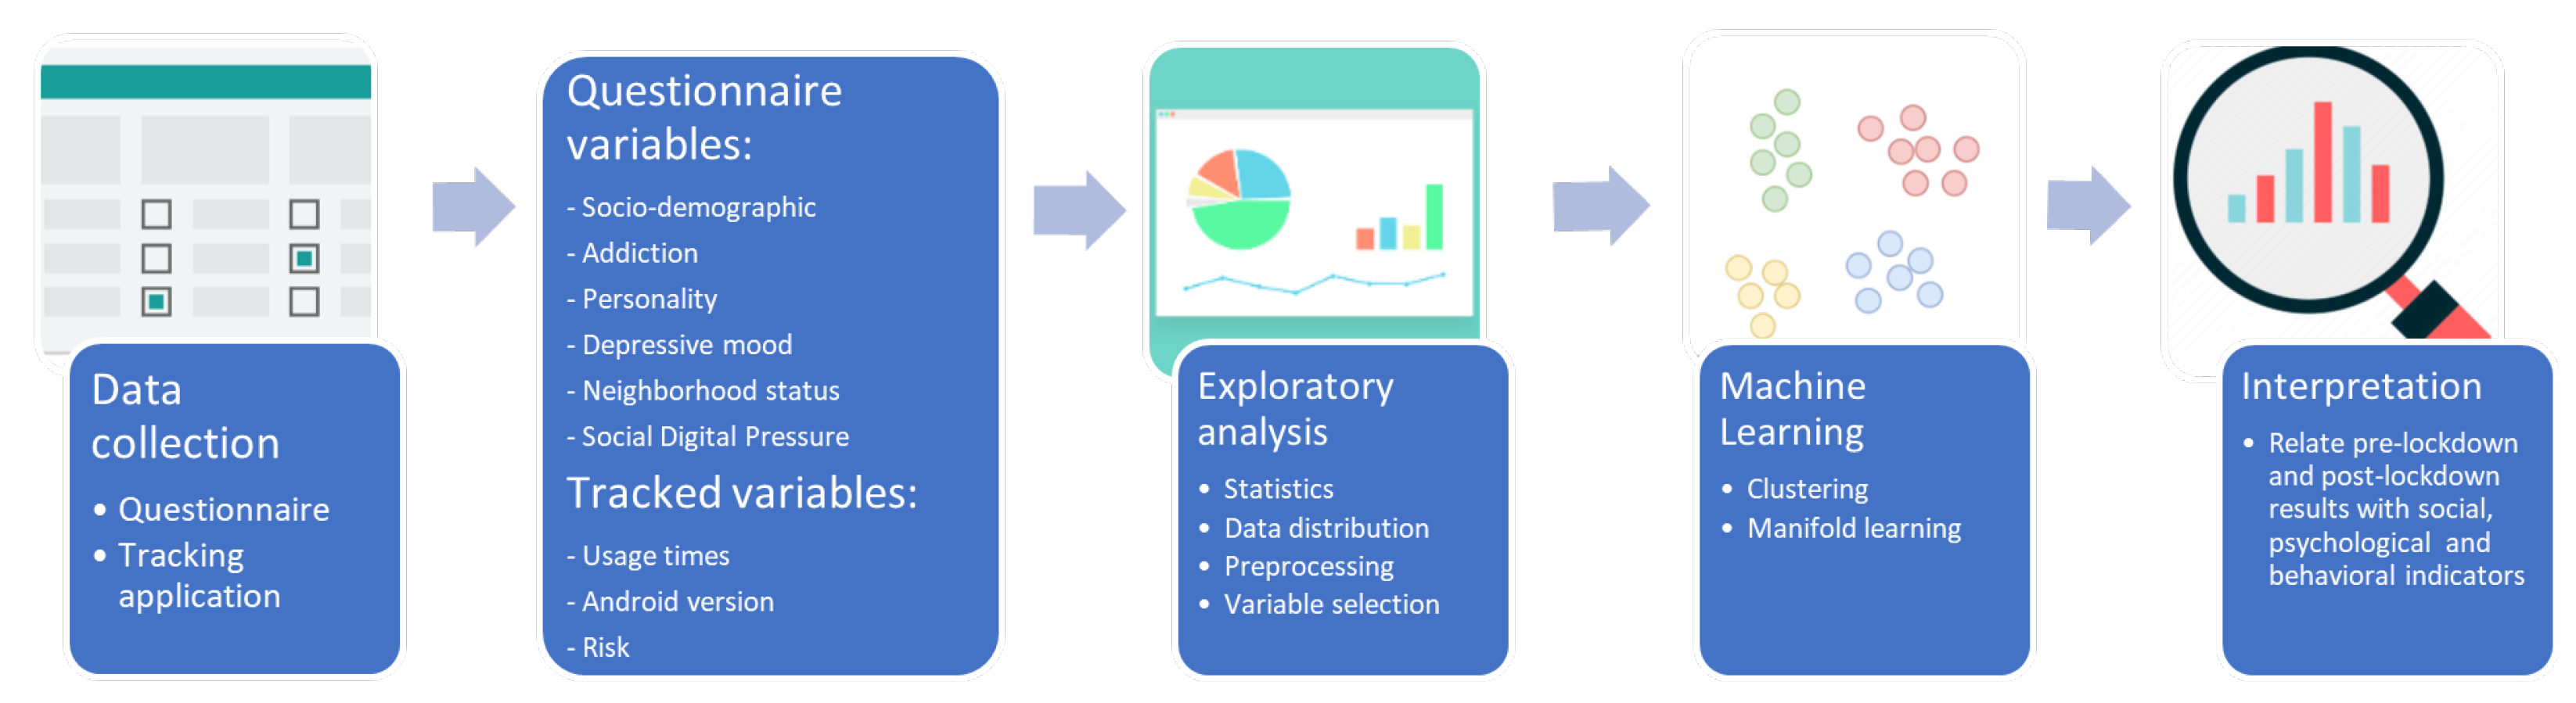
This study intends to gather and characterize data from Spanish smartphone users about their pre- and post-lockdown usage time during the first wave of COVID-19 in 2020, using unsupervised machine learning models and visualization techniques to provide insight on the effects caused by an unprecedented, high-impact social event such as the confinement.
An attempt has not only been made to characterize the use of smartphones and their applications, through sociodemographic variables (age, sex), variables of a technological nature (version of the Android phone used) and psychological variables (addiction, personality, social digital pressure (SDP), depression and type of neighborhood where they reside), but it has also been studied if these variables have a significant impact on the time of use of the smartphone.
We have analyzed the detailed usage traces of 1940 Android users residing in Spain, between January and May 2020, through a representative sample of the national population. By treating these data, it was possible to obtain, using machine learning techniques, a 2D distribution of the pre-COVID and post-COVID time of use, allowing the users to be clustered and analyzed in 4 groups based on their smartphone use. We assess and discuss the differences between the 4 clusters formed and how they relate to the variables of interest. In summary, this study tries to follow the methodology depicted in the flow diagram of
Figure 1.
The remaining of the paper is organized as follows.
Section 2 explores related works and psychosocial indicators that could potentially lead to an increase in smartphone usage in critical situations, such as a home confinement.
Section 3 describes the data used in our study: its source, the collection procedure, the participants’ profiles and the statistical/exploratory analyses carried out.
Section 4 introduces the machine learning and visualization techniques used for the data analysis and characterization.
Section 4 presents the obtained results, followed by their discussion in
Section 5.
2. Background
Compensatory Internet Use Theory (CIUT) (Kardefelt-Winther, 2014 [
8]) attempts to understand the negative life events and stressors that motivate some people to overuse technology to alleviate life stressors. Several studies thus far have found empirical support for this theory as related to the study of problematic smartphone use (Long et al., 2016 [
9]). In this way, the sociopolitical context can affect the time of use of smartphones (see, for example, Hodes and Thomas, 2021 [
1] for one of the first investigations on this matter). For example, people can spend more time still interacting with their closest ties and following the news on their smartphone in conditions of health crisis (for example, during the COVID-19 pandemic). Our main hypothesis is that screen time will increase significantly from levels during a week before the COVID-19 lockdown.
Emotional health is one of the main reasons for smartphone use, suggesting that a person’s mental well-being can affect the degree of smartphone use. This use may be motivated by a person’s desire to experience a regular and emotional boost or to ease their mood through text messages, email, and social media (Kim, Seo & David, 2015 [
10]; Zhang, Chen, Zhao, and Lee, 2014b [
11]; Zhang, Chen, Zhao and Lee, 2014a [
12]),which may be relevant in a period such as the onset of a pandemic, where communication with your closest environment or consultation of news can bring relief in a health emergency situation. In particular, users are more likely to use smartphones to alleviate negative moods such as depression and to spend more time on communication activities through the smartphone to distract themselves from their feelings (Elhai et al., 2016 [
13]), although there is no totally conclusive research on this matter.
In addition, people who experience loneliness (which may be occasional due to the possibility of home confinement as it happened at the beginning of the COVID-19 pandemic in Spain) may be more likely to use a smartphone to stay in touch with others in order to alleviate negative feelings and gain confidence from the interaction with friends, family or partner (Bian & Leung, 2015 [
14]; Kim, 2017 [
15]). Lonely individuals may also become more reluctant to participate in face-to-face interaction, preferring communication via smartphones instead (Kim, 2017 [
15]. If this behavior becomes frequent, the conditioned patterns of use tend to be repeated by individuals over time (Fullwood et al., 2017 [
16]; Oulasvirta et al., 2012 [
17]; Soror et al., 2012 [
18]); Thakur and Han., 2020 [
19].
Other studies have shown a positive association between an individual’s desire for boredom relief and smartphone use (Fullwood et al., 2017 [
16]) and an individual’s desire for gratification by snapshot and smartphone use (Rozgonjuk, Kattago, et al., 2018 [
20]). These factors, in turn, can hamper professional performance both in academic and work settings, causing distraction and decreased commitment to the task at hand. The main factor that explains the use of smartphones within the category of social performance was the personality characteristics of the individuals: the influence of personality traits is overwhelming in their influence on the degree and nature of smartphone usage. (Horwood & Anglim, 2019 [
21]).
Residing in neighborhoods with high rates of social disorder can produce stress and residents can use the smartphone as a mechanism to cope with this stress The stress generated in socially disorganized residential settings could make residents prone to extensive and even addictive use of their smartphones. If they have limited participation in social activities in their neighborhood and would try to fill this gap with the smartphone. Socially disorganized residential settings can also cause residents in these residential areas to avoid exposure to stressful social situations and withdraw from community life, replacing their (non-existent) community life with a “digital social life” (Herrero et al., 2019 [
22]).
Consistent with previous research regarding smartphone addiction and personality characteristics of the users (Andreassen et al., 2013 [
23]; Bianchi and Phillips 2005 [
5]; Billieux et al., 2015 [
24]; Hardie and Tee 2007 [
25]; Lepp, Li, Barkley, & Salehi-Esfahani, 2015 [
26]; Lu et al., 2011 [
27]; Mowen 2000 [
28]; Müller, Beutel, Egloff, & Wölfling, 2013 [
29]; Roccas, Sagiv, Schwartz, & Knafo, 2002 [
30]; Stieger, Burger, Bohn, & Voracek, 2013 [
31]; Wang, Ho, Chan, & Tse, 2015 [
32]; Yao, He, Ko, & Pang, 2014 [
33]; Randler, Horzum, & Vollmer, 2014 [
34]; Butt and Phillips, 2008 [
35]) we also included an evaluation of the personality characteristics of individuals. For the psychosocial well-being of user, we evaluated social support and psychological distress of users.
Technology features of smartphones have been identified as a factor of smartphone use in some studies. Characteristics related to the smartphone design such as accessibility, speed, may contribute to smartphone use (Busch et al., 2020 [
36]; Aljomaa, Qudah, Albursan, Bakhiet, & Abdul-jabbar, 2016 [
37]). The operating system of the phone constitutes a proxy variable that measures the technical quality of the smartphone.
We also included sociodemographic variables in our study since there exists previous research that has shown that smartphone use varies across age, gender, educational attainment, and size of locality (Busch et al., 2020 [
36]).
3. Data Used
We used data from the Cybersecurity and Confidence in Spanish Households national survey conducted during the first semester of 2020 by the National Observatory of Telecommunications and Information Society of the Spanish Ministry of Industry. We considered to be pre-lockdown the data obtained before 14 March 2020 (first confinement date in Spain), and as post-lockdown the data from that date.
Two types of data were collected in the survey: self-reported data and scanned data. Self-reported data corresponds to the answers that participants gave to an online questionnaire. Scanned data refers to data obtained from scanning the users’ smartphone upon approval by participants. A specialized software called Pinkerton (Hispasec Sistemas, Málaga, Spain. URL:
https://hispasec.com/es/pinkerton/policy (accessed on 22 June 2021) was installed remotely in the participants’ Android smartphones to search for resident malware and to collect data about the apps use, operating system, their up-to-date status, the security tools installed and the security activities of the user. The scanning software was installed, and the scanned data were collected after the participant had completed the online questionnaire. The iScan software analyzed the presence of malware using 46 antivirus engines, and used the VirusTotal tool, an online malware and virus-scanner aggregator as the base of its analysis.
This software captured two measures: the Android operating system version and the malware incidents suffered by the smartphone. The measure of malware is the “Risk Level” of the smartphone. The software installed measured the risk level on a 0–3 ordinal scale, where a higher number meant a more risky/compromised computer. Antivirus engines classify malware found from weak to very dangerous. For each engine, the classification of the malware was coded from 1 (weak, low risk) to 3 (very dangerous, high risk). The risk level of a computer is the average of all risk levels of the malwares found by the 46 antivirus engines.
To obtain the app and overall usage times, the procedure was as follows:
A user takes the survey
When the quality of the survey is validated, a message is sent to the user to scan their Android device through an application designed for this purpose.
The device records the usage time of each one of the applications on the Android smartphone using the API that reports their usage times.
The information is sent to the server.
The total usage time is calculated as the sum of all the applications’ usage times.
The only preprocessing made to the times of use was to “weight” the days of application usage time: e.g., if the scan were performed on the day 22 of the month and the month has 30 days, the adjusted usage time would be .
3.1. Participants
Participants belonged to a representative sample of the Spanish population of Internet users aged 15 years old and over with residential Internet access. Primary sampling units were households and secondary sampling units were individuals within households. First, a Spanish representative sample of households in terms of Autonomous Communities, size of locality, social class, and number of persons in the household were selected. Second, Internet users aged 15 years old and over within households were identified and selected.
For this study, we used data from 1940 smartphone users who completed the online questionnaire and, also, whose smartphones were remotely scanned to gather data on apps use information. Only smartphones running an Android operating system were scanned, since they represent 90.7% of market share in Spain and 71.9% worldwide (Statista, 2020a [
4] and 2020b [
38]).
No experiments have been conducted that compromise user safety. The data obtained comply with the European general data protection regulation (GDPR) and consent has been obtained from the users on the data collected.
3.2. Descriptive Analysis
This section summarizes the types and statistical distributions of the input variables under study.
Sociodemographic variables. Sex (male 53.5%, female 46.5%). Age in five age groups of age [15 to 24 years (4.7%), 25 to 34 years (18.7%), 35 to 44 years (31.3%), 45 to 54 years (25.8%), and more than 55 years (19.5%) (M = 44, S.D. = 12)]. Educational background [highest educational level attainment, 1 = elementary (1.1%), 2 = secondary (48.0%) and 3 = University studies (50.9%) (M = 2.49, S.D. = 0.53)].
Smartphone addiction. We applied Bian and Leung’s (2015) criterion to evaluate smartphone addiction, using information from 8 items of their Smartphone Addiction Symptoms Scale that were conceptually equivalent to Young’s screening instrument in Internet addiction (see Bian & Leung, 2015 [
14], for a more detailed explanation). Although those items were originally coded into five category responses from 1 = never to 5 = most of the time, to evaluate addiction, Bian and Leung considered only category responses 4 (many times) and 5 (most of the time) from these 8 items. To this end, all 8 items were first dichotomized (1–3 recoded to “0”, and 4–5 recoded to “1”) and added, which yielded a value ranging from “0” to “8”. (M = 1.37, S.D. = 2.00) (Cronbach’s
= 0.83).
Personality. We measured personality traits of the Big Five model with an abbreviated version of the Big Five Inventory (BFI) (Rammstedt & John, 2007 [
39]) that uses 10 items with category responses ranging from 1 = completely disagree to 5 = completely agree. Each trait was measured with two items: extraversion (M = 3.10, S.D. = 0.84), agreeableness (M = 3.37, S.D. = 0.70), conscientiousness (M = 3.74, S.D. = 0.75), neuroticism (M = 2.81, S.D. = 0.86), and openness (M = 3.46, S.D. = 0.77).
Depressive Mood. We used a 7-items validated version of the Center for Epidemiological Studies Depression (CESD) (Herrero & Gracia, 2011 [
40]). The CESD-7 scale is a short self-report scale designed to measure depressive symptomatology in the general population. The items of the scale are symptoms associated with depression (M = 1.82, S.D. = 0.64) (Cronbach’s
= 0.86).
Perceived neighborhood social disorder. We measured perceived neighborhood social disorder with four items that assessed (1 = Completely disagree, 5 = Completely agree): (1) Violence (fights, sexual aggressions, family violence, robberies, assaults, etc.); (2) Drug Traffic and drug use; (3) Nightlife, and (4) Few social services and social resources (see Herrero et al., 2019 [
22]). Items were added and averaged (M = 2.7, S. D. = 0.9), (Cronbach’s
= 0.82).
Social Digital Pressure. We used the Gui & Büchi, 2019 [
41] three-items Social Digital Pressure Scale. It measures the following three indicators: (a) social pressure to respond quickly to communication (
in my everyday life, people expect that I reply quickly to messages), (b) social expectations of digital skills (
in my everyday life, people expect that I am capable of using various Internet applications), and (c) expectations of online social presence (
in my everyday life, people expect me to be active on social networking sites). Category responses ranged from 1 = Completely disagree to 5 = Completely agree. Items were added and averaged (M = 3.50, S. D. = 0.83), (Cronbach’s
= 0.77).
3.3. Data Analysis
Among all the available data and to analyze all the points that we have covered as our main goals, it is necessary to select a subset of relevant features. This process is known as feature selection, and it is a standard practice in many problems involving many features, which means high-dimensional space. With feature selection we pursue two main goals:
Avoid excess zero samples in apps usage: Although we have recorded the time spent on every app for every user, some apps are more commonly installed on the user’s device than others. More popular apps are more likely to have the discriminating power when it comes to distinguishing between different behaviors for the entire population. On the other hand, apps which are only installed by a few users, either because they are generally unknown or because they are aimed at a very specific population, will not reflect general trends in user behavior.
Avoid the sparsity of the data in high dimensions: This problem is so recurrent that it has its own name, the curse of dimensionality. As the number of dimensions increases, the volume of the space grows exponentially and the variability of distances between data decreases exponentially, causing observations to become harder to cluster. This sparsity is problematic also for any method that requires statistical significance, so statistical methods could give wrong answers.
Therefore, we selected the variables under our own criterion, based on the popularity of the applications in Spain. In addition, to include some variables that may be useful to characterize the different behaviors in terms of smartphone use, we have added the Age and the Android version of the device. Last, we have included the “Games” feature, in which we accumulate the time spent by the user playing any kind of game (The categories registered in the games are those that appear in the Google Play Store:
Action, Adventure, Arcade, Board, Card, Casino, Casual, Educational, Music, Puzzle, Racing, Role Playing, Simulation, Sports, Strategy, Trivia, Word). We show all the variables used with their corresponding statistics before the lockdown (pre-lockdown) and during the lockdown (post-lockdown) in
Table 1 and
Figure 2. Throughout this article, we consider post-lockdown (or after lockdown), the period starting on the day the lockdown begins. For example, with post-lockdown usage time we actually refer to the usage time recorded during the lockdown.
Before feeding the data to the machine learning algorithms that will be described in
Section 4, it is desirable that the variables follow normal distributions, but the usage time variables are far from following normal distributions. As an example, in
Figure 3a we show the WhatsApp pre-lockdown usage time, but all time usage variables have similar distributions. Thus, to achieve this normalization, a logarithmic transformation was performed on all time usage variables. In
Figure 3b we show the WhatsApp pre-lockdown usage time distribution after applying the logarithmic transformation.
Additionally, we have scaled each variable by its maximum absolute value. This transformation scales and translates each variable such that the maximum absolute value of each variable is 1. This transformation does not shift/center the data, and thus does not destroy any sparsity.
4. Methods
The methods used in this work involve some of the most popular machine learning algorithms for unsupervised tasks. Unsupervised learning refers generally to the use of machine learning techniques to discover patterns in data that could be useful for extracting information about them and, eventually could allow the drawing of important conclusions. The most extended unsupervised algorithms are clustering methods. In contrast, supervised learning techniques are related to prediction tasks (regression or classification) where a model is built and trained to predict some particular attribute of the data called label or target.
Clustering is the process of dividing the data into groups of points with similar behavior and which differ in some way from other samples that belong to other clusters. Clustering methods use all the attributes of the data to assign each point to a certain group called cluster based on a concept of dissimilarity between points. This criterion used could be a distance-based dissimilarity metric. In that case, multiple distance metrics such as Euclidean, Manhattan, Mahalanobis, etc. could be used.
In clustering, there is not a clear criterion to evaluate the clustering performance and the quality of the clusters formed. Consequently, it is the user who should supply this criterion, in such a way that the result of the clustering will suit their needs. In the task at hand, a good clustering criterion should be able to separate into different clusters those users that exhibit different behaviors due to their different traits. Therefore, we tried to find natural groupings in data which gathered completely different user profiles in different clusters.
The clustering map was built using the K-means algorithm [
42]. K-means and its variants are the most popular approach for unsupervised clustering tasks. K-means clustering minimizes within-cluster variances, i.e., a point is assigned to the cluster that minimizes the squared Euclidean distance between that point and the center of the cluster, referred to as
centroid, which is the mean of the points assigned to that cluster. A summary of the K-means implementation is described in Algorithm 1.
The main advantages of K-means are basically that convergence is guaranteed and the fact that it is simple (the user only needs to provide the number of clusters that will be formed), fast in terms of computational cost, but it is also scalable to large datasets.
| Algorithm 1: K-means algorithm |
![Applsci 11 05807 i001]() |
K-means clustering was evaluated on the smartphone use data set, including as features the selected apps (Games and Phone usage are included too). In this case, we have applied the clustering only to variables related to usage times in apps, since the groups should be formed in a natural way based on these attributes without forcing a discrimination based on features such as the age. However, it is also possible to visualize the effect of those variables a priori excluded from the analysis. In this particular case, the clustering was made using the usage time on the pre-lockdown period.
The analysis of the clusters provides general insight about the natural groups present on the data. However, one problem that arises is interpretability, as the clustering is made in this case in an eight-dimensional space. This fact impedes the visualization of the shape and size of the clusters unless random 2D projections of that space are drawn, which in turn causes a loss of information. One way to address this issue is to perform a dimensionality reduction, such as a Principal Component Analysis (PCA) [
43].
PCA chooses a linear projection for each data point onto only the first few principal components to obtain lower-dimensional data representation while preserving as much of the data’s variance as possible. The problem with unsupervised linear dimensionality reduction frameworks is that they often miss important non-linear structures in the data.
To address the limitations of PCA, we propose non-linear manifold learning techniques to improve the visualization of the cluster results. Manifolds are seen as a generalization of linear dimensionality reduction frameworks such as PCA, with the clear advantage that they can be sensitive to non-linear structures in data. Although there are many different manifold learning algorithms, the critical challenge in the dimensionality reduction problem is to preserve the structure of the data as much as possible and to perform the transformation with minimal information loss. We have opted for the Isomap (Isometric mapping) [
44] manifold because of the globally optimal, provable convergence guarantee, and applicability to a broad range of data sources and problems [
45,
46,
47,
48]. Isomap performs low-dimensional embedding based on the geodesic distance induced by a neighborhood graph. The steps involved in broad terms are:
Construct a neighborhood graph either with k-nearest neighbors or with some fixed radius. Either if points are closer than that radius or if they are k-nearest neighbors, they become connected to each other.
Construct the geodesic distance matrix with the shortest path between all pairs. At this point, the most popular algorithms are Dijkstra and Floyd–Warshall algorithms.
Compute a lower-dimensional embedding via multidimensional scaling (MDS). The first eigenvectors corresponding to the top n eigenvalues of the geodesic distance matrix represent the coordinates in the new lower-dimensional Euclidean space.
Isomap allows the representation of the data, originally defined in a high-dimensional space, in a 2D space through the trained embedding. The Isomap algorithm was trained with the selected apps usage before lockdown, also including the Age and the Android version for every user. With the trained embedding, one cannot only visualize the projection of the data in a 2D space, but also observe the groups formed as a result of the K-means clustering. The results of the clustering and the manifold for the 2D representation are shown at the top left of the
Figure 4 (To interpret the color content of this figure, we refer the reader to the web version of the article.).
Another interesting application that Isomap offers is the possibility of visualizing the evolution of the groups over time. If the data are passed through the embedding using the same features it was trained on (without retraining the manifold) but in a different time period, i.e., in the post-lockdown period, one can visualize how the clusters are shifted by the 2D projection provided by the Isomap trained on the pre-lockdown period data (
Figure 4).
5. Results
According to the methodology described in
Section 4,
Figure 4 represents how the clusters have shifted in the 2D space constructed by the Isomap algorithm when varying the analyzed period from pre-lockdown to post-lockdown.
The most important feature that the Isomap managed to capture is the general usage time (
ISOMAP 1 coordinate in the figure, or simply referred to as x-axis). Via inspection, we observe that users with low x (points on the left) have lower usage time in all apps than users with high x (users on the right). This can be verified in
Figure 5. For example, Group 3 (the red group on the far left) has significantly less usage time (Phone usage, Apps usage and Games usage) on average than Group 2 (the green group on the right).
Regarding the shift of the initial clusters after the lockdown, we found that the general trend is a cluster spreading. Nonetheless, it is worth noting that the group which spreads the most after the lockdown is Group 3, whose points shift from a concentrated group on the left of the graph to a group that covers the whole range of the x-axis (that is, during the lockdown the users from Group 3 significantly increased the use of their smartphones). Besides that, we observe that the centroid of Group 3 (marked as a red cross) suffers a large shift from left to right during the lockdown. In the remaining groups, some users shift to zones of higher use while others move in the opposite direction. Centroids do not move significantly from their original position in pre-lockdown, except for Group 3.
Figure 5 shows the distributions of the variables for each one of the groups obtained by the K-means clustering described in
Section 3.3 (
Figure 4). To simplify the visualization we have summarized the usage time of the apps WhatsApp, Instagram, Twitter, Facebook, YouTube, Chrome and Spotify by taking the mean of all usage times for every user and showing the average distributions by groups as a single variable called Apps usage. We compare the distributions of each group (blue) with the distributions of all users in our study (green). This comparison will help with the characterization of groups.
From the figure, we immediately notice that all the groups have spread with the arrival of the lockdown. the population who has suffered the most substantial change in their behavior related to the smartphone usage are the members of Group 3, made up of users who had the lowest usage times before the lockdown in our database (these users had a mean usage time near zero before the lockdown).
Group 4 is the second group with the lowest average usage time. Within this group there are a significant number of older users who tend to have older Android versions than the average and therefore the oldest smartphones.
Group 1 exhibits the second highest general usage time and Group 2 is the one that has the highest general usage time. A more detailed analysis of the difference between Groups 1 and 2 can be observed in
Figure 6 and
Figure 7, which confirms that users in Group 2 clearly manifest a greater use of social networks such as Instagram or Twitter than users in Group 1.
To better understand the differences between the groups’ behavior before and after the lockdown, in
Figure 6 we graph the distributions of the variables Phone usage, Apps usage and Games usage pre-lockdown (blue) and post-lockdown (green) and
Figure 7 depicts the distributions of use of the selected apps. The
p-values of the paired
t-test contrast between the distributions pre-lockdown and post-lockdown has also been included. The variables Age and Android version have also been included to better identify the group profiles.
Group 3 has the most substantial difference in behavior before and after the lockdown. This can be confirmed now comparing the pre- and post-distributions of this group in the
Figure 6 and the
p-values.
In Groups 1 and 2, which contain the most active users of social networks and with the highest use of the smartphone, we observe that their general use of the smartphone has slightly decreased, as observed previously in
Figure 4 by tracking the shift of the blue and green centroids, respectively.
Group 4 seems to be the most heterogeneous of them all. Considering the centroid position in
Figure 4, it has remained almost unchanged after the lockdown, so the general trend of the group has not changed even though users have changed habits in isolation, manifesting the general spreading commented before.
Table 2 summarizes the contrast hypotheses’
p-values referred to the difference between pre-post means in the use of each application. Almost all differences in means are statistically significant.
At this point, we have tried to connect the results of the whole analysis with the field of the psychological and social context of the subjects. The idea is to match the information obtained through the analysis of usage times, with different “social variables” which may help us characterize the users’ profiles in a more complete way and to detect possible correlations of interest, especially for the field of sociology.
Our first approach was to look for significant differences in these social variables between the different groups resulting from the clustering, which we had characterized before. Specifically, we analyze both sociodemographic variables and Big Five personality traits. These traits are represented among other social indicators in
Figure 8.
The results obtained are not very enlightening because they do not present significant differences for most variables. The addiction parameter seems to be the one with the most variability across groups.
Alternatively. we searched for significant differences in these variables between two groups that are also of interest: those who use the smartphone the most and those who use it the least. First, an average of the usage time of the selected apps was calculated. Then, two groups were created by selecting the 200 users with the highest and lowest average app usage time, respectively.
Figure 9 summarizes the comparison with respect to some of the most relevant social and demographic variables.
Another approach for this study is to compare user groups that experienced the largest increase and decrease in smartphone use with the lockdown. In this case,
Figure 10 shows the results of this comparison. In this case, no substantial differences are found.
6. Discussion
One of the primary objectives of this study was to examine the changes in the use of smartphone applications in the context of a high-impact social change in the external environment; specifically, to study the differences in the use of smartphones during the weeks before and after the first confinement in Spain caused by the global health crisis of COVID-19 in 2020. This study adds a relatively novel element to the literature by demonstrating the effects of external factors on the use of smartphones, and describing the relationships between the use of smartphones and personal, technological and social variables. In particular, the results suggest that future research on the screen time of mobile devices should present reliable and objective measures and should, either by design or by statistical analysis, take into account the influence of external factors (as, in this case, the breakout of a pandemic causing a home confinement).
The initial hypothesis is that these changes in use caused by changes in the social environment could have a profound impact on a greater use of the smartphone and its applications. The results obtained are in line with other research works (Hodes & Thomas, 2021 [
1]). As some users admitted in a qualitative research, the users’ screen time has increased considerably, and the smartphone has become more than an instrument to communicate with others in the initial post-lockdown in Spain. The initial analysis reflects, at a macroscopic level, that the smartphone use increased (or maintained its level of use) in applications such as WhatsApp in all groups.
To delve into the enormous diversity of user behaviors, a cluster analysis was carried out—in line with other investigations that have studied the evolution in the use of mobile applications (Li et al., 2020 [
49]; Zhao et al., 2016 [
50])—by means of manifold machine learning techniques that allow an improvement in the visualization of changes in the use of smartphones over time and that is one of the fundamental contributions of this research.
We noticed that in almost every group of users there is a notable reduction in the game applications usage in the first weeks of confinement. Games have a larger process component than social apps, although process-oriented online games can have a strong social component too, as in massively multiplayer games. It therefore seems that although the largest share of usage time of the smartphones in Spain was represented by social and communication apps (WhatsApp, Facebook, Instagram), there were also increases in process-oriented apps (for example, browsing in Chrome, possibly for news consumption). What this research does show is that—at least in the first weeks of confinement—the use of entertainment apps such as games was significantly reduced. The need to be informed and to know about family and friends’ health situation possibly had a notable influence on this aspect, temporarily causing people to leave games aside but retaking them afterwards to cope with the boredom brought by the confinement. Therefore our research partially supports the CIUT (Kardefelt-Winther, 2014 [
8]) which establishes that the hedonic use of a smartphone (consistent with the use of the process) could be a means to compensate for negative emotion and would be more in line with others studies that found that problematic smartphone use is more related to social use (Lopez-Fernandez et al., 2014 [
51]; Zhitomirsky-Geffet & Blau, 2016 [
52]).
Our findings suggest that the increase in post-lockdown smartphone use stands out, fundamentally, in one of the four groups of users obtained by clustering (
Figure 4). From these results, we may highlight that:
The particular behavior of Group 3 stands out from the rest. Group 3 has almost zero mean in Phone usage, Apps usage and Games usage. This group has the least usage time, so this may lead to mistakenly conclude that this group may be made up of older users typically less familiarized with technologies. Surprisingly, it seems that the Age distribution shifts slightly towards lower ages than the average.
With regard to users in Group 4, despite having above-average smartphone usage, there is no logical explanation about the low usage time of the selected apps. The reason behind this could be that the smartphone use is reflected in other applications not included in the analysis, or in phone utilities such as reminders, notes or especially phone calls.
Group 2 has a much higher average value in Apps usage than Group 1, which means that Group 2 includes those users who use social networks and messaging services most often, in particular most of the apps we have included in our study. In addition, Group 2 is made up of younger users who tend to have more recent Android versions than users in Group 1.
The mean of Group 3 general Phone usage increases drastically after the lockdown except for gaming applications and Spotify, where the increase is moderate. It is worth noting in this group the exceptional increase in the use of communication applications and social networks (WhatsApp, Facebook) and navigation applications (Chrome).
Groups 1 and 2 slightly decreased their use of the smartphone. This is consistent with the Phone usage pre-post statistics in
Figure 6. From that figure, it appears that for both groups, the use of games apps has decreased considerably. In particular, in Group 1, the general decrease in usage time stems from the drop in usage time of the selected set of apps (mainly Games and YouTube for Group 1, Games, Instagram and Facebook for Group 2). Phone usage in both groups is similar in pre-lockdown and in post-lockdown.
For Group 4, while the use in the selected apps (Apps usage) has increased, the decrease in the Games usage and other applications has balanced this increase, making the total Phone usage almost constant during the analyzed time span.
The performed machine learning analysis has been connected with psychological indicators, attempting to explore the sociodemographic, personality and behavioral factors that relate to the groups. No significant differences were found in the sociodemographic and personality profiles of the groups obtained. Again, it seems that diversity is a characteristic element among smartphone users.
To finish the analysis in an exploratory way, users have been segmented into those with the most and least use, obtaining that there are personal variables (sex, age, addiction, depression, open personality), social variables (SDP, neighborhood status) and technological variables (version of the Operating System and malware risk). These variables are used repeatedly in the scientific literature to explain Smartphone addiction which, in many cases, is related to excessive use of the Internet (Busch & McCarthy, 2020 [
36]).
In
Figure 9 we represented the profiles of the users with the highest and lowest Phone use. The comparison between both groups reveals some interesting facts. First, it seems that those who spend less time using the selected apps are on average older and clearly have older Android versions.
Regarding other features, the group with the lowest use exhibit less addiction, SDP and depression than the group with the highest use. However, users in the low usage time group, which have a lesser presence in social networks and messaging apps, present a higher risk of malware infection, according to the scan carried out on the devices.
Alternatively, we compared the groups that experienced the largest increase and decrease in smartphone use (
Figure 10). From this comparison, similarly to what was observed for the groups obtained by clustering, there are no clear differences between these last two groups, which leads to conclude that the profiles of users belonging to either of the groups are very heterogeneous. Therefore, no significant differences are reflected in sociodemographic variables.
The analyses carried out in this study once again corroborate, in line with previous research, the enormous diversity among users, whose use differs by orders of magnitude (Falaki et al., 2010 [
53]). This fact is also produced when studying very specific segments of users, such as the elderly (Rosales & Fernández-Ardèvol, 2019 [
54]). Diversity in use is a huge challenge for researchers, who have found it difficult to find an average usage pattern that optimizes, for example, the battery consumption of smartphones.
7. Conclusions
This paper attempts to explore and characterize the changes in the time of use of smartphones and their applications between the pre-lockdown and post-lockdown periods in Spain, during the first COVID-19 confinement in 2020 and interpret if this change in use matches any particular sociodemographic, behavioral or psychological variable.
This study analyzes data from 1940 participants, which was obtained both from a survey and from a tracking application installed on their smartphones. We analyzed and preprocessed the data prior to applying machine learning techniques and visualization methods.
A clustering analysis based on K-means algorithm and using Isomap projection managed to capture 4 different user profiles, which reacted differently to the arrival of the lockdown. In particular, one of the groups stands out from the rest and experiences the highest increase in usage time after the lockdown.
This heterogeneous behavior was also replicated when individually assessing the Phone usage time, Games usage time and App specific usage time differences in pre- and post-lockdown periods.
Finally, we explored the sociodemographic, personality and behavioral factors that could relate to the groups. Psychological indicators (Big Five personality traits) did not unveil any differences between groups. However, a segmentation of users by their highest and lowest Phone use revealed different behavioral factors between groups.
8. Strengths and Limitations
This article presents some potential strengths. First, the application usage data are realistic and unbiased (unlike in many other similar studies comprising only data from surveys) as they have been obtained from users using a software tool that under their explicit consent, collected data from their smartphones. Furthermore, participants belong to a nationally representative sample of Internet users, which is not common in this field, where convenience samples (for example, students) are the rule rather than the exception. This fact can certainly help the potential generalizability of the results. Even taking this circumstance into account, a larger sample than the considered 1940 users would be desirable, as that would allow longitudinal studies using machine learning techniques. Another limitation was the unavailability of data from iOS operating system users.
Author Contributions
Conceptualization, A.U. and E.S.-O.; methodology, A.U., M.M.-S. and E.S.-O.; software, A.S., I.F. and A.U.; validation, A.S., I.F. and F.M.; formal analysis, A.S., I.F., F.M. and A.U.; investigation, F.M., M.M.-S. and E.S.-O.; resources, A.U. and E.S.-O.; data curation, M.M.-S., A.U., A.S. and I.F.; writing—original draft preparation, A.U., A.S., I.F. and F.M.; writing—review and editing, A.U., A.S., I.F. and F.M.; visualization, A.S., I.F. and M.M.-S.; supervision, A.U. and E.S.-O.; project administration, A.U. and E.S.-O.; funding acquisition, A.U. and E.S.-O. All authors have read and agreed to the published version of the manuscript.
Funding
Alberto Urueña acknowledges funding support from the BBVA Foundation Grants for Scientific Research Teams 2019 (grant number TUTSC2019).
Institutional Review Board Statement
Our study was exempt from ethics committee approval, although it was conducted in accordance with the ethical standards set out in the original Declaration of Helsinki and its subsequent amendments. All subjects gave their informed consent prior to inclusion in the study, which consisted in providing information on the study variables. No experimental manipulations of any kind were performed and no personal information was used at any stage of the research. The research is in accordance with the Spanish Data Protection Law and follows the guidelines of the European Committee for Data Protection (ECDC) on this subject.
Informed Consent Statement
Informed consent was obtained from all subjects involved in the study.
Data Availability Statement
Data sharing not applicable.
Conflicts of Interest
The authors declare no conflict of interest.
References
- Hodes, L.N.; Thomas, K.G. Smartphone Screen Time: Inaccuracy of self-reports and influence of psychological and contextual factors. Comput. Hum. Behav. 2021, 115, 106616. [Google Scholar] [CrossRef]
- Aceto, G.; Ciuonzo, D.; Montieri, A.; Pescapé, A. Multi-classification approaches for classifying mobile app traffic. J. Netw. Comput. Appl. 2018, 103, 131–145. [Google Scholar] [CrossRef]
- Pramanik, P.K.D.; Sinhababu, N.; Mukherjee, B.; Padmanaban, S.; Maity, A.; Upadhyaya, B.K.; Holm-Nielsen, J.B.; Choudhury, P. Power consumption analysis, measurement, management, and issues: A state-of-the-art review of smartphone battery and energy usage. IEEE Access 2019, 7, 182113–182172. [Google Scholar] [CrossRef]
- Statista. Share of Android Operating System Sales in Spain January 2016 to September 2020, by Month. 2020. Available online: https://www.statista.com/statistics/464221/porcentage-android-smartphone-sales-spain/ (accessed on 22 June 2021).
- Bianchi, A.; Phillips, J.G. Psychological predictors of problem mobile phone use. CyberPsychol. Behav. 2005, 8, 39–51. [Google Scholar] [CrossRef]
- Yalçin, I.; Özkurt, B.; Özmaden, M.; Yağmur, R. Effect of smartphone addiction on loneliness levels and academic achievement of z generation. Int. J. Psychol. Educ. Stud. 2020, 7, 208–214. [Google Scholar] [CrossRef]
- Herrero, J.; Torres, A.; Vivas, P.; Hidalgo, A.; Rodríguez, F.J.; Urueña, A. Smartphone Addiction and Cybercrime Victimization in the Context of Lifestyles Routine Activities and Self-Control Theories: The User’s Dual Vulnerability Model of Cybercrime Victimization. Int. J. Environ. Res. Public Health 2021, 18, 3763. [Google Scholar] [CrossRef] [PubMed]
- Kardefelt-Winther, D. A conceptual and methodological critique of internet addiction research: Towards a model of compensatory internet use. Comput. Hum. Behav. 2014, 31, 351–354. [Google Scholar] [CrossRef] [Green Version]
- Long, J.; Liu, T.Q.; Liao, Y.H.; Qi, C.; He, H.Y.; Chen, S.B.; Billieux, J. Prevalence and correlates of problematic smartphone use in a large random sample of Chinese undergraduates. BMC Psychiatry 2016, 16, 1–12. [Google Scholar] [CrossRef] [PubMed] [Green Version]
- Kim, J.H.; Seo, M.; David, P. Alleviating depression only to become problematic mobile phone users: Can face-to-face communication be the antidote? Comput. Hum. Behav. 2015, 51, 440–447. [Google Scholar] [CrossRef]
- Zhang, K.; Chen, C.; Zhao, S.; Lee, M. Compulsive Smartphone Use: The Roles of Flow, Reinforcement Motives, and Convenience. In Proceedings of the 35th International Conference on Information Systems (ICIS), Auckland, New Zealand, 14–17 December 2014. [Google Scholar]
- Zhang, K.; Chongyang, C.; Zhao, S.; Lee, M. Understanding the Role of Motives in Smartphone Addiction. In Proceedings of the Pacific Asia Conference on Information Systems (PACIS), Chengdu, China, 24–28 June 2014. [Google Scholar]
- Elhai, J.D.; Levine, J.C.; Dvorak, R.D.; Hall, B.J. Fear of missing out, need for touch, anxiety and depression are related to problematic smartphone use. Comput. Hum. Behav. 2016, 63, 509–516. [Google Scholar] [CrossRef]
- Bian, M.; Leung, L. Linking loneliness, shyness, smartphone addiction symptoms, and patterns of smartphone use to social capital. Soc. Sci. Comput. Rev. 2015, 33, 61–79. [Google Scholar] [CrossRef] [Green Version]
- Kim, J.H. Smartphone-mediated communication vs. face-to-face interaction: Two routes to social support and problematic use of smartphone. Comput. Hum. Behav. 2017, 67, 282–291. [Google Scholar] [CrossRef]
- Fullwood, C.; Quinn, S.; Kaye, L.K.; Redding, C. My virtual friend: A qualitative analysis of the attitudes and experiences of Smartphone users: Implications for Smartphone attachment. Comput. Hum. Behav. 2017, 75, 347–355. [Google Scholar] [CrossRef]
- Oulasvirta, A.; Rattenbury, T.; Ma, L.; Raita, E. Habits make smartphone use more pervasive. Pers. Ubiquitous Comput. 2012, 16, 105–114. [Google Scholar] [CrossRef]
- Soror, A.A.; Steelman, Z.R.; Limayem, M. Discipline yourself before life disciplines you: Deficient self-regulation and mobile phone unregulated use. In Proceedings of the 2012 45th Hawaii International Conference on System Sciences, Maui, HI, USA, 4–7 January 2012; pp. 849–858. [Google Scholar]
- Thakur, N.; Han, C. Framework for facilitating Human-Human Interactions to Mitigate Loneliness in Elderly. In Proceedings of the 3rd International Conference on Human Interaction and Emerging Technologies (IHIET 2020), Paris, France, 27–29 August 2020. [Google Scholar]
- Rozgonjuk, D.; Kattago, M.; Täht, K. Social media use in lectures mediates the relationship between procrastination and problematic smartphone use. Comput. Hum. Behav. 2018, 89, 191–198. [Google Scholar] [CrossRef]
- Horwood, S.; Anglim, J. Problematic smartphone usage and subjective and psychological well-being. Comput. Hum. Behav. 2019, 97, 44–50. [Google Scholar] [CrossRef] [Green Version]
- Herrero, J.; Torres, A.; Vivas, P.; Urueña, A. Technological addiction in context: The influence of perceived neighborhood social disorder on the extensive use and addiction to the smartphone. Soc. Sci. Comput. Rev. 2019, 0894439319896230. [Google Scholar] [CrossRef]
- Andreassen, C.S.; Griffiths, M.D.; Gjertsen, S.R.; Krossbakken, E.; Kvam, S.; Pallesen, S. The relationships between behavioral addictions and the five-factor model of personality. J. Behav. Addict. 2013, 2, 90–99. [Google Scholar] [CrossRef] [Green Version]
- Billieux, J.; Philippot, P.; Schmid, C.; Maurage, P.; De Mol, J.; Van der Linden, M. Is dysfunctional use of the mobile phone a behavioural addiction? confronting symptom-based versus process-based approaches. Clin. Psychol. Psychother. 2015, 22, 460–468. [Google Scholar] [CrossRef] [Green Version]
- Hardie, E.; Tee, M.Y. Excessive Internet use: The role of personality, loneliness and social support networks in Internet Addiction. Aust. J. Emerg. Technol. Soc. 2007, 5, 34–47. [Google Scholar]
- Lepp, A.; Li, J.; Barkley, J.E.; Salehi-Esfahani, S. Exploring the relationships between college students’ cell phone use, personality and leisure. Comput. Hum. Behav. 2015, 43, 210–219. [Google Scholar] [CrossRef]
- Lu, X.; Watanabe, J.; Liu, Q.; Uji, M.; Shono, M.; Kitamura, T. Internet and mobile phone text-messaging dependency: Factor structure and correlation with dysphoric mood among Japanese adults. Comput. Hum. Behav. 2011, 27, 1702–1709. [Google Scholar] [CrossRef]
- Mowen, J.C. The 3M Model of Motivation and Personality: Theory and Empirical Applications to Consumer Behavior; Springer Science & Business Media: New York, NY, USA, 2000. [Google Scholar]
- Müller, K.W.; Beutel, M.; Egloff, B.; Wölfling, K. Investigating risk factors for Internet gaming disorder: A comparison of patients with addictive gaming, pathological gamblers and healthy controls regarding the big five personality traits. Eur. Addict. Res. 2014, 20, 129–136. [Google Scholar] [CrossRef]
- Roccas, S.; Sagiv, L.; Schwartz, S.H.; Knafo, A. The big five personality factors and personal values. Personal. Soc. Psychol. Bull. 2002, 28, 789–801. [Google Scholar] [CrossRef]
- Stieger, S.; Burger, C.; Bohn, M.; Voracek, M. Who commits virtual identity suicide? Differences in privacy concerns, internet addiction, and personality between Facebook users and quitters. Cyberpsychol. Behav. Soc. Netw. 2013, 16, 629–634. [Google Scholar] [CrossRef]
- Wang, C.W.; Ho, R.T.; Chan, C.L.; Tse, S. Exploring personality characteristics of Chinese adolescents with internet-related addictive behaviors: Trait differences for gaming addiction and social networking addiction. Addict. Behav. 2015, 42, 32–35. [Google Scholar] [CrossRef]
- Yao, M.Z.; He, J.; Ko, D.M.; Pang, K. The influence of personality, parental behaviors, and self-esteem on Internet addiction: A study of Chinese college students. Cyberpsychol. Behav. Soc. Netw. 2014, 17, 104–110. [Google Scholar] [CrossRef]
- Randler, C.; Horzum, M.B.; Vollmer, C. Internet addiction and its relationship to chronotype and personality in a Turkish university student sample. Soc. Sci. Comput. Rev. 2014, 32, 484–495. [Google Scholar] [CrossRef]
- Butt, S.; Phillips, J.G. Personality and self reported mobile phone use. Comput. Hum. Behav. 2008, 24, 346–360. [Google Scholar] [CrossRef]
- Busch, P.A.; McCarthy, S. Antecedents and consequences of problematic smartphone use: A systematic literature review of an emerging research area. Comput. Hum. Behav. 2020, 114, 106414. [Google Scholar] [CrossRef]
- Aljomaa, S.S.; Qudah, M.F.A.; Albursan, I.S.; Bakhiet, S.F.; Abduljabbar, A.S. Smartphone addiction among university students in the light of some variables. Comput. Hum. Behav. 2016, 61, 155–164. [Google Scholar] [CrossRef]
- Statista. Android—Statistics & Facts. 2020. Available online: https://www.statista.com/topics/876/android/ (accessed on 22 June 2021).
- Rammstedt, B.; John, O.P. Measuring personality in one minute or less: A 10-item short version of the Big Five Inventory in English and German. J. Res. Personal. 2007, 41, 203–212. [Google Scholar] [CrossRef]
- Herrero, J.; Fuente, A.; Gracia, E. Covariates of subjective well-being among Latin American immigrants in Spain: The role of social integration in the community. J. Community Psychol. 2011, 39, 761–775. [Google Scholar] [CrossRef]
- Gui, M.; Büchi, M. From Use to Overuse: Digital Inequality in the Age of Communication Abundance. Soc. Sci. Comput. Rev. 2019, 39, 089443931985116. [Google Scholar] [CrossRef] [Green Version]
- Lloyd, S. Least squares quantization in PCM. IEEE Trans. Inf. Theory 1982, 28, 129–137. [Google Scholar] [CrossRef]
- Pearson, K. LIII. On lines and planes of closest fit to systems of points in space. Lond. Edinb. Dublin Philos. Mag. J. Sci. 1901, 2, 559–572. [Google Scholar] [CrossRef] [Green Version]
- Tenenbaum, J.B.; De Silva, V.; Langford, J.C. A Global Geometric Framework for Nonlinear Dimensionality Reduction. Science 2000, 290, 2319–2323. [Google Scholar] [CrossRef] [PubMed]
- Verma, R.; Khurd, P.; Davatzikos, C. On Analyzing Diffusion Tensor Images by Identifying Manifold Structure Using Isomaps. IEEE Trans. Med. Imaging 2007, 26, 772–778. [Google Scholar] [CrossRef] [PubMed]
- Ramos, F.T.; Kumar, S.; Upcroft, B.; Durrant-Whyte, H. A Natural Feature Representation for Unstructured Environments. IEEE Trans. Robot. 2008, 24, 1329–1340. [Google Scholar] [CrossRef]
- Takahashi, S.; Fujishiro, I.; Okada, M. Applying Manifold Learning to Plotting Approximate Contour Trees. IEEE Trans. Vis. Comput. Graph. 2009, 15, 1185–1192. [Google Scholar] [CrossRef] [Green Version]
- Gepshtein, S.; Keller, Y. Sensor Network Localization by Augmented Dual Embedding. IEEE Trans. Signal Process. 2015, 63, 2420–2431. [Google Scholar] [CrossRef]
- Li, T.; Zhang, M.; Cao, H.; Li, Y.; Tarkoma, S.; Hui, P. “What Apps Did You Use?”: Understanding the Long-term Evolution of Mobile App Usage. In Proceedings of the Web Conference 2020, Taipei, Taiwan, 20–25 April 2020; pp. 66–76. [Google Scholar]
- Zhao, S.; Ramos, J.; Tao, J.; Jiang, Z.; Li, S.; Wu, Z.; Pan, G.; Dey, A.K. Discovering different kinds of smartphone users through their application usage behaviors. In Proceedings of the 2016 ACM International Joint Conference on Pervasive and Ubiquitous Computing, Heidelberg, Germany, 12–16 September 2016; pp. 498–509. [Google Scholar]
- Lopez-Fernandez, O.; Honrubia-Serrano, L.; Freixa-Blanxart, M.; Gibson, W. Prevalence of problematic mobile phone use in British adolescents. CyberPsychol. Behav. Soc. Netw. 2014, 17, 91–98. [Google Scholar] [CrossRef] [PubMed] [Green Version]
- Zhitomirsky-Geffet, M.; Blau, M. Cross-generational analysis of predictive factors of addictive behavior in smartphone usage. Comput. Hum. Behav. 2016, 64, 682–693. [Google Scholar] [CrossRef]
- Falaki, H.; Mahajan, R.; Kandula, S.; Lymberopoulos, D.; Govindan, R.; Estrin, D. Diversity in smartphone usage. In Proceedings of the 8th International Conference on Mobile Systems, Applications, and Services, San Francisco, CA, USA, 15–18 June 2010; pp. 179–194. [Google Scholar]
- Rosales, A.; Fernández-Ardèvol, M. Smartphone usage diversity among older people. In Perspectives on Human-Computer Interaction Research with Older People; Springer: Berlin/Heidelberg, Germany, 2019; pp. 51–66. [Google Scholar]
Figure 1.
Flow diagram describing the different steps of the study.
Figure 1.
Flow diagram describing the different steps of the study.
Figure 2.
Distribution of the variables. At the top, We show the time spent on each app considered by the models and its pre-lockdown and post-lockdown distribution. Number of zeros refers to the number of users with zero usage of that app in that period. At the bottom left corner, we represent the overall phone usage. At the bottom in the middle, we show the Age statistics and at the bottom right corner the Android version distributions of the user sample, both also included in the clustering models. The number below the labels corresponds to the p-value associated with the t-test statistic.
Figure 3.
Logarithmic transformation applied to normalize the WhatsApp pre-lockdown usage time variable: (a) original distribution; (b) distribution after applying the logarithmic transformation, which shows a more normally distributed behavior.
Figure 3.
Logarithmic transformation applied to normalize the WhatsApp pre-lockdown usage time variable: (a) original distribution; (b) distribution after applying the logarithmic transformation, which shows a more normally distributed behavior.
Figure 4.
Groups found with the K-means represented in the 2D space constructed by the Isomap algorithm. The centroids of the groups are represented with crosses (X). The number at the right of the group name in the legend represents the number of users that belong to each group.
Figure 4.
Groups found with the K-means represented in the 2D space constructed by the Isomap algorithm. The centroids of the groups are represented with crosses (X). The number at the right of the group name in the legend represents the number of users that belong to each group.
Figure 5.
Pre-lockdown Phone usage, Apps usage and Games usage of groups found by K-means (in blue) compared with the distributions of all samples (in green). The Android version and Age distribution are also represented.
Figure 5.
Pre-lockdown Phone usage, Apps usage and Games usage of groups found by K-means (in blue) compared with the distributions of all samples (in green). The Android version and Age distribution are also represented.
Figure 6.
Comparison of Phone usage, Apps usage and Game usage distributions between pre (blue) and post (green) lockdown for each group. The p-values correspond to the paired t-test contrast between pre- and post-lockdown. The Age and Android version distributions by group have also been graphed to better understand the groups categorization.
Figure 7.
Detailed comparison of the usage time of the selected apps across groups.
Figure 7.
Detailed comparison of the usage time of the selected apps across groups.
Figure 8.
Mean values of Big Five personality traits along with addiction, SDP and depression for every group determined by the clustering: (a) Group 1, (b) Group 2, (c) Group 3, (d) Group 4.
Figure 8.
Mean values of Big Five personality traits along with addiction, SDP and depression for every group determined by the clustering: (a) Group 1, (b) Group 2, (c) Group 3, (d) Group 4.
Figure 9.
Comparison between the groups with the highest and lowest usage time of the selected applications. The most relevant social variables chosen are those that present a significant statistical difference when contrasting hypotheses about the difference of the means for both groups by the statistical t-test. Violin plots show the 25th and 75th percentiles (dashed lines) along with the median (solid horizontal line).
Figure 10.
Comparison between the groups with the largest decrease and increase in the usage time of the selected applications after the lockdown. The most relevant social variables selected are those that present a significant statistical difference when contrasting hypotheses about the difference of the means of both groups by the statistical t-test.
Table 1.
Descriptive statistics that summarize the general characteristics of the data. We include as features the selected apps in addition to the Age and the user’s Android version, which will be used for our main purpose (see
Section 4). The smartphone usage refers to the total amount of time spent (in minutes) on any phone app with a launcher. We show as regular text the pre-lockdown statistics and in bold the post-lockdown statistics.
| | Age | Android
Version | WhatsApp | Instagram | Twitter | Facebook | YouTube | Games | Phone
Usage | Chrome | Spotify |
|---|
| mean | 43.9 | 8.4 | 23.2|38.1 | 11.4|18.8 | 3.5|4.6 | 13.7|26 | 12.1|16 | 2.6|1.8 | 193|282 | 24.4|27.9 | 0.7|0.5 |
| std | 12 | 1.5 | 102|148 | 88.7|142 | 28.5|31.8 | 93|161 | 87|154 | 13.1|17.2 | 671|1080 | 142|120 | 10.6|4.6 |
| 25% | 35 | 8 | 0|0.1 | 0|0 | 0|0 | 0|0 | 0|0 | 0|0 | 0|18 | 0|0.1 | 0|0 |
| 50% | 43 | 9 | 0.8|5.3 | 0|0 | 0|0 | 0|0.1 | 0|0.7 | 0.1|0 | 25|74 | 0.7|3.4 | 0|0 |
| 75% | 52 | 9 | 9.7|26.1 | 0.6|3.5 | 0|0 | 2.2|8.8 | 2.4|5.4 | 0.9|0 | 127|227 | 10.4|17.7 | 0|0 |
Table 2.
p-values for every used app associated with paired t-test contrast between pre- and post-lockdown.
Table 2.
p-values for every used app associated with paired t-test contrast between pre- and post-lockdown.
| | WhatsApp | Instagram | Twitter | Facebook | YouTube | Games | Phone Usage | Chrome | Spotify |
|---|
| Group 1 | <0.01 | <0.01 | 0.19 | <0.01 | <0.01 | <0.01 | <0.01 | <0.01 | <0.01 |
| Group 2 | <0.01 | <0.01 | <0.01 | <0.01 | <0.01 | <0.01 | <0.01 | <0.01 | <0.01 |
| Group 3 | <0.01 | <0.01 | <0.01 | <0.01 | <0.01 | <0.01 | <0.01 | <0.01 | <0.01 |
| Group 4 | 0.09 | <0.01 | 0.07 | <0.01 | <0.01 | <0.01 | 0.19 | 0.07 | 0.97 |
| Publisher’s Note: MDPI stays neutral with regard to jurisdictional claims in published maps and institutional affiliations. |
© 2021 by the authors. Licensee MDPI, Basel, Switzerland. This article is an open access article distributed under the terms and conditions of the Creative Commons Attribution (CC BY) license (https://creativecommons.org/licenses/by/4.0/).


 ,
, 


