
An Evolutionary Belief Rule-Based Clinical Decision Support System to Predict COVID-19 Severity under Uncertainty


Abstract
:1. Introduction
2. Related Work
3. Materials and Methods
3.1. BRBES
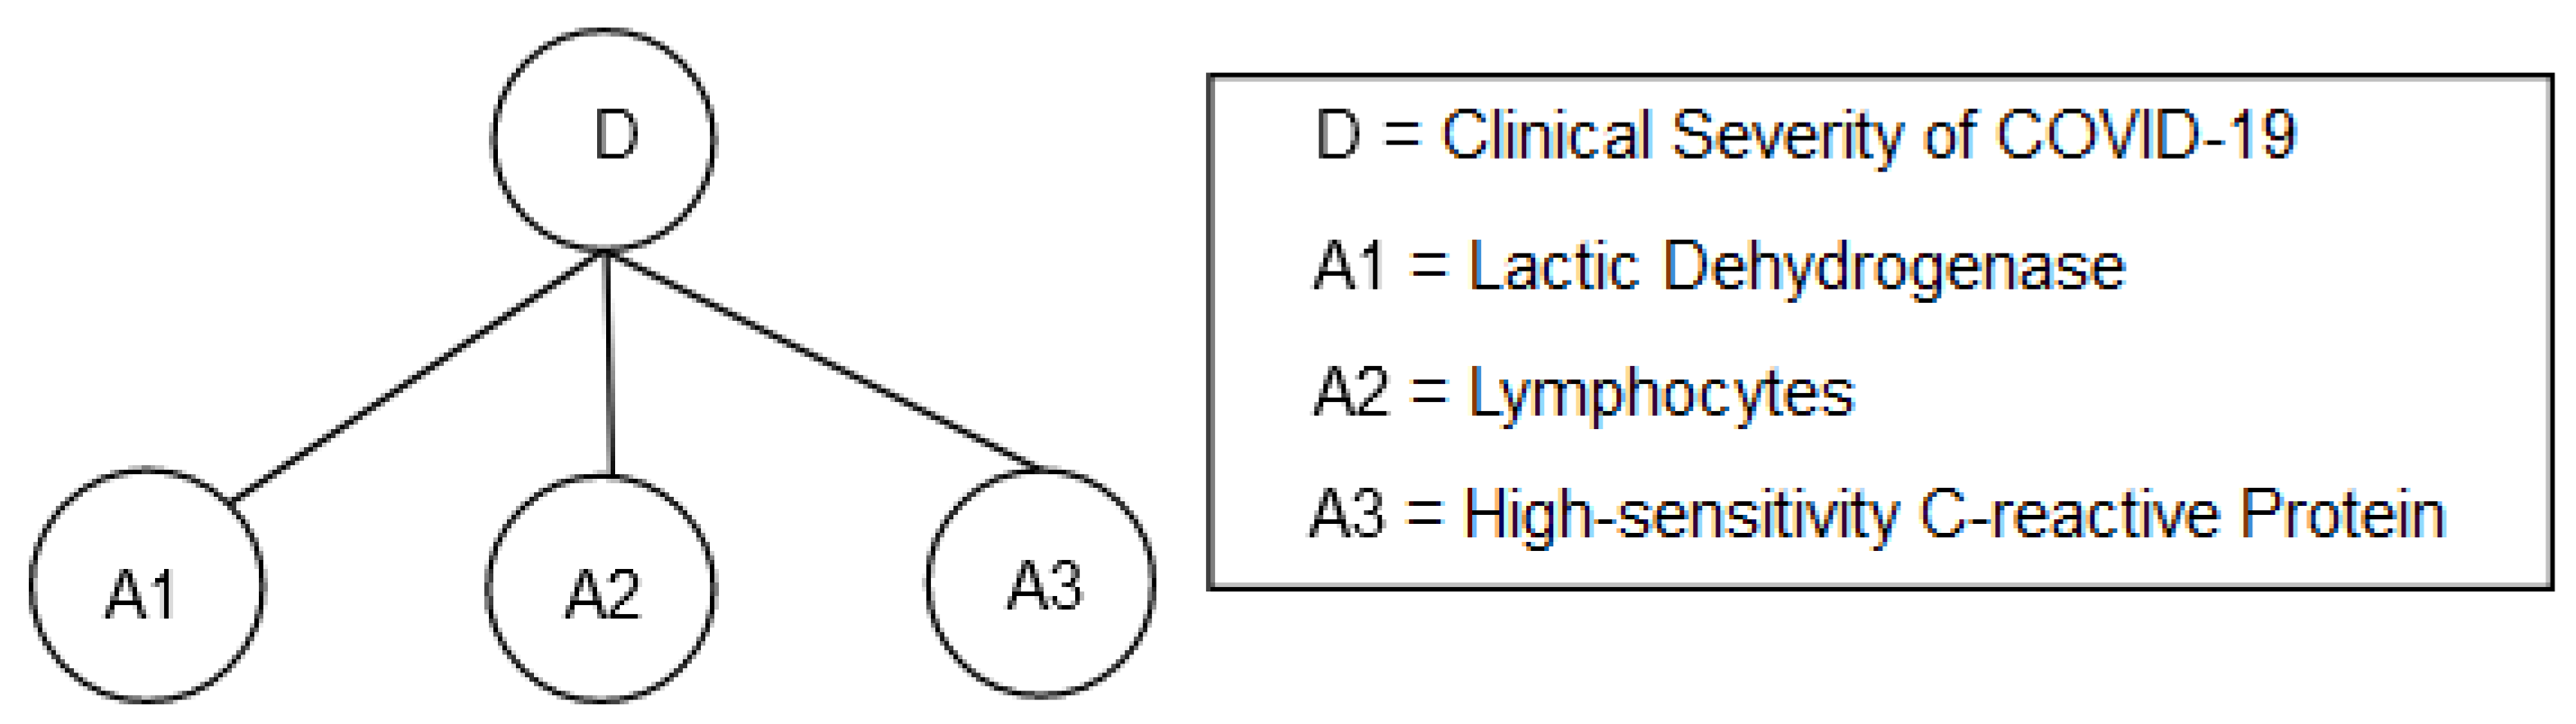
Modeling Domain Knowledge Using BRB
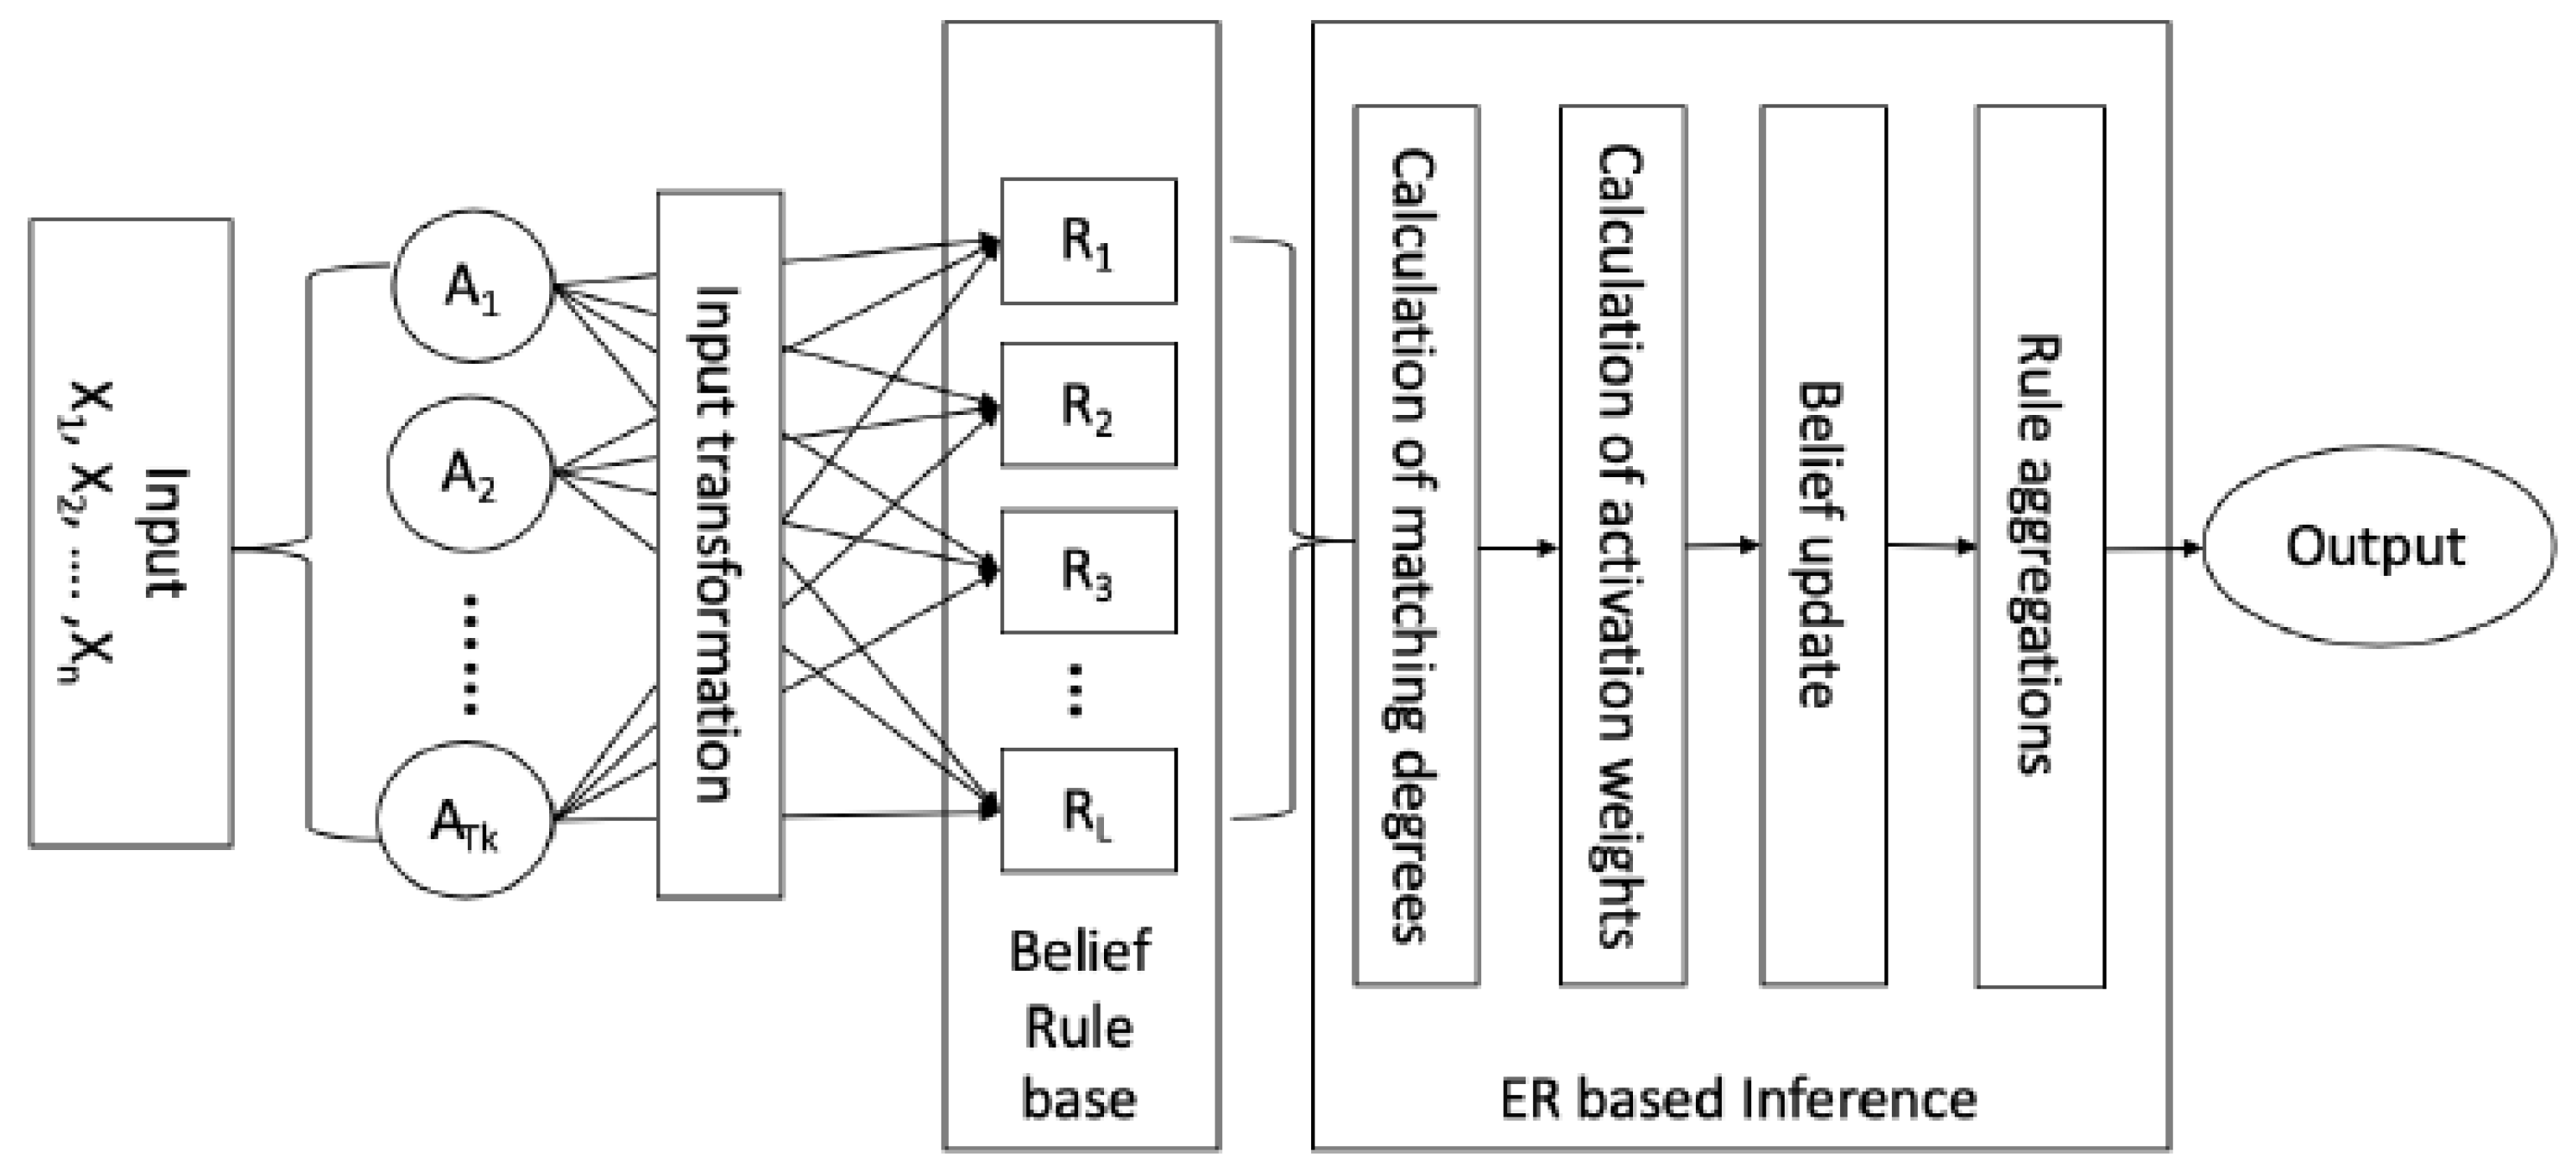
3.2. Inference with BRB Using ER Approach
3.2.1. Input Transformation and Individual Matching Degree Calculation
3.2.2. Calculation of Activation Weight of Each Belief Rule
3.2.3. Construction of BRB Expression Matrix
3.2.4. Integration of Activated Belief Rule Using ER Algorithm
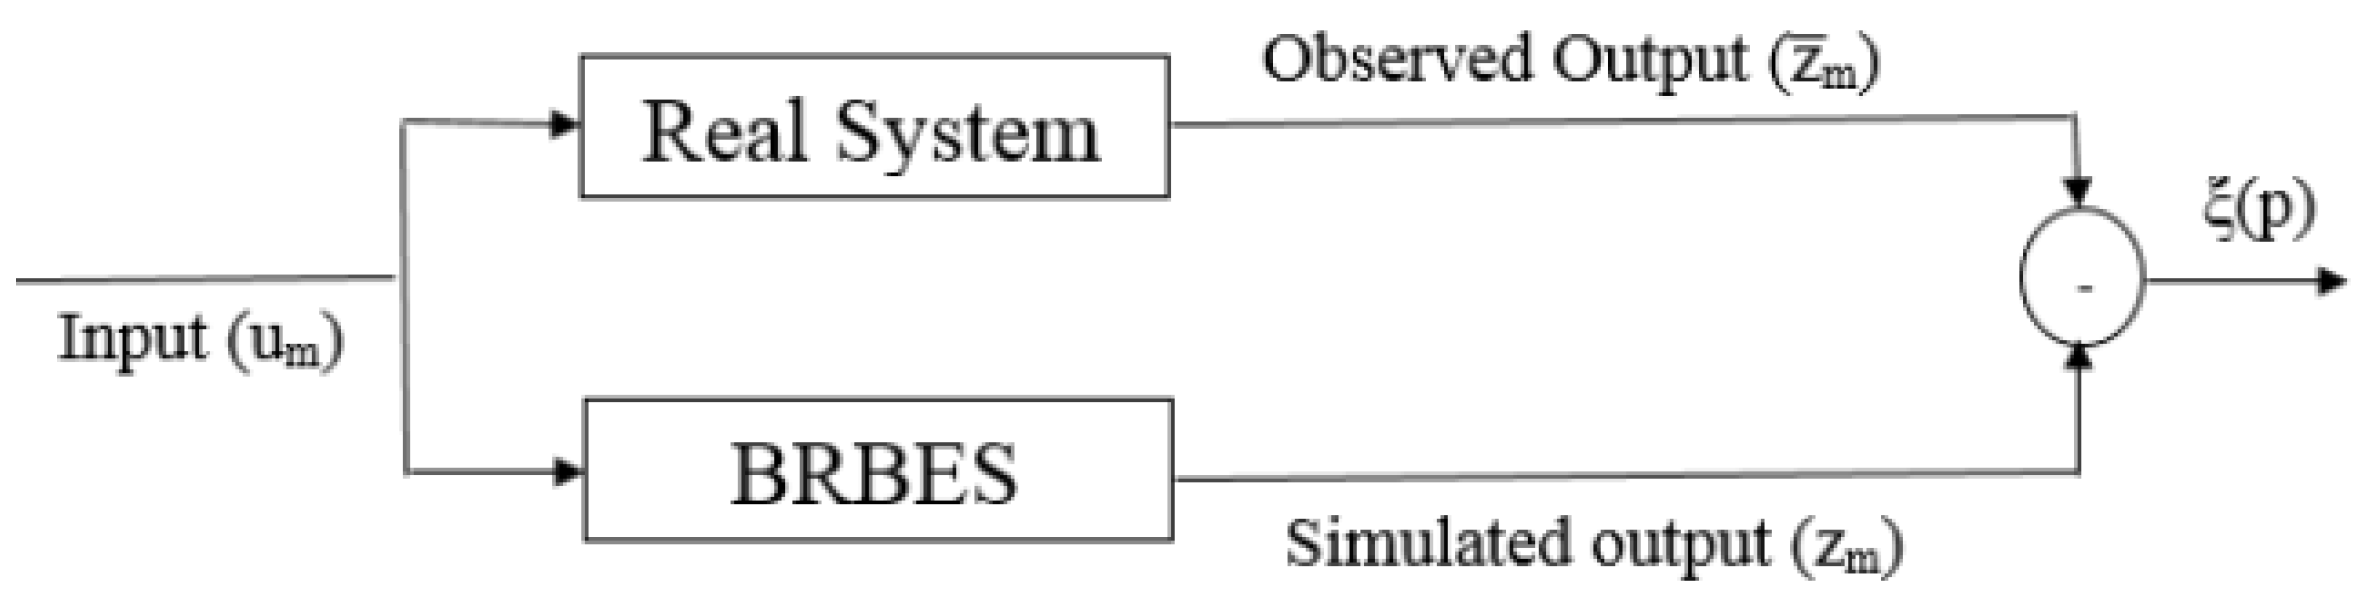
3.3. Training BRB with Historical Data
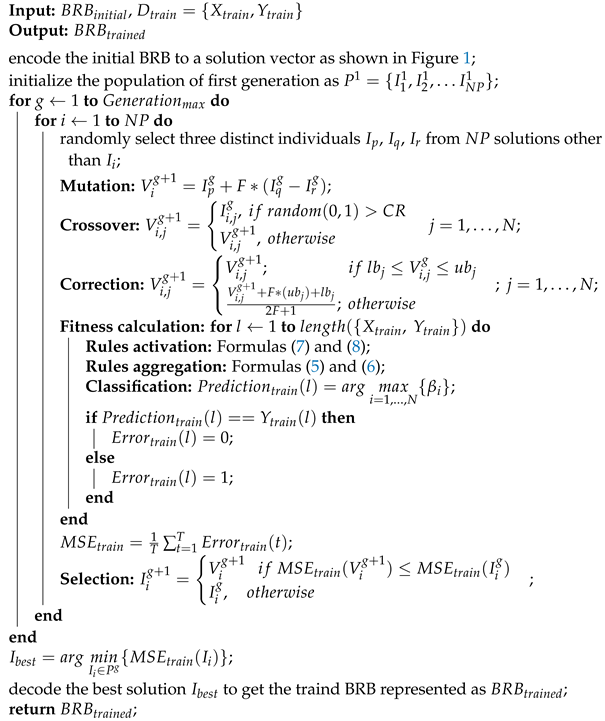
3.4. The Modified DE Algorithm
| Algorithm 1: Optimization of BRB with Modified DE. |
 |
4. Experiments
4.1. Dataset
4.2. Experimental Settings
5. Result and Discussion
6. Conclusions
Author Contributions
Funding
Institutional Review Board Statement
Informed Consent Statement
Data Availability Statement
Conflicts of Interest
Abbreviations
| BRBES | Belief Rule-Based Expert System |
| CBRB | Conjunctive Belief Rule Base |
| DBRB | Disjunctive Belief Rule Base |
| CDSS | Clinical Decision Support System |
| DE | Differential Evolution |
| SVM | Support Vector Machine |
| DT | Decision Tree |
| ANN | Artificial Neural Network |
| LR | Logistic Regression |
References
- Gao, Y.; Li, T.; Han, M.; Li, X.; Wu, D.; Xu, Y.; Zhu, Y.; Liu, Y.; Wang, X.; Wang, L. Diagnostic utility of clinical laboratory data determinations for patients with the severe COVID-19. J. Med. Virol. 2020, 92, 791–796. [Google Scholar] [CrossRef]
- Tan, L.; Wang, Q.; Zhang, D.; Ding, J.; Huang, Q.; Tang, Y.Q.; Wang, Q.; Miao, H. Lymphopenia predicts disease severity of COVID-19: A descriptive and predictive study. Signal Transduct. Target. Ther. 2020, 5, 1–3. [Google Scholar] [CrossRef]
- Velavan, T.P.; Meyer, C.G. Mild versus severe COVID-19: Laboratory markers. Int. J. Infect. Dis. 2020, 95, 304–307. [Google Scholar] [CrossRef] [PubMed]
- Jiang, X.; Coffee, M.; Bari, A.; Wang, J.; Jiang, X.; Shi, J.; Dai, J.; Cai, J.; Zhang, T.; Wu, Z.; et al. Towards an artificial intelligence framework for data-driven prediction of coronavirus clinical severity. Comput. Mater. Contin. 2020, 63, 537–551. [Google Scholar] [CrossRef]
- Ohlsson, M. WeAidU—A decision support system for myocardial perfusion images using artificial neural networks. Artif. Intell. Med. 2004, 30, 49–60. [Google Scholar] [CrossRef]
- Garg, A.X.; Adhikari, N.K.; McDonald, H.; Rosas-Arellano, M.P.; Devereaux, P.J.; Beyene, J.; Sam, J.; Haynes, R.B. Effects of computerized clinical decision support systems on practitioner performance and patient outcomes: A systematic review. JAMA 2005, 293, 1223–1238. [Google Scholar] [CrossRef]
- Tan, C.; Huang, Y.; Shi, F.; Tan, K.; Ma, Q.; Chen, Y.; Jiang, X.; Li, X. C-reactive protein correlates with CT findings and predicts severe COVID-19 early. J. Med. Virol. 2020, 92, 856–862. [Google Scholar] [CrossRef] [PubMed] [Green Version]
- Yadollahpour, A.; Nourozi, J.; Mirbagheri, S.A.; Simancas-Acevedo, E.; Trejo-Macotela, F.R. Designing and implementing an ANFIS based medical decision support system to predict chronic kidney disease progression. Front. Physiol. 2018, 9, 1753. [Google Scholar] [CrossRef]
- Vieira, S.M.; Mendonça, L.F.; Farinha, G.J.; Sousa, J.M. Modified binary PSO for feature selection using SVM applied to mortality prediction of septic patients. Appl. Soft Comput. 2013, 13, 3494–3504. [Google Scholar] [CrossRef]
- Finkelstein, J.; Cheol Jeong, I. Machine learning approaches to personalize early prediction of asthma exacerbations. Ann. N. Y. Acad. Sci. 2017, 1387, 153. [Google Scholar] [CrossRef]
- Yao, J.; Dwyer, A.; Summers, R.M.; Mollura, D.J. Computer-aided diagnosis of pulmonary infections using texture analysis and support vector machine classification. Acad. Radiol. 2011, 18, 306–314. [Google Scholar] [CrossRef] [Green Version]
- Zafeiris, D.; Rutella, S.; Ball, G.R. An artificial neural network integrated pipeline for biomarker discovery using Alzheimer’s disease as a case study. Comput. Struct. Biotechnol. J. 2018, 16, 77–87. [Google Scholar] [CrossRef] [PubMed]
- Harjai, S.; Khatri, S.K. An intelligent clinical decision support system based on artificial neural network for early diagnosis of cardiovascular diseases in rural areas. In Proceedings of the 2019 Amity International Conference on Artificial Intelligence (AICAI), Dubai, United Arab Emirates, 4–6 February 2019; pp. 729–736. [Google Scholar]
- Er, O.; Temurtas, F.; Tanrıkulu, A.Ç. Tuberculosis disease diagnosis using artificial neural networks. J. Med. Syst. 2010, 34, 299–302. [Google Scholar] [CrossRef]
- Schrag, A.; Siddiqui, U.F.; Anastasiou, Z.; Weintraub, D.; Schott, J.M. Clinical variables and biomarkers in prediction of cognitive impairment in patients with newly diagnosed Parkinson’s disease: A cohort study. Lancet Neurol. 2017, 16, 66–75. [Google Scholar] [CrossRef] [Green Version]
- Anooj, P. Clinical decision support system: Risk level prediction of heart disease using weighted fuzzy rules. J. King Saud Univ. Comput. Inf. Sci. 2012, 24, 27–40. [Google Scholar] [CrossRef] [Green Version]
- Kong, G.; Xu, D.L.; Body, R.; Yang, J.B.; Mackway-Jones, K.; Carley, S. A belief rule-based decision support system for clinical risk assessment of cardiac chest pain. Eur. J. Oper. Res. 2012, 219, 564–573. [Google Scholar] [CrossRef]
- Wang, Y.M.; Yang, L.H.; Fu, Y.G.; Chang, L.L.; Chin, K.S. Dynamic rule adjustment approach for optimizing belief rule-base expert system. Knowl. Based Syst. 2016, 96, 40–60. [Google Scholar] [CrossRef]
- Yan, L.; Zhang, H.T.; Goncalves, J.; Xiao, Y.; Wang, M.; Guo, Y.; Sun, C.; Tang, X.; Jing, L.; Zhang, M.; et al. An interpretable mortality prediction model for COVID-19 patients. Nat. Mach. Intell. 2020, 2, 283–288. [Google Scholar] [CrossRef]
- Wu, J.; Roy, J.; Stewart, W.F. Prediction modeling using EHR data: Challenges, strategies, and a comparison of machine learning approaches. Med. Care 2010, 48, S106–S113. [Google Scholar] [CrossRef]
- Cooper, G.F.; Aliferis, C.F.; Ambrosino, R.; Aronis, J.; Buchanan, B.G.; Caruana, R.; Fine, M.J.; Glymour, C.; Gordon, G.; Hanusa, B.H.; et al. An evaluation of machine-learning methods for predicting pneumonia mortality. Artif. Intell. Med. 1997, 9, 107–138. [Google Scholar] [CrossRef]
- Wu, C.; Rosenfeld, R.; Clermont, G. Using data-driven rules to predict mortality in severe community acquired pneumonia. PLoS ONE 2014, 9, e89053. [Google Scholar] [CrossRef] [PubMed] [Green Version]
- Clermont, G.; Angus, D.C.; DiRusso, S.M.; Griffin, M.; Linde-Zwirble, W.T. Predicting hospital mortality for patients in the intensive care unit: A comparison of artificial neural networks with logistic regression models. Crit. Care Med. 2001, 29, 291–296. [Google Scholar] [CrossRef]
- Ghassemi, M.; Naumann, T.; Doshi-Velez, F.; Brimmer, N.; Joshi, R.; Rumshisky, A.; Szolovits, P. Unfolding physiological state: Mortality modelling in intensive care units. In Proceedings of the 20th ACM SIGKDD International Conference on Knowledge Discovery and Data Mining, New York, NY, USA, 24–27 August 2014; pp. 75–84. [Google Scholar]
- Johnson, A.E.; Pollard, T.J.; Mark, R.G. Reproducibility in critical care: A mortality prediction case study. In Proceedings of the Machine Learning for Healthcare Conference, Boston, MA, USA, 18–19 August 2017; pp. 361–376. [Google Scholar]
- Batista, A.d.M.; Miraglia, J.; Donato, T.; Chiavegatto Filho, A.; de Moraes Batista, A.F.; Miraglia, J.L.; Donato, T.H.R.; Chiavegatto Filho, A.D.P. COVID-19 diagnosis prediction in emergency care patients: A machine learning approach. In Hospital Israelita Albert Einstein-Big Data Analytics M; Department of Epidemiology SoPH, University of Sao Paulo: São Paulo, Brazil, 2020. [Google Scholar]
- Schwab, P.; Schütte, A.D.; Dietz, B.; Bauer, S. predCOVID-19: A Systematic Study of Clinical Predictive Models for Coronavirus Disease 2019. arXiv 2020, arXiv:2005.08302. [Google Scholar]
- Alakus, T.B.; Turkoglu, I. Comparison of deep learning approaches to predict COVID-19 infection. Chaos Solitons Fractals 2020, 140, 110120. [Google Scholar] [CrossRef]
- Yip, S.S.; Klanecek, Z.; Naganawa, S.; Kim, J.; Studen, A.; Rivetti, L.; Jeraj, R. Performance and Robustness of Machine Learning-based Radiomic COVID-19 Severity Prediction. medRxiv 2020. [Google Scholar] [CrossRef]
- Chen, Y.; Ouyang, L.; Bao, F.S.; Li, Q.; Han, L.; Zhu, B.; Ge, Y.; Robinson, P.; Xu, M.; Liu, J.; et al. An Interpretable Machine Learning Framework for Accurate Severe vs. Non-Severe COVID-19 Clinical Type Classification. 2020. SSRN 3638427. Available online: https://papers.ssrn.com/sol3/papers.cfm?abstract_id=3638427 (accessed on 2 May 2021).
- Yao, H.; Zhang, N.; Zhang, R.; Duan, M.; Xie, T.; Pan, J.; Peng, E.; Huang, J.; Zhang, Y.; Xu, X.; et al. Severity detection for the coronavirus disease 2019 (COVID-19) patients using a machine learning model based on the blood and urine tests. Front. Cell Dev. Biol. 2020, 8, 683. [Google Scholar] [CrossRef]
- Yang, J.B. Rule and utility based evidential reasoning approach for multiattribute decision analysis under uncertainties. Eur. J. Oper. Res. 2001, 131, 31–61. [Google Scholar] [CrossRef]
- Yang, J.B.; Liu, J.; Wang, J.; Sii, H.S.; Wang, H.W. Belief rule-base inference methodology using the evidential reasoning approach-RIMER. IEEE Trans. Syst. Man Cybern. Part Syst. Hum. 2006, 36, 266–285. [Google Scholar] [CrossRef]
- Hossain, M.S.; Rahaman, S.; Kor, A.L.; Andersson, K.; Pattinson, C. A belief rule based expert system for datacenter pue prediction under uncertainty. IEEE Trans. Sustain. Comput. 2017, 2, 140–153. [Google Scholar] [CrossRef] [Green Version]
- Price, K.; Storn, R.M.; Lampinen, J.A. Differential Evolution: A Practical Approach to Global Optimization; Springer Science & Business Media: Berlin/Heidelberg, Germany, 2006. [Google Scholar]
- Mining, W.I.D. Data mining: Concepts and techniques. Morgan Kaufinann 2006, 10, 559–569. [Google Scholar]
- Bradley, A.P. The use of the area under the ROC curve in the evaluation of machine learning algorithms. Pattern Recognit. 1997, 30, 1145–1159. [Google Scholar] [CrossRef] [Green Version]
- Islam, R.U.; Hossain, M.S.; Andersson, K. A novel anomaly detection algorithm for sensor data under uncertainty. Soft Comput. 2018, 22, 1623–1639. [Google Scholar] [CrossRef] [Green Version]
- Python Programming Language. In Proceedings of the USENIX Annual Technical Conference, Santa Clara, CA, USA, 17–22 June 2007; Volume 41, p. 36. Available online: https://thereaderwiki.com/en/Python_(programming_language) (accessed on 2 May 2021).
- Pedregosa, F.; Varoquaux, G.; Gramfort, A.; Michel, V.; Thirion, B.; Grisel, O.; Blondel, M.; Prettenhofer, P.; Weiss, R.; Dubourg, V.; et al. Scikit-learn: Machine learning in Python. J. Mach. Learn. Res. 2011, 12, 2825–2830. [Google Scholar]

| Ref. No. | Method | Limitations |
|---|---|---|
| [4] | Logistic Regression, K Nearest Neighbor, Random Forest, Support Vector Machine Decision Tree | Accuracy is low, Cannot integrate expert knowledge in the prediction process, Dataset is small and imbalance |
| [26] | Logistic Regression, Gradient Boosting Tree, Random Forest, Support Vector Machine Neural Network | Accuracy is low, Cannot integrate expert knowledge in the prediction process Dataset is small and imbalance |
| [27] | Logistic Regression, eXtreme Gradient Boosting, Random Forest, Support Vector Machine Neural Network | Accuracy is low, Cannot integrate expert knowledge in the prediction process Dataset is small and imbalance |
| [28] | Deep Neural Network, Convolutional Neural Network, Long Short-Term Memory, Recurrent Neural Networks CNNLSTM, and CNNRNN | Can not integrate expert knowledge in the prediction process Dataset is small and imbalance |
| [29] | Machine Learning based radiomic model using logistic regression | Sensitive to inter-observer classifications, Can not be used without any caution |
| [30] | Gini impurity for feature selection Random forest for classification | Based on many biochemistry features which are costly to collect from lab test |
| [31] | Logistic Regression, Adaptive Boosting, Random Forest, Support Vector Machine K nearest neighbor | Accuracy is low, Require around 52 features for prediction. Therefore, not suitable for practical application |
| Activation Weight | Consequrnt Belief Degree | |||
|---|---|---|---|---|
| … | ||||
| … | ||||
| … | ||||
| … | … | … | … | … |
| … | ||||
| … | … | … | … | … |
| … | ||||
| Predicted Critical | Predicted Non-Critical | |
|---|---|---|
| Actual Critical | TP | FN |
| Actual non-critical | FP | TN |
| Referential Points | Very Low (VL) | Low (L) | Medium (M) | High (H) | Very High (VH) |
|---|---|---|---|---|---|
| Numerical Values | 122 | 558.25 | 994.5 | 1430.75 | 1867 |
| Referential Points | Very Low (VL) | Low (L) | Medium (M) | High (L) | Very High (VH) |
|---|---|---|---|---|---|
| Numerical Values | 0 | 12.5 | 25 | 37.5 | 50 |
| Referential Points | Very Low (VL) | Low (L) | Medium (M) | High (H) | Very High (VH) |
|---|---|---|---|---|---|
| Numerical Values | 0 | 79.5 | 159 | 238.5 | 318 |
| Rule Weight | Antecedent Attributes | COVID-19 Clinical Severity | |||
|---|---|---|---|---|---|
| A1 | A2 | A3 | Normal | Critical | |
| 0.9 | VH | VH | VH | 0.0 | 1.0 |
| 0.9 | VH | VH | H | 0.1 | 0.9 |
| … | … | … | … | … | … |
| 1.0 | M | M | M | 0.5 | 0.5 |
| … | … | … | … | … | … |
| 0.9 | VL | VL | M | 0.9 | 0.1 |
| 1.0 | VL | VL | VL | 1.0 | 0.0 |
| Rule Weight | Antecedent Attributes | COVID-19 Clinical Severity | |||
|---|---|---|---|---|---|
| A1 | A2 | A3 | Normal | Critical | |
| 0.8 | VH | VH | VH | 0.0 | 1.0 |
| 0.9 | H | H | H | 0.3 | 0.7 |
| 0.8 | M | M | M | 0.5 | 0.5 |
| 0.9 | L | L | L | 0.7 | 0.3 |
| 0.7 | VL | VL | VL | 1.0 | 0.0 |
| Model | Settings |
|---|---|
| Logistic Regression (LR) | Loss: binary cross-entropy; penalty: l2 |
| Optimizer: lbfgs; learning rate: 0.001 | |
| Support Vector Machine (SVM) | Kernel: linear; C: 1.25 |
| Decision Tree (DT) | Splitting Criteria: Gini-index; Maximum Depth: 3 |
| Neural Network (NN) | First hidden layer—units: 10; activation: relu |
| Second hidden layer—units: 5; activation: relu | |
| Output layer—unit: 1; activation: sigmoid | |
| Loss: binary cross-entropy; optimizer: adam; learning rate: 0.001 |
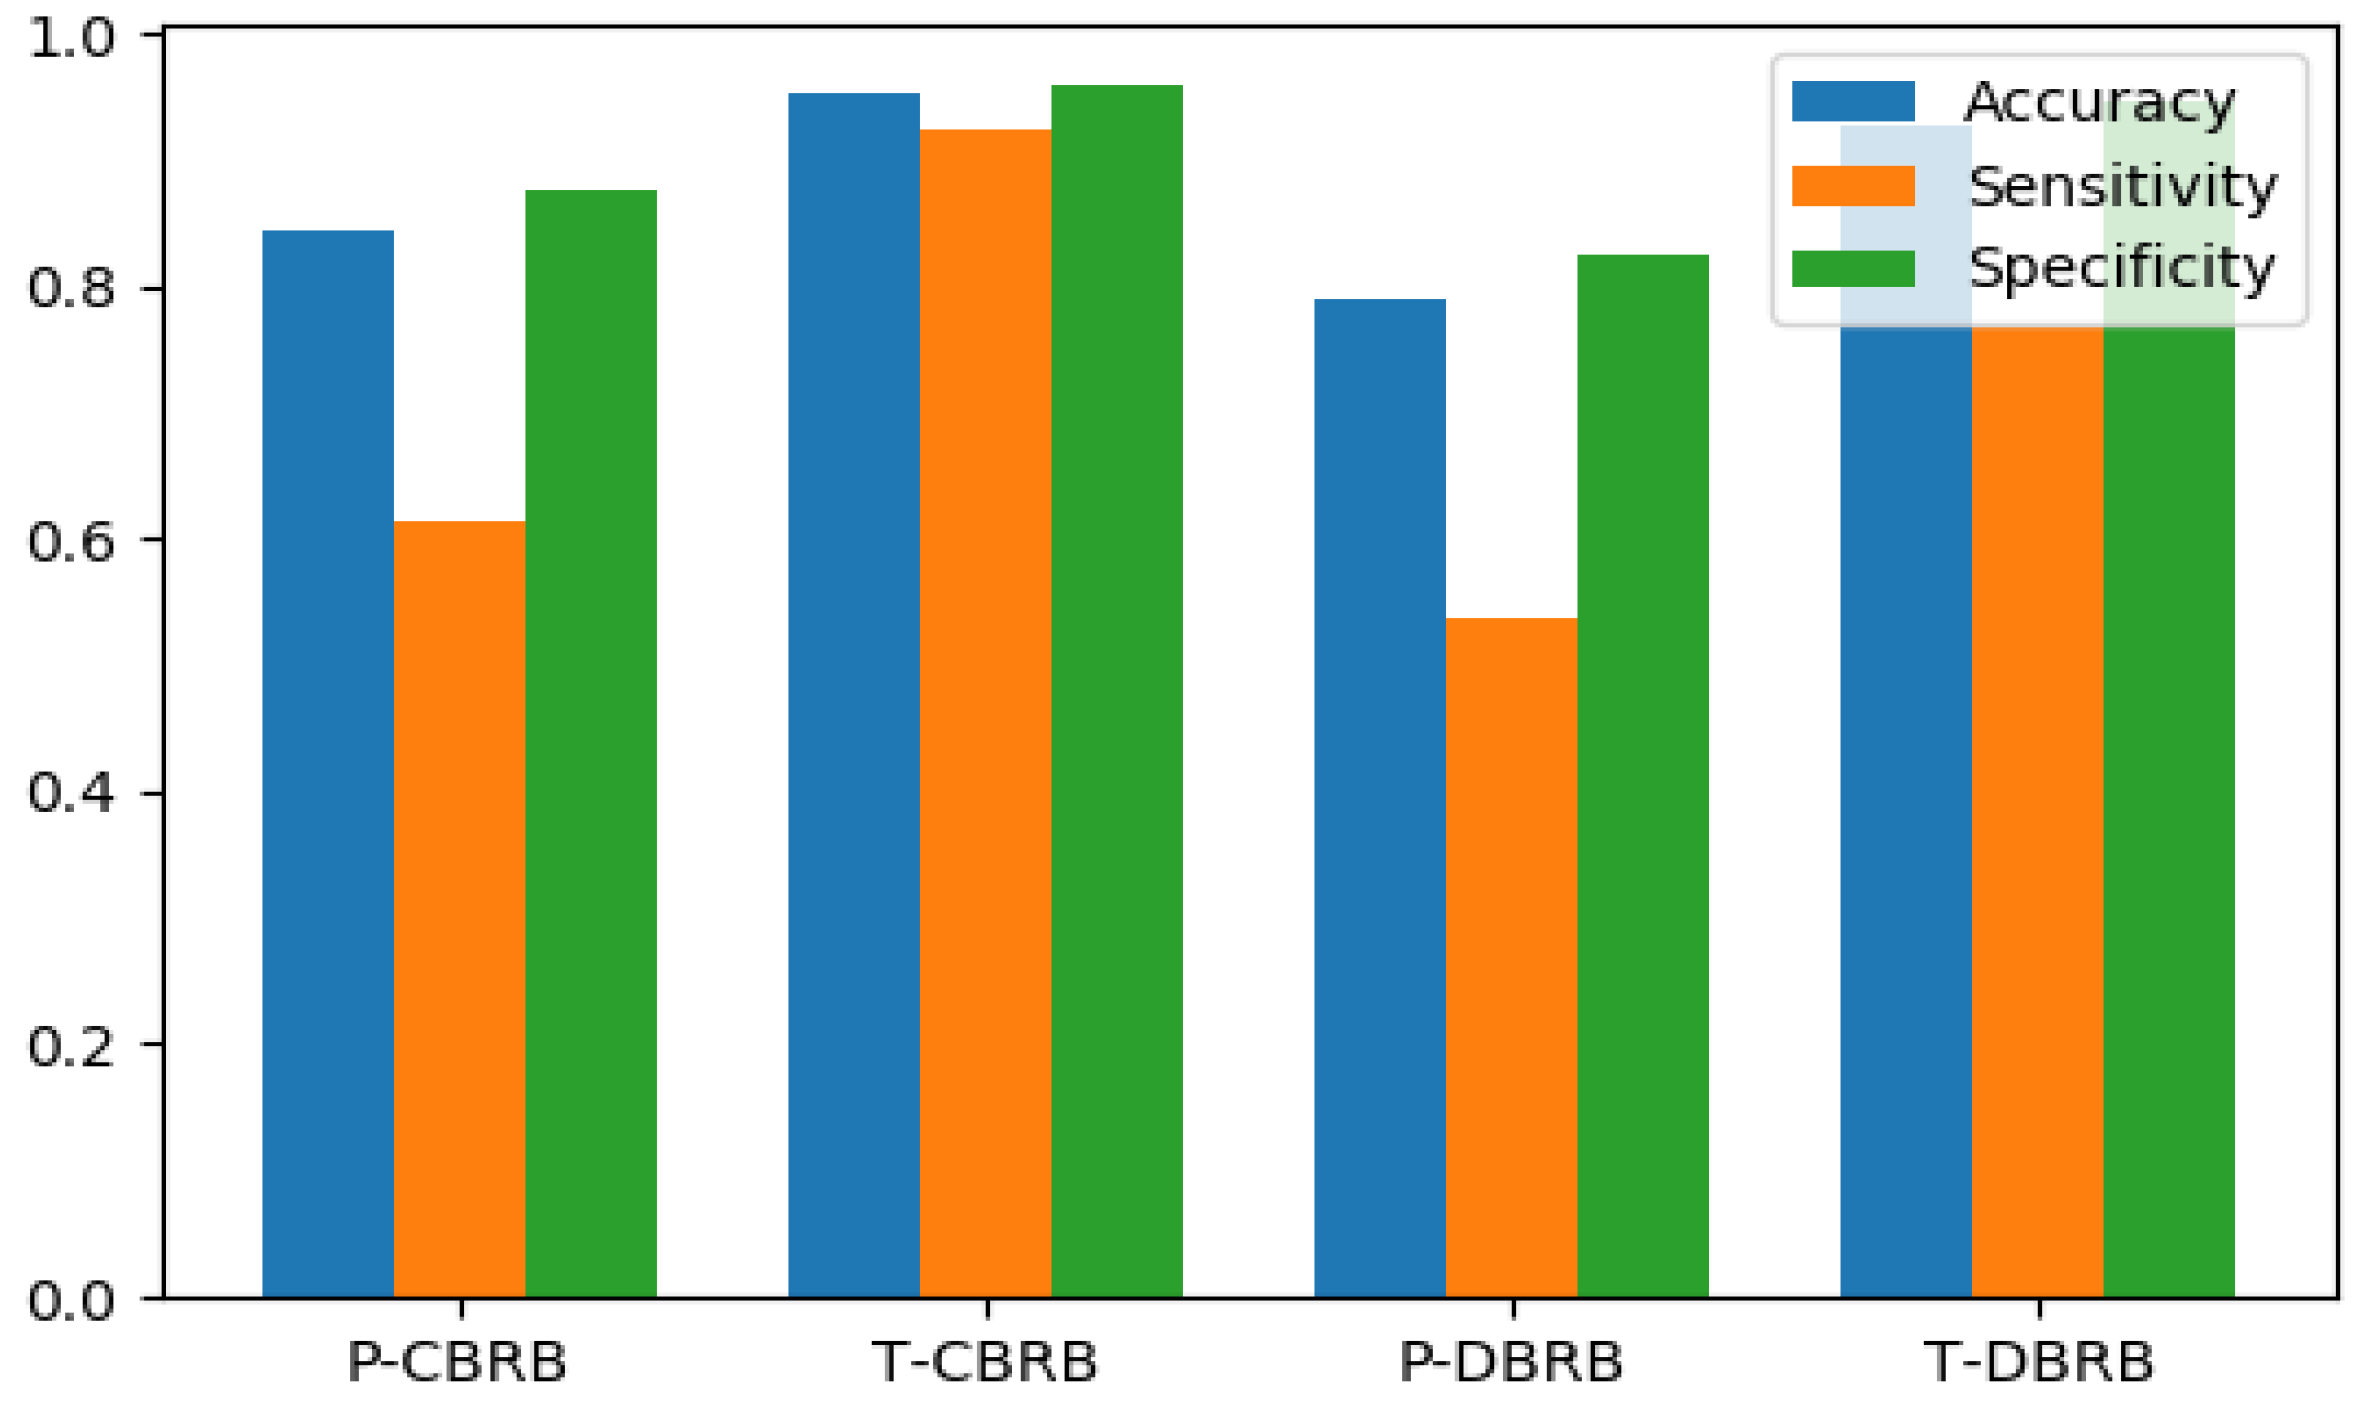
| P-CBRB | T-CBRB | P-DBRB | T-DBRB | |
|---|---|---|---|---|
| Accuracy | 0.845 | 0.954 | 0.791 | 0.927 |
| Sensitivity | 0.615 | 0.923 | 0.538 | 0.769 |
| Specificity | 0.876 | 0.959 | 0.825 | 0.948 |
| No of Parameter | 378 | 18 | ||
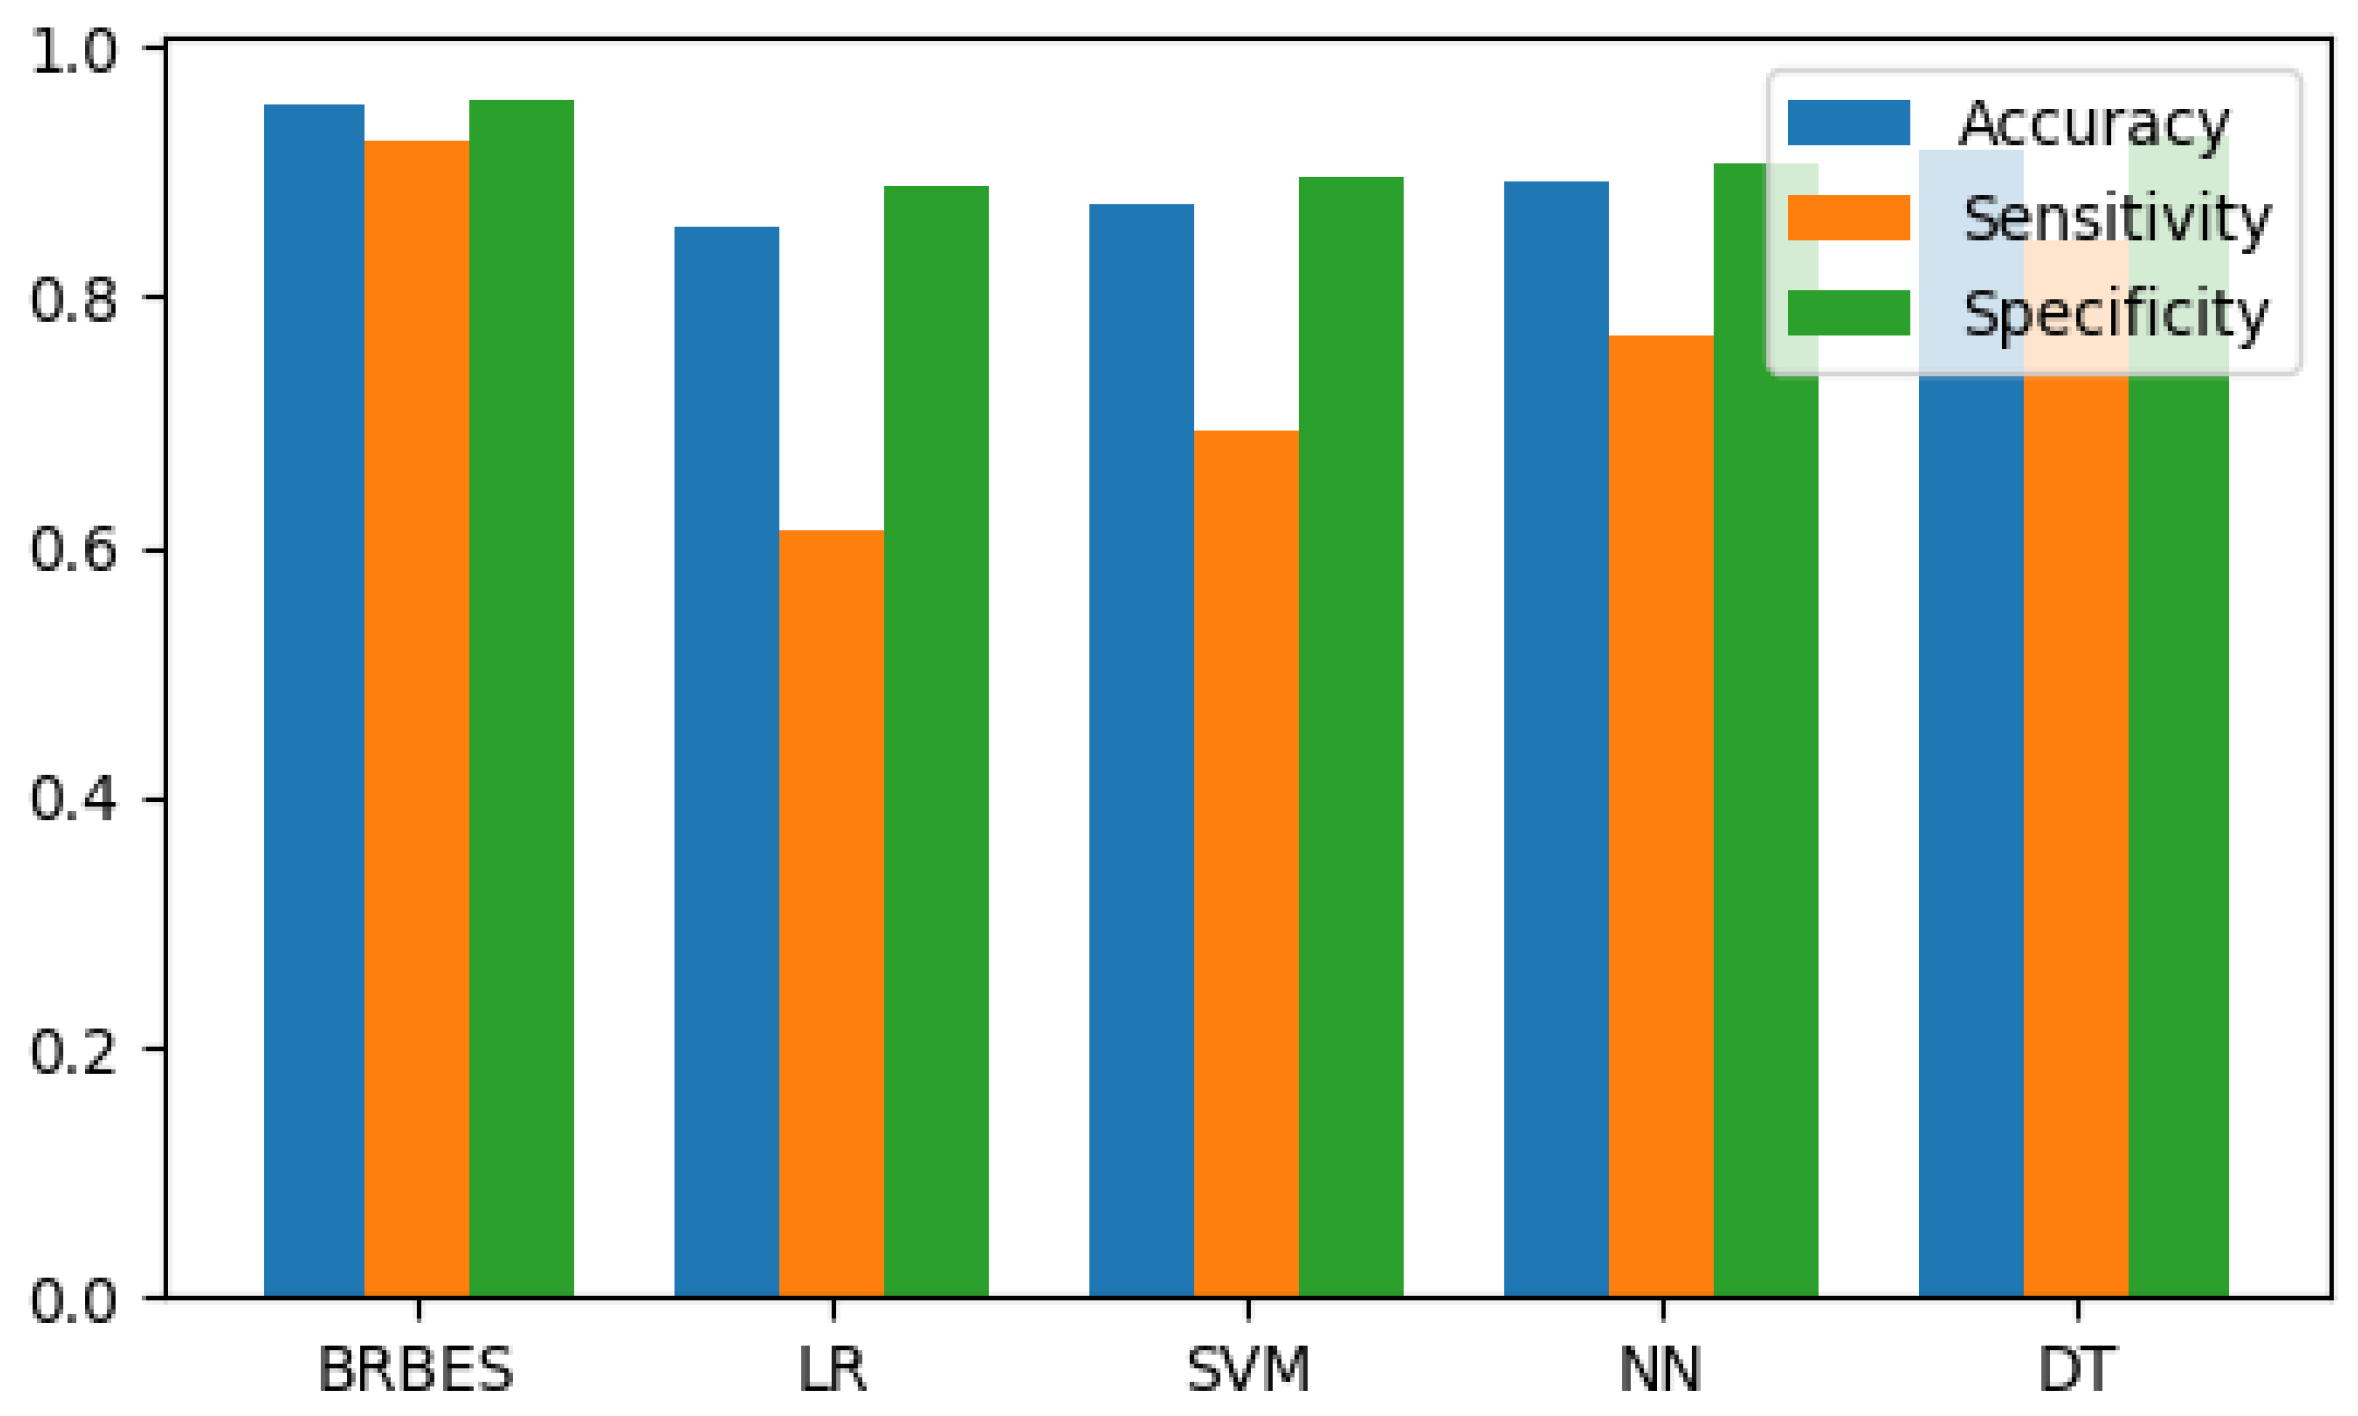
| BRBES | LR | SVM | NN | DT | |
|---|---|---|---|---|---|
| Accuracy | 0.954 | 0.855 | 0.873 | 0.891 | 0.918 |
| Sensitivity | 0.923 | 0.615 | 0.692 | 0.769 | 0.846 |
| Specificity | 0.959 | 0.887 | 0.897 | 0.907 | 0.928 |
Publisher’s Note: MDPI stays neutral with regard to jurisdictional claims in published maps and institutional affiliations. |
© 2021 by the authors. Licensee MDPI, Basel, Switzerland. This article is an open access article distributed under the terms and conditions of the Creative Commons Attribution (CC BY) license (https://creativecommons.org/licenses/by/4.0/).
Share and Cite
Ahmed, F.; Hossain, M.S.; Islam, R.U.; Andersson, K. An Evolutionary Belief Rule-Based Clinical Decision Support System to Predict COVID-19 Severity under Uncertainty. Appl. Sci. 2021, 11, 5810. https://doi.org/10.3390/app11135810
Ahmed F, Hossain MS, Islam RU, Andersson K. An Evolutionary Belief Rule-Based Clinical Decision Support System to Predict COVID-19 Severity under Uncertainty. Applied Sciences. 2021; 11(13):5810. https://doi.org/10.3390/app11135810
Chicago/Turabian StyleAhmed, Faisal, Mohammad Shahadat Hossain, Raihan Ul Islam, and Karl Andersson. 2021. "An Evolutionary Belief Rule-Based Clinical Decision Support System to Predict COVID-19 Severity under Uncertainty" Applied Sciences 11, no. 13: 5810. https://doi.org/10.3390/app11135810