Review

Impacts of E-Micromobility on the Sustainability of Urban Transportation—A Systematic Review

1
Sustainable Mobility Management, Euref Campus, Technische Universität Berlin, 10623 Berlin, Germany
2
Mobility Research Cluster, Department of Work, Technology and Participation, Technische Universität Berlin, 10587 Berlin, Germany
*
Author to whom correspondence should be addressed.
Appl. Sci. 2021, 11(13), 5851; https://doi.org/10.3390/app11135851
Submission received: 17 May 2021 / Revised: 17 June 2021 / Accepted: 21 June 2021 / Published: 24 June 2021
(This article belongs to the Special Issue Urban Transport Systems Efficiency, Network Planning and Safety)

Abstract

:
When considering the sharp growth rate of the use of e-micromobility vehicles, such as e-scooters and e-bikes, it is necessary to investigate whether these emerging modes of transport play a sustainable role in cities in terms of their energy efficiency, emissions, and their relationship with other modes of mobility, such as public transport. This paper aims to provide a comprehensive overview of the impacts of e-micromobility through a systematic review of relevant studies in the field of e-scooters and e-bikes. We followed the steps of PRISMA to conduct a systematic literature review, including identification, screening, eligibility and inclusion steps. One hundred forty-six studies were reviewed and compiled, and 29 of these studies were selected for the focus of this review and their research data were synthesized. The impacts of e-micromobilities were categorized into four categories—travel behaviors, energy consumption, environmental impacts, and safety and related regulations. The category of travel behaviors includes the analysis of the purposes of travel, modal shift from different modes of transport to e-micromobility vehicles, average travel time, and distance. In this review, the findings of relevant studies in different cities around world are compared to each other and synthesized to give an insight into the role of e-micromobility in the present and in the future of urban transportation.

1. Introduction

Transportation is one of the most dynamic elements of cities, substantially affecting the other components of cities, as well as citizens’ lives. In this context, there is a significant association between urban transportation and the sustainability of the urban environment in terms of energy consumption and emissions. According to the International Energy Agency (IEA, 2020), the transportation sector produced 24 percent of total CO2 emissions in the world in 2019, and it consumed 28 percent of the total energy in the USA. Furthermore, in Europe the transport sector accounted for 25 percent of CO2 emissions in 2016 and approximately 94 percent of the energy demand which is provided by fossil energy. Therefore, it is necessary to develop more sustainable mobility systems, which is defined as a sector that uses efficiently energy resources and generates fewer emissions and pollution related to transport congestion [1,2,3,4,5].
Recently, newly emerging mobility services have been developed in cities around the world, which citizens have adopted remarkably quickly. One of these new mobility modes is e-micromobility, which has gained a considerable share in the distribution of urban modes of transport. For instance, in the USA, e-scooter and e-bike sharing led to around 45 million trips in 2018 [6]. In this paper, e-micromobility refers to e-bikes and e-scooters. Micromobility is defined as small and lightweight (less than 500 kg) modes of transport with speeds less than 25 km/h, most of which are used individually, such as the use of bicycles, and with standing position, such as the use of scooters. E-micromobility vehicles are different from micromobility vehicles due to their motorized powertrains, which are electric, as in e-bikes, e-scooters, and e-skateboards [7,8]. Regarding the rapid growth rate of e-micromobility in global metropolises, some studies indicate that car ownership and car dependency have declined among young generations compared to older generations, and shared services are largely accepted and popular among them. Thus, it is already possible to see their impacts on citizens’ mobility behaviors, city infrastructure, and the related energy consumption behaviors. Nevertheless, e-micromobility is a new mode of urban transportation, and it is not yet known whether these emerging modes play a sustainable role in cities, whether they are used as supplementary or complementary modes of public transport, for instance as last- and first-mile solutions, or whether they are used just for fun and recreational travel purposes. There are a few international literature reviews in this field examining previous studies in different urban forms and geographies to give an insight into the future role of these new mobility modes. For instance, a systematic review by Boglietti et al. (2021) analyzed the effects of e-power micro-personal mobility from two different perspectives, examining its impacts on transport and urban planning, and safety issues and the environment. The main point of divergence between the article by Boglietti et al. and this study is the analysis of travel behaviors, including travel purposes, and the frequency of use presented in this study. In addition, the energy consumption of e-micromobilities is one of the main parts of this review, which thus differs significantly from other reviews such as that of Boglietti et al. (2021) [9]. To understand the role of e-micromobility in the sustainability of transportation, it is necessary to consider four aspects together, which are travel behaviors, energy consumption, the urban environment, and the safety issues of e-micromobility as well as the required regulations. Another systematic review by O’Hern and Estgfaeller (2020) studied articles about powered micromobility published between 1991 and 2020 by their data and topic, keywords, most cited authors, most cited articles, and their country. The objectives of O’Hern and Estgfaeller were to study the evolution of mobility research in the field of micromobility in terms of time, region, and the numbers of citations; however, the indicators and measurement of the four above-mentioned impact aspects were not compared and synthesized [10].
This paper reviews and compiles former studies to gain broader knowledge about the impacts of e-micromobility on cities and presents an international review in this field for forthcoming studies. In this paper, we studied how e-micromobility affects people’s mobility behaviors and urban transport systems. The research purposes can be formulated as four key questions to analyze the impacts of e-micromobility, as follows:
  • Q1: What are e-micromobility’s impacts on current travel behaviors?
  • Q2: What are e-micromobility’s impacts on energy consumption?
  • Q3: What are e-micromobility’s impacts on the urban environment?
  • Q4: What are the safety issues of e-micromobility and the required regulations?
The questions are divided into subtopics, as shown in Figure 1.
The framework of this article proceeds as follows, with the Materials and Methods section clarifying how the literature was determined within the search method, providing the inclusion/exclusion criteria, the final selection, and the method used for the analysis of the studies.
Afterwards, in the Results section, the key questions are studied based on the chosen literature, analyzing the impacts of e-micromobility on travel behaviors, energy consumption, and the related safety issues and regulations. Its impacts on mobility behaviors are reviewed in four sub-topics, including the average number of e-micromobility trips per day, the average daily distance and time traveled by means of e-micromobility, the purposes of this travel, and modal shifts from different mobility modes to e-micromobility vehicles. All these sub-topics give an indication of how people change their travel behaviors. Secondly, the impacts of energy consumption are reviewed and analyzed in the related studies about energy consumption. Afterwards, the environmental impacts of e-micromobility are examined and the last topic focuses on the related safety issues and regulations in different cities around world.

2. Materials and Methods

It is an undeniable fact that e-micromobility has attracted the attention of researchers, urban planners, and policymakers. Since it is a new topic in mobility research, there is a limited number of studies in this field, and it is expected that the number of studies will increase considerably in the future. Therefore, related studies from around the world were reviewed and presented to gain a widespread understanding the e-micromobility phenomenon and its impacts.

2.1. Search Method for the Identification of Studies

In this study, we conducted an online search using search engines, such as Google Scholar, Scopus, Web of Science, and Research Gate. Figure 2 shows the Prisma Flow Chart (Preferred Reporting Items for Systematic Reviews and Meta-Analyses), which shows the whole process from the identification of the literature to the inclusion and exclusion processes of the systematic review, including qualitative and quantitative synthesis. Studies were gathered based on their titles and abstracts in the identification phase to gather all related studies.

2.2. Inclusion/Exclusion Criteria for the Selection of Studies

A total of 146 studies were compiled through searching the keywords “micromobility” and “e-micromobility” in their titles and abstracts. In the identification stage, duplicate studies were removed. Hence, 124 studies were screened and 83 of them were excluded, regarding their topics and contents. In the eligibility stage, full-text articles were assessed for eligibility, and 29 studies were selected based on the relevance of their data to the main research purposes of this study.

2.3. Selection and Analysis of Studies

In the inclusion phase, 29 scientific articles, journal articles, conference proceedings, and reports were selected to be reviewed. Those studies were categorized into seven sub-topics depending on the research questions, as stated above. Those categories are explained in detail in the following sections.
The 29 studies were reviewed in this study in different sections based on their findings and contexts. Studies from before 2016 were not included in the literature review, in order to examine up-to-date studies only. E-scooters and e-bikes entered the market in different years; e-scooter studies have been conducted since 2018, and the studies conducted after 2016 have mostly been carried out in the field of e-bikes. An additional consideration is the geographical allocation of the data. Studies were gathered mostly from the USA, Europe, Canada, UK, and New Zealand. Nine studies contained both e-scooters and e-bikes. On the other hand, five studies discussed only e-scooters, whereas four studies investigated dockless bikes and e-bikes, along with docked bikes and e-bikes.

3. Results

3.1. Impacts on Travel Behaviors

Micromobility has the capability to be used for all trips with different travel purposes which are less than 8 km, which represents 50 to 60 percent of total trips in China, the European Union, and the United States [11]. Therefore, it could be assumed that micromobility vehicles might become a substitute for most car trips, as is it known that most car trips are made to travel less than an 8-km distance [12]. To address the first research question, that is, determining “e-micromobility’s impacts on current travel behaviors”, in this paper we discuss the average trips per day, the average distance and time for the daily usage of e-micromobility vehicles, as well as modal shifts to e-micromobility from different modes of transport. These findings are essential in order to evaluate their impacts on the current travel behaviors of citizens and to predict forthcoming travel behaviors.

3.1.1. Average E-Micromobility Trips per Day

E-micromobility services offer unique pleasure to their users, such as riding in the open air, control of the vehicle, liberty, and flexibility during their travels [6]. Table 1 shows the findings from the selected literature in terms of how many trips were made per day. It is considerably challenging to reach any common result among the studies. For instance, in Chicago, with a population of 2,725,296, 105,479 e-scooter trips were made per day in 2019 [13]. Meanwhile, in Washington, with a population of around 5,322,000, 2821 e-scooter trips were made per day in 2019 [14]. In Zurich, with around 434,000 inhabitants (1.5 million in the metropolitan area), 1032 dockless e-scooter trips were made in 2020 [15].
According to Hardt and Bogenberger (2019), 49 trips were made per day in their pilot project conducted in Munich, Germany, and this amount was considerably higher than those of the other studies, presumably due to the fact that this pilot project was conducted with a relatively small number of vehicles and participants [16]. Another survey in Munich in 2019 reported 5.5 trips per day using e-scooters [12]. Furthermore, according to a future model concerning 2030 made by McKinsey and Company (2019), there will be approximately 250 million shared-micromobility trips in Munich, which represents approximately 8 to 10 percent of all trips in Munich in that year, in which shared-micromobility trips made up less than 0.1 percent of all trips in 2019 [12]. According to the data collected by McKenzie (2019), Bird reported 170 trips per day, Lime reported 214 per day, Lyft reported 835 trips per day, Skip reported 1487 trips per day, Spin reported 115 trips per day, and Jump e-bikes reported 325 trips per day, which is in total 2821 e-scooter trips per day, in Washington, USA [17]. Furthermore, regarding e-bike trips, another study conducted with 66 participants in Norway reported 1.4 e-bike trips per day [18]. During COVID-19, 50 to 60 percent of the passenger-kilometers decreased, which also affected the use of micromobility, according to the survey they conducted in May 2020, including seven countries such as China, Germany, France, Japan, Italy, the US, and UK. They assume that after COVID-19 the use of micromobility may increase, suggesting that 9 percent of people tend to have private micromobility and 12 percent of them tend to use shared micromobility in the “next normal” era [19]. Moreover, according to the 2019 Global ACES2 Consumer Survey, 70 percent of participants would consider buying their own micromobility vehicles for commuting to work or school, which will result in more micromobility trips per day [19].

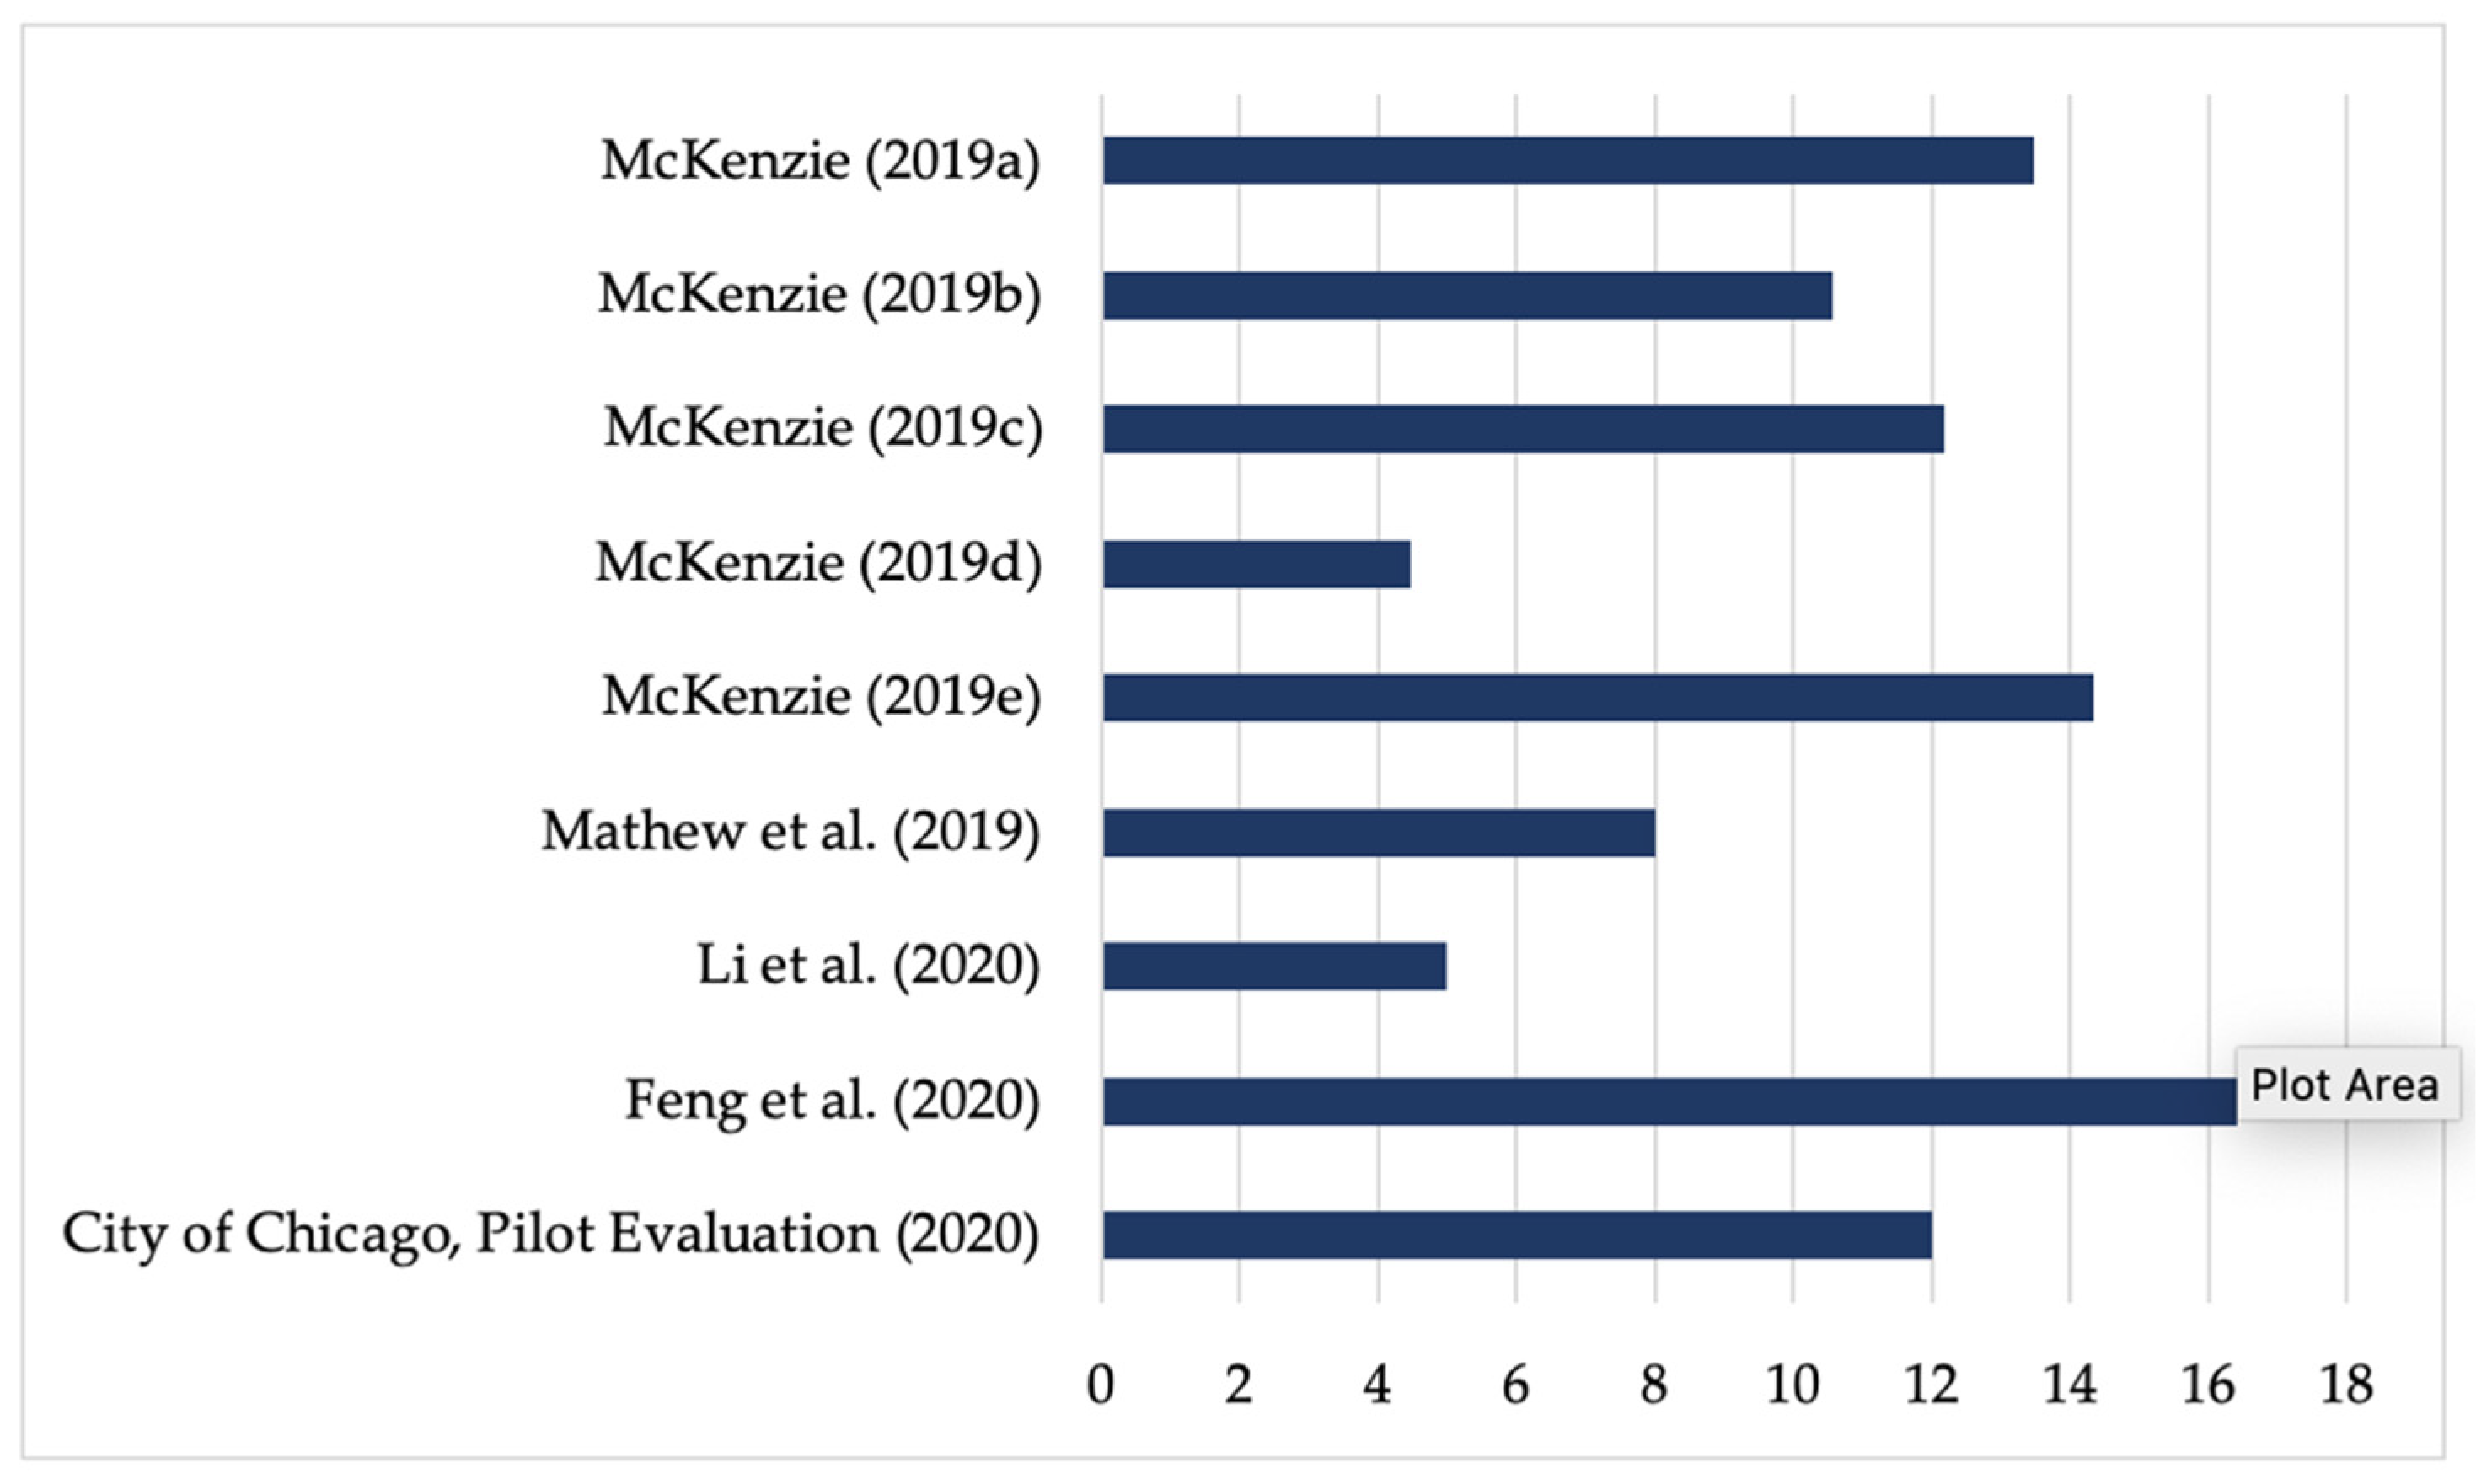
3.1.2. Average Distance and Time of E-Micromobility Usage

E-bikes and e-scooters have shown different average travel distances and times in cities. The findings of various studies indicate that the average distance traveled on e-scooters is shorter than that on e-bikes (Figure 3). The difference in the travel distance and time between e-bikes and e-scooters depends on several factors, such as the speed and electric power of the vehicles [20]. Moreover, people have reported that when they want to make longer recreational trips, they choose e-bikes instead of conventional bikes, which shows that e-bikes are mostly preferred for longer trips [21]. Figure 3 illustrates the average daily distances traveled using e-scooters which were estimated in seven studies.
Hardt and Bogenberger (2019) reported that the longest distance traveled using e-scooters was 11 km, which was estimated in a pilot study including 38 participants in Munich (Germany) [16]. Presumably, it was because this was a pilot project with a small number of people and vehicles that the average distance was significantly high [16]. In contrast, e-scooters are known to be used for short trips, and according to Chang et al. (2019), 70 percent to 73 percent of trips are less than 1 mile (1.6 km) in Washington [6]. However, the findings in the literature were mostly between 0.72 and 2.4 km for the average e-scooter distance, and the average duration spent using e-scooters was between 8 and 12 min (Figure 4).
The data on the average daily distance traveled on e-bikes, collected from eight designated studies, are presented in Figure 5.
To be more precise, in the case of Castro et al. (2019), the data were gathered from a survey of 10,000 people from seven cities in Europe, and it was stated that 365 people used e-bikes [21]. It is known that in these cities, bicycles are used as one of the major daily modes of transportation, and e-bikers used e-bike for almost half of the month. Furthermore, they stated that e-bikers’ daily usage of bikes was significantly more than that of conventional bikers, and with 8 km and 32.2 min, the longest average time of use was reported by this study, among the studies (Figure 6) [21]. The longest average distance was 11.4 km, reported for Kunming, China, by Chery et al. (2016) [20]. Moreover, the shortest average distance for docked and dockless e-bikes was 1.6 km, which was declared for Zurich, Switzerland, by Reck et al. (2020) [15], and the shortest time was 15 min, again for Zurich, Switzerland, by Li et al. (2020) [22]. However, most studies reported average distances traveled by e-bike in the range of 3–4.5 km and travel times in the range of 15 and 20 min.
The trip distance for dockless e-bikes and e-scooters has remained similar during COVID-19, whereas the trip distance for docked e-bikes has increased compared to the normal period in Zurich [22]. In contrast, US micromobility companies have reported that the average e-scooter trip distance increased by 26 percent during COVID-19; e.g., in Detroit, trip distances have increased up to 60 percent [11,12]. Therefore, people tend to use e-scooters for a longer distance than before, instead of using public transportation during COVID-19.

3.1.3. Purpose of E-Micromobility Usage

As mentioned in the previous section, e-scooters are used mostly for less than 1.5-km trips. Moreover, it is clear that e-scooters are not preferred for long journeys, which means that they are used for limited travel purposes. Figure 7 illustrates the usage purposes of e-scooters among the selected literature. In the USA, most e-scooters were used to commute to work and school, or fun/recreation, and proportions of these purposes were notably close to each other [6,13,23]. Percentages varied from city to city in the USA, as well as in Europe. For instance, in Chicago, 50 percent of users stated that they had been using e-scooters for social/entertainment reasons [13]; however, in Austin, Portland, and San Francisco, the most commonly specified purpose of usage was commuting to work or school [6].
In the study by Chang et al. (2019), in Portland, the most common e-scooter usage was recreational, reported by 28 percent of participants, and the second most common form of e-scooter usage was commuting to work and school, reported by 20 percent [6]. Moreover, in Austin, the most common purpose for dockless e-scooter and e-bike usage was commuting to work and school, reported by 35 percent of participants. In San Francisco, the most common e-scooter usage was commuting to work and school, at 55 percent [6]. In the study by Hardt and Bogenberger conducted in Munich (2019), the usage purposes for e-scooters were reported as 38 percent for commuting trips, 31 percent for leisure, 16 percent for business trips, 8 percent for shopping, and 6 percent for errands [16]. In the study by Li et al. (2020) from Zurich (Switzerland), 24.64 percent of e-scooter trips were for leisure purposes, 22.77 percent were for going home, and 20.06 percent were for going to work in the normal period (in the study, the normal period referred to before the COVID-19 pandemic) [22]. Furthermore, according to Pimentel and Lowry (2020), in Washington, Oregon and Idaho, USA, the most common purpose for e-scooter usage was recreation, at 23 percent [23].
Regarding the pilot evaluation made by the city of Chicago (2020), the travel purposes for e-scooter users consisted of 50 percent for social/entertainment, 42 percent for going to or from restaurants, 41 percent for fun/recreation, 30 percent for commuting, 34 percent for going to or from transit, 28 percent for shopping/errands, 10 percent for going to/from business appointment, 4 percent for going to or from school, and 2 percent for exercise [13]. Presumably, in the Chicago survey, participants were able to choose more than one option for their travel preferences. Therefore, the cumulative percentages are higher than one hundred, as is the case in the study by Leger et al. (2018) [13,14]. Regarding Leger et al. (2018), in Ontario (Canada), the usage purposes for e-scooters were reported as commuting (70 percent), recreation (more than 80 percent), errands (more than 50 percent) and first-/last-mile travel (about 40 percent) [14].
As indicated in Figure 8, in the study by Cairns et al. (2017) in Brighton, UK, the most common purpose of the use of e-bikes was commuting to work, followed by recreational usage, including daily activities, in second place [24]. Castro et al. (2019) reported that it can be presumed that e-bikes were used for longer recreational trips compared to conventional bikes [21].
As mentioned earlier in relation to the purposes of using e-scooters, participants could choose more than one option for their travel preferences in the survey by Leger et al. (2018) [14]. Therefore, the cumulative percentages are higher than one hundred. In that study, the purposes for the usage of e-bikes were reported as commuting to work (more than 80 percent), recreational purposes (more than 90 percent), first-/last-mile travel (50 percent), and errands (more than 70 percent) in Ontario, Canada [14]. Li et al. (2020) reported that the most common purpose for the usage of docked bikes and e-bikes was commuting in Zurich, Switzerland [22]. In the COVID-19 period, the most common usage purpose was home activity, at 28.58 percent [22]. Pimentel and Lowry (2020) stated recreation purposes as the most common purpose for the usage of e-bikes, at 37.5 percent in Washington, Oregon, and Idaho, USA [23].
In the case of the purpose of the usage of e-bikes, most e-bikes are thus used for commuting. Admittedly, the purpose of recreation is also significantly common. Notably, in the study by Reck et al. (2020), they stated that docked modes were used mostly for commuting in Zurich, Switzerland [15]. Thus, we can presume that people’s mode choices are more risk-free when traveling for certain reasons such as commuting [15].

3.1.4. Modal Shift to E-Micromobility

Cities have been struggling with traffic congestion over the past several years. The modal shift from private cars to new mobility solutions such as ICT-based mobility modes and sharing modes in cities, particularly in central business districts (CBDs), will be a sustainable and effective way of improving urban transportation systems [25,26,27,28]. With the launch of e-micromobility in urban transportation, their use rises day by day. However, it has been stated that, based on the growth in the European and Asian scooter market since 2014, the modal shifts from walking and public transportation have been increasing oriented to this new mode of mobility [16]. It would be an advantage for urban sustainability if e-micromobility vehicles replace private cars and are used as last-mile or first-mile solutions as a complement to public transport. In this section, modal shift data were collected through the literature review, as indicated in Figure 9.
In three surveys conducted by Agora Verkehrswende (2019), participants were asked what they would have done in their most recent trips if e-scooters were not available, and the answers were as follows. Forty-seven percent of French respondents would have walked, and 29 percent of them would have used public transportation instead of e-scooters; 20 percent of respondents in Portland would have used private cars, and 15 percent of them would have taken taxis, Uber, or Lyft, if the e-scooters were not available; almost half of the tourists in Portland would have used cars; and in San Francisco, one-third of participants would have used Uber, taxis, or Lyft if e-scooters were not available [29]. Chang et al. (2019) reported that 43 percent of e-scooter users replaced walking, 14 percent of them replaced biking, and 32 percent of them replaced ride sourcing and private vehicles in Denver [6]. In Portland, 37 percent of the participants reported that they would have walked, and 9 percent would have cycled in their most recent trips if e-scooters were not available [6]. According to a Lime survey in San Francisco, 61 percent of the participants reported they would have walked, 12 percent would have chosen station-based bike-sharing, and 7 percent would have chosen personal bikes in their most recent trips if e-scooters were not available [6]. The survey of the City of Chicago indicated that 31.8 percent of e-scooter users would have used ride-hailing, 30.2 percent would have walked, 10.8 percent would have driven, 9.9 percent would have used a bus, 4.8 percent would have used bike-sharing, 4.2 percent would have used a train, 2.9 percent would not have taken the trip, and 2.6 percent would have cycled in their most recent trips if e-scooters were not available [13]. In Hollingsworth et al. (2019) in Raleigh, USA, it was reported that 7 percent of users would not have taken the trip; otherwise, 49 percent would have biked or walked, 34 percent would have used a personal automobile or ride-share service, and 11 percent would have taken a public bus in their most recent trips if e-scooters were not available [30]. It can be observed in the study by Hollingsworth et al. (2019) that nearly half of the respondents would have walked the distance they traveled using e-scooters in Raleigh, USA [30]. Therefore, it can be assumed that they had been using e-micromobility vehicles for distances which they could have walked, as replacing walking was considerably common. In contrast, according to Cairns et al.’s (2017) pilot project in Brighton, known for its extraordinary walking levels, the use of e-bikes during the project led to reductions in car driving among 43 percent of the participants [24]. According to Lime, 30 percent of users replaced car trips, whereas 27 percent used e-scooters as first-/last-mile solutions for their recent trips [31].
Notably, it was reported by Reck et al. (2020), that docked e-bikes were preferred for commuting instead of using private cars in traffic in peak hours in Zurich, Switzerland [15]. Likewise, in the UK and the Netherlands, e-bike users have replaced cars, as well as in Sacramento, California [14]. In contrast, in China e-bike users have replaced public transit [20]. In Cairns et al. (2017), it was reported that 20 percent of car mileage was reduced and at least 70 percent of participants would like to have an e-bike in Brighton, UK [24]. They also found that most of the participants’ walking habits tended to be replaced with cycling [24]. At the end of trial carried out by Castro et al. (2019), it was observed that among participants who replaced their mode of travel with e-bikes, 25 percent of participants used to travel by means of private motorized vehicles (car or motorbike), 23 percent of participants by means of non-electric bicycles, and 15 percent of participants by means of public transport, based on data from seven European cities [21]. In Antwerp, bicycle and private motorized vehicle users shifted to e-bikes; in contrast, public transport users shifted to e-bikes in Zurich [21]. According to the surveys conducted by Pimentel and Lowry (2020) in Washington, Oregon, and Idaho, USA, it was found that 66 percent of the participants expected to use these modes of transport more often in the future [23].
Consequently, the modes of transport replaced by e-micromobility vehicles are different based on the country or even differ from city to city; e.g., in Denver 43 percent of e-scooter users replaced walking [6], yet in Raleigh 34 percent replaced personal automobile or ride-share services [30]. In cities with extreme urban density, people tended to replace public transportation with e-bikes [20]. In contrast, it was reported that e-bike users replaced more cars than other modes of transport in Sacramento, California [14].
Furthermore, millennials have a go-nowhere attitude and fewer traveling habits than back in the days. They do not tend to spend as much money on cars as previous generations did and for this reason, micromobility may be a more attractive form of transport for these people. It has been stated that car trips are the least joyful trips, and even this might cause a modal shift from the use of private cars [6]. According to Campisi et al. (2020), it has been declared that there is a correlation between car ownership (85.5 percent of participants) and the willingness to rent a micromobility vehicle [32]. Therefore, an increase in car ownership decreased the willingness to rent micromobility vehicles. Furthermore, it has been claimed that the likelihood of renting micromobility vehicles is higher among students compared to the working class [32].

3.2. Impacts on Energy Consumption

Two thirds of the world’s population will live in cities by 2050, and inevitably, urban settlements will face several further problems [33]. Due to the fact that the world’s resources are being depleted, cities are becoming less livable every day, e.g., global warming has reached a very serious level. To change this situation, it is reasonable to focus on cities, and the first place should be the transport sector, which is responsible for 24 percent of global CO2 emissions, 29 percent of global energy demand, and 65 percent of the world’s total oil consumption [34]. The development of e-micromobility might change overall energy consumption in the mobility sector. Bedmutha et al. (2020) indicated that if trips of 5–8 km that are currently made using conventional motorized vehicles were replaced with the use of e-micromobility vehicles, energy demand would drop by 50 percent in Pittsburg [35]. Since that study was based on Pittsburg, if we consider this in the wider context of the USA and China, which are the largest CO2 producers in the world, e-micromobility could be a game-changer. In this section, the energy consumption of e-micromobility vehicles and their environmental impacts are reviewed.
The question of whether electric vehicles are energy efficient is still the subject of many studies, and there are many dependent variables in relation to this topic. Hence, it does not seem to be possible to reach a definitive conclusion for now. Nevertheless, in this section, the related studies are examined to gain a general estimation. Although there is not yet a very extensive body of literature on this subject, we have compiled and compared studies in terms of energy consumption per mile/km, as well as impacts on global warming in respect to environmental impacts, i.e., the amount of CO2 emitted per passenger-km will be compared among various modes of transport and studies.
As shown in Figure 10, Martínez-Navarro et al. (2020) estimated e-scooters’ energy consumption to be 0.012 kWh/km, Brdulak et al. (2020) reported it to be 0.04 kWh/km, and Agora Verkehrswende (2019) reported it to be 0.01 kWh/km [29,34,36]. Plainly, the numbers by themselves do not mean anything; it is necessary to associate them with other comparable variables to reach a conclusion. Some comparative studies have indicated that electric scooters can travel 128 km with 1 kW/h of energy, whereas a gasoline-powered car can travel less than 1.6 km and a more energy efficient Tesla can travel 6.4 km with the same amount of energy [37]. Furthermore, approximately the same numbers are given in the study by Agora as follows—with the same amount of energy, an e-scooter can travel a 50-times greater distance than a conventional car [29]. Based on the Bird e-scooter, with 1 kW/h of energy, e-scooters can travel approximately 100 km, whereas an electric car can travel 6 km [29]. According to Brdulak et al. (2020), who made an assumption based on data from rental companies in Poland, an e-scooter can travel 100 km with 4 kWh energy [36]. According to Wired (2018), e-micromobility vehicles are 20 times more efficient than electric vehicles and 102 times more efficient than conventional fossil fuel vehicles; furthermore, e-scooters cover their cost in just 4 months and are seen as the most cost-effective vehicles for short distances compared to other transportation modes [31].
Hence, it shows that when e-scooters substitute either conventional cars or electric cars, it leads to a reduction in energy consumption for transportation. Meanwhile, studies have shown that the environmental impact of the amount of energy used while charging e-scooters has a considerably lower impact than their production phase and their collection each night for recharging [30].
A simulation of the demand for electricity in Poland from e-scooters was performed by Brdulak et al. (2020). At the time of their calculations, they made a four-year forecast, claiming that e-scooter ownership in 2023 would reach 30,000 vehicles, and they found that the daily energy consumption of an e-scooter was 1.12 kWh, and that 9.24 GWh was required by a city to power a private e-scooter fleet including 30,000 units for one year [36]. Moreover, to make a comparison, it has been stated that the energy demands of the Warsaw M1 and M2 Metro Lines annually totaled about 125 GWh in 2018, so the difference between two variables is considerably high [36]. In this case, the energy demand of private e-scooters would not be a major load for Polish cities if the ownership rate continues as expected [36]. Nevertheless, a transition to green energy solutions will be a necessary step to generate more electricity from renewable energy resources.
Modal shift from non-motorized modes which do not demand any energy to e-micromobility increases energy demands. If these energy demands continue to be supplied through electricity from fossil fuels, this will create a new burden on energy load, especially for countries that meet most of their energy demand through the use of fossil fuels.
The topographic profiles of cities should be considered in terms of the energy consumption of e-micromobility vehicles. The amount of energy used by e-micromobility vehicles is higher in hilly cities. Martinez-Navarro et al. (2020) estimated the maximum trip distance for e-scooters as 22.2 km with a fully charged battery [34]. However, the maximum travel distance depends on the battery capacity and life. Another factor to be considered is the different amounts of energy consumption between shared and private electric scooters and bikes [38]. To recharge shared micromobility vehicles, it is necessary to collect all the vehicles with combustion-engine cars/trucks, whereas for private scooters and bikes, there is no need for this surplus energy consumption [38]. However, if shared e-micromobility vehicles are used instead of unsustainable modes of transport such as private fossil fuel cars, then this disadvantage of surplus energy consumption can be ignored compared to the energy savings caused by the modal shift away from fossil fuel cars [38].

3.3. Environmental Impacts

Hollingsworth et al. (2019) conducted a Monte Carlo analysis of an e-scooter’s CO2 life cycle and produced an estimate of 125 g CO2-eq per passenger per km, of which 50 percent comes from materials and manufacturing, and 43 percent from the collection process for overnight charging (Figure 11) [30].
Moreau et al. (2020) estimated the global warming potential (GWP) of the use of shared e-scooters and regarding that the GWP was 131 g CO2-eq/passenger-km more than the users’ replaced mode of transportation, which is 110 g of CO2-eq/passenger-km [39]. On the other hand, it should not be ignored that all of these are related to the short lifetime of the vehicles, because this finding was based on shared e-scooters, which have a shorter lifespan compared to private e-scooters, and private e-scooters’ CO2-eq/passenger-km is 67 g [39]. Thus, the difference in CO2-eq/passenger-km between shared and private e-scooters is considerably high. There are dozens of pieces of misinformation about these vehicles’ lifespans. The lifetime of e-scooters varies according to the quality of the product. There are even rumors that shared e-scooters last only 28 days [40]. Another opinion on this issue is that first generation shared e-scooters are not designed for renting in the United States and their lifespan has become very short due to irresponsible use by people, and today their average lifespan is reported to be 2 years [40]. In addition, there have been some improvements to the overnight charging collection process. Now, most e-scooter companies use swappable charging batteries and collect these batteries with the use of e-cargo bikes. This makes the whole process more energy efficient [30].

3.4. Safety Issues and Regulations

E-micromobility has shown a sharp growth rate in many cities. Therefore, it is essential to consider the infrastructure of docked or dockless e-micromobility vehicles in relation to the urban management of space, pavement, and curbs, as well as identifying the related safety issues, and the potential for accidents and causalities. The implementation of regulations will be a visible part of city infrastructure. As explained in the previous section, e-micromobility trips were boosted when the e-scooter entered the market in 2018. However, most users still do not know how to use them properly and even though their speeds are around 25 km per hour, they pose a huge safety risk. If we look at the e-scooter accident numbers, the Austin Public Health Report (2019) indicated that 20 trips out of every 100,000 e-scooter trips resulted in injuries during their study period [6]. According to another study by Trivedi et al. (2019), 249 e-scooter accidents were reported in Southern California between September 2017 and August 2018, and 80 percent of injured people fell, 11 percent crashed into an object, and 9 percent were hit by a moving vehicle [41]. Another study on injuries by Feng et al. (2020) collected Tweets and images between 2018 and 2020 and reported 153 injuries, with 22.88 percent of them being head-related, 27.45 percent of them being trunk- and hand-related, and 49.67 percent of them being leg- and foot-related [42]. According to AASHTO’s guide, cycling or riding on sidewalks causes more accidents than when riding on the road [6]. Because sidewalks are designed for pedestrians, cyclists are not capable of riding on sidewalks properly, and e-scooter users have also exhibited very low helmet use rates. Furthermore, when they investigated the injuries, they found that less than 5 percent of users wore a helmet [6]. Additionally, the City of Chicago Pilot Evaluation Survey (2020) found that 24 percent of the participants stated that they used the e-scooter on the pavement at least for a while, and 5 percent of them used it on the pavement at least half of the time [13]. It was observed that 10 percent of riders used the e-scooter on the sidewalk in a street with a bike lane, and 2.7 percent of riders wore a helmet [13]. Observations for parking showed that 18.4 percent of e-scooters were incorrectly parked on the sidewalk, especially on cycle paths, etc. This is another safety issue for pedestrians and people with disabilities [13].
In another case from Italy, reported by Campisi et al. (2020), for comfort and safety reasons, men tend to use e-scooters more than women [32]. E-scooters have been driven at approximately 17 km/h on shared sidewalks, which is dangerous for pedestrians [32].
Safety issues mostly result from confusion about the right of way and inappropriate parking, with these factors causing most accidents, and low rates of the use of helmet contribute as well. Furthermore, Pimentel and Lowry (2020) stated that misinformation also causes safety problems. Users should be informed about the rules [23].
Glancing at e-scooter regulations, it is quite possible to encounter inconsistent policies across states, cities, and regions. One of the reasons for these policy inconsistencies is that e-scooters are a new and unfamiliar mode of mobility, though they have become one of the basic ones. These differences among regulations have surely been expected, since city administrators have tried to regulate e-scooters based on the user experience to date [43].
As shown in Table 2, studies including the regulations and restrictions of e-micromobility were reviewed here. First, we found that many studies have started to regulate these vehicles, primarily by restricting age and speed. Concerning regulations on the speed of these vehicles, the limit in Poland is 25 km/h [44]. The speed limit in Chicago is 15 mph, which is approximately 24 km/h, and in Oregon the limit is also 15 mph, except there is an inconsistency in Oregon, namely, that micromobility vehicles are also prohibited from traveling at a slower speed than the speed of traffic, i.e., traffic flows at 25 mph, so e-scooters should not travel more slowly than 25 miles per hour (approx. 40 km/h) [13,45]. In this case, how quickly should e-scooter users ride? Another significant regulation from the studies collected here—and perhaps the most agreed-upon one—is the prohibition of riding these vehicles on the pavement. Considering the pedestrians’ rights of way and the higher risk of accidents on the pavement, this decision can be seen to be a highly appropriate decision.
In Japan, e-scooters are prohibited to be used on the pavement and riders should have license plates [46]. In Dubai, the age limitation is 14, riders must wear a helmet and park at designated areas, and riders are prohibited from carrying objects or a second passenger [47].
Another implementation that differs among countries is the pricing policy. In this context, the EU exhibits the cheapest price, almost half of that of the US, and China applies a 20 percent higher price than the US price [48]. Pricing could seem like a company strategy. However, it is indirectly a city policy that affects people’s travel behavior. Furthermore, regarding alternative payment options, Atlanta and Los Angeles require non-credit card payment options, and for non-smartphone users, it is mandatory to have alternative activation methods in Austin, Los Angeles, and Portland [49]. After rising numbers of e-scooters in the streets of Paris between 2018 and 2019, the city authorities restricted the shared e-scooter fleet in the city due the fact that too many companies were entering the market, with numerous vehicles without any regulation [50]. In Paris, the service providers are limited to just three companies, and a limit of 15,000 total vehicles, and this is also the case in San Francisco, Atlanta, and Washington DC. In addition, e-scooters are restricted to bike lanes, with designated parking spots [50,51]. Moreover, regarding the positive impacts of online navigation apps on the sustainable mobility behaviors of citizens through optimizing travel time and route planning [52], there is a potential to use these online platforms to inform citizens about the accessibility of shared e-scooters and their regulations and restrictions in different urban zones.
The other important thing to consider is e-scooter companies’ disruptive distribution strategies, which affect the right of equal access to services and limits e-micromobility usage. Equal distribution of services is one of the basic principles that city administrators should consider [43]. For example, in the USA, in Portland, 15 percent of the e-scooter fleet must be available in East Portland, but in Charlotte, Austin, and Los Angeles, there is no such practice yet [49]. This practice is mostly made so that low-income regions can obtain equal access to the service. Incentives have been provided to some companies that implemented the principle of equal distribution in Los Angeles [49].
It is also crucial to consider that the popularity of e-micromobility has increased during the COVID-19 pandemic, and cities have embarked on quick implementations, with effects on the infrastructure of these cities. Some of these implementations are as follows—in Milan 35 km, in Paris 50 km, in Brussels 40 km, and in Seattle 30 km of car lanes have been converted to bicycle lanes [19]. According to McKinsey and Company (2019), the micromobility industry will be a USD 300 billion to USD 500 billion market by 2030 [11]. Still, the effects of the pandemic on the industry and the micromobility market cannot be known for certain. Hence, to examine this accelerating market and to prepare cities for its adoption, as well as to create more sustainable, equitable, and more livable cities, regulations will have to apply in this field.

4. Conclusions

In this paper, we attempted to shed light on the impacts of e-micromobility vehicles on urban sustainability through a systematic review of global mobility studies in the field of e-scooters and e-bikes. This systematic review was categorized into seven sub-topics related to the impacts of e-micromobility, analyzing them in the terms of the mobility behaviors of citizens, the energy consumption, the environmental impacts, and the related safety issues and regulations.
The impact on travel behaviors includes four sub-topics—the analysis of travel purposes, modal shift from different modes of transport to e-micromobility vehicles, average travel time, and distance. In the USA, e-scooter and e-bike sharing led to around 45 million trips in 2018 [6]. The global findings indicate that the average trip distance and travel time using e-scooters are in the range of 0.72–2.4 km and 8–12 min. However, most studies reported the average travel distance using e-bikes to be in the range of 3–4.5 km and the travel time to be in the range of 15 and 20 min. Therefore, e-micromobility has the capability to be used for all trips which are less than 8 km, consisting of 50 to 60 percent of total trips in China, the European Union, and the United States [11]. Thus, these findings indicate a great potential for the modal shift to e-micromobility vehicles.
In the current evaluation, it has been shown that most people replaced walking which means a substantial increase in the energy demand through the modal shift from nonmotorized modes to e-modes of transport. The global findings indicate that the modal shift to e-micromobility depends on urban forms and travel culture. For instance, the second most replaced mode in the American cities was ride-hailing, whereas in France it was public transportation [29]. In countries with extreme urban density, such as China, people tended to replace public transportation with the use of e-bikes; in contrast, it was reported that e-bike users replaced cars more than other modes in most of the US cities studied [14,20,30].
Another key finding from this research relates to the purposes of the usage of e-micromobility vehicles. In the USA, the proportions of users using these vehicles for commuting to work/school and fun/recreation were notably close to each other [6,13,23]. In Chicago, 50 percent of users stated that they had been using e-scooters for social/entertainment reasons; however, in Austin, Portland, and San Francisco, the specified purpose of usage was mostly for commuting to work or school [6,13]. In the case of e-bikes, most e-bikes 34re using for commuting. Admittedly, the purpose of recreation was also significant.
The findings in the field of the energy consumption indicate that e-scooters could travel 128 km with 1 kW/h of energy, whereas a fossil fuel car can travel less than 1.6 km and the best-in-class e-cars can travel 6.4 km with the same amount of energy [37]. The development of e-micromobility might change the overall energy consumption in the mobility sector. The findings in Pittsburg indicated that the modal shift from conventional motorized modes of transport to e-micromobility for trips in the range of 5–8 km will decrease the energy demands of mobility by 50 percent [35]. The CO2 emissions of e-scooters are approximately between 125–131 g per passenger per km, including 50 percent from the manufacturing process and materials, and 43 percent from the collection process for overnight charging. Therefore, their lifespan has an important environmental impact, because of the considerable emissions involved in their production process [30,39,40].
Regarding safety issues and regulations, the benchmarks mentioned in this paper give city authorities and regional planners an insight into how the infrastructure of e-micromobility should be integrated into cities to assure the safety of the citizens.
This study provides an overview of the impacts of e-micromobility on urban transport in terms of four aspects, including impacts on current travel behaviors, energy consumption, the urban environment, safety issues, and the regulations required. However, it is advisable to investigate surplus energy demands in future research, considering that the energy demand will increase due to the modal shift from non-motorized transport to e-micromobility vehicles. Another future research suggestion is to investigate the impacts of land use parameters and urban forms on citizens’ propensity to use e-micromobility vehicles, as well as the impact of population density on mode choice.

Author Contributions

Conceptualization, H.M. and B.Ş.; methodology, B.Ş. and H.M.; formal analysis, B.Ş. and H.M.; data curation, B.Ş.; writing—original draft preparation, B.Ş. and H.M.; writing—review and editing, B.Ş. and H.M.; visualization, B.Ş.; supervision, H.M. Both authors have read and agreed to the published version of the manuscript.

Funding

This research received no external funding.

Institutional Review Board Statement

Not applicable.

Informed Consent Statement

Not applicable.

Data Availability Statement

Not applicable.

Acknowledgments

We acknowledge support by the German Research Foundation and the Open Access Publication Fund of Technical University of Berlin.

Conflicts of Interest

The authors declare no conflict of interest.

References

  1. International Energy Agency (IEA). Tracking Transport 2020 Report. 2020. Available online: https://www.iea.org/topics/transport (accessed on 20 December 2020).
  2. U.S. Energy Information Administration. Use of Energy Explained: Energy Use for Transportation. 2020. Available online: https://www.eia.gov/energyexplained/use-of-energy/transportation.php (accessed on 20 December 2020).
  3. EEA. Annual European Union Greenhouse Gas Inventory 1990–2016 and Inventory Report 2018. Submission to the UNFCCC Secretariat, European Environment Agency. 2018. Available online: https://www.eea.europa.eu/publications/european-union-greenhouse-gas-inventory-2018/at_download/file (accessed on 20 December 2020).
  4. European Union. Innovation. “Communication from the Commission to the European Parliament, the Council, the European Economic and Social Committee and the Committee of the Regions.” A New Skills Agenda for Europe; European Commission: Brussels, Belgium, 2014. [Google Scholar]
  5. Baptista, P.C.; Azevedo, I.L.; Farias, T.L. ICT Solutions in Transportation Systems: Estimating the Benefits and Environmental Impacts in the Lisbon. Procedia Soc. Behav. Sci. 2012, 54, 716–725. [Google Scholar] [CrossRef] [Green Version]
  6. Chang, A.; Miranda-Moreno, L.; Clewlow, R.; Sun, L. TREND OR FAD? Deciphering the Enablers of Micromobility in the U.S.; SAE International: Warrendale, PA, USA, 2019. [Google Scholar]
  7. Micromobility. Available online: https://en.wikipedia.org/wiki/Micromobility#:~:text=Micromobility%20refers%20to%20a%20range,pedal%20assisted%20(pedelec)%20bicycles (accessed on 21 February 2021).
  8. Micromobility: Where It’s Come from and Where It’s Going. Available online: https://www2.deloitte.com/us/en/insights/focus/future-of-mobility/micro-mobility-is-the-future-of-urban-transportation.html (accessed on 21 February 2021).
  9. Boglietti, S.; Barabino, B.; Maternini, G. Survey on e-Powered Micro Personal Mobility Vehicles: Exploring Current Issues towards Future Developments. Sustainability 2021, 13, 3692. [Google Scholar] [CrossRef]
  10. O’Hern, S.; Estgfaeller, N. A Scientometric Review of Powered Micromobility. Sustainability 2020, 12, 9505. [Google Scholar] [CrossRef]
  11. Heineke, K.; Kloss, B.; Darius, S.; Weig, F. Micromobility’s 15,000-mile Checkup. McKinsey & Company. 2019. Available online: https://www.mckinsey.com/industries/automotive-and-assembly/our-insights/micromobilitys-15000-mile-checkup (accessed on 2 January 2021).
  12. Heineke, K.; Kloss, B.; Darius, S.; Scurtu, D. Micromobility: Industry Progress, and a Closer Look at the CASE of Munich. McKinsey & Company. 2019. Available online: https://www.mckinsey.com/industries/automotive-and-assembly/our-insights/micromobility-industry-progress-and-a-closer-look-at-the-case-of-munich (accessed on 2 January 2021).
  13. City of Chicago. E-Scooter Pilot Evaluation; City of Chicago: Chicago, IL, USA, 2020.
  14. Leger, S.; McLaughlin, D.; Tracksdorf, K. Leading the Charge on the Canadian E-bike Integration: A Discussion on the Emerging & Unchartered Role of Micromobility; WSP Global: Monteral, QC, Canada, 2018. [Google Scholar]
  15. Reck, D.; Guidon, S.; Haitao, H.; Axhausen, K. Explaining shared micromobility usage, competition and mode choice by modelling empirical data from Zurich, Switzerland. ETH Zurich 2020. [Google Scholar] [CrossRef]
  16. Hardt, C.; Bogenberger, K. Usage of E-scooters in Urban Environments. Transp. Res. Procedia 2019, 37, 155–162. [Google Scholar] [CrossRef]
  17. McKenzie, G. Urban mobility in the sharing economy: A spatiotemporal comparison of shared mobility services. Comput. Environ. Urban Syst. 2020, 79, 101418. [Google Scholar] [CrossRef]
  18. Fyhri, A.; Fearnley, N. Effects of e-bikes on bicycle use and mode share. Transp. Res. Part D Transp. Environ. 2015, 36, 45–52. [Google Scholar] [CrossRef] [Green Version]
  19. Heineke, K.; Kloss, B.; Darius, S. The Future of Micromobility: Ridership and Revenue after a Crisis. McKinsey & Company. 2020. Available online: https://www.mckinsey.com/industries/automotive-and-assembly/our-insights/the-future-of-micromobility-ridership-and-revenue-after-a-crisis (accessed on 2 January 2021).
  20. Cherry, C.; Yang, H.; Jones, L.; He, M. Dynamics of electric bike ownership and use in Kunming, China. Transp. Policy 2016, 45, 127–135. [Google Scholar] [CrossRef] [Green Version]
  21. Castro, A.; Gaupp-Berghausen, M.; Dons, E.; Standaert, A.; Laeremans, M.; Clark, A.; Anaya-Boig, E.; Cole-Hunter, T.; Avila-Palencia, I.; Rojas-Rueda, D.; et al. Physical activity of electric bicycle users compared to conventional bicycle users and non-cyclists: Insights based on health and transport data from and online survey in seven European cities. Transp. Res. Interdiscip. Perspect. 2019, 1. [Google Scholar] [CrossRef]
  22. Li, A.; Zhao, P.; He, H.; Axhausen, K. Understanding the variations of micro-mobility behavior before and during COVID-19 pandemic period. ETH Zur. Res. Collect. 2020. [Google Scholar] [CrossRef]
  23. Pimentel, R.; Lowry, M. If You Provide, Will They Ride? Motivators and Deterrents to Shared Micro-Mobility. Pacific Northwest Transportation Consortium; USDOT University Transportation Center for Federal Region 10, University of Washington: Seattle, WA, USA, 2020. [Google Scholar]
  24. Cairns, S.; Behrendt, F.; Raffo, D.; Beaumont, C.; Kiefer, C. Electrically Assisted Bikes: Potential Impacts on Travel Behaviour. Transp. Res. Part A 2017, 103, 327–342. [Google Scholar] [CrossRef] [Green Version]
  25. Mostofi, H.; Masoumi, H.; Dienel, H.-L. The Association between Regular Use of Ridesourcing and Walking Mode Choice in Cairo and Tehran. Sustainability 2020, 12, 5623. [Google Scholar] [CrossRef]
  26. Mostofi, H.; Masoumi, H.; Dienel, H.-L. The Relationship between Regular Use of Ridesourcing and Frequency of Public Transport Use in the MENA Region (Tehran and Cairo). Sustainability 2020, 12, 8134. [Google Scholar] [CrossRef]
  27. Mostofi, H.; Masoumi, H.; Dienel, H.-L. The Association between the Regular Use of ICT Based Mobility Services and the Bicycle Mode Choice in Tehran and Cairo. Int. J. Environ. Res. Public Health 2020, 17, 8767. [Google Scholar] [CrossRef] [PubMed]
  28. Samaha, A.; Mostofi, H. Predicting the Likelihood of Using Car-Sharing in the Greater Cairo Metropolitan Area. Urban Sci. 2020, 4, 61. [Google Scholar] [CrossRef]
  29. Agora Verkehrswende. Shared E-Scooters: Paving the Road Ahead, Policy. In Recommendations for Local Government; Agora Verkehrswende: Berlin, Germany, 2019. [Google Scholar]
  30. Hollingsworth, J.; Copeland, B.; Johnson, J. Are e-scooters polluters? The environmental impacts of shared dockless electric scooters. Environ. Res. Lett. 2019, 14. [Google Scholar] [CrossRef]
  31. Fernando, V. How Electric Scooters Will Revolutionise Southeast Asia’s Congested Cities. Available online: https://e27.co/how-electric-scooters-will-revolutionise-southeast-asias-congested-cities-20190625/ (accessed on 10 January 2021).
  32. Campisi, T.; Akgün, N.; Tesoriere, G. An Ordered Logit Model for Predicting the Willingness of Renting Micro Mobility in Urban Shared Streets: A Case Study in Palermo, Italy. ICCSA 2020, 796–808. [Google Scholar] [CrossRef]
  33. Unhabitat, Sustainbale Development Goals. Available online: https://unhabitat.org/about-us/sustainable-development-goals (accessed on 10 January 2021).
  34. Martínez-Navarro, A.; Cloquell-Ballester, V.; Segui-Chilet, S. Photovoltaic Electric Scooter Charger Dock for the Development of Sustainable. IEEE Access 2020, 8, 169486–169495. [Google Scholar] [CrossRef]
  35. Bedmutha, N.; Petkar, G.; Lin, H.; Nema, T. Shared Electric Micro-Mobility Solutions Could Offset 50% of Transportation Energy Demand for Pittsburgh Energy Science, Technology and Policy; Carnegie Mellon University: Pittsburgh, PA, USA, 2020. [Google Scholar]
  36. Brdulak, A.; Chaberek, G.; Jagodzinski, J. Determination of Electricity Demand by Personal Light Electric Vehicles (PLEVs): An Example of e-Motor Scooters in the Context of Large City. Energies 2020, 13, 194. [Google Scholar] [CrossRef] [Green Version]
  37. Let’s Count the Ways E-Scooters Could Save the City. Available online: https://www.wired.com/story/e-scooter-micromobility-infographics-cost-emissions/ (accessed on 20 December 2020).
  38. Severengiz, S.; Finke, S.; Schelte, N.; Forrister, H. Assessing the environmental impact of novel mobility services using shared electric scooters as an example. Procedia Manuf. 2020, 43, 80–87. [Google Scholar] [CrossRef]
  39. Moreau, H.; de Jamblinne de Meux, L.; Zeller, V.; D’Ans, P.; Ruwet, C.; Achten, W. Dockless E-Scooter: A Green Solution for Mobility? Comparative Case Study between Dockless E-Scooters, Displaced Transport, and Personal E-Scooters Management in Poland. Sustainability 2020, 12, 1803. [Google Scholar] [CrossRef] [Green Version]
  40. The 7 Myths about e-Scooters. Available online: https://www.tier.app/the-7-myths-about-e-scooters/ (accessed on 15 January 2021).
  41. Trivedi, T.; Liu, C.; Antonio, A.; Wheaton, N.; Kreger, V.; Yap, A.; Schriger, D.; Elmore, J. Injuries associated with standing electric scooter use. JAMA Netw Open. 2019, 2. [Google Scholar] [CrossRef]
  42. Feng, Y.; Zhong, D.; Sun, P.; Zheng, W.; Cao, Q.; Luo, X.; Lu, Z. Micromobility in Smart Cities: A Closer Look at Shared Dockless E-Scooters via Big Social Data. arXiv 2020, arXiv:2010.15203. [Google Scholar]
  43. Rayaprolu, S.; McCarthy, L.; Gifford, J. Regulatory Harmonization and Collaborative Governance: Exploring 1 the SharedMicromobility Policy Practices for Post-Pandemic Deployment. 2020. Available online: https://ssrn.com/abstract=3680073 (accessed on 10 January 2021).
  44. Bielinski, T.; Wazna, A. Electric Scooter Sharing and Bike Sharing Use Behaviour and Characteristics. Sustainability 2020, 12, 9640. [Google Scholar] [CrossRef]
  45. Pimentel, D.; Lowry, M.; Koglin, T.; Pimentel, R. Innovation in a Legal Vacuum: The Uncertain Legal Landscape for Shared Micro-Mobility. J. Law Mobil. 2020, 2020. [Google Scholar] [CrossRef]
  46. Bryant, A. Usain Bolt Brings His E-Scooters to Japan. Available online: https://learningenglish.voanews.com/a/usain-bolt-brings-his-e-scooters-to-japan/5173967.html (accessed on 10 January 2021).
  47. Intelligent Transport, E-Scooters Begin Rollout across Five Districts in Dubai. Available online: https://www.intelligenttransport.com/transport-news/110604/e-scooters-begin-rollout-across-five-districts-in-dubai/ (accessed on 4 January 2021).
  48. Mathew, J.; Liu, M.; Seeder, S.; Li, H.; Bullock, D. Analysis of E-Scooter Trips and Their Temporal Usage Patterns. ITE J. 2019, 89, 44–49. [Google Scholar]
  49. Johnston, K.; Oakley, D.; Durham, A.; Bass, C.; Kershner, S. Regulating Micromobility: Examining Transportation Equity and Access. J. Comp. Urban Law Policy 2020, 4, 685–723. Available online: https://readingroom.law.gsu.edu/jculp/vol4/iss1/35 (accessed on 10 January 2021).
  50. Dixon, S.; Bornstein, J.; Pankratz, D. Urban Transport—Cities Rethink the Basics; The 2020 Deloitte City Mobility Index; Deloitte: London, UK, 2020. [Google Scholar]
  51. Tier’s Lessons from the World’s Scooter Capital. Available online: https://sifted.eu/articles/tier-scooters-paris/#:~:text=In%20July%2C%20following%20a%20tightly,5%2C000%20scooters%20in%20the%20city (accessed on 15 January 2021).
  52. Mostofi, H. The Association between ICT-Based Mobility Services and Sustainable Mobility Behaviors of New Yorkers. Energies 2021, 14, 3064. [Google Scholar] [CrossRef]
Figure 1. Organization of the study.
Applsci 11 05851 g001
Figure 2. Systematic review scheme.
Applsci 11 05851 g002
Figure 3. Average daily distance traveled on e-scooters (km). a Spin, b Skip, c Lyft, d Lime, e Bird.
Applsci 11 05851 g003
Figure 4. Average daily duration of use of e-scooters (minutes). a Spin, b Skip, c Lyft, d Lime, e Bird.
Applsci 11 05851 g004
Figure 5. Average daily distance traveled on e-bikes (km). a Jump.
Applsci 11 05851 g005
Figure 6. Average daily duration of use of e-bikes (minutes). a Jump.
Applsci 11 05851 g006
Figure 7. Purposes for using e-scooters. a San Francisco, b Austin, c Portland.
Applsci 11 05851 g007
Figure 8. Purposes for using e-bikes.
Applsci 11 05851 g008
Figure 9. Modal shift to e-scooter usage. a San Francisco, b Denver, c Portland, d San Francisco, e Portland (Visitors/Tourists), f Portland (Locals), g France.
Applsci 11 05851 g009
Figure 10. Energy consumption of e-scooters (kWh/km).
Applsci 11 05851 g010
Figure 11. Environmental impact of e-scooters (g CO2-eq/passenger-km).
Applsci 11 05851 g011
Table 1. Literature review regarding average trips per day.
SourceLiterature Review Regarding Average Trips per Day (the Results Were Acquired by Dividing the Total Amount of Trips by the Days of the Research Period.)
Bielinski and Wazna (2020)168,300 trips were made per day with an electric bike-sharing system of 4080 vehicles in Tricity, Poland.
Castro et al. (2019)A survey conducted in seven European cities (PASTA project) with 204 people reported that the average number of trips per day with e-bikes was 0.8.
Chery et al. (2016)The number of e-bike trips in 2008 was reported as 1.16, in 2011 it was reported as 1.05, and in 2012 it was reported as 1.03 per day in Kunming, China.
City of Chicago, Pilot Evaluation (2020)According to the information that e-scooter companies provided, an average of 6846 trips per day were made with e-scooters in Chicago, USA.
Feng et al. (2020)It was reported that 105,479 e-scooter trips were made per day in the USA (according to The National Association of City Transportation Officials (NACTO)).
Fyhri and Fearnley (2015)The study conducted with 66 participants in Norway reported 1.4 e-bike trips per day.
Hardt and Bogenberger (2019)As a result of a pilot project with 6 vehicles and 38 participants in Munich, an average of 49 trips were made per day.
Li et al. (2020)In Zurich, Switzerland, according to the provided data, 465 trips per day were made with docked e-bikes in a normal period, which covered 15 February to 14 March, 2020. During COVID-19 (15 March to 14 April 2020), 299 trips per day were made. For dockless e-bikes, 241 trips per day were made in the normal period, and 102 trips per day during COVID-19. For dockless e-scooters, 60 trips per day were made in the normal period, and 50 trips per day during COVID-19 (for each of the three types of micromobility services, trip data were collected from three operators: Publibike, Bond, and Bird)
Mathew et al. (2019)In Indianapolis, 4830 e-scooters trips were made per day.
McKenzie (2019)According to the collected data, Bird reported 170 trips per day, Lime reported 214 per day, Lyft reported 835 trips per day, Skip reported 1487 trips per day, reported has 115 trips per day, and Jump e-bikes reported 325 trips per day, which led to a total of 2821 e-scooter trips per day, in Washington, USA (the results were obtained by dividing the total amount of trips over the 4-month research period).
Reck et al. (2020)This study, based on Zurich, Switzerland, reported approximately 2800 trips per day, 1181 docked e-bike trips, 419 docked bike trips, 244 dockless e-bike trips, and 1032 dockless e-scooter trips.
Table 2. Literature review about regulations.
SourceLiterature Review about Regulations
Bielinski and Wazna (2020)In Poland, the speed limit is designated as a maximum of 25 km/h for shared e-scooters.
Campisi et al. (2020)In Italy, the use of micromobility vehicles is limited by the need for a license to rent vehicles, certain age groups, and use at certain times of the day and certain places, and the speed of travel is regulated by rules.
City of Chicago, Pilot Evaluation (2020)In Chicago, the travel speed of e-micromobility vehicles is limited to 15 mph (approx. 24 km/h), and their use on pavements is prohibited; they must be used on bicycle paths, but as an exception, children under 12 years of age can use them on the pavement. The age restriction for the use of shared electric scooters is designated as 18. People over 16 years old can ride with a guardian.
Feng et al. (2020)Based on ten cities in the USA, users are required to wear protective gear such as a helmet when using e-scooters. Stickers or lights should be used to make the vehicles visible during night rides. Drivers should not use electronic devices while driving, nor should more than one person use a vehicle unless it is not specifically designed for more than one person. E-scooters can be used on bike paths or on the sidewalk with speeds of 15 mph (approx. 25 km/h) and cannot be parked in car parks or parked in a way that prevents pedestrians.
Leger et al. (2018)In British Colombia, the age limit is 6+, max speed is 32 km/h, in most regions there is no need for licenses or registration, but a helmet is required. In Alberta, the age limit is 12+, the helmet is required in most regions; in Manitoba and Quebec the age limit is 14+.
Pimentel et al. (2020)The study states that the main problem is inconsistencies in the law. For instance, in Oregon, e-scooters are prohibited from use on the pavement, and the speed limit is 25 km per hour (approx. 15 mile/h), although by law, micromobility vehicles are also prohibited from traveling at a slower speed than the speed of traffic, i.e., if traffic flows at 25 mph, the e-scooter should not travel more slowly than 40 km. In West Hollywood, California, e-bikes are prohibited from driving on the sidewalk. In King County, Washington, wearing a helmet is mandatory but not mandatory in other parts of the state. When an e-micromobility user enters a different district, the age restriction application may change. Helmets are not compulsory when using e-bikes and e-scooters in more than 20 states, although 6 states have required helmets for e-bike users.
Publisher’s Note: MDPI stays neutral with regard to jurisdictional claims in published maps and institutional affiliations.

