Article

Heat Transfer Correlations for Star-Shaped Fins

1
Technical Department, University of Slavonski Brod, Trg Ivane Brlić Mažuranić 2, 35000 Slavonski Brod, Croatia
2
Department of Mechanical Engineering, University North, 104. Brigade 3, 42000 Varaždin, Croatia
3
Faculty of Mechanical Engineering, University of Novo Mesto, Na Loko 2, 8000 Novo Mesto, Slovenia
4
Institute for Renewable Energy and Efficient Exergy Use, Cesta 2. Grupe Odredov 17, 1295 Ivančna Gorica, Slovenia
5
Mechanical Engineering Faculty, University of Slavonski Brod, Trg Ivane Brlić Mažuranić 2, 35000 Slavonski Brod, Croatia
*
Author to whom correspondence should be addressed.
Appl. Sci. 2021, 11(13), 5912; https://doi.org/10.3390/app11135912
Submission received: 26 May 2021 / Revised: 15 June 2021 / Accepted: 22 June 2021 / Published: 25 June 2021

Abstract

:
Star-shaped fins are a newer type of fin for which correlations for heat transfer and pressure drop do not yet exist in the literature. Therefore, correlation equations for air-side heat transfer and pressure drop in a finned heat exchanger with star-shaped stainless-steel fins in staggered arrangement were developed in this work. To obtain these correlations, a numerical analysis of the basic heat exchanger geometry and another 21 variants of heat exchanger geometry was performed using computational fluid dynamics, and then the results of laboratory tests of a model of heat exchangers with star-shaped fins were used. In the numerical analysis, the fin pitch, the fin thickness, and the air velocity at the inlet to the heat exchanger were varied. The Nusselt (Nu) and Euler (Eu) numbers were determined for each variation analyzed. Initial correlations for Nu and Eu were derived using the least-squares deviation method. The correlation coefficients thus obtained were adjusted to agree with the results of the laboratory tests. The deviation of the final obtained correlation for Nu from the experimental test results was up to 10% in the range of Re < 3500, whereas for higher values of Re, the deviation was less than 2%. The Eu correlation deviated from experimental results up to 19% in the range of Re < 4000, whereas in the range of Re > 5600, the deviation was less than 1%. The correlations were valid in the range 2000 < Re < 16,000.

1. Introduction

When designing a heat exchanger, it is necessary to calculate the heat exchange area. Usually, fins of various shapes are used to enlarge the heat exchange area. The size of these areas depends on the heat transfer coefficient, which in turn depends on the geometry of the finned area and the flow conditions of the working fluid that occur around these areas. Correlations for the dimensionless feature Nu can be found in the literature for different types of fins. The influence of fin surface geometry on heat transfer was investigated in order to achieve the highest possible heat transfer. Primarily, the effects of fin spacing, fin thickness, fin height, tube diameter, and tube arrangement on heat transfer were analyzed. A brief overview of the research is given below.

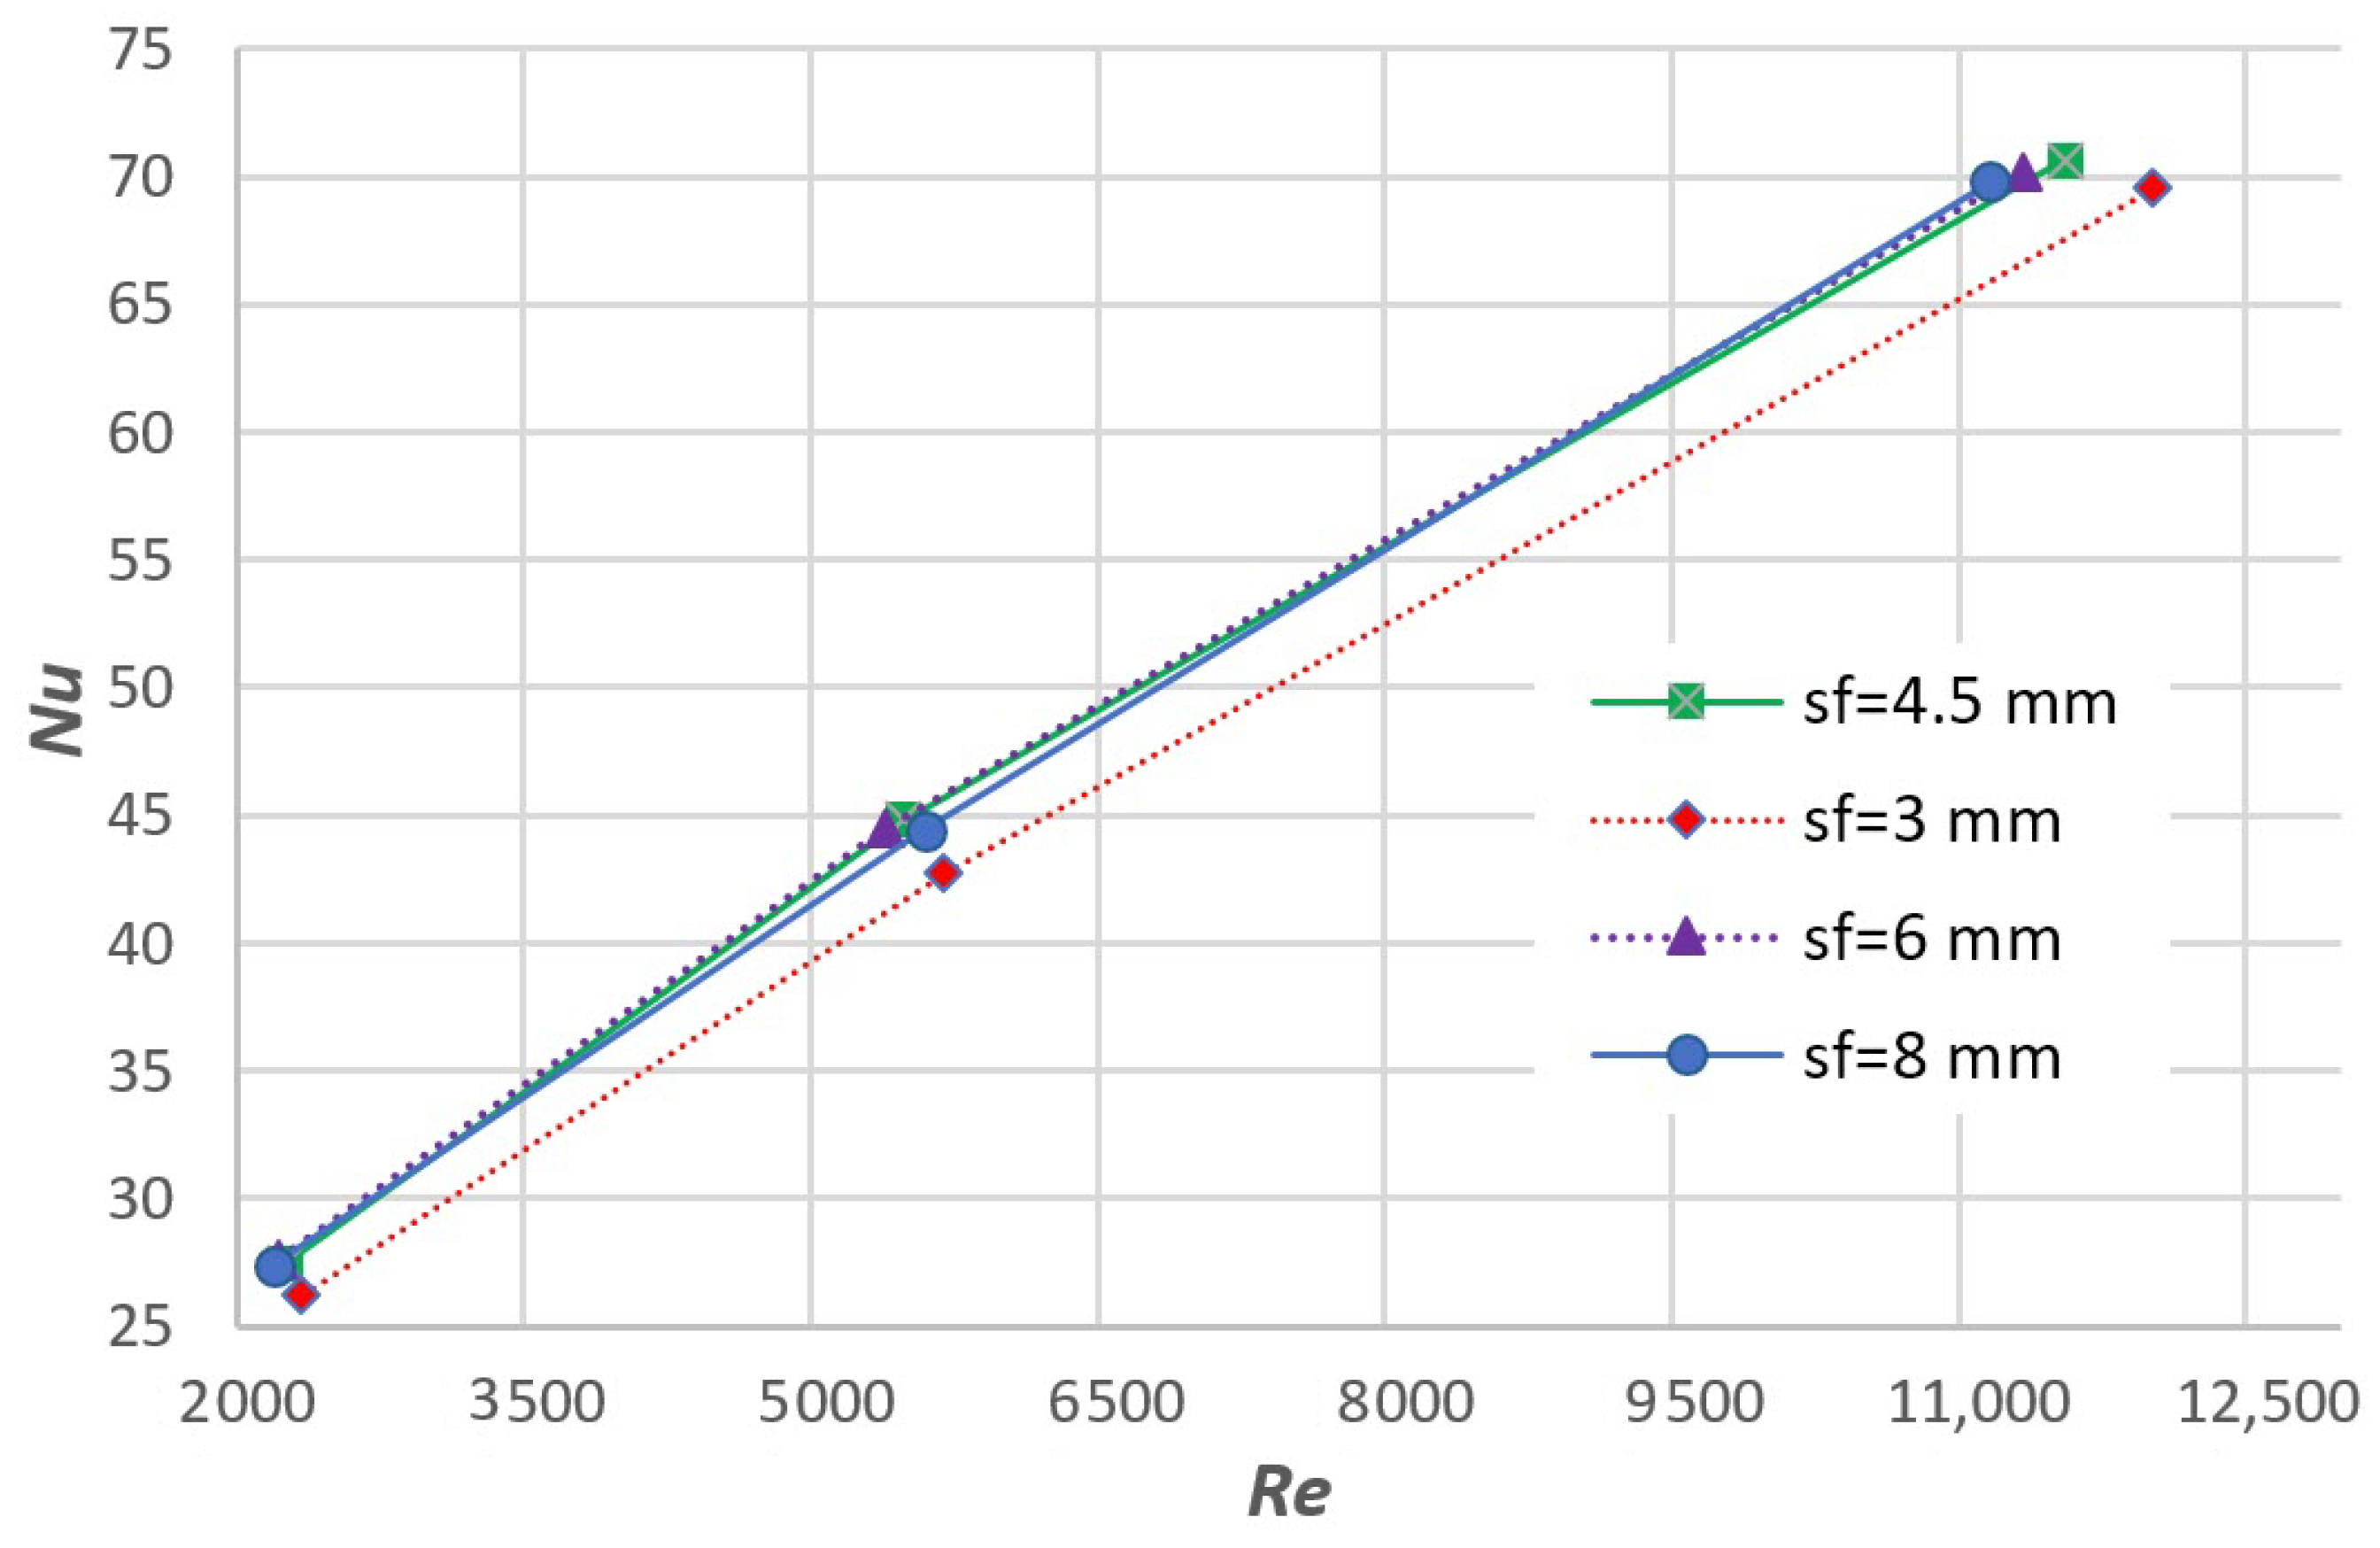
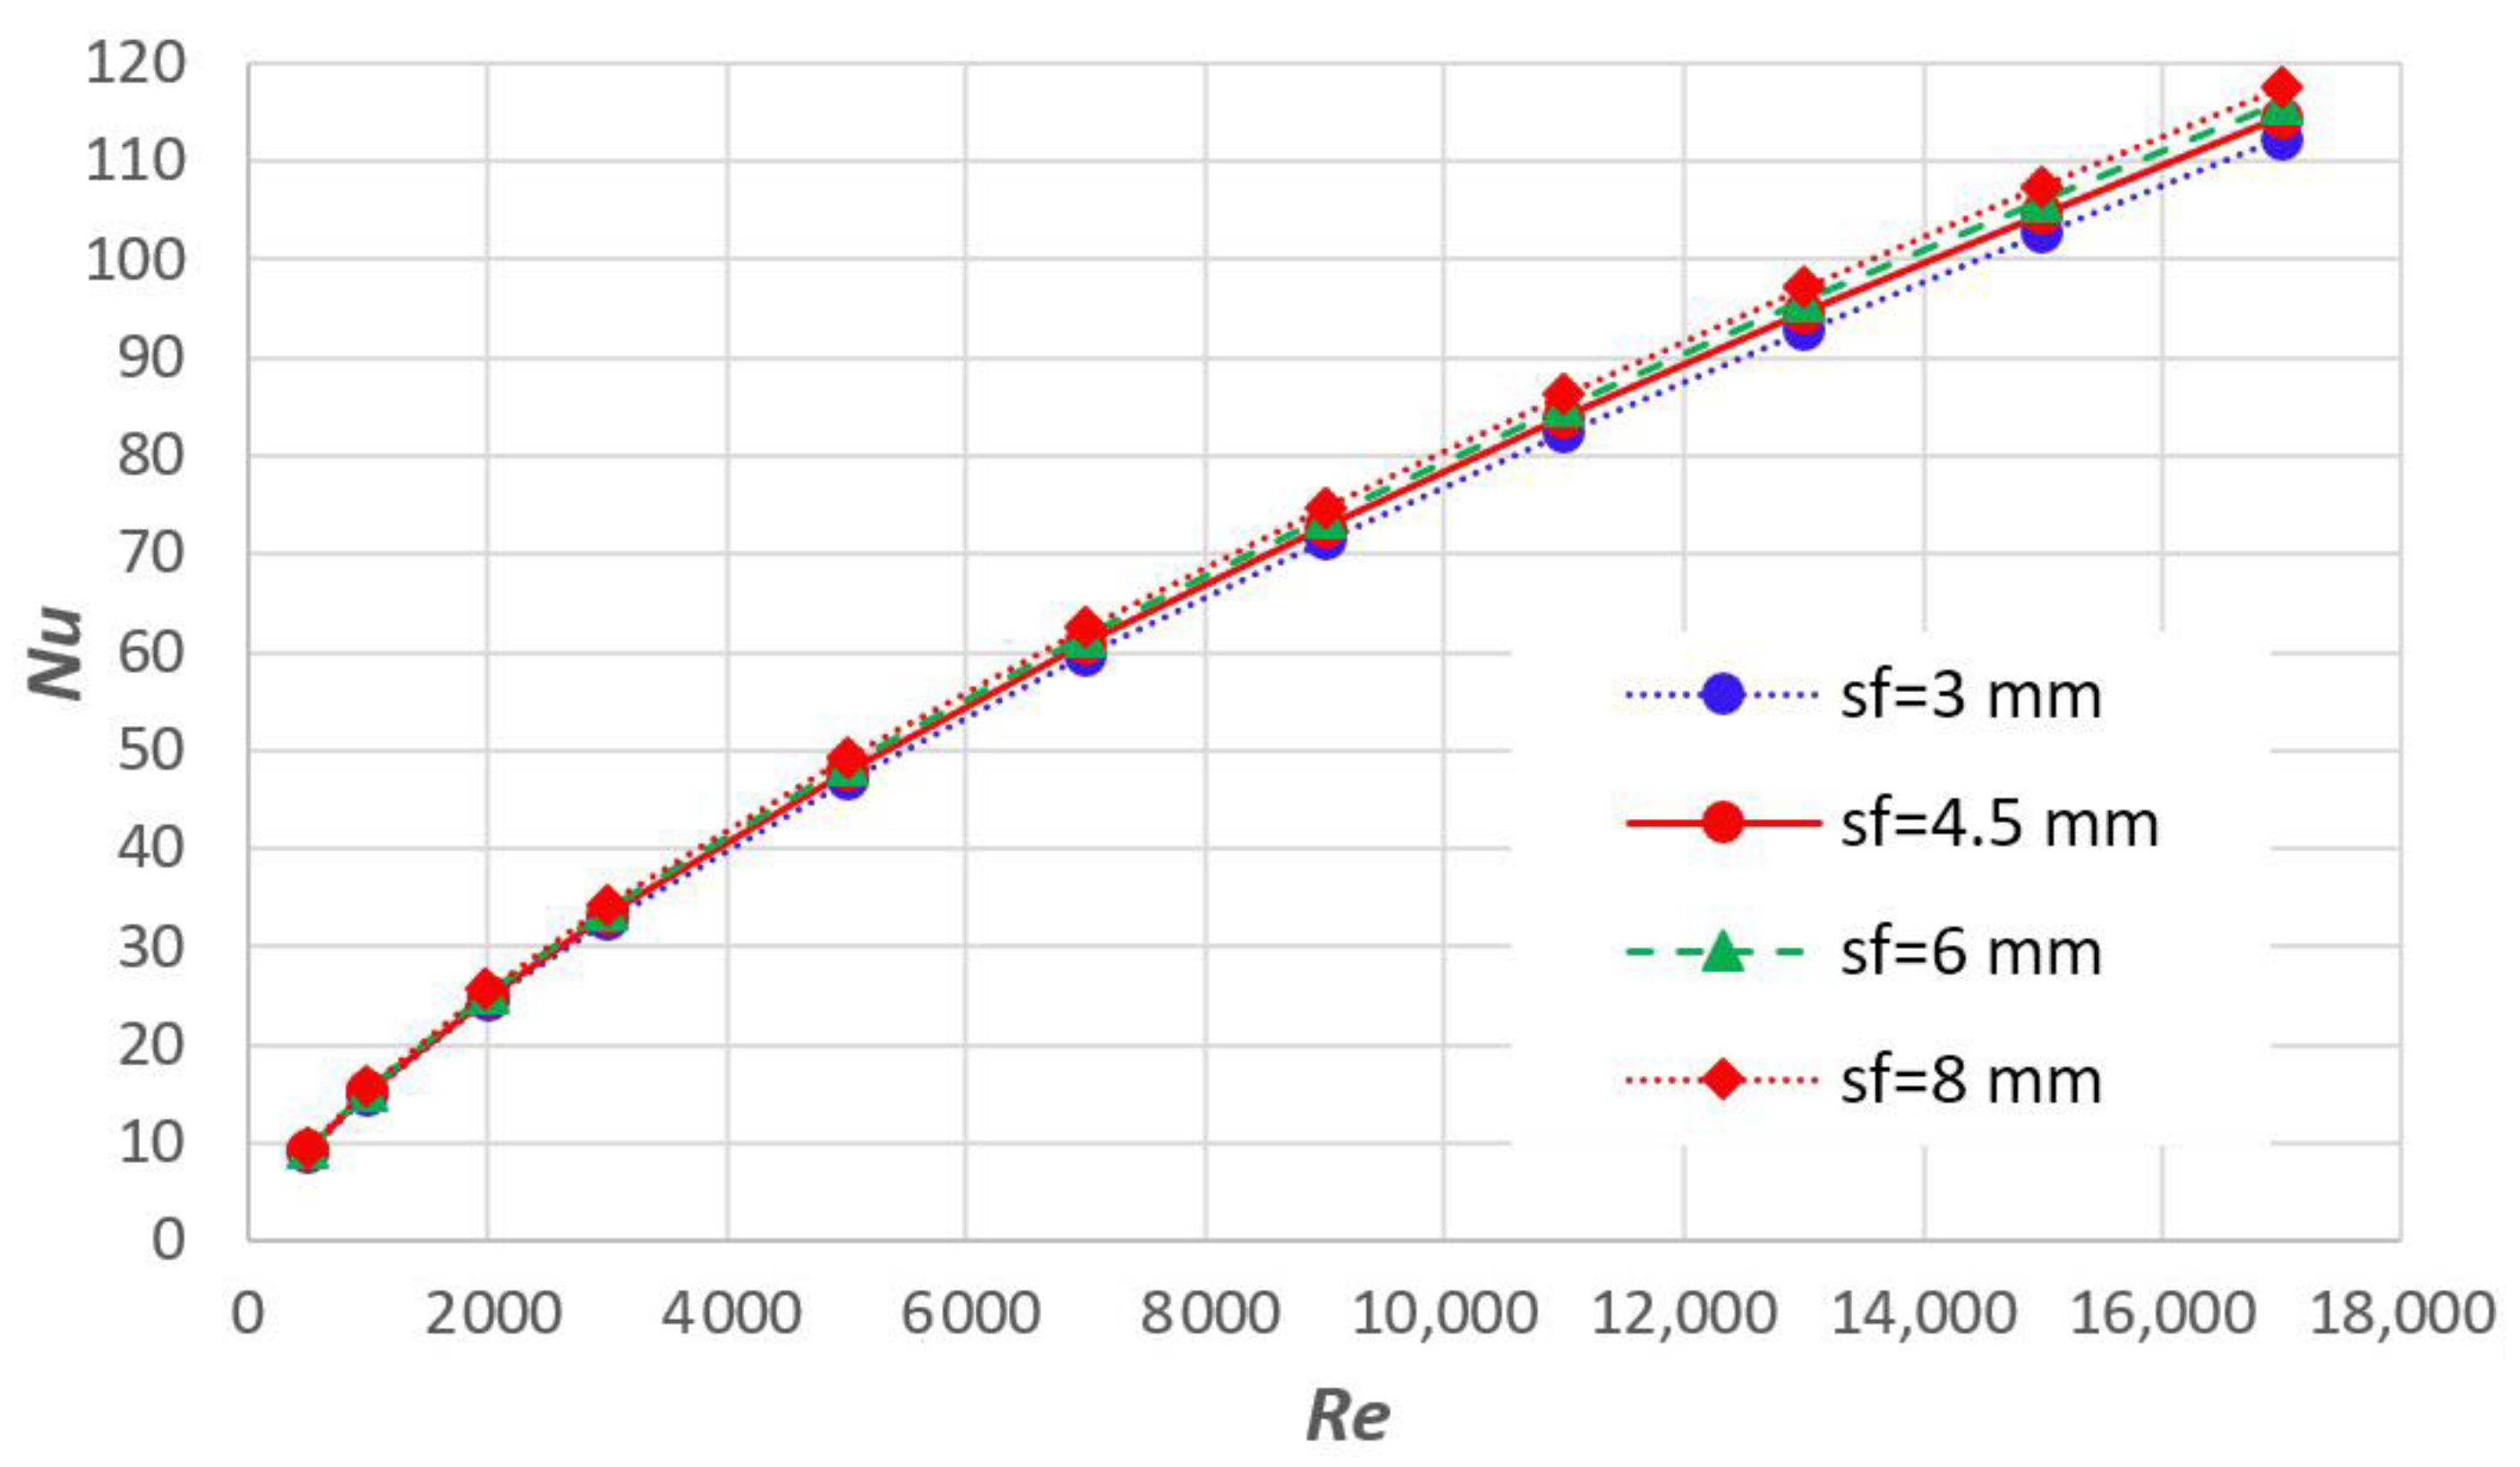
1.1. Influence of Fin Spacing

The proper choice of fin spacing has a significant effect on heat exchange on finned surfaces. The experimental results of a larger number of researchers [1,2,3,4,5,6] show that the heat transfer along the base surface of the fins is lower for a smaller spacing between fins because of the thicker boundary layer than for a larger spacing when the boundary layer is thinner. In general, a smaller gap between fins creates a thicker boundary layer. The stagnation zone along the fin root and the tube surface forms a laminar flow, and heat transfer is much lower in this area.
Žukauskas [7] concluded that the heat transfer increases when the fin pitch (sf) is increased to 6 mm (the gap between fins is 4.5 mm), and further increases in fin pitch do not increase the heat transfer for the range 48,000 < Re < 760,000. It is expected that the influence of fin pitch on the heat transfer coefficient decreases with an increasing Reynolds number. However, Rabas et al. [4] found that the heat transfer does not depend on the Reynolds number in the case of high fin density (0.98 fins/mm). A larger pressure drop and unfavorable conditions in terms of surface fouling occur when the distance between fins is smaller. Jameson [8] found that increasing the number of fins above 275.6 fins/m increases the pressure drop without increasing the heat transfer.
Watel et al. [9,10] defined the influence of the dimensionless tube diameter ratio (do) and fin pitch (sf) on heat transfer by the coefficient “m” in the correlation Nu = C Rem (C is constant). The exponent “m” decreased from 0.73 to 0.59 when the ratio do/sf increased from 0.034 to 0.103. When the do/sf ratio was greater than 0.241, the value of “m” was 0.55. The influence of the do/sf ratio on the heat transfer was more significant for small Reynolds numbers.
Briggs and Young [11] and Kuntysh and Lokhvedov [12] found in the analysis that the ratio of fin height (ht) and fin pitch (sf) was the most influential variable affecting both heat transfer coefficient and pressure drop. Briggs and Young provided heat transfer correlations that accounted for fin height, thickness and spacing, and fin root diameter.
Gianolio and Guti [13] modified the correlations of Briggs and Young and Schmidt [14] by adding a term that accounted for the number of rows of the tube bundle. They tested the heat exchanger with finned tubes in the staggered arrangement by changing the number of tube rows from one to six.
M. Lee, T. Kang, and Y. Kim [15] studied the heat transfer coefficient on the airside in a heat exchanger with spiral fins. The pitch of the fins ranged from 5.0 mm to 12.5 mm, and the number of rows of tubes also varied. When the tubes were staggered (two rows of tubes were tested), the heat transfer coefficient increased by approximately 27.3% as the fin pitch increased from 5.0 to 12.5 mm. They also indicated that the Colburn factor for the staggered tube arrangement is on average 11% higher and for the parallel tube arrangement 7.3% higher than for the parallel tube layout for the interval 400 < Re < 850, respectively.
The aim of Pongsoi and Wongwises’ [16] investigation was to determine the pitch of L-shaped fins spirally attached to a tube with an outer diameter of 16.35 mm to achieve the maximum performance of the heat exchanger. In the experiment, the fin pitches (2.4 mm, 3.2 mm, and 4.2 mm) were varied in the range of Reynolds numbers from 5000 to 15,000 (the characteristic length for calculating Re is the tube outer diameter). They concluded that the optimum fin pitch is 3.2 mm.
Mon and Gross [17] examined the influence of fin spacing in a tube bundle with four rows of tubes with circular fins. The experiment was carried out on a staggered and parallel tube arrangement using numerical analysis. The development of the boundary layer on fins and tubes depends mainly on the ratio of fin pitch and fin height (sf/hf). It was found that for the staggered tube layout the heat transfer increases with increasing sf/hf up to 0.32 and then remains almost constant. For a parallel tube arrangement, the heat transfer coefficient increases over the entire experimental range. The pressure drop decreases with an increasing sf/hf ratio.
Antufev and Gusev [1] found that the heat transfer coefficient decreases in the range of 0.4 < sf/hf < 0.57 when tested with 19 mm diameter tubes.
Kawaguchi et al. [18] studied the effects of fin pitches on pressure drops and the airside heat transfer of the tube with serrated fins.
Naess [19] experimentally investigated the effects of fin pitch and fin outer diameter on heat transfer and pressure drop characteristics for heat exchangers with serrated spiral fins in a staggered tube arrangement. He pointed out that the heat transfer increased with increasing fin pitch for the same Reynolds number.

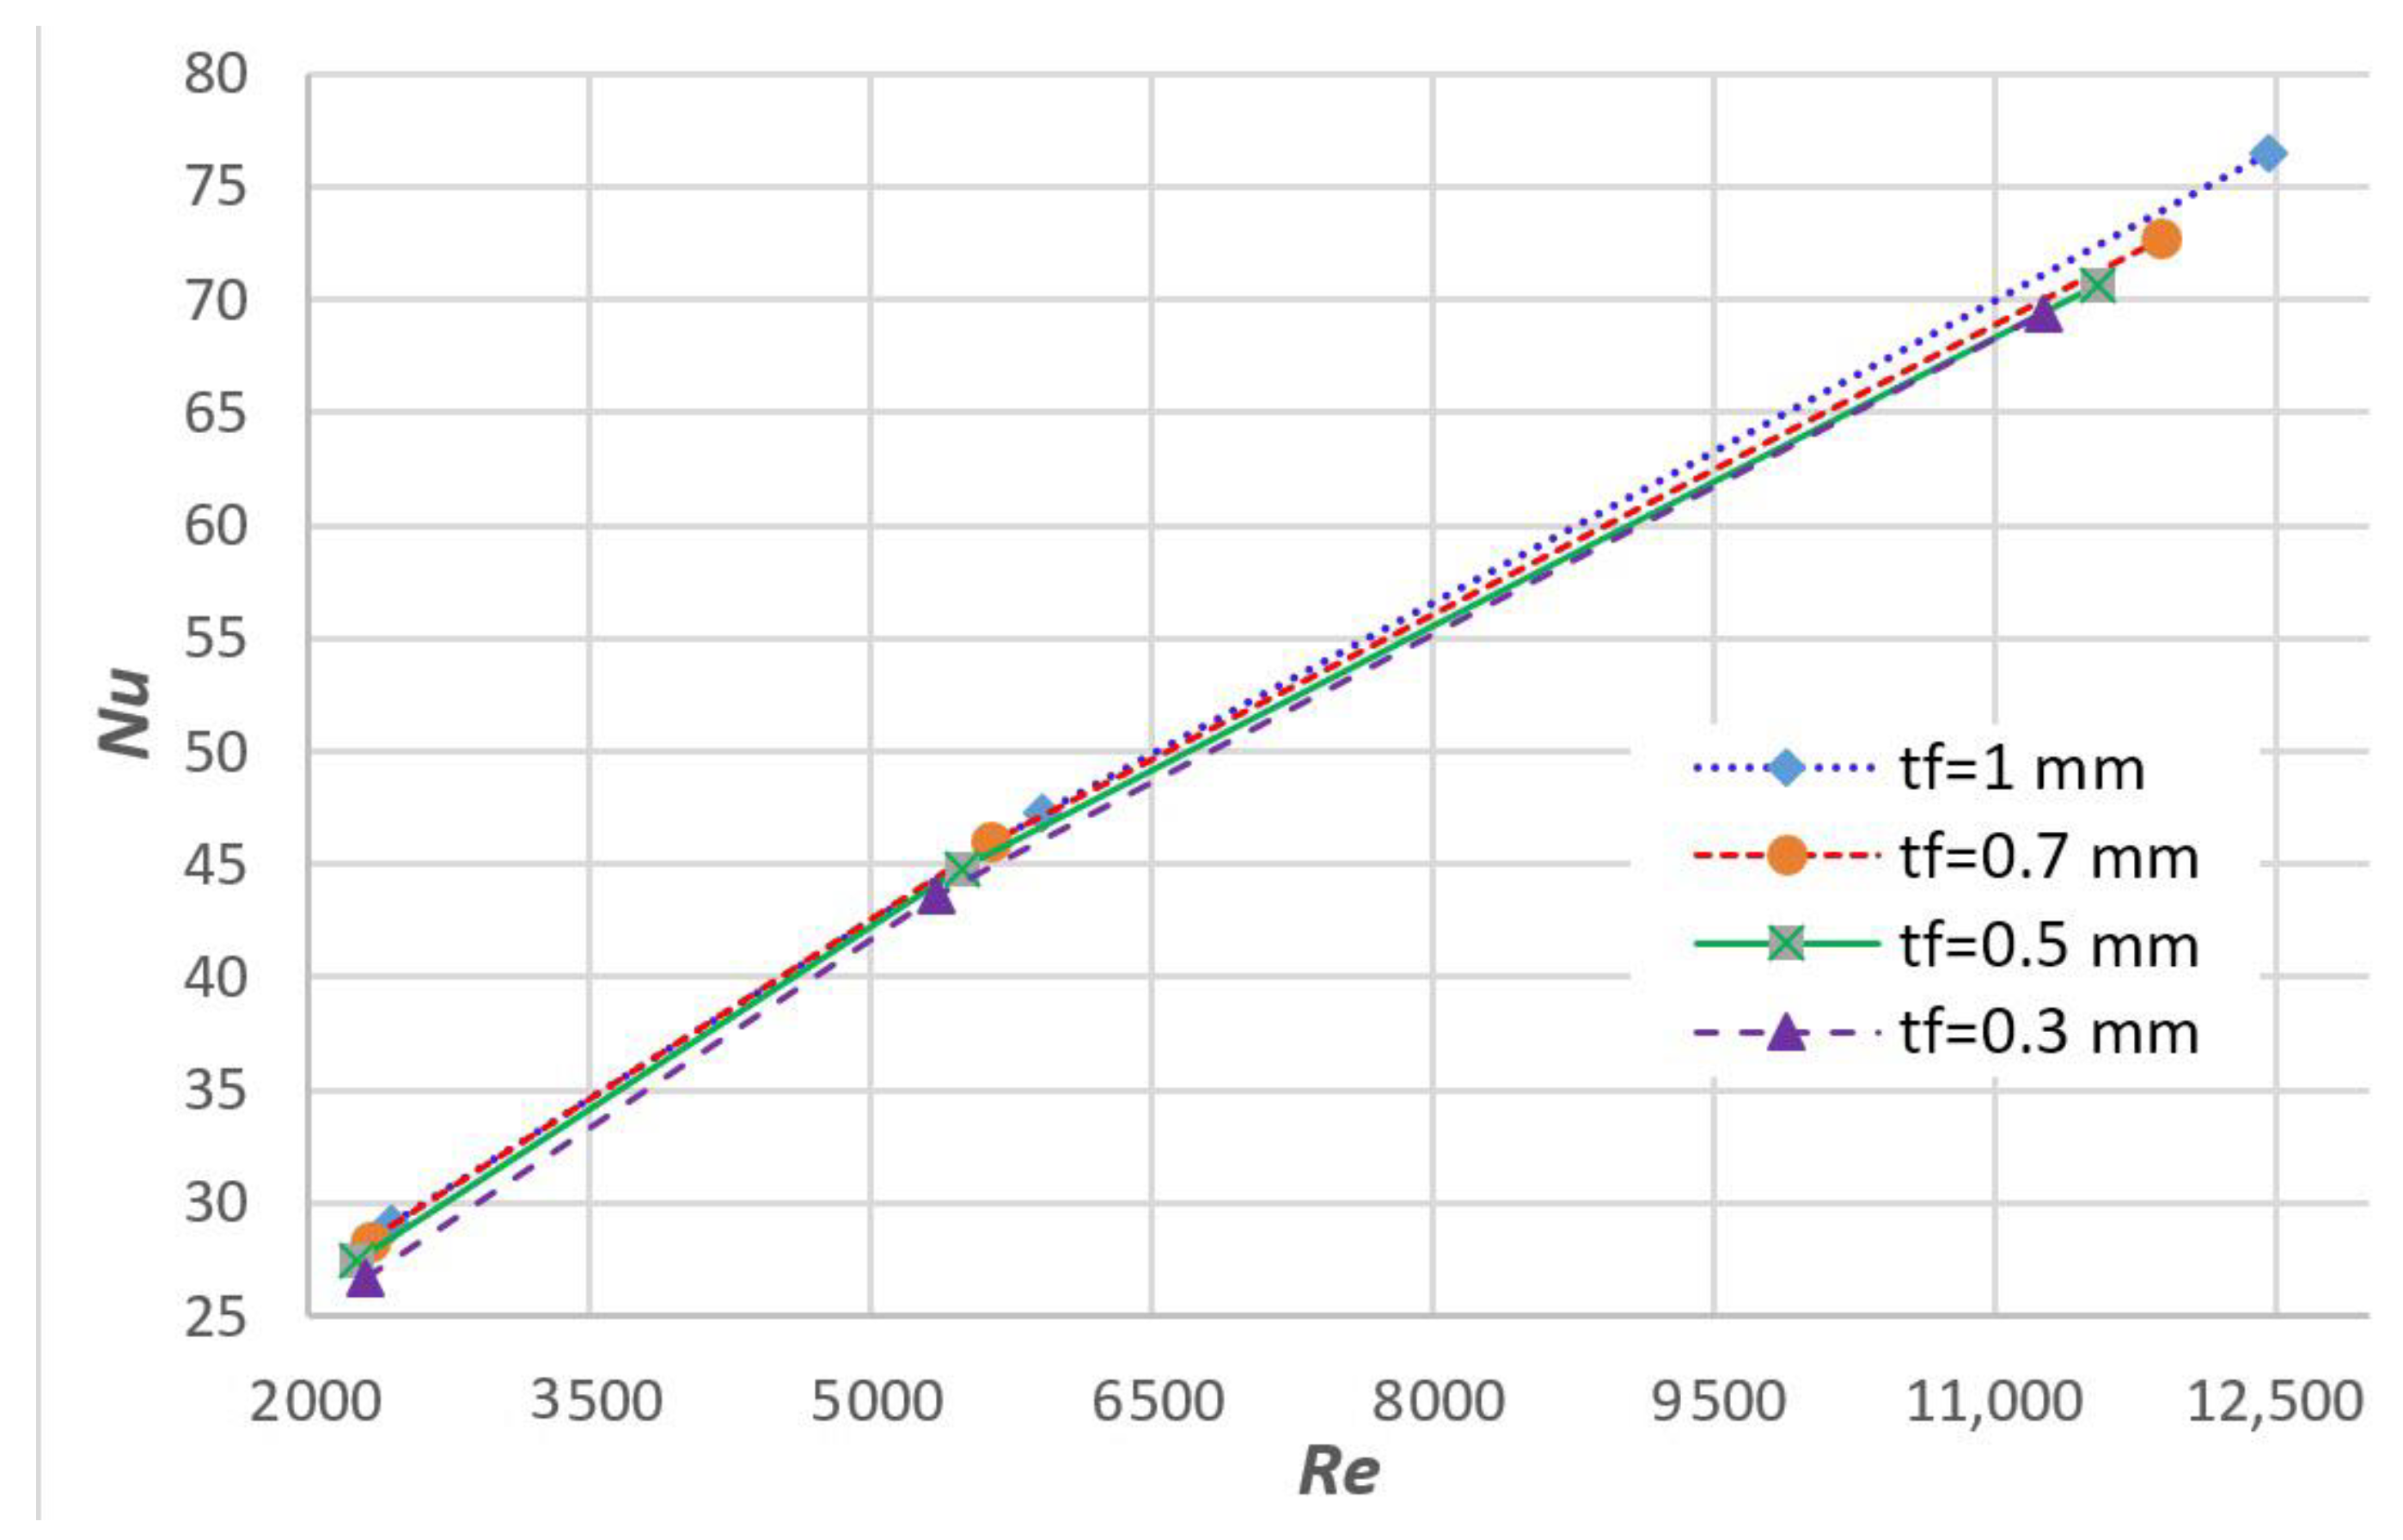
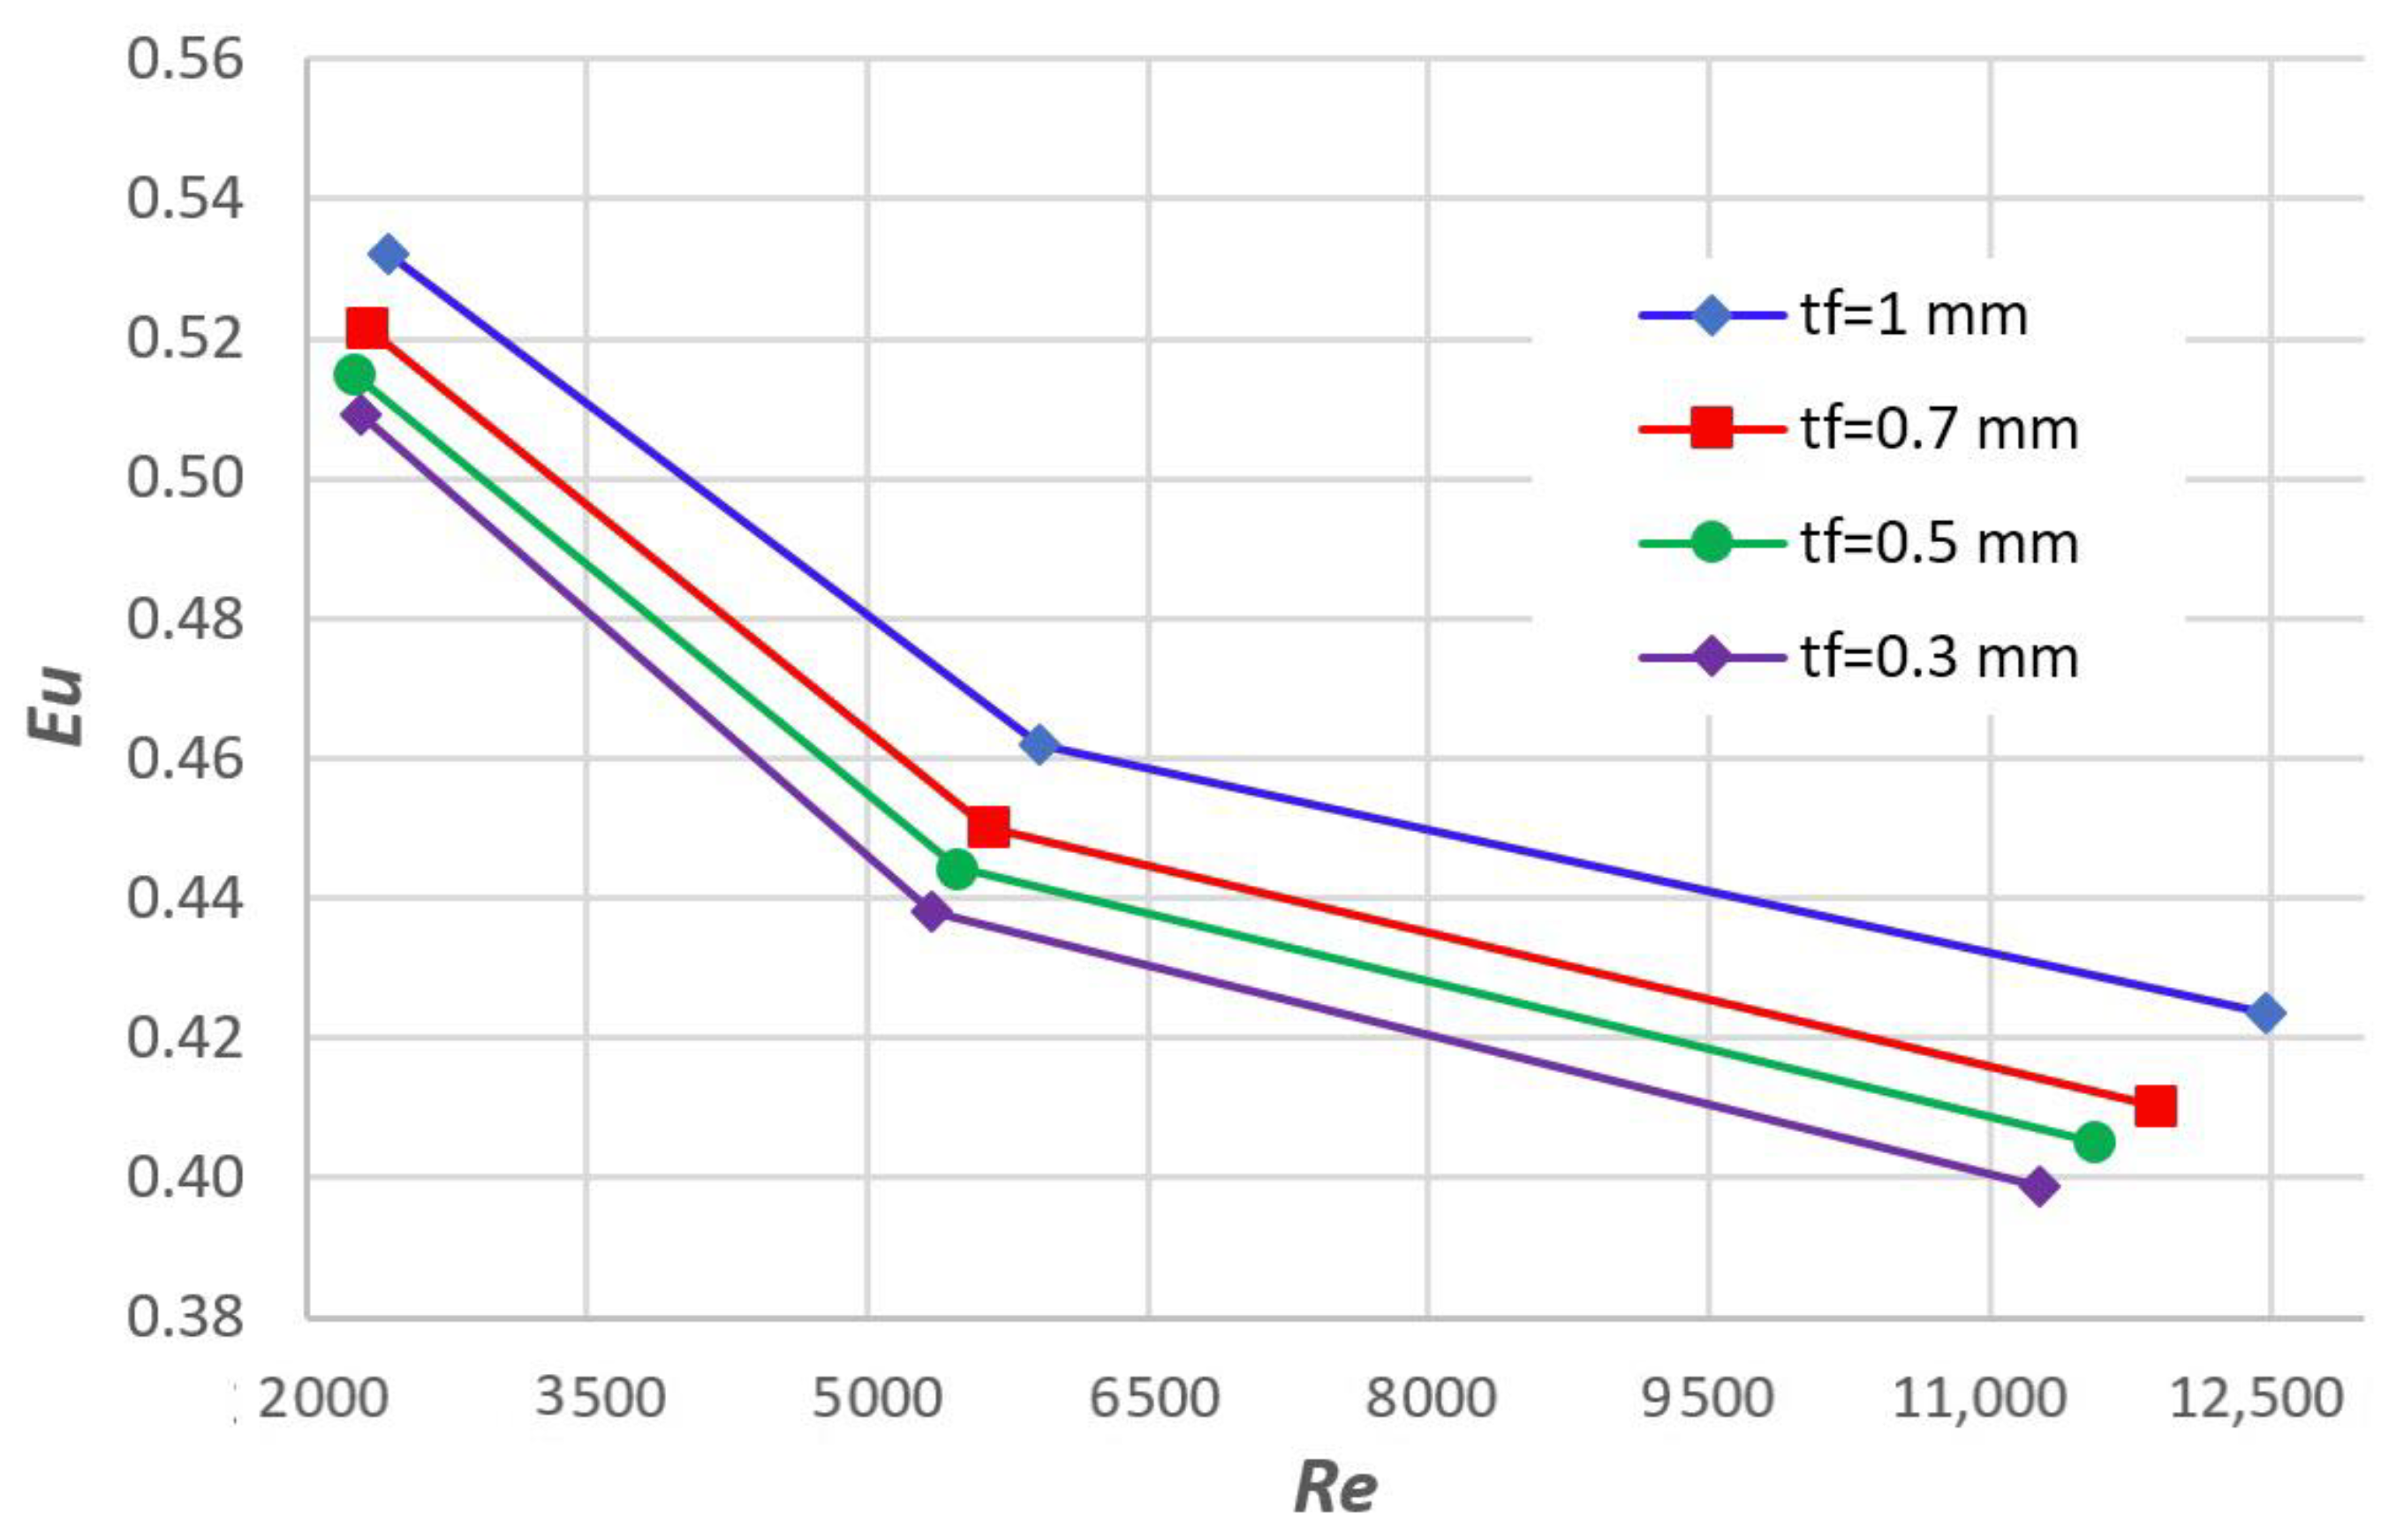
1.2. Influence of Fin Thickness

Several investigators have considered the influence of fin thickness (tf) on the heat transfer coefficient. Ward and Young [20] concluded that the Nusselt number increases with increasing fin thickness. The correlation they gave for the pressure drop in the tube bundle with the staggered tube arrangement was valid for the range 103 < Re < 3ˑ104. Briggs and Young [11] tested three different thicknesses of spiral fins (0.457 mm, 1.06 mm, and 2.02 mm) and found that the heat transfer coefficient for the thickest fin was about 8% lower compared to the thinnest fin. So, they concluded that heat transfer is less dependent on fin thickness and decreases with increasing fin thickness.
Stasiulevičius and Skrinska [21] have analytically shown that the thickness of the fin does not affect the convective heat transfer coefficient. It has also been found that the pressure drop increases with increasing fin thickness.

1.3. Influence of Outside Tube Diameter

Jameson [8] tested three tubes of different diameters with spiral fins. Mirkovic [22] investigated the heat transfer coefficient and pressure drop in a tube bundle with eight staggered rows of tubes, using tube diameters of 38.1 mm and 50.8 mm while pitch and fin height were kept constant. As the tube diameter increases, the inefficient rear part of the tube surface is raised. Mirkovic concluded that the pressure drop and the Nusselt number increase with increasing tube diameter.
Torikoshi and Xi came to a slightly different conclusion about the influence of diameter on heat transfer [23]. They numerically studied a finned tube bundle with two rows of tubes. They assumed a transient flow. They concluded that increasing the tube diameter barely increases the heat transfer coefficient but increases the pressure drop.
There are several correlations in the literature for determining the properties of Nu and Eu. Some correlations use the above studies, whereas others are based on laboratory experiments.
Pongsoi et al. [24] summarized and analyzed the results of a study of the airside performance of spiral fin heat exchangers and provided an overview of the available correlations for heat exchange. Fajiang et al. [25] experimentally tested the heat transfer and flow resistance for air-flow spiral fin-tube heat exchangers in dry conditions and provided a correlation.
Unger et al. [26] laboratory-tested tubes with three different fin designs (circular plain fin, circular integrated pin fin, and serrated integrated pin fin) fabricated by additive technology using selective laser melting. The experiment was conducted in the range of Reynolds numbers between 1800 and 7800. They found that the highest heat transfer per volume heat exchanger was for the circular integrated pin. They derived heat transfer correlations from the experimental data.
Kim [27] experimentally tested a finned heat exchanger with oval tubes under wet conditions. He changed the dimensions and the pitch of the tubes. The largest Colburn j-factor was obtained for the two-row tube configuration. He developed correlations for heat transfer and pressure drop for the tested configurations.
Adhikari et al. [28] experimentally and numerically analyzed the heat transfer from straight rectangular fins on a horizontal surface in the range of Reynolds numbers from 2600 to 6800. Their experimental results showed that Nusselt and Reynolds number have an approximately linear relationship.
Common correlations for Nu and Eu for annular fins according to Briggs [11], Ward, and Young [20] are shown in Table 1 and Table 2. Correlations for serrated fins can also be found in the literature. For example, Anoop et al. [29] proposed a correlation to determine the Nusselt number over a serrated fin tube for Reynolds numbers between 1300 and 8000. They applied a numerical analysis considering the geometrical parameters such as depth of serration, fin spacing, fin height, and fin thickness.

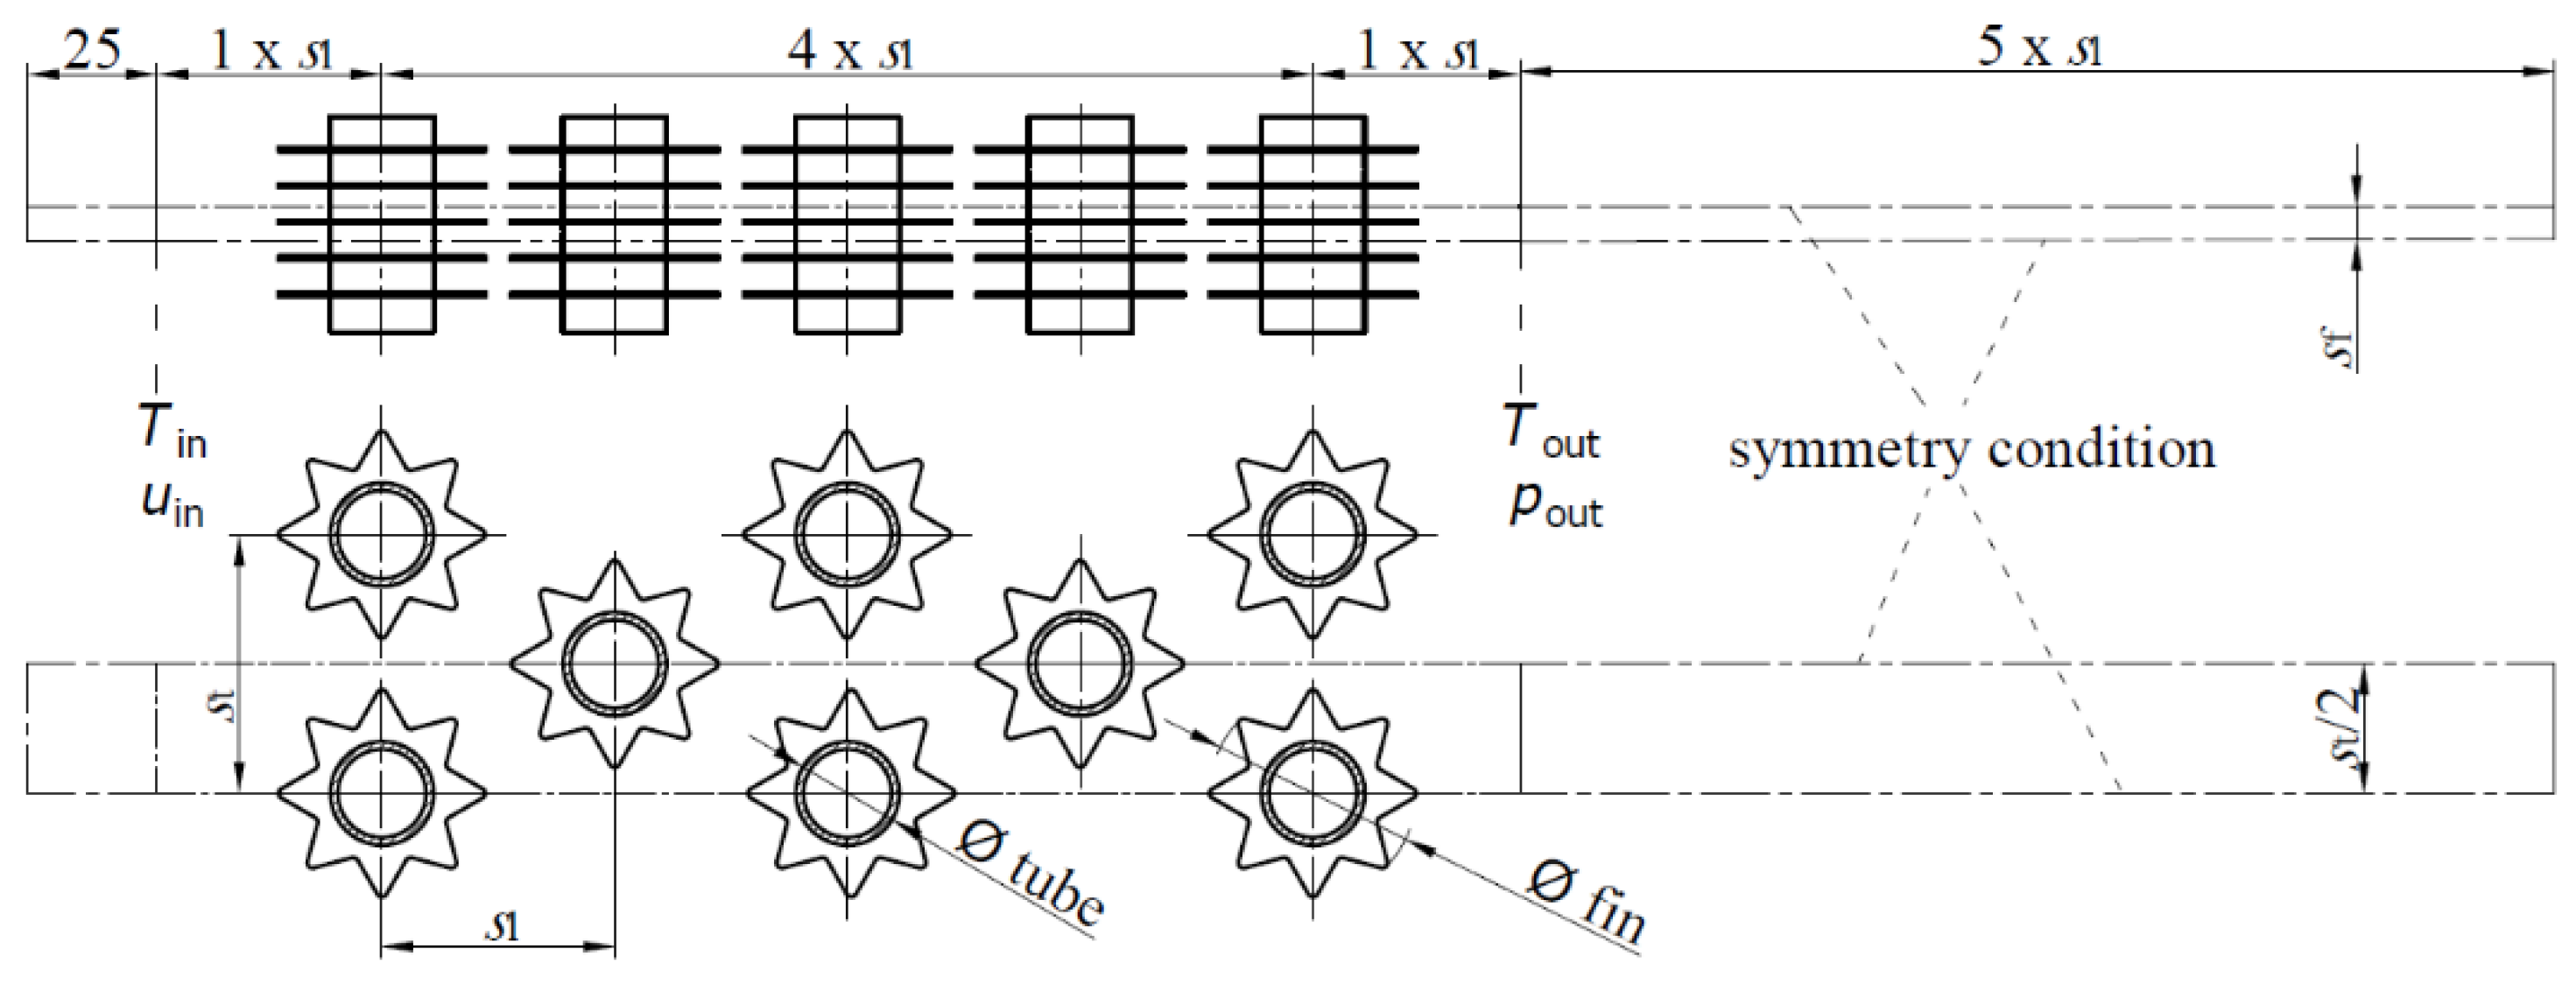
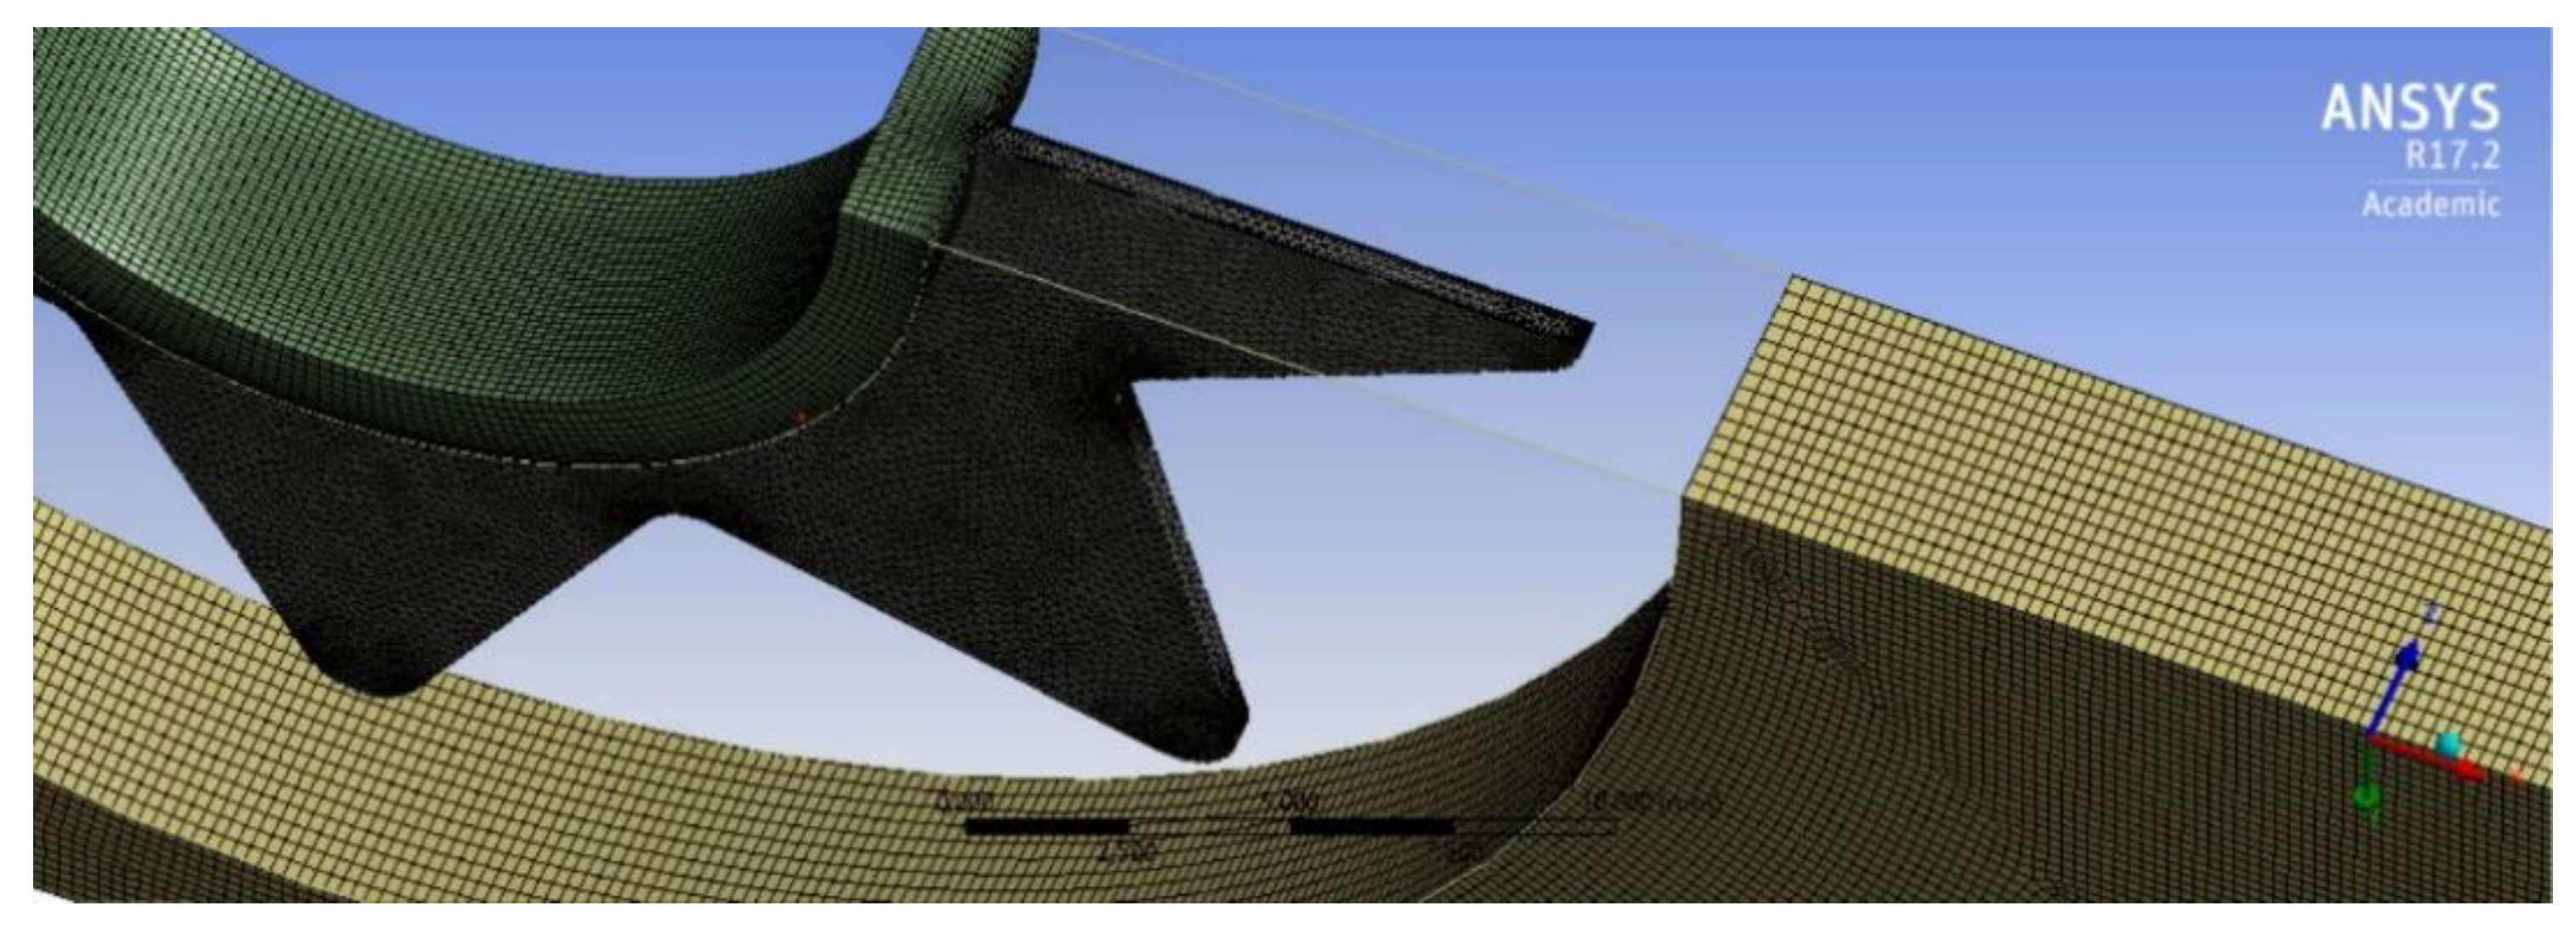
2. Materials and Methods

Correlations for heat transfer in heat exchangers with star-shaped fins are not available in the literature. Bosnjaković et al. have constructed a model of heat exchangers with star-shaped fins, calculated it numerically, and tested it experimentally [31,32,33] (Figure 1).
In order to obtain correlations for heat transfer and pressure drop for star-shaped fins, taking into account all influencing factors and based on experimental results, several heat exchangers with different geometries should be made, where the thickness and height of the fins, the number of fin vortices, the pitch of the fins and tubes, the tube diameter, etc. would change. As it requires larger material costs, a reasonable solution is a correlation based on the results of test models of heat exchangers and additional information obtained by numerical analysis. For this purpose, several heat exchanger model variants were selected, varying the fin thickness and pitch. Table 3 and Table 4 show geometry and boundary conditions for the heat transfer calculations. An overview of the tested variants is shown in Table 5.
A numerical analysis was carried out for all the above variants using the ANSYS Fluent software. For this purpose, a corresponding geometric model (Figure 2) and a geometric mesh (Figure 3) were created.
The computational mesh was created in ANSYS Fluent meshing software by using a hybrid mesh where most of the volume was a structured mesh and the smaller part around the fins was an unstructured mesh. The fin and tube surface, on which convective heat transfer was performed, was covered with eight boundary layers. The thickness of the first layer was 0.025 mm to keep the dimensionless wall distance y+ < 1.
The study of mesh independence was carried out for the basic variants 5, 6, and 7, focusing on Nu and Eu, with mesh sizes of 5.8, 8.2, 10.8, and 15 million finite volumes. Results are presented in Table 6.
For this study, a mesh of 15 million finite volumes was chosen to obtain the most accurate results. The turbulence model k-ω SST was used, which has been described in detail in [31]. For other variants, the mesh quality elements were checked, as shown in Table 7. The numerical analysis was performed using the same criteria applied in [31,32,33].

3. Results and Discussion

The results of the numerical analysis for individual variants are shown in Table 8.
For each variant of the numerical analysis, the calculation of heat transfer and pressure drop was performed. The results of the calculation are presented in Table 9. The data reduction and interpretation are described in detail in [31].

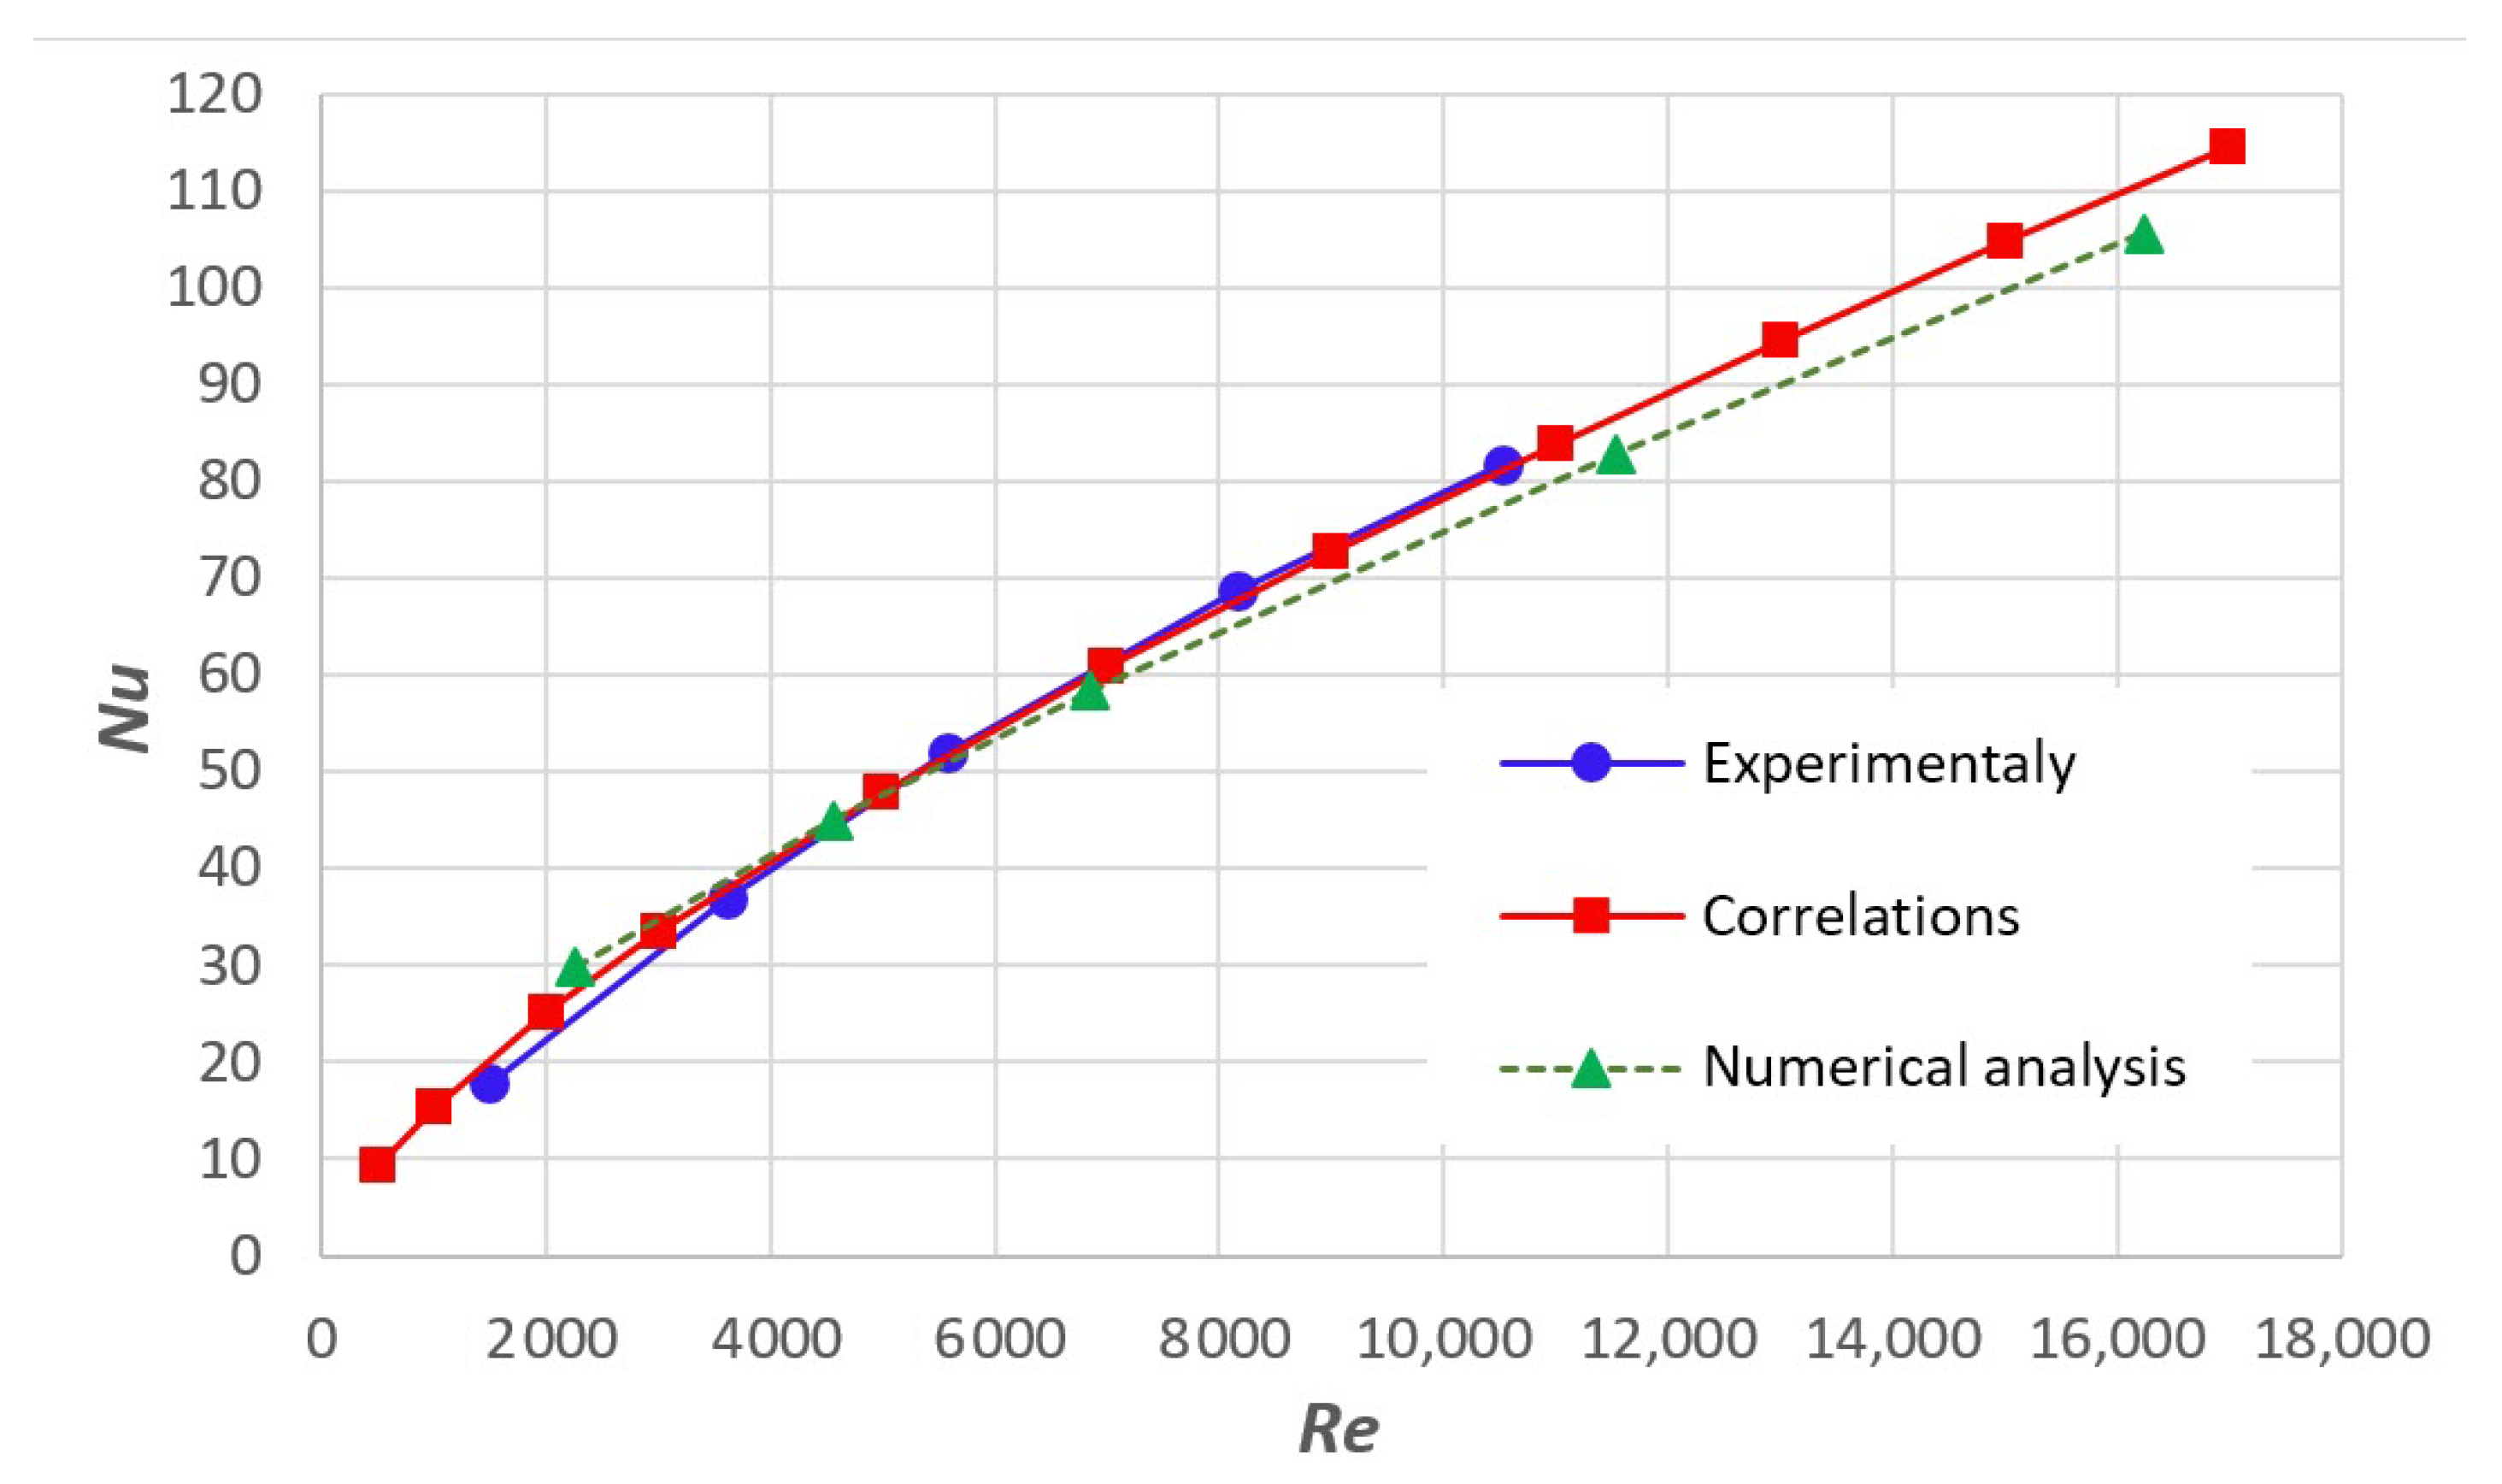
3.1. Determination of Correlation for Nu Number

To determine the correlations for the Nu and Eu numbers and to produce the corresponding graphs, numerical and graphical methods and analysis and synthesis methods were used. The general form of the correlations was adopted based on the review of numerous literature sources for annular and serrated fins and the assumption that a similar form of correlations applies to novel star-shaped fins. A very similar procedure for determining correlations for Nu and Eu was performed by Gashim [34]. He determined new correlations for the heat exchanger with annular fins. He considered the influence of fin height, spacing, pitch, tube and fin outer diameter, transversal and longitudinal tube pitch, and number of tube rows.
In this study, the influence of the fin thickness on the heat transfer, i.e., on the Nu number, was first analyzed. In this sense, variants 1 to 12 were analyzed. The calculation results are shown in Figure 4. It can be seen that the Nu number increased with increasing fin thickness, but this increase was not large.
The influence of the fin pitch is shown in Figure 5. By increasing the fin pitch to 4.5 mm, the Nu number increased significantly; in the range of the fin pitch above 4.5 mm, this increase was much less pronounced.
To numerically determine the influence of the fin thickness and pitch on the Nu number, the general form of the relationship was assumed:
N u = C 1 · R e C 2 · P r 1 / 3 ( t f s f ) C 3 ( s f d o ) C 4
The initial values of parameters C1 to C4 were supposed. The value of Nu number for the variants 1 to 21 was obtained by substituting the values of Re, tf, sf, and do into Equation (5). By analyzing the influence of each parameter C1, C2, C3, and C4, on the Nu function and applying the least-squares method, the value of the parameters can be iteratively determined so that the deviation of Equation (5) from the curves shown in Figure 4 and Figure 5 is minimal (the obtained average deviation of the Nu feature was 1.9006):
C1 = 0.38
C2 = 0.587
C3 = 0.0254
C4 = 0.07
The next step is to analyze and present the results of the laboratory tests and numerical analysis. For this purpose, the results of the laboratory tests [28] and the corresponding results of the numerical analysis of the heat exchanger model with a fin pitch of 4.5 mm and a fin thickness of 0.5 mm were used [33]. Figure 6 shows some discrepancy between the two curves representing the results of the laboratory tests and the numerical analysis. This suggests the need to derive a new expression for the Nu function for the actual heat exchanger.
For the real heat exchanger, we do not have experimental results for different fin thicknesses and fin pitches, so it was assumed that the influence of fin pitch and fin thickness is the same as in the numerical analysis, i.e., C3 = 0.0254 and C4 = 0.07. It was then necessary to determine the values of parameters C1 and C2 for the function for Nu to achieve better agreement with the experimental results. Analogous to the previous consideration, the value of the parameters C1 = 0.15 and C2 = 0.71 were determined. For the studied star-shaped fins, the correlation for Nu had the form:
N u = 0.15 · R e 0 . 71 · P r 1 / 3 ( t f s f ) 0 . 0254 ( s f d o ) 0 . 07
This correlation is shown in Figure 6 and can be assumed to be valid in the interval:
2000 < Re < 16,000
0.3 < tf < 1.0
0.15 < (sf/do) < 0.4
From Figure 6, it can be seen that the deviation of the obtained correlation from the results of the numerical analysis was small and was 4.8%. The deviation of the obtained correlation from the Nu number obtained based on the experimental test was up to 10% in the range Re < 3500, whereas for higher values of the Re number it was less than 2%.
The influence of fin thickness in correlation (6) on the Nu number is shown in Figure 7, and the influence of the fin pitch is shown in Figure 8.

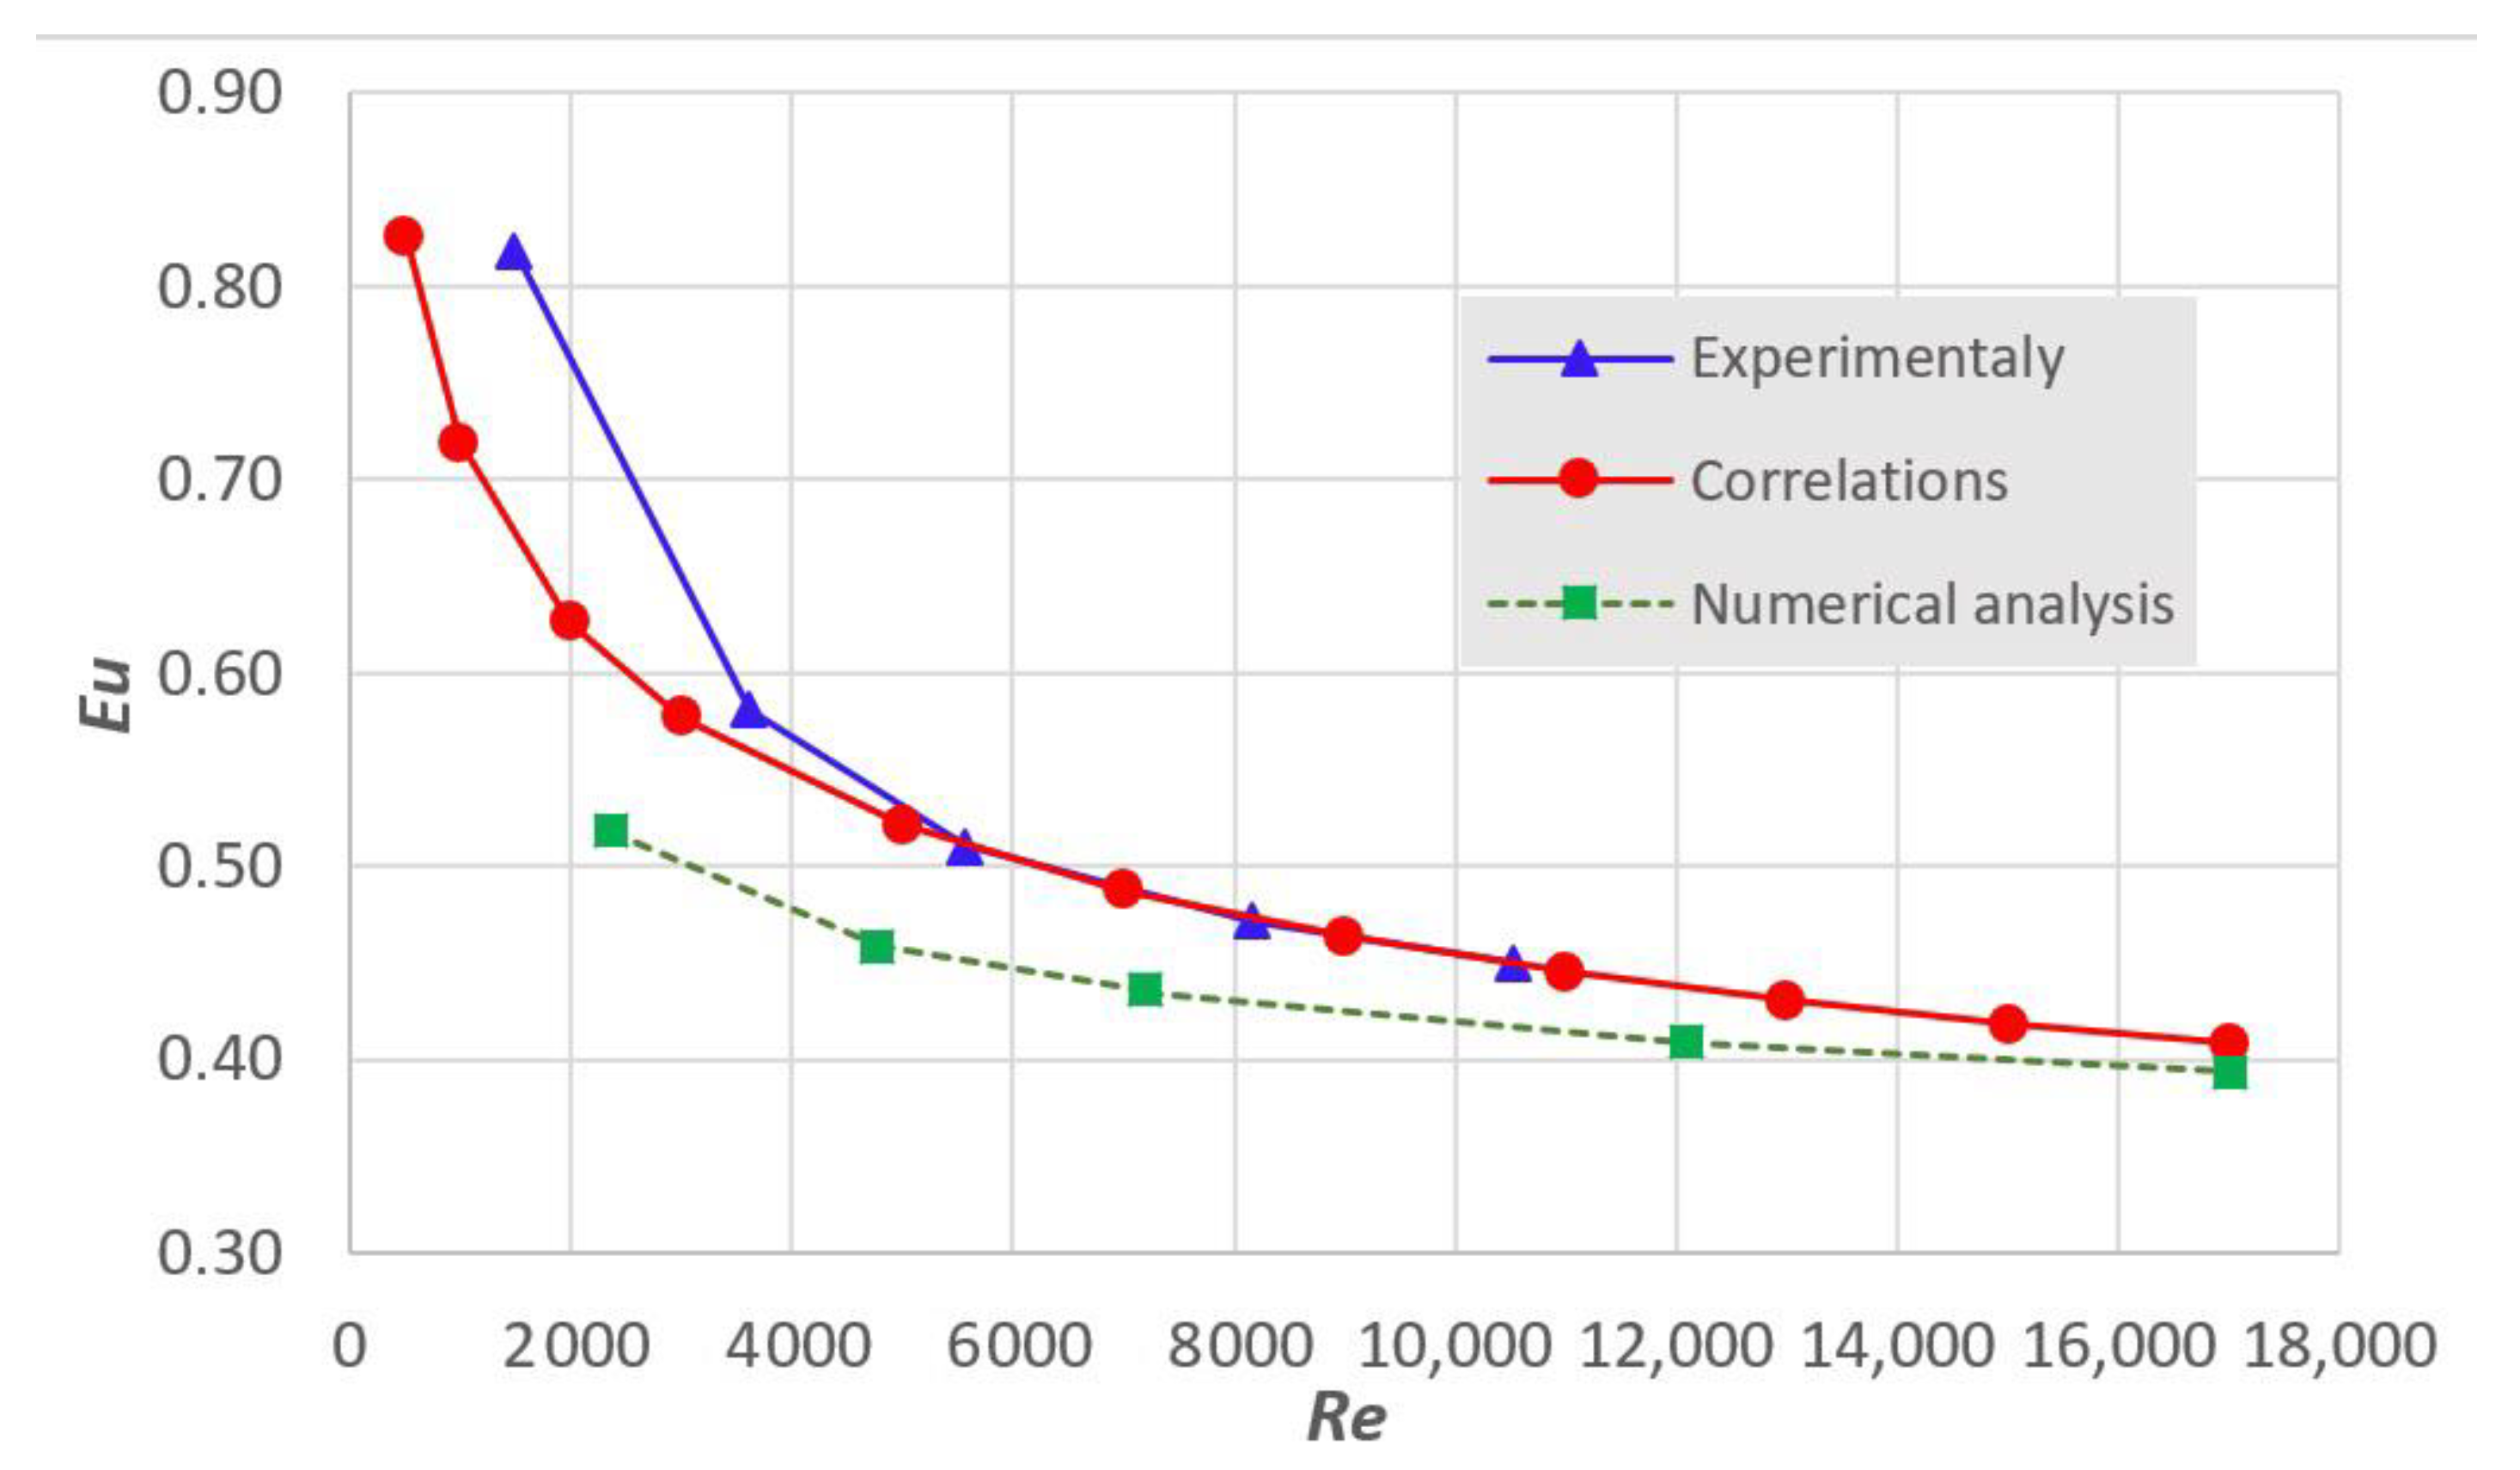
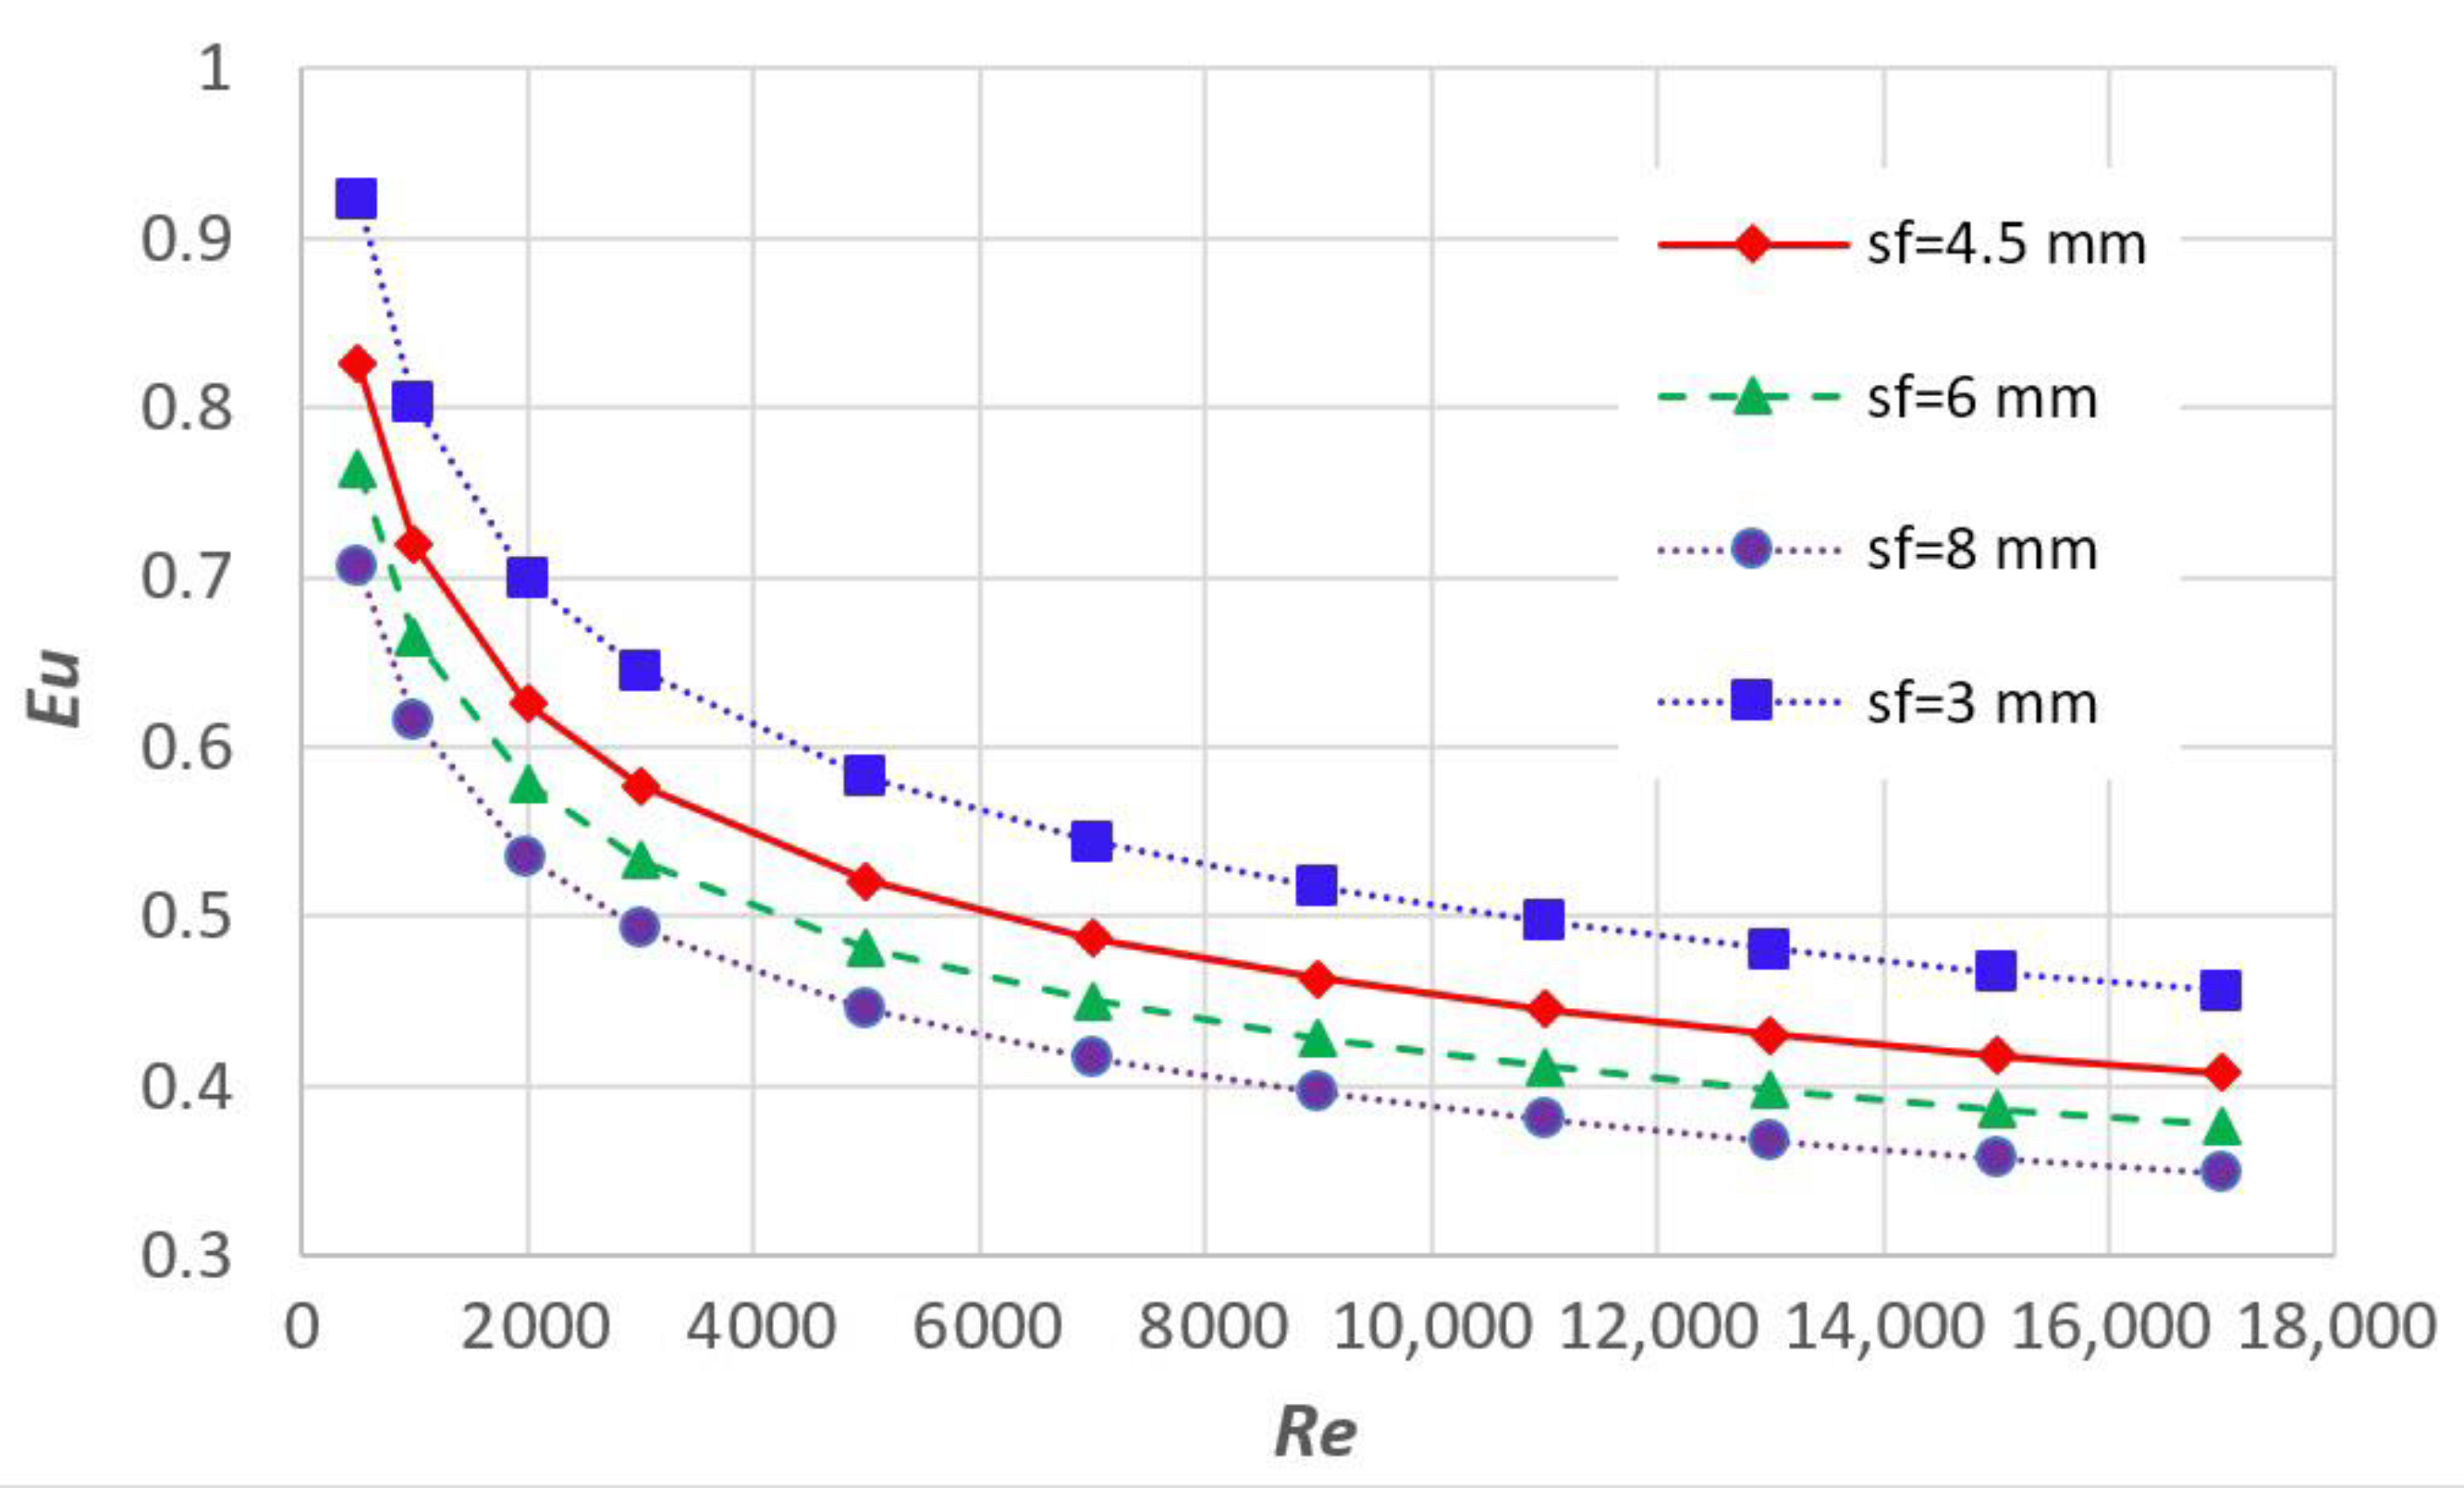
3.2. Determination of Correlation for the Eu Number

First, the analysis of the influence of the fin thickness on the pressure drop, i.e., on the Eu number, was carried out. In this sense, variants 1 to 12 were analyzed. The calculation results are shown in Figure 9. From the figure, it can be seen that the value of Eu number decreased with increasing Re number, and the value of Eu number increased with increasing fin thickness.
The results of the numerical analysis of variants 13 to 21 show the influence of fin pitch on the Eu number, which is shown in Figure 10. As the fin pitch decreases, the Eu number increases.
It is also evident from Figure 9 and Figure 10 that the influence of fin pitch on the pressure drop, and hence on the value of Eu, was greater than the influence of fin thickness. To numerically determine the influence of fin thickness and pitch on the Eu number, the general form of correlation for the Eu number was assumed to be of the form:
E u = C 5 · R e C 6 · ( t f s f ) C 7 ( s f d o ) C 8
Assuming the initial values of the parameters C5 to C8 and substituting the value of the Re number, tf, sf, and do for individual variants from 1 to 21 into Equation (7), the values of Eu number were obtained. By analyzing the influence of the individual parameters C5, C6, C7, and C8 on the Eu function and applying the least-squares method, its value can be determined iteratively:
C5 = 1.438
C6 = −0.145
C7 = 0.071
C8 = −0.273
so that the deviation of Equation (7) from the curves shown in Figure 9 and Figure 10 is minimal.
The next step was to analyze and present the results of the laboratory tests and the numerical analysis. Figure 11 shows a certain deviation of these two curves. This means that a new expression for the Eu function needed to be derived for the actual heat exchanger.
Since we do not have experimental results for the actual heat exchanger for different fin thickness and pitch, it was assumed that the influence of fin pitch and thickness was the same as in the numerical analysis, i.e., C7 = 0.071 and C8 = −0.273 were assumed. It was then necessary to determine the value of parameters C5 and C6 to match the Eu function as closely as possible with the experimental results. Analogous to the previous observation, the value of parameters C5 = 2.6 and C6 = −0.2 were determined. The correlation for the Eu then looks like:
E u = 2.6 · R e 0.2 · ( t f s f ) 0.071 ( s f d o ) 0.273
This correlation is shown in Figure 11 and can be assumed to be valid for the interval:
2000 < Re < 16,000
0.3 < tf < 1.0
0.15 < (sf/do) < 0.4
The deviation of the Eu number obtained based on experimental testing and the basis of numerical analysis was relatively large. It was highest in the range of Re < 4000 where it was up to 29%. In the range of Re > 6000, the deviation was less than 12%. In [31,32,33] it was shown that the correlations available in the literature also provide very different results, differing even by more than 50%. It was also noted that the numerical analysis always provides slightly lower values of Eu numbers compared to the values obtained from the experimental tests. In the range of lower values of Re, the measurement error in the experimental test is often somewhat higher because of the characteristics of the measuring devices [32]. The deviation of the presented correlation from the experimental results was the largest in the range Re < 4000 where it was up to 19%. In the range Re > 5600, the deviation was less than 1%.
The influence of fin thickness in correlation (8) on Eu number is shown in Figure 12, and the influence of the fin pitch on Eu number is shown in Figure 13.
The results of variants 13 to 21 show the influence of the fin pitch on the Nu number, which is visually shown in Figure 4. It is interesting to note that the curves for fin pitches of 4.5 mm, 6 mm, and 8 mm were almost the same and that the large distance from them was the curve for the 3 mm fin pitch. This is in line with the relevant literature [1,2,3,4,5,6] and can be explained physically. For a larger fin pitch, a free flow around the fins to the tube surface is established. Because of the specific fin shape, the boundary layer is broken, turbulent flow is created, and more efficient convective heat exchange occurs. With a small fin pitch, the flow resistances increase, the boundary layer fills the gap between the fins, and the flow is predominantly laminar. The heat exchange is, therefore, less efficient, so that the Nu number is significantly lower. For a fin spacing of 8 mm, there is no increase in heat transfer compared to a 6 mm pitch, which agrees with the results of Žukauskas [7].
It follows from the above that the selected pitch of 4.5 mm is the optimal pitch because it provides the largest surface of the exchanger with good heat exchange.
The influence of the fin pitch on the pressure drop is clear. By increasing the fin pitch with a constant fin thickness, the free cross-section increases and the flow resistances decreases, so the pressure drop is smaller. Thus, the Eu number is lower. The influence of the fin thickness on the pressure drop is not large because fins are usually of small thickness. Increasing the fin thickness increases the airflow resistance and increases the air vortex, which leads to an augmentation in pressure drop, and thus the value of the Eu number.

4. Conclusions

In this study, correlations for dimensionless numbers Nu and Eu for star-shaped fins were derived. For this type of fins, correlations for heat transfer and pressure drop have not been available in the literature so far.
Data for correlations were obtained by a combination of laboratory test and parametric numerical study of heat exchanger parameters with computational fluid dynamics software. Twenty-one variants of the parametrical numerical model were calculated, where pitch, thickness, and inlet velocity of air to the numerical domain were varied.
The influence of the fin thickness on the heat transfer and pressure drop was not large, but the influence of the fin pitch on the heat transfer and pressure drop was significant. Therefore, when constructing a heat exchanger, the fin pitch should be chosen correctly.
The least-squares method was applied to obtain expressions for the Nu and Eu numbers for star-shaped fins. Developed correlations were valid in the interval:
2000 < Re < 16,000
0.3 < tf < 1.0
0.15 < (sf/do) < 0.4
The deviation of the correlation for Nu from the results of the numerical analysis was up to 4.8%. The deviation from the experimental test was up to 10% in the range Re < 3500, whereas for higher values of the Re number it was less than 2%.
The deviation of the correlation for Eu from the experimental results was the largest in the range Re < 4000 where it was up to 19%. In the range Re > 5600, the deviation was less than 1%.

Author Contributions

M.B.: conceptualization, methodology, writing—original draft preparation, visualization; A.Č.: data curation, validation; S.M.: software, visualization, supervision; M.H.: writing—reviewing and editing. All authors have read and agreed to the published version of the manuscript.

Funding

This research received no external funding.

Institutional Review Board Statement

Not applicable.

Informed Consent Statement

Not applicable.

Data Availability Statement

The data presented in this study are available on request from the corresponding author.

Conflicts of Interest

The authors declare no conflict of interest.

References

  1. Antuf’ev, V.M.; Gusev, E.K. Intensification of Heat Transfer of Cross-Flow Finned Surfaces. Teploenergetika 1968, 15, 31–34. [Google Scholar]
  2. Brauer, H. Wärme- und strömungstechnische Untersuchungen an quer angeströmten Rippenrohrbündeln, Teil 2, Einfluß der Rippen- und der Rohranordung. Chem. Ing. Tech. 1961, 33, 431–438. [Google Scholar] [CrossRef]
  3. Brauer, H. Wärme- und strömungstechnische Untersuchungen an quer angeströmten Rippenrohrbündeln, Teil 1, Versuchsanlagen und Meßergebnisse bei höheren Drucken. Chem. Ing. Tech. 1961, 33, 327–335. [Google Scholar] [CrossRef]
  4. Rabas, T.J.; Eckels, P.W.; Sabatino, R.A. The Effect of Fin Density on the Heat Transfer and Pressure Drop Performance of Low-Finned Tube Banks. Chem. Eng. Commun. 1981, 10, 127–147. [Google Scholar] [CrossRef]
  5. Rabas, T.J.; Taborek, J. Survey of Turbulent Forced-Convection Heat Transfer and Pressure Drop Characteristics of Low-Finned Tube Banks in Cross-Flow. Heat Transf. Eng. 1987, 8, 49–62. [Google Scholar] [CrossRef]
  6. Yudin, V.F.; Tokhtarova, L.S.; Lokshin, V.; Tulin, S.N. Correlation of Experimental Data on Convective Heat Transfer in Cross Flow Over Bundles with Transverse Spiral and Circumferential Fins. Tr. TsKTI 1968, 82. [Google Scholar]
  7. Žukauskas, A.A. Investigation of Heat Transfer in Different Arrangements of Heat Exchanger Surfaces. Teploenergetika 1974, 21, 40–46. [Google Scholar]
  8. Jameson, S.L. Tube Spacing in Finned Tube Banks. ASME Trans. 1945, 67, 633–642. [Google Scholar]
  9. Watel, B.; Harmand, S.; Desmet, B. Influence of Flow Velocity and Fin Spacing on the Forced Convective Heat Transfer from an Annular-Finned Tube. JSME Int. J. 1999, 42, 56–64. [Google Scholar] [CrossRef] [Green Version]
  10. Watel, B.; Harmand, S.; Desmet, B. Experimental Study of Convective Heat Transfer from a Rotating Finned Tube in Transverse Air Flow. Exp. Fluids 2000, 29, 79–90. [Google Scholar] [CrossRef]
  11. Briggs, D.E.; Young, E.H. Convection Heat Transfer and Pressure Drop of Air Flowing Across Triangular Pitch Banks of Finned Tubes. Chem. Eng. Prog. Symp. 1963, 59, 1–10. [Google Scholar]
  12. Kuntysh, V.B.; Iokhvedov, F.M. Heat Transfer. Sov. Res. 1971, 3, 50–61. [Google Scholar]
  13. Gianolio, E.; Cuti, F. Heat Transfer Coefficients and Pressure Drops for Air Coolers Under Induced and Forced Draft. Heat Transf. Eng. 1981, 3, 38–48. [Google Scholar] [CrossRef]
  14. Schmidt, E.T. Der Wärmeübergang an Rippenrohre und die Berechnung von Rohrbündle-Wärmeaustauschern. Kältetechnik 1963, 15, 98–102, 370–378. [Google Scholar]
  15. Lee, M.; Kang, T.; Kim, Y. Air-side heat transfer characteristics of spiral-type circular fin-and tube heat exchangers. Int. J. Refrig. 2010, 33, 313–320. [Google Scholar] [CrossRef]
  16. Pongsoi, P.; Wongwises, S. Determination of fin pitches for maximum performance index of L-footed spiral fin-and-tube heat exchangers. J. Therm. Eng. 2015, 1, 251–262. [Google Scholar]
  17. Mon, M.S.; Gross, U. Numerical study of fin-spacing effects in annular-finned tube heat exchangers. Int. J. Heat Mass Transf. 2004, 47, 1953–1964. [Google Scholar] [CrossRef]
  18. Kawaguchi, K.; Okui, K.; Asai, T.; Yutaka, H. Effects of serrated fin and fin pitch on pressure drop of the finned tube banks. Turbomachinery 2004, 32, 551–559. [Google Scholar]
  19. Naess, E. Experimental investigation of heat transfer and pressure drop in serrated-fin tube bundles with staggered tube layouts. Appl. Therm. Eng. 2010, 30, 1531–1537. [Google Scholar] [CrossRef]
  20. Ward, D.J.; Young, E.H. Heat Transfer and Pressure Drop of Air in Forced Convection Across Triangular Pitch Banks of Finned Tubes. Chem. Eng. Prog. Symp. Ser. 1959, 55, 37–44. [Google Scholar]
  21. Stasiulevičius, J.; Skrinska, A. Heat Transfer of Finned Tube Bundles in Crossflow; Hemisphere Publishing: London, UK, 1988; ISBN 3-540-18211-x. [Google Scholar]
  22. Mirkovic, Z. Heat Transfer and Flow Resistance Correlation for Helically Finned and Staggered Tube Banks in Cross Flow. Heat Exchangers: Design and Theory Source Book; Afgan, N.H., Schlünder, E.U., Eds.; Hemisphere: Washington, DC, USA, 1974; pp. 559–584. [Google Scholar]
  23. Torikoshi, K.; Xi, G. A Numerical Study of Flow and Thermal Fields in Finned Tube Heat Exchangers (Effect of the Tube Diameter). In Proceedings of the ASME Heat Transfer Division, HTD, San Francisco, CA, USA, 12–17 November 1995; Volume 317-1, pp. 453–457. [Google Scholar]
  24. Pongsoi, P.; Pikulkajorn, S.; Wongwises, S. Heat transfer and flow characteristics of spiral fin-and-tube heat exchangers: A review. Int. J. Heat Mass Transf. 2014, 79, 417–431. [Google Scholar] [CrossRef]
  25. FaJiang, H.; Wei Wu, C.; Ping, Y. Experimental investigation of heat transfer and flowing resistance for air flow cross over spiral finned tube heat exchanger. Energy Procedia 2012, 17, 741–749. [Google Scholar] [CrossRef] [Green Version]
  26. Unger, S.; Beyer, M.; Pietruske, H.; Szalinski, L.; Hampel, U. Air-side heat transfer and flow characteristics of additively manufactured finned tubes in staggered arrangement. Int. J. Therm. Sci. 2021, 161, 106752. [Google Scholar] [CrossRef]
  27. Kim, N.H. Air-side heat transfer and pressure drop of the fin-and-tube heat exchangers having oval tubes under wet condition. Heat Mass Transf. 2021. [Google Scholar] [CrossRef]
  28. Adhikari, R.; Wood, D.; Pahlevani, M. An experimental and numerical study of forced convection heat transfer from rectangular fins at low Reynolds numbers. Int. J. Heat Mass Transf. 2020, 163, 120418. [Google Scholar] [CrossRef]
  29. Anoop, B.; Balaji, C.; Velusamy, K. A characteristic correlation for heat transfer over serrated finned tubes. Anal. Nucl. Energy 2015, 85, 1052–1065. [Google Scholar] [CrossRef]
  30. Robinson, K.K.; Briggs, D.E. Pressure drop of air flowing across triangular pitch banks of finned tubes. AlChE Chem. Eng. Progr. Symp 1966, 62, 177–184. [Google Scholar]
  31. Bošnjaković, M.; Čikić, A.; Muhič, S.; Stojkov, M. Development of a new type of finned heat exchanger. Tech. Gaz. 2017, 24, 1785–1796. [Google Scholar] [CrossRef]
  32. Bošnjaković, M.; Muhić, S.; Čikić, A. Experimental testing of the heat exchanger with star-shaped fins. Int. J. Heat Mass Transf. 2020, 149, 119190. [Google Scholar] [CrossRef]
  33. Bošnjaković, M.; Muhić, S.; Čikić, A.; Živić, M. How Big Is an Error in the Analytical Calculation of Annular Fin Efficiency? Energies 2019, 12, 1787. [Google Scholar] [CrossRef] [Green Version]
  34. Gashim, S.L. New Correlation Equations for Finned Tube Heat Exchangers. J. Eng. Appl. Sci. 2019, 14, 1538–1548. [Google Scholar] [CrossRef] [Green Version]
Figure 1. Tube with star-shaped fins.
Applsci 11 05912 g001
Figure 2. Geometric model of the heat exchanger.
Applsci 11 05912 g002
Figure 3. The mesh detail.
Applsci 11 05912 g003
Figure 4. Influence of fin thickness on heat transfer.
Applsci 11 05912 g004
Figure 5. Influence of fin pitch on heat transfer.
Applsci 11 05912 g005
Figure 6. Nu number obtained by laboratory testing, numerical analysis, and correlation.
Applsci 11 05912 g006
Figure 7. Influence of fin thickness in correlation on the Nu number.
Applsci 11 05912 g007
Figure 8. Influence of fin pitch in correlation on the Nu number.
Applsci 11 05912 g008
Figure 9. Influence of fin thickness on pressure drop.
Applsci 11 05912 g009
Figure 10. Influence of fin pitch on pressure drop.
Applsci 11 05912 g010
Figure 11. Eu number obtained by laboratory testing, numerical analysis, and correlation.
Applsci 11 05912 g011
Figure 12. Influence of fin thickness according to correlation on the Eu number.
Applsci 11 05912 g012
Figure 13. Influence of fin pitch according to correlation on the Eu number.
Applsci 11 05912 g013
Table 1. An overview of the correlations used for the Nu number.
AuthorCorrelation
Briggs and Young [11] N u = 0.134 · R e 0.681 · P r 0.33 · ( s f t f h f ) 0.2 · ( s f t f t f ) 0.1134 (1)
1100 < Re < 18 × 103
1.01 <(sftf)/tf < 6.62
11.1 < do < 40.9
0.09 < hf/do < 0.69
1.54 < st/do < 8.23
0.011 < tf/do < 0.15
0.13 < (sftf)/hf < 0.63
246 < fins/m < 768
Ward and Young [20] N u = 0.364 · R e 0.68 · P r 1 / 3 · ( d f d o ) 0.45 · ( t f d f ) 0.3 (2)
1000 < Re < 28 × 103
0.41 < tf < 0.56
11.13 < do < 29.13
23.81 < st < 61.91
1.42 < hf < 14.69
20.62 < sl < 53.62
0.89 < sf < 4.39 number of tube rows > 3
df-outside tube diameter
Table 2. An overview of the correlations used for the Eu number.
AuthorCorrelation
Robinson and Briggs [30] E u = 18.03 · R e 0.316 · ( s t d o ) 0.927 · ( s t s d ) 0.515 (3)
s d = ( s t 2 ) 2 + s l 2
2 × 10³ < Re < 5 × 10⁴
2.31 < sf < 2.82
18.64 < do < 40.89
42.85 < st < 114.3
39.68 < df < 69.85
37.11 < sl < 98.89
10.52 < (dfdo) < 14.48
1.8 < st/do < 4.6
St–transversal tube pitch Sl–longitudinal tube pitch
Ward and Young [20] E u = 0.256 · R e 0.264 · ( t f d f ) 0.377 · ( s f d o ) 0.396 · ( s l d o ) (4)
1000 < Re < 28 × 103
0.41 < tf < 0.56
11.13 < do < 29.13
23.81 < st < 61.91
1.42 < hf < 14.69
20.62 < sl < 53.62
0.89 < sf < 4.39 number of tube rows ≥ 6
Table 3. The tube and star-shaped fin data.
Sizes of Fins and Tubes
Material stainless steel
Tube datad0mm20
--staggered
stmm50
slmm40
Nl-5
Table 4. Boundary conditions of numerical analysis.
Boundary Condition
Air temperature at the inlet TinK288
Air velocity at the inletuinm/s1, 24 and 5
Wall temperature of the internal tube TwK353
Gauge air pressure at the outlet of HEpoutPa0
Wall condition (airside) Hydraulically smooth wall
Table 5. Variants of geometry and operating conditions analyzed numerically.
Variant No. 1234567891011
Pitch sfmm4.54.54.54.54.54.54.54.54.54.54.5
Thickness tfmm1.01.01.00.70.70.70.50.50.50.30.3
Airspeed uinm/s1.02.45.01.02.45.01.02.45.01.02.4
Variant No. 12131415161718192021
Pitch sfmm4.53.03.03.06.06.06.08.08.08.0
Thickness tfmm0.30.50.50.50.50.50.50.50.50.5
Airspeed uinm/s5.01.02.45.01.02.45.01.02.45.0
Table 6. The mesh independence test.
Number of Finite Volumes
(millions)
5.88.210.815.0
Nu54.751.451.351.4
Eu0.340.380.410.41
Table 7. Mesh quality elements for geometric model variants.
Fin Thickness (mm)Fin Pitch
(mm)
SkewnessOrthogonal Qual.Aspect RatioElements/Nodes
14.5min. 1.3 × 10⁻¹⁰
max. 0.917
av. 0.24
min. 0.1
max. 1
av. 0.86
min. 1.07
max. 31.6
av. 2.7
el. 11,334,069
nod. 3,161,411
0.74.5min. 1.3 × 10⁻¹⁰
max. 0.9
av. 0.24
min. 0.111
max. 1
av. 0.85
min. 1.07
max. 32.5
av. 2.74
el. 11,062,274
nod. 3,060,684
0.34.5min. 1.3 × 10⁻¹⁰
max. 0.91
av. 0.24
min. 8.8 × 10⁻²
max. 1
av. 0.85
min. 1.07
max. 91.76
av. 2.87
el. 10,736,408
nod. 2,935,164
0.53.0min. 1.3 × 10⁻¹⁰
max. 0.899
av. 0.25
min. 0.14
max. 1
av. 0.85
min. 1.04
max. 36.2
av. 3.0
el. 8,042,694
nod. 2,366,694
0.56.0min. 1.3
max. 0.918
av. 0.23
min. 0.1
max. 1
av. 0.86
min. 1.0
max. 36.5
av. 2.6
el. 13,742,299
nod. 3,664,919
0.58.0min. 1.3
max. 0.94
av. 0.22
min. 0.1
max. 1
av. 0.86
min. 1.0
max. 36.5
av. 2.45
el. 17,402,882
nod. 4,535,607
Table 8. Results of numerical analysis for individual variants of the studied geometry.
Variant1234567891011
ToutK325.76314.74307.66323.84312.89305.81321.8311.1304.3318.8308.49
pinPa10.40348.894188.778.90941.51158.828.1037.48142.847.40433.907
poutPa−2.11−12.4−52.47−2.139−12.33−52.36−2.10−12.28−52.52−2.044−12.14
Variant12131415161718192021
ToutK302.32328.27316.28308.46317.4307.67301.89313.46304.98300.0
pinPa128.4911.19749.427183.386.75632.356125.195.80828.70112.66
poutPa−52.28−2.132−12.38−53.19−2.067−12.06−51.39−2.131−11.73−49.89
Table 9. Calculation results of heat transfer and pressure drop for particular variants of the analyzed geometry.
Variant1234567891011
Pr0.70280.70380.70470.70310.70410.70500.70340.70440.70530.70390.7050
Re2437591812,4702323564411,8922256548411,55522965349
Nu29.0747.2576.4528.3446.072.727.4744.8170.6426.6543.59
Eu0.53210.46200.42260.52150.45010.41030.51500.44430.40510.50910.4380
Variant12131415161718192021
Pr0.70590.70300.70420.70520.7040.7050.7050.7040.7050.705
Re11,2672340569412,0162217538411,3312189559511,162
Nu69.4126.2042.6869.5427.6344.4870.1827.4044.4569.80
Eu0.39870.61060.50210.44680.46850.41670.38400.4390039380.3666
Publisher’s Note: MDPI stays neutral with regard to jurisdictional claims in published maps and institutional affiliations.

