
On the Use of Infrared Thermography for the Estimation of Melting Enthalpy


Abstract
:Featured Application
Abstract
1. Introduction
2. Materials and Methods
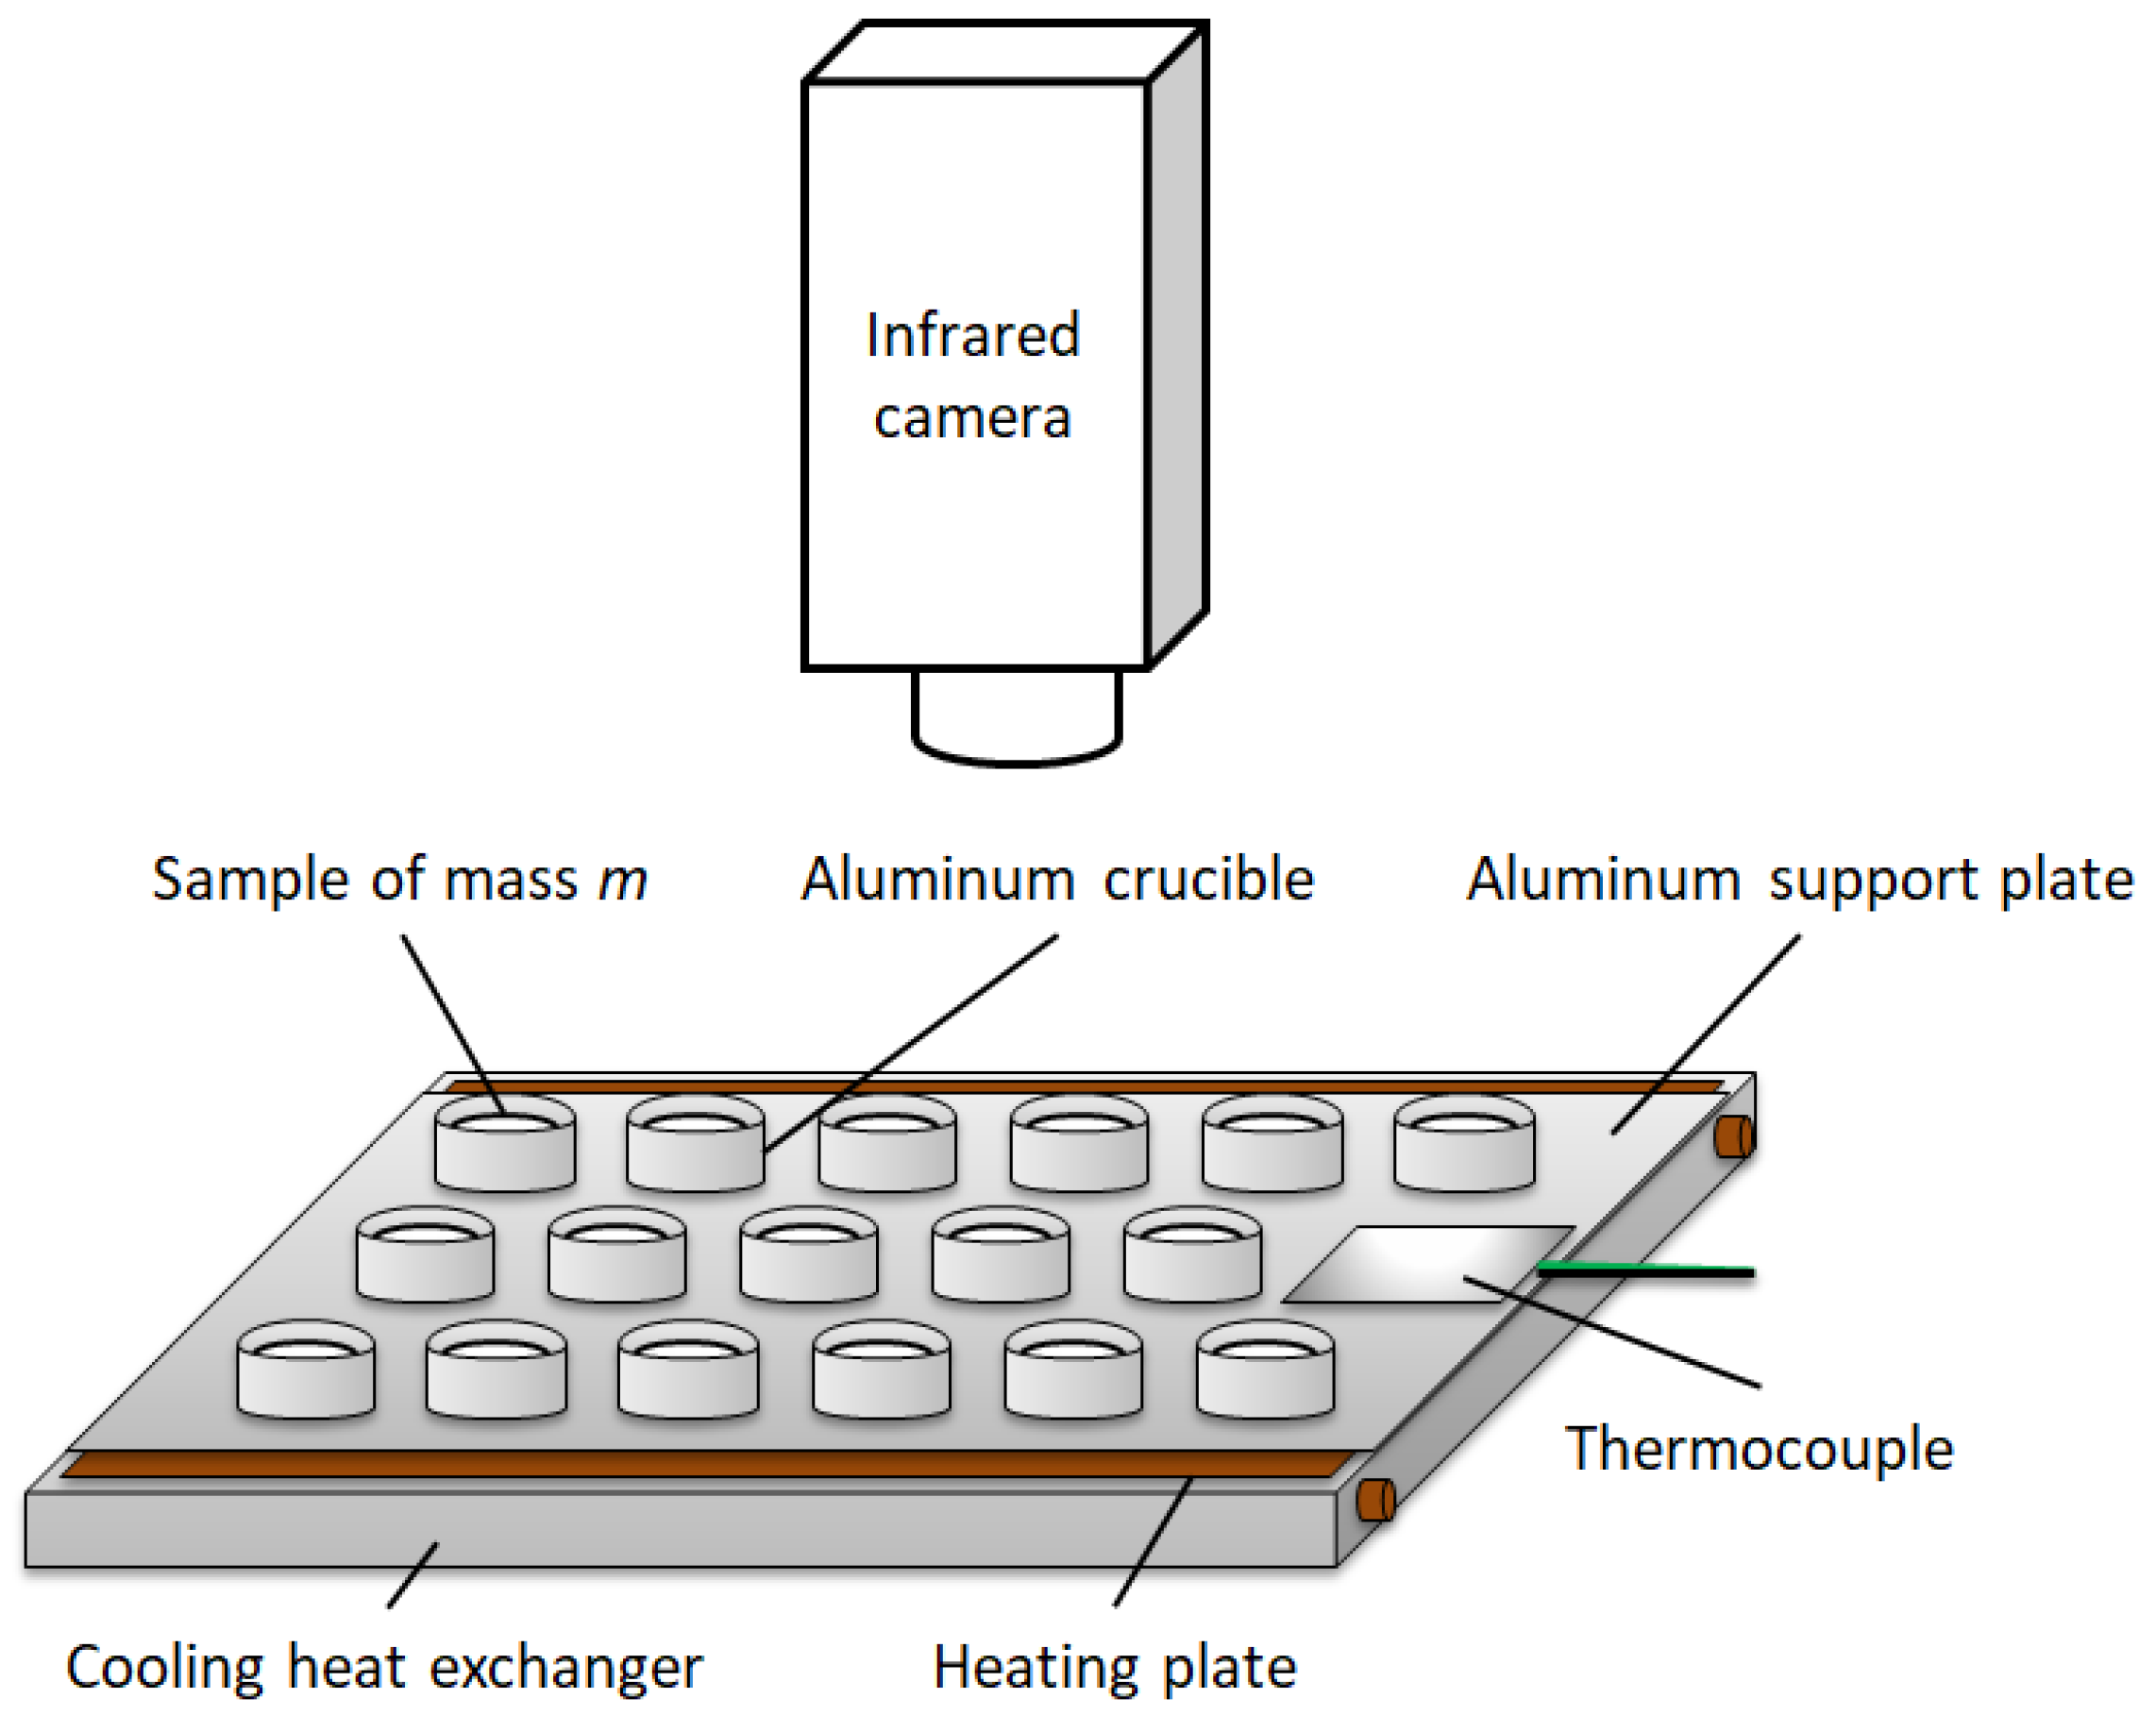
2.1. Principle of the IRT-Based Method for the Estimation of Melting Enthalpy
2.2. Materials
2.3. Validation
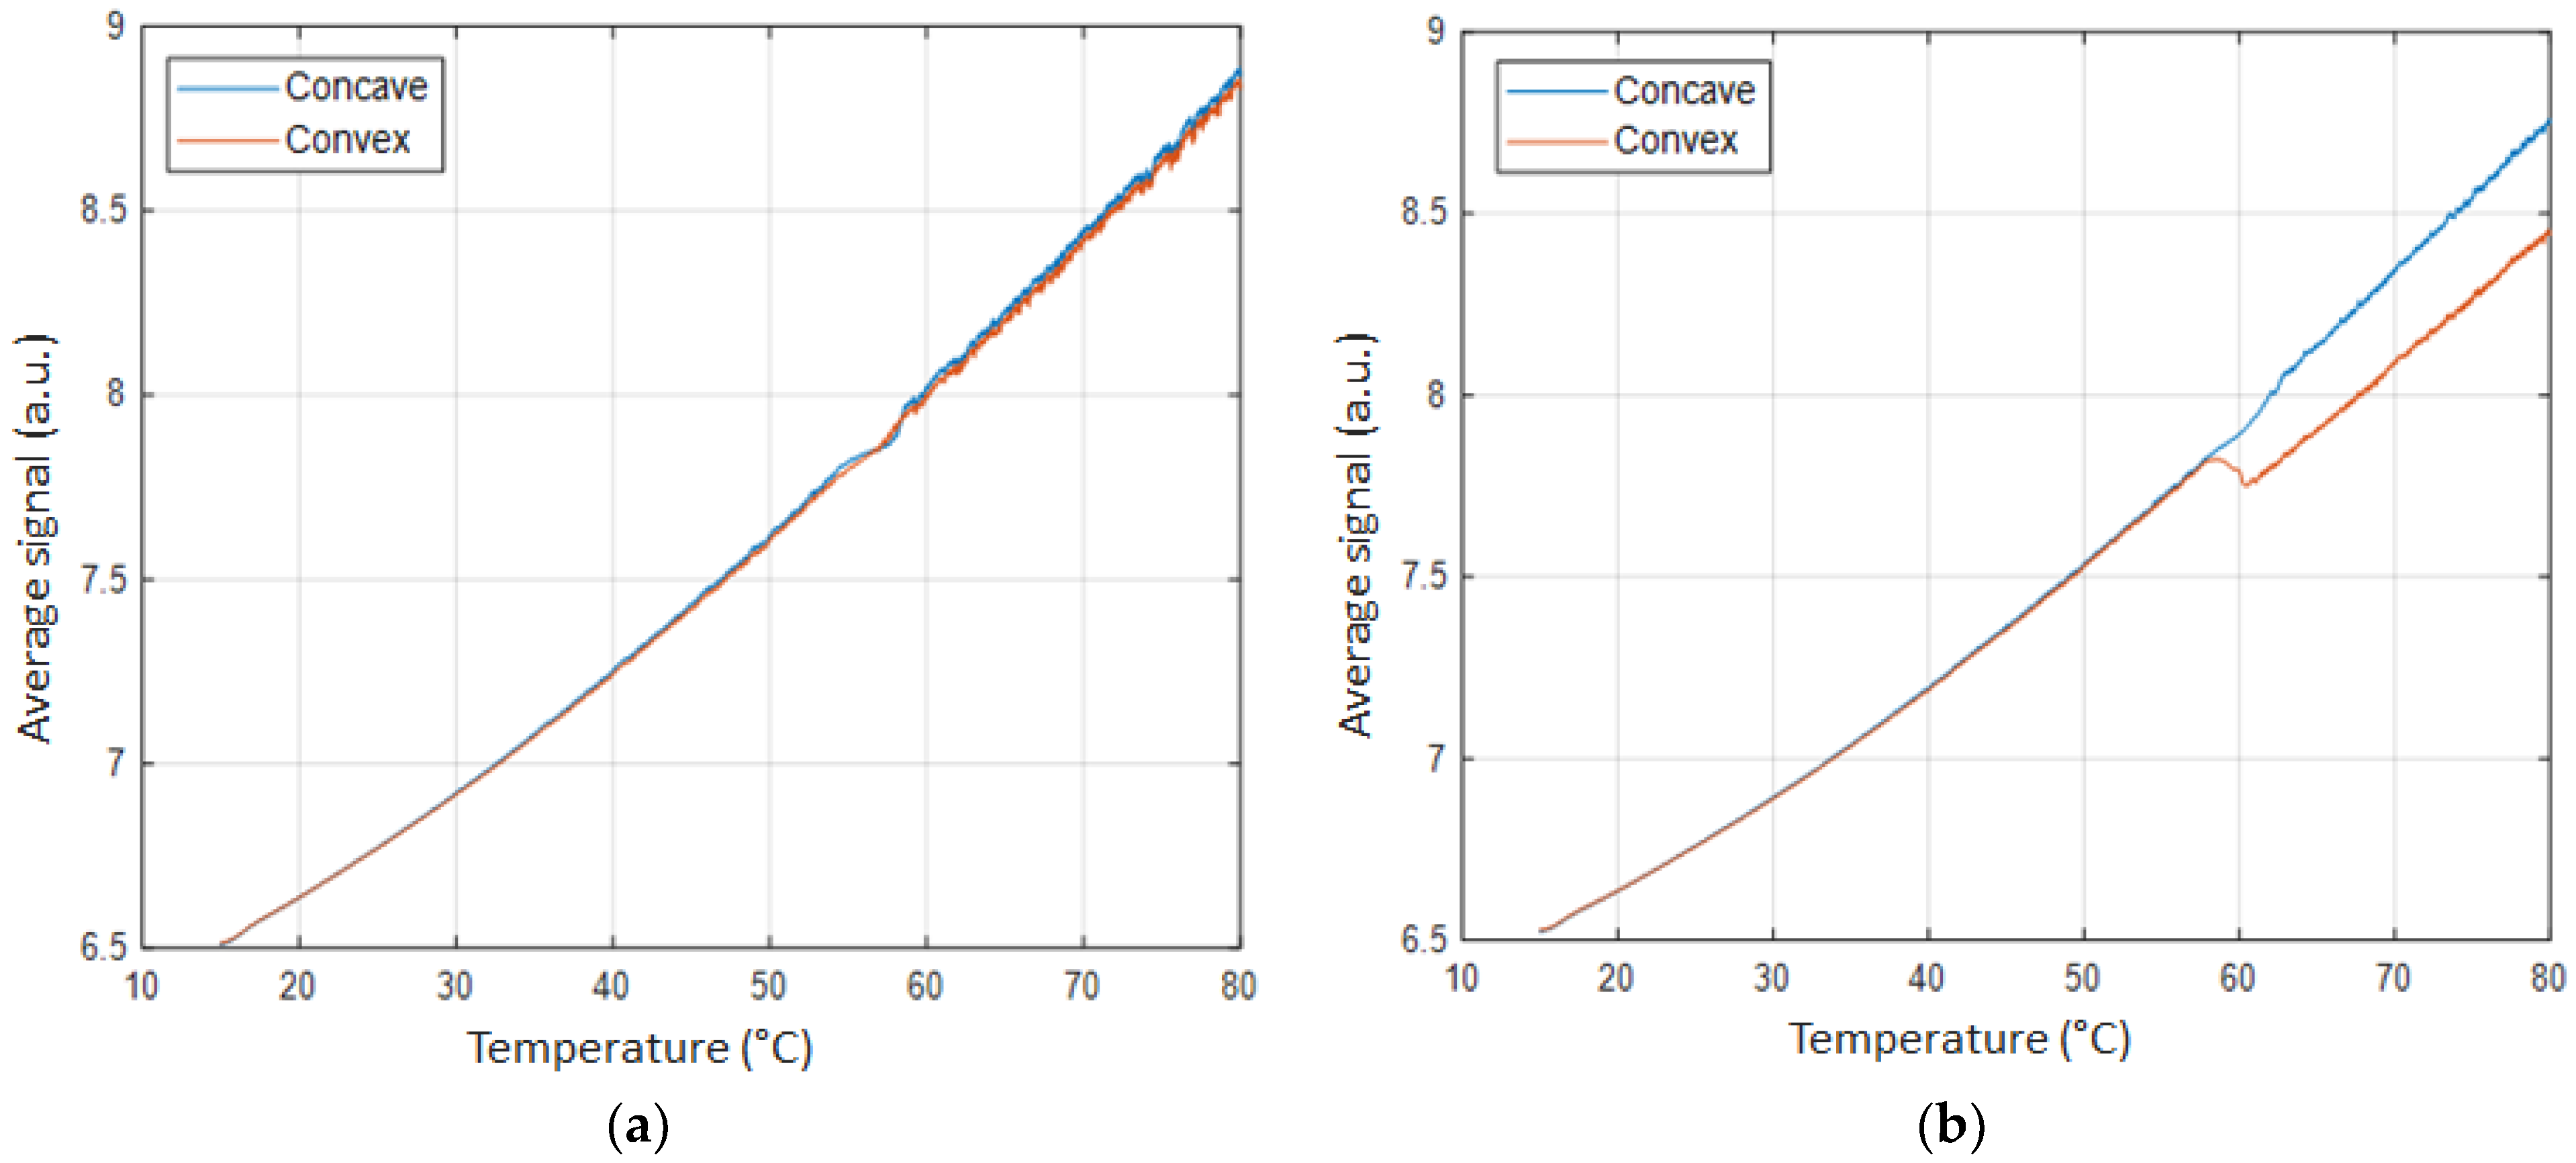
3. Results
4. Discussion
5. Conclusions
Author Contributions
Funding
Institutional Review Board Statement
Informed Consent Statement
Data Availability Statement
Conflicts of Interest
Appendix A
References
- Meola, C.; Carlomagno, G.M. Recent Advances in the Use of Infrared Thermography. Meas. Sci. Technol. 2004, 15, R27–R58. [Google Scholar] [CrossRef]
- Santangelo, P.E.; Allesina, G.; Bolelli, G.; Lusvarghi, L.; Matikainen, V.; Vuoristo, P. Infrared Thermography as a Non-Destructive Testing Solution for Thermal Spray Metal Coatings. J. Therm. Spray Tech. 2017, 26, 1982–1993. [Google Scholar] [CrossRef]
- Usamentiaga, R.; Venegas, P.; Guerediaga, J.; Vega, L.; Molleda, J.; Bulnes, F.G. Infrared Thermography for Temperature Measurement and Non-Destructive Testing. Sensors 2014, 14, 12305–12348. [Google Scholar] [CrossRef] [Green Version]
- Meola, C.; Carlomagno, G.M.; Giorleo, L. The Use of Infrared Thermography for Materials Characterization. J. Mater. Process. Technol. 2004, 155–156, 1132–1137. [Google Scholar] [CrossRef]
- Boccardi, S.; Boffa, N.D.; Carlomagno, G.M.; Maio, L.; Meola, C.; Ricci, F. Infrared Thermography and Ultrasonics to Evaluate Composite Materials for Aeronautical Applications. J. Phys. Conf. Ser. 2015, 658, 012007. [Google Scholar] [CrossRef]
- Chrysochoos, A. Infrared Thermography Applied to the Analysis of Material Behavior: A Brief Overview. Quant. InfraRed Thermogr. J. 2012, 9, 193–208. [Google Scholar] [CrossRef] [Green Version]
- Godin, A.; Palomo del Barrio, E.; Dauvergne, J.L.; Azaiez, M. A New Microscope Based on Infrared Thermography for Composite Materials Microstructure Retrieval. Int. Rev. Mech. Eng. 2012, 6, 209–217. [Google Scholar]
- Godin, A.; Duquesne, M.; Palomo del Barrio, E.; Morikawa, J. Analysis of Crystal Growth Kinetics in Undercooled Melts by Infrared Thermography. Quant. InfraRed Thermogr. J. 2015, 12, 237–251. [Google Scholar] [CrossRef]
- Duquesne, M.; Godin, A.; Palomo del Barrio, E.; Daranlot, J. Experimental Analysis of Heterogeneous Nucleation in Undercooled Melts by Infrared Thermography. Quant. InfraRed Thermogr. J. 2015, 12, 112–126. [Google Scholar] [CrossRef]
- Godin, A.; Palomo del Barrio, E.; Morikawa, J.; Duquesne, M. Microscopic Infrared Thermography for Fast Estimation of the Thermal Properties of Thin Films. J. Appl. Phys. 2018, 124, 085111. [Google Scholar] [CrossRef]
- Palomo Del Barrio, E.; Cadoret, R.; Daranlot, J.; Achchaq, F. Infrared Thermography Method for Fast Estimation of Phase Diagrams. Thermochim. Acta 2016, 625, 9–19. [Google Scholar] [CrossRef]
- Palomo Del Barrio, E.; Cadoret, R.; Daranlot, J.; Achchaq, F. New Sugar Alcohols Mixtures for Long-Term Thermal Energy Storage Applications at Temperatures between 70 °C and 100 °C. Sol. Energy Mater. Sol. Cells 2016, 155, 454–468. [Google Scholar] [CrossRef]
- Duquesne, M.; Mailhé, C.; Ruiz-Onofre, K.; Achchaq, F. Biosourced Organic Materials for Latent Heat Storage: An Economic and Eco-Friendly Alternative. Energy 2019, 188, 116067. [Google Scholar] [CrossRef]
- Mailhé, C.; Duquesne, M.; Mahroug, I.; del Barrio, E.P. Improved Infrared Thermography Method for Fast Estimation of Complex Phase Diagrams. Thermochim. Acta 2019, 675, 84–91. [Google Scholar] [CrossRef]
- Mailhé, C.; Duquesne, M.; Palomo del Barrio, E.; Azaiez, M.; Achchaq, F. Phase Diagrams of Fatty Acids as Biosourced Phase Change Materials for Thermal Energy Storage. Appl. Sci. 2019, 9, 1067. [Google Scholar] [CrossRef] [Green Version]
- Mailhé, C.; Duquesne, M. Performance Analysis of the Infrared Thermography Method for Complex Phase Diagrams Estimation. J. Therm. Anal. Calorim. 2020. [Google Scholar] [CrossRef]
- Mailhé, C.; Duquesne, M. A Fast and Low-Cost Dynamic Calorimetric Method for Phase Diagram Estimation of Binary Systems. J. Therm. Anal. Calorim. 2021, 143, 587–598. [Google Scholar] [CrossRef]
- Höhne, G.W.H.; Hemminger, W.; Flammersheim, H.-J. Differential Scanning Calorimetry: An Introduction for Practitioners; Springer: Berlin/Heidelberg, Germany, 1996; ISBN 978-3-662-03302-9. [Google Scholar]
- Kemp, R.B. Handbook of Thermal Analysis and Calorimetry: From Macromolecules to Man; Elsevier: Amsterdam, The Netherlands, 1999; ISBN 978-0-08-053569-2. [Google Scholar]
- Sarge, S.M.; Höhne, G.; Hemminger, W. Calorimetry: Fundamentals, Instrumentation and Applications; Wiley-VCH Ltd.: Hoboken, NJ, USA, 2014; ISBN 978-3-527-64936-5. [Google Scholar]
- Vollmer, M.; Möllmann, K.-P. Infrared Thermal Imaging: Fundamentals, Research and Applications; Wiley-VCH Ltd.: Hoboken, NJ, USA, 2018; ISBN 978-3-527-41351-5. [Google Scholar]
- Mailhe, C. Etablissement du Diagramme de Phases de Systèmes de Matériaux par Thermographie Infrarouge. Ph.D. Thesis, Université de Bordeaux, Bordeaux, France, 2020. [Google Scholar]
- Zhang, Z.; Yuan, Y.; Zhang, N.; Cao, X. Thermophysical Properties of Some Fatty Acids/Surfactants as Phase Change Slurries for Thermal Energy Storage. J. Chem. Eng. Data 2015, 60, 2495–2501. [Google Scholar] [CrossRef]
- Kahwaji, S.; Johnson, M.B.; Kheirabadi, A.C.; Groulx, D.; White, M.A. Fatty Acids and Related Phase Change Materials for Reliable Thermal Energy Storage at Moderate Temperatures. Sol. Energy Mater. Sol. Cells 2017, 167, 109–120. [Google Scholar] [CrossRef]
- Zhang, J.-J.; Zhang, J.-L.; He, S.-M.; Wu, K.-Z.; Liu, X.-D. Thermal Studies on the Solid–Liquid Phase Transition in Binary Systems of Fatty Acids. Thermochim. Acta 2001, 369, 157–160. [Google Scholar] [CrossRef]
- Cedeño, F.O.; Prieto, M.M.; Espina, A.; García, J.R. Measurements of Temperature and Melting Heat of Some Pure Fatty Acids and Their Binary and Ternary Mixtures by Differential Scanning Calorimetry. Thermochim. Acta 2001, 369, 39–50. [Google Scholar] [CrossRef]
- Costa, M.C.; Rolemberg, M.P.; Boros, L.A.D.; Krähenbühl, M.A.; de Oliveira, M.G.; Meirelles, A.J.A. Solid−Liquid Equilibrium of Binary Fatty Acid Mixtures. J. Chem. Eng. Data 2007, 52, 30–36. [Google Scholar] [CrossRef]
- Hobi Bordón Sosa, F.; Dorighello Carareto, N.D.; Maximo, G.J.; Meirelles, A.J.d.A.; Costa, M.C. Solid–Liquid Equilibrium of Binary Systems Containing Fatty Acids and Fatty Alcohols Using Differential Scanning Calorimetry. J. Chem. Eng. Data 2019, 64, 5017–5027. [Google Scholar] [CrossRef]
- Maximo, G.J.; Carareto, N.D.D.; Costa, M.C.; dos Santos, A.O.; Cardoso, L.P.; Krähenbühl, M.A.; Meirelles, A.J.A. On the Solid–Liquid Equilibrium of Binary Mixtures of Fatty Alcohols and Fatty Acids. Fluid Phase Equilib. 2014, 366, 88–98. [Google Scholar] [CrossRef]
- Han, L.; Ma, G.; Xie, S.; Sun, J.; Jia, Y.; Jing, Y. Thermal Properties and Stabilities of the Eutectic Mixture: 1,6-Hexanediol/Lauric Acid as a Phase Change Material for Thermal Energy Storage. Appl. Therm. Eng. 2017, 116, 153–159. [Google Scholar] [CrossRef]
- Adriaanse, N.; Dekker, H.; Coops, J. Some Physical Constants of Normal Saturated Fatty Acids and Their Methyl Esters. Recl. Trav. Chim. Pays-Bas 1964, 83, 557–572. [Google Scholar] [CrossRef]
- Dimaano, M.N.R.; Watanabe, T. Performance Investigation of the Capric and Lauric Acid Mixture as Latent Heat Energy Storage for a Cooling System. Sol. Energy 2002, 72, 205–215. [Google Scholar] [CrossRef]
- Kauranen, P.; Peippo, K.; Lund, P.D. An Organic PCM Storage System with Adjustable Melting Temperature. Sol. Energy 1991, 46, 275–278. [Google Scholar] [CrossRef]
- Moreno, E.; Cordobilla, R.; Calvet, T.; Cuevas-Diarte, M.A.; Gbabode, G.; Negrier, P.; Mondieig, D.; Oonk, H.A.J. Polymorphism of Even Saturated Carboxylic Acids from N-Decanoic to n-Eicosanoic Acid. New J. Chem. 2007, 31, 947. [Google Scholar] [CrossRef] [Green Version]
- Peippo, K.; Kauranen, P.; Lund, P.D. A Multicomponent PCM Wall Optimized for Passive Solar Heating. Energy Build. 1991, 17, 259–270. [Google Scholar] [CrossRef]
- Sarı, A.; Kaygusuz, K. Thermal and Heat Transfer Characteristics in a Latent Heat Storage System Using Lauric Acid. Energy Conv. Manag. 2002, 43, 2493–2507. [Google Scholar] [CrossRef]
- Sarı, A. Thermal Characteristics of a Eutectic Mixture of Myristic and Palmitic Acids as Phase Change Material for Heating Applications. Appl. Therm. Eng. 2003, 23, 1005–1017. [Google Scholar] [CrossRef]
- Schaake, R.C.F.; van Miltenburg, J.C.; de Kruif, C.G. Thermodynamic Properties of the Normal Alkanoic Acids I. Molar Heat Capacities of Seven Odd-Numbered Normal Alkanoic Acids. J. Chem. Thermodyn. 1982, 14, 763–769. [Google Scholar] [CrossRef]
- Schaake, R.C.F.; van Miltenburg, J.C.; de Kruif, C.G. Thermodynamic Properties of the Normal Alkanoic Acids II. Molar Heat Capacities of Seven Even-Numbered Normal Alkanoic Acids. J. Chem. Thermodyn. 1982, 14, 771–778. [Google Scholar] [CrossRef]
- Yan, Q. The Thermal Properties of Shape-Stabilized Fatty Acid Mixtures Used for Wallboard. Int. J. Sustain. Energy 2011, 30, 47–54. [Google Scholar] [CrossRef]
- Boettinger, W.J.; Kattner, U.R.; Moon, K.-W.; Perepezko, J. NIST Recommended Practice Guide: DTA and Heat-Flux DSC Measurements of Alloy Melting and Freezing; National Institute of Standards and Technology: Gaithersburg, MD, USA, 2006. [Google Scholar]
- Ke, H. Phase Diagrams, Eutectic Mass Ratios and Thermal Energy Storage Properties of Multiple Fatty Acid Eutectics as Novel Solid-Liquid Phase Change Materials for Storage and Retrieval of Thermal Energy. Appl. Therm. Eng. 2017, 113, 1319–1331. [Google Scholar] [CrossRef]
- Pielichowska, K.; Pielichowski, K. Phase Change Materials for Thermal Energy Storage. Prog. Mater. Sci. 2014, 65, 67–123. [Google Scholar] [CrossRef]
- Sarı, A. Eutectic Mixtures of Some Fatty Acids for Low Temperature Solar Heating Applications: Thermal Properties and Thermal Reliability. Appl. Therm. Eng. 2005, 25, 2100–2107. [Google Scholar] [CrossRef]
- Feldman, D.; Shapiro, M.M.; Banu, D.; Fuks, C.J. Fatty Acids and Their Mixtures as Phase-Change Materials for Thermal Energy Storage. Sol. Energy Mater. 1989, 18, 201–216. [Google Scholar] [CrossRef]


| Material (Acronym) | Formula | Supplier | Purity | M (g/mol) | (°C) | (kJ/mol) | |||
|---|---|---|---|---|---|---|---|---|---|
| IRT | DSC | [23,24,25,26,27,28,29,30,31,32,33,34,35,36,37,38,39,40] | DSC | [23,24,25,26,27,28,29,30,31,32,33,34,35,36,37,38,39,40] | |||||
| Capric acid (CA) | C10H20O2 | Alfa Aesar | 99% | 172.26 | 32.09 | 29.87 ± 0.19 | 22.15–32.13 | 27.90 ± 0.25 | 23.43–29.40 |
| Lauric acid (LA) | C12H24O2 | Acros Organics | 99% | 200.32 | 45.03 | 43.40 ± 0.11 | 42.44–45.29 | 36.24 ± 1.40 | 32.64–39.47 |
| Myristic acid (MA) | C14H28O2 | Acros Organics | 99% | 228.37 | 54.56 | 53.48 ± 0.04 | 55.23–55.58 | 43.67 ± 0.87 | 42.09–43.80 |
| Palmitic acid (PA) | C16H32O2 | Sigma-Aldrich | 99% | 256.43 | 62.89 | 62.14 ± 0.02 | 61.45–64.35 | 57.76 ± 1.52 | 46.02–54.83 |
| Stearic acid (SA) | C18H36O2 | Sigma-Aldrich | 98.5% | 284.48 | 70.45 | 68.95 ± 0.05 | 68.24–71.00 | 65.78 ± 0.31 | 57.74–68.44 |
| Literature [23,33,35,37,42,43,44,45] | DSC (This Work) | IRT (This Work) | ||||||
|---|---|---|---|---|---|---|---|---|
| (°C) | (J/g) | (°C) | (J/g) | (°C) | Case 1 | Case 2 | Case 3 | |
| (J/g) | (J/g) | (J/g) | ||||||
| LA+MA | 32.60–35.79 | 142.51–173.6 | 33.66 | 152.57 | 33.07 | 157.53 | 170.03 | 164.72 |
| LA+PA | 32.70–37.01 | 145–169.6 | 34.60 | 169.47 | 35.46 | 137.93 | 169.59 | 169.60 |
| LA+SA | 37.00–39.49 | 150–183 | 40.15 | 177.57 | 39.57 | 120.41 | 173.89 | 169.20 |
| MA+PA | 39.80–46.85 | 160.73–183.1 | 44.81 | 182.09 | 45.81 | 196.98 | 207.95 | 206.52 |
| MA+SA | 44.00–52.00 | 162–182.4 | 45.77 | 188.43 | 47.01 | 94.20 | 154.50 | 155.06 |
| PA+SA | 50.40–56.71 | 160–204.7 | 54.41 | 201.74 | 55.36 | 191.93 | 204.56 | 202.47 |
Publisher’s Note: MDPI stays neutral with regard to jurisdictional claims in published maps and institutional affiliations. |
© 2021 by the authors. Licensee MDPI, Basel, Switzerland. This article is an open access article distributed under the terms and conditions of the Creative Commons Attribution (CC BY) license (https://creativecommons.org/licenses/by/4.0/).
Share and Cite
Mailhé, C.; Duquesne, M.; Palomo del Barrio, E.; Godin, A. On the Use of Infrared Thermography for the Estimation of Melting Enthalpy. Appl. Sci. 2021, 11, 5915. https://doi.org/10.3390/app11135915
Mailhé C, Duquesne M, Palomo del Barrio E, Godin A. On the Use of Infrared Thermography for the Estimation of Melting Enthalpy. Applied Sciences. 2021; 11(13):5915. https://doi.org/10.3390/app11135915
Chicago/Turabian StyleMailhé, Clément, Marie Duquesne, Elena Palomo del Barrio, and Alexandre Godin. 2021. "On the Use of Infrared Thermography for the Estimation of Melting Enthalpy" Applied Sciences 11, no. 13: 5915. https://doi.org/10.3390/app11135915