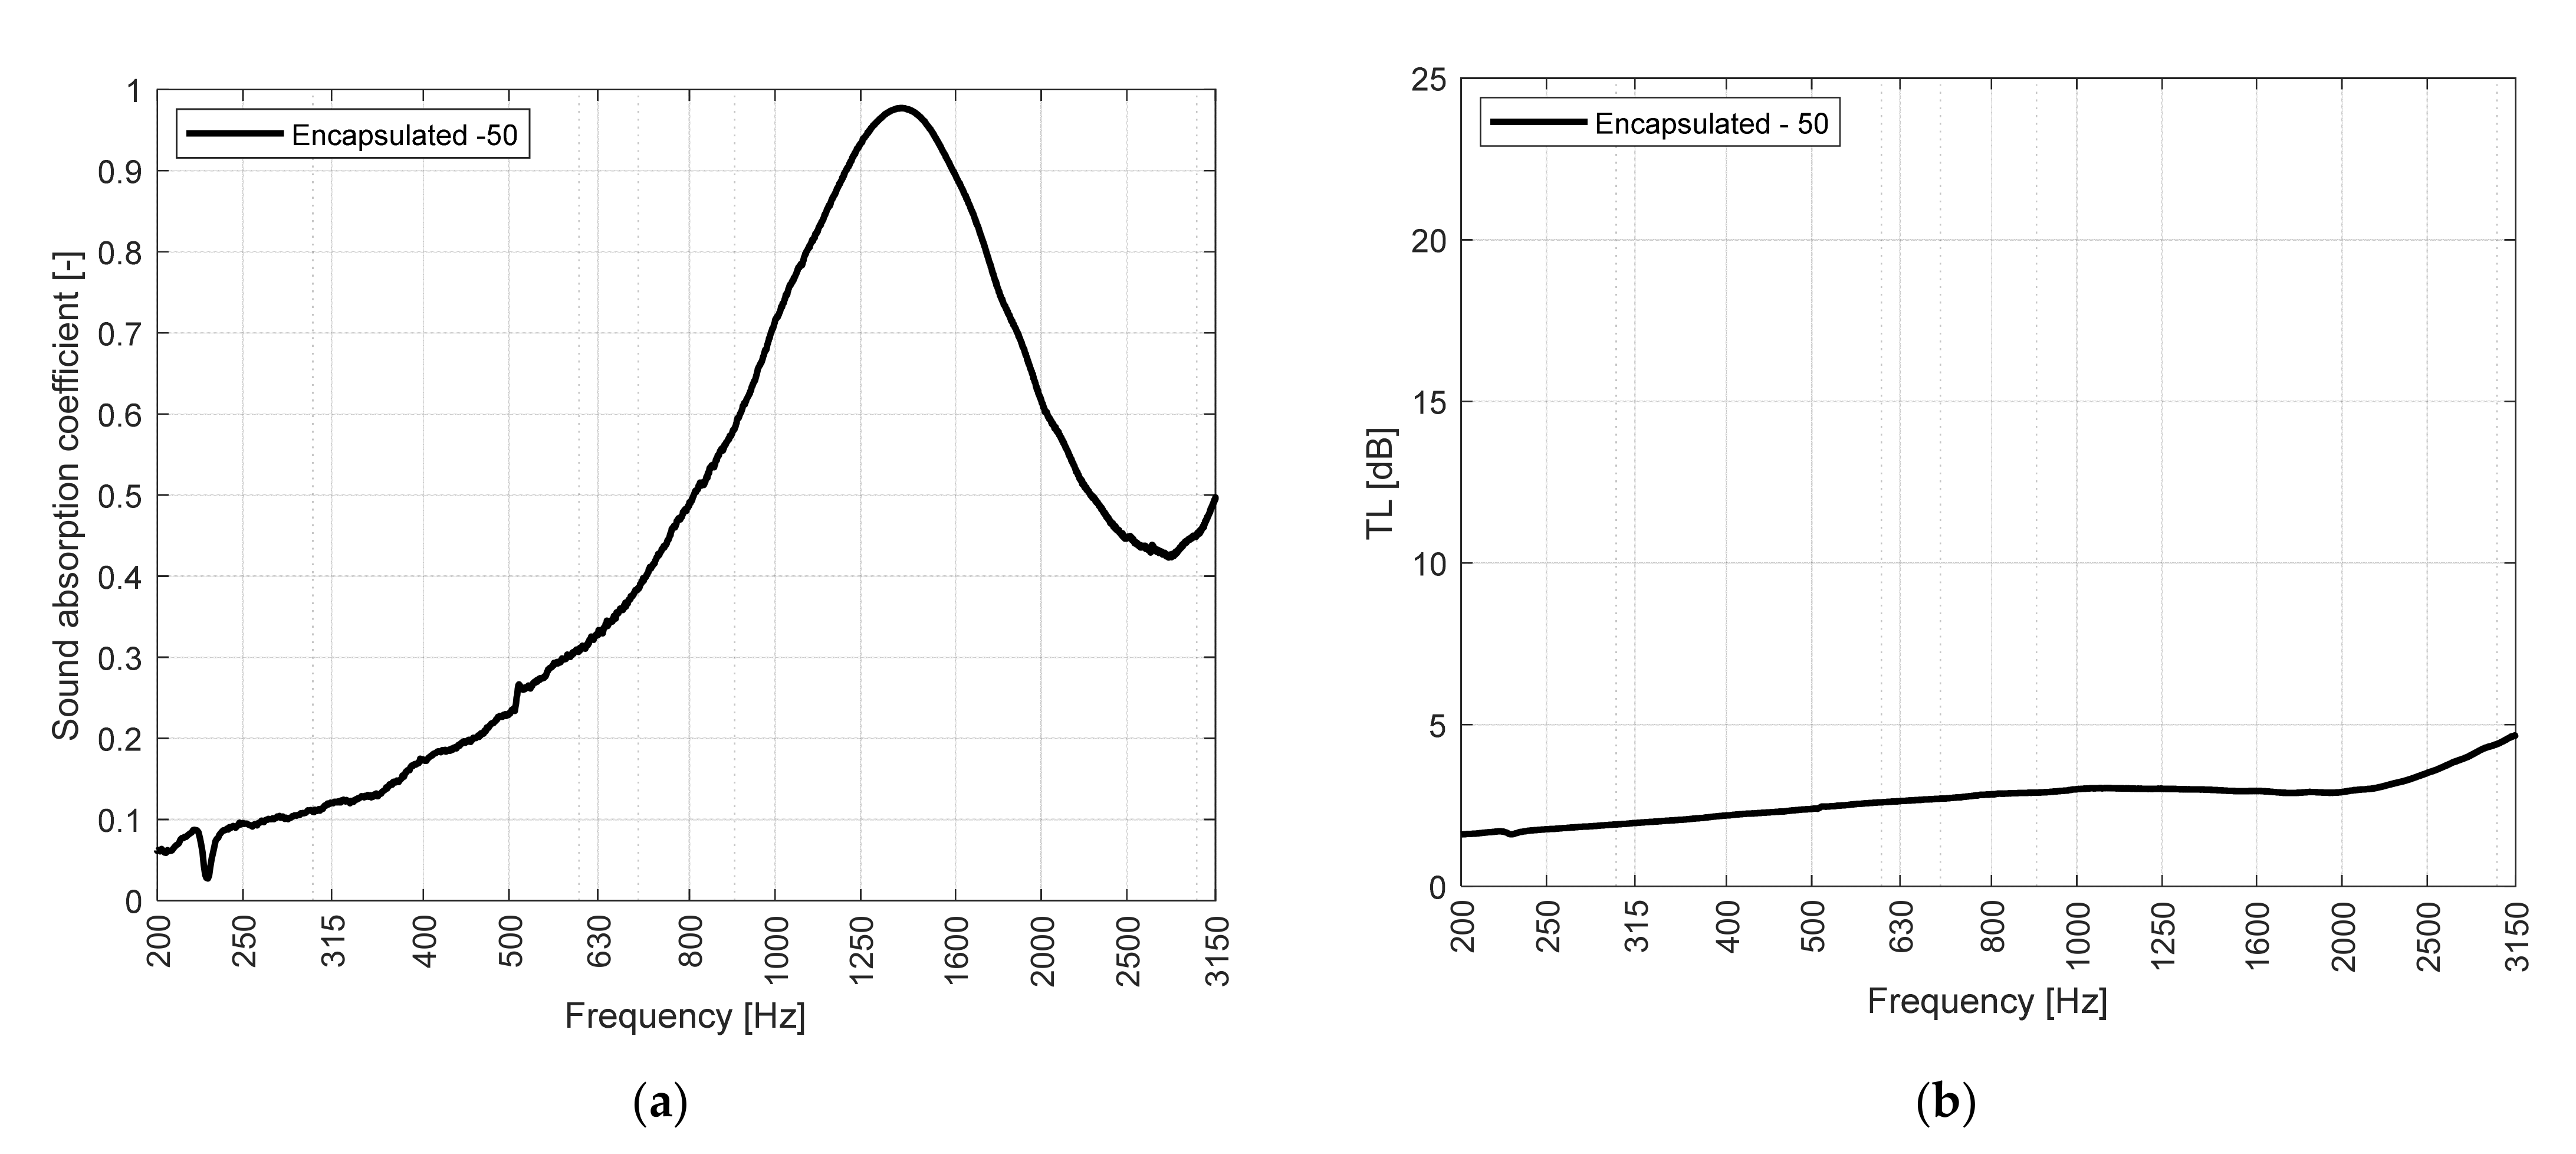
Abstract
From a circular economy perspective, the acoustic characterization of steelwork by-products is a topic worth investigating, especially because little or no literature can be found on this subject. The possibility to reuse and add value to a large amount of this kind of waste material can lead to significant economic and environmental benefits. Once properly analyzed and optimized, these by-products can become a valuable alternative to conventional materials for noise control applications. The main acoustic properties of these materials can be investigated by means of a four-microphone impedance tube. Through an inverse technique, it is then possible to derive some non-acoustic properties of interest, useful to physically characterize the structure of the materials. The inverse method adopted in this paper is founded on the Johnson–Champoux–Allard model and uses a standard minimization procedure based on the difference between the sound absorption coefficients obtained experimentally and predicted by the Johnson–Champoux–Allard model. The results obtained are consistent with other literature data for similar materials. The knowledge of the physical parameters retrieved applying this technique (porosity, airflow resistivity, tortuosity, viscous and thermal characteristic length) is fundamental for the acoustic optimization of the porous materials in the case of future applications.
1. Introduction
The steel industry is one of the main global economic sectors providing raw materials for a wide variety of manufacturing processes. During the various activities, a steel plant produces large amounts of waste under different forms. In recent decades, this type of industry is also trying to gradually leave the linear economy model and aim for the global and ambitious “zero waste” target [1], focusing its efforts on the development of innovative and sustainable production schemes. The emerging principle of the circular economy supports the reuse and recycling of industrial by-products, creating a symbiosis [2] which encourages collaboration and synergy with different sectors. The final goal is to develop new business opportunities through the conversion of waste into valuable raw materials or secondary materials exploitable in other sectors [3]. These activities allow the steel industry to reduce its environmental impacts: indeed, the reduction in waste materials can be ensured by providing an alternative solution to safe and environmentally friendly disposal of polluting industrial wastes and by avoiding the extraction of new natural resources. In this way, it is possible to achieve both environmental and economic benefits for all the industries involved in the symbiosis.
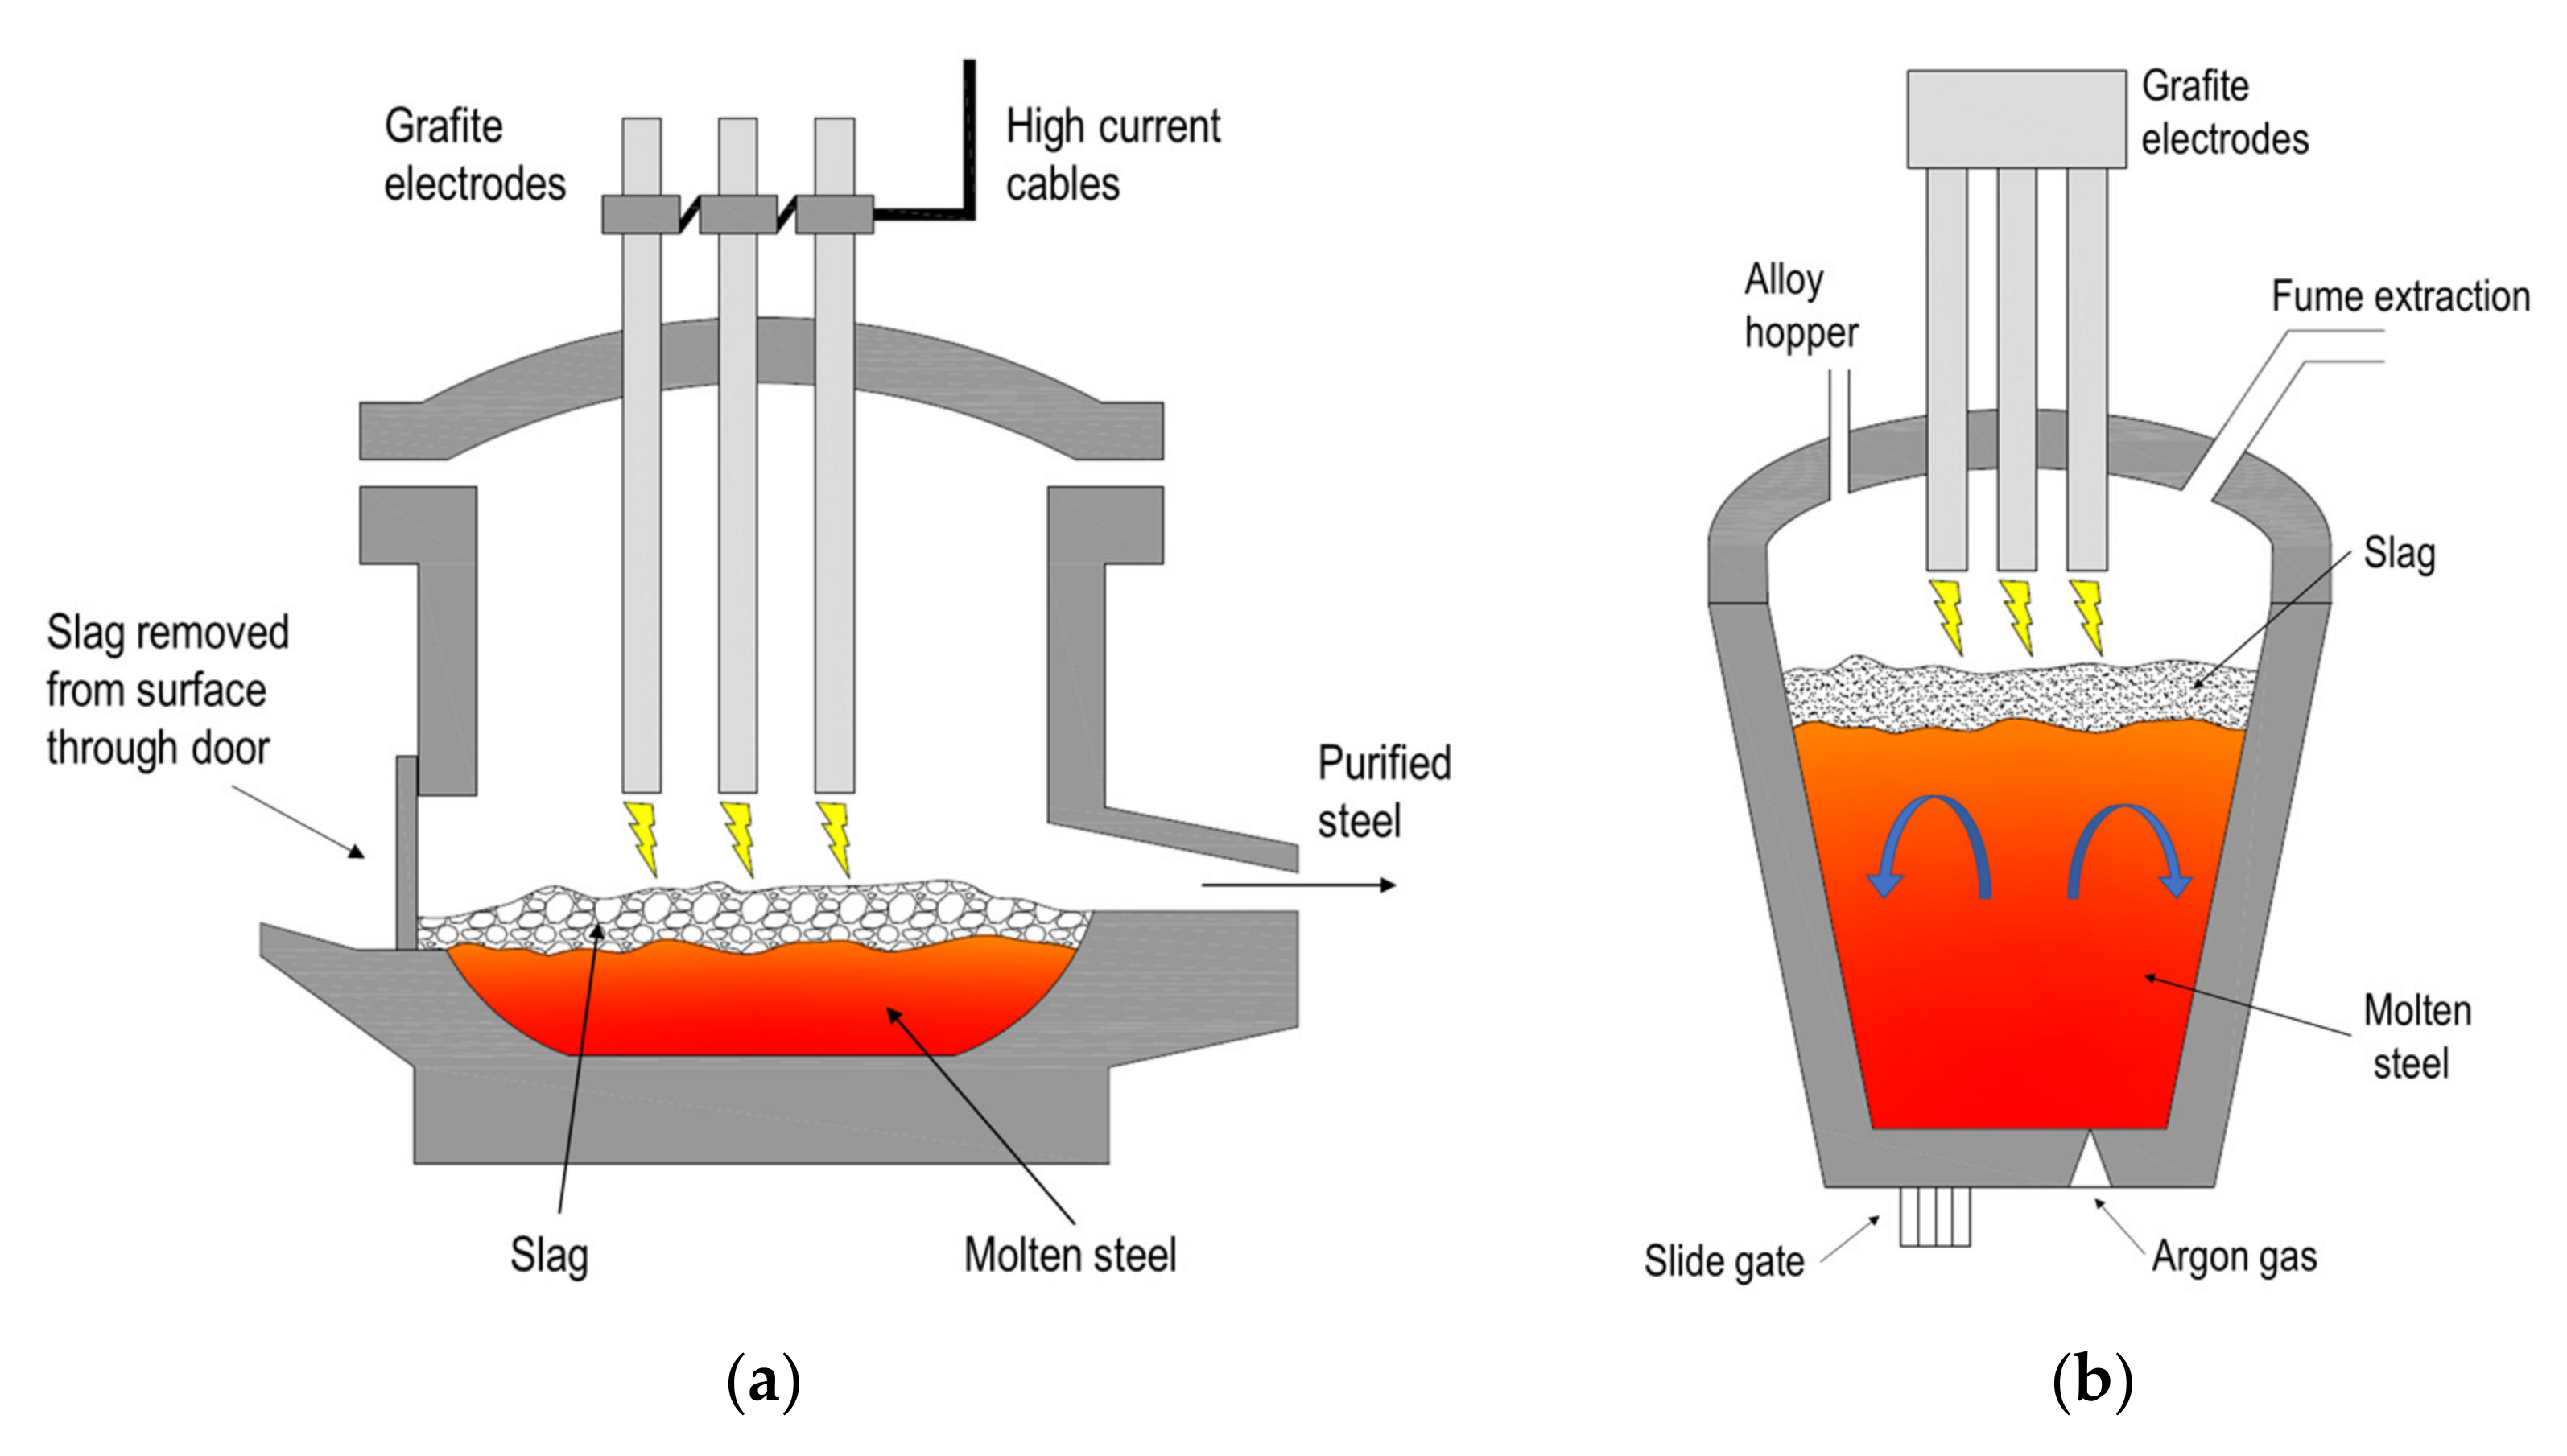
The main waste product of the steel industry is represented by slags. There are different types of slag, depending on the type of furnaces, raw materials and process adopted during production. The slag deriving from melting the scrap iron by an electric arc furnace (EAF—Figure 1a) is generically defined as “black slag”. Such a type of waste material results from the oxidation of the scrap and includes impurities and compounds generated by the additives used to control the chemical processes. These elements form a layer that floats on top of the molten steel in the furnace, insulating the liquid part from the external environment and helping maintain the temperature inside the furnace at the right set-point. At the end of the process, the floating layer is collected and cooled down, resulting in “black slag”. The melted steel is then processed and refined in a ladle furnace (LF—Figure 1b). The slag deriving from this process is defined as “white dross”, or “white slag”, and has completely different chemical and physical properties if compared to the black slag.
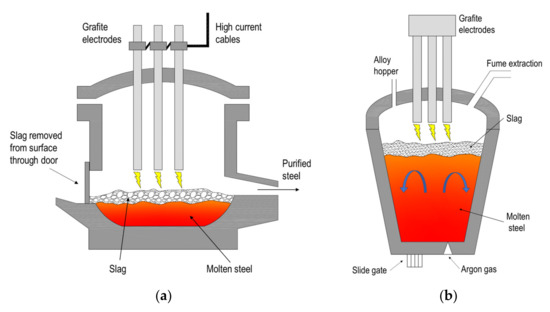
Figure 1.
Schematic drawings of EAF and LF furnaces: (a) EAF furnace; and (b) ladle furnace.
The two slag types are kept separate as they have a different chemical composition and must be treated differently. Black slag can be assimilated to natural effusive rocks of volcanic origin, takes on granular characteristics and mainly consists of a ternary mixture of calcium oxide (CaO), silicon dioxide (SiO2) and iron oxides (FeO), to which heavy metals and other components, in percentages, are mixed. The white dross chemically differs from the black slag, particularly for the content in iron oxides and calcium; therefore, this dross, after cooling, undergoes a transformation of the crystalline lattice which leads to the formation of a fine and lightweight material.
Some studies are actually investigating the physical properties and the environmental compatibility of these materials, to establish the environmental impact of the slags and how to treat them. Depending on the application field, several studies have been carried out to characterize steel slags. One of the first practical applications of steel slags outside the steel production cycle is as sustainable (alternative) aggregates in pavement layers for road construction. They have been used not only for unbound layers, like road bases and sub-bases, but also for bituminous mixtures in surface layers [4]. In [5], the EAF steel slag was preliminarily investigated from chemical, leaching, physical and mechanical points of view. The bituminous conglomerates have also been characterized to verify their potential application in high performance asphalt concretes for road and airport pavements. The comparison with the corresponding traditional natural aggregates shows that using slags as coarse under-pavement material brings both technical and environmental advantages [5,6]: the mixtures with EAF slag improve the mechanical properties and prevent the depletion of raw materials.
Several studies also investigated the suitability of steel slags for civil engineering applications in cement-based materials. In particular, they were used for replacing natural sand [7] in the production of concrete [8,9,10,11,12,13], as armor stones for hydraulic engineering constructions [14,15] (during the restoration of marine environments and stabilization of shores), and finally, as an agricultural fertilizer. In [2], steel slags were investigated as to help in the removal of harmful elements and wastewater treatment. More recently, slags have been used as green resource in ceramic tile production and for biomedical applications.
The development of innovative sustainable solutions, by means of already existing or new technologies, is a goal that the steel industry is willing to pursue in order to further reduce its environmental impacts. Recently, some critical environmental aspects emerged regarding the use of steel slags [2,14]. The concerns are about volume instability and leaching behavior, the latter being a crucial aspect for environmental considerations, especially in terms of possible water and soil pollution caused by the release of heavy metals. Such aspects must be deeply investigated and solved, depending on the characteristics of the specific chemical composition of the recycled slag and the exposure to atmospheric elements.
The study reported in [16] aimed to find an inertization process for the recovery of steelwork slags and granite cutting waste as raw materials for the production of rockwool, which is a good thermal insulator and acoustic absorber for the construction and automotive sectors. It was found that the partial replacement of traditional raw materials does not influence the thermal insulation and fireproof properties of rockwool.
In [17,18], a recent improvement consisting of a new production method was introduced: high-pressure cold air is passed through the molten slag and the result is a material consisting of slag granules characterized by an almost spherical shape. The studies provide a comprehensive experimental characterization, in terms of fundamental and durability properties. The outcomes of both studies confirmed that a fine aggregate of spheric slags is a promising and advantageous alternative to natural sand in concrete pavement, also in terms of workability, water content and cement mechanical requirements.
Granular materials are emerging as an interesting alternative to the more popular and conventional sound absorbers. This trend is also encouraged by the large amount of industrial waste or by-products available in granular shape. If properly treated, these materials could become a valuable “second raw” resource, instead of using them as waste material for landfill, with all the related costs in terms of money and environmental impact. In this way, these materials can re-enter the production cycle and can be addressed in different application fields. Of course, this depends on how much their properties and potentialities are investigated and optimized. In this perspective, the steel industry is continuing its path towards the “zero waste” and circular economy goals by funding studies on the waste reuse and sustainable recycling and developing new technological solutions in an effort to find new fields of application. For instance, the traditional mineral wool production process can be applied to steelwork slag: by means of spin dryers and a high-speed air flow, the white dross molten slag forms long fibers and a sort of wool that could represent a partial or complete substitute to the traditional rockwool.
This paper aims to analyze the acoustic behavior of some steelwork waste materials. In particular, slags shaped as wool, granules and spheres. As previously mentioned, the literature describes many studies focused on the investigation of the chemical, mechanical and thermal properties of steelwork slags, focusing on their reuse for various outcomes, especially when combined with other materials and mixtures, such as cement, concrete and soils. The novelty of the present study lies in the fact that, to the knowledge of the authors, steelwork slags have never been acoustically characterized before, especially in the form of wool, granules or spheres. It can be highlighted that the process adopted to obtain the spheres is relatively recent. Once the acoustic properties of these waste slags are obtained, the aim is to evaluate and optimize them as a function of the specific noise control application at hand modifying their non-acoustical parameters. Their acoustic characterization will be performed by means of a four-microphone impedance tube. This technique allows one to obtain the complex acoustical properties of the tested samples. This study will mainly be focused on the sound absorption properties of the slags. However, the sound transmission loss (TL) will also be reported for the sake of completeness and because it is included in the acoustic properties retrieved from the four-microphone impedance tube method. Finally, the Johnson–Champoux–Allard (JCA) model will be employed to better understand the relations between the acoustic behavior and the microstructure of the investigated materials. In particular, this theoretical model was based on the knowledge of five intrinsic properties of the material. Such properties are usually determined using specific laboratory equipment. In order to have a rough estimation of these parameters, a well-established inverse characterization method was applied to find the main non-acoustic characteristics of the materials.
The paper is organized as follows: Section 2 describes the samples analyzed and the experimental set up, including the laboratory equipment, providing the methodology for the experimental and analytical investigation; in Section 3, the experimentally obtained results are reported and discussed, including the comparison with the predicted results; finally, Section 4 draws the conclusions and highlights future research directions/perspectives.
2. Materials and Methods
2.1. Porous Materials
Porous materials are the most used sound-absorbing materials in many engineering and industrial applications. The Biot theory [19] describes how acoustic and elastic waves propagate and dissipate energy inside a porous medium characterized by air-saturated open-cell structures. When excited by a sound wave, the solid skeleton of the material can be considered as acoustically rigid (i.e., motionless) over a wide frequency range. Consequently, the compression and shear waves in the solid phase can be neglected. Thus, only a compression wave is able to propagate in the fluid phase and the porous material can be assumed to behave like an equivalent fluid. The absorption mechanism is possible thanks to the structure of the porous medium: it is made by a large number of small pores that are interconnected with each other and with the external air, thus allowing the sound wave to enter and propagate within the cavities. During the propagation process, the viscosity of air in the pores causes viscous losses. The conversion of sound energy in internal energy and the subsequent dissipation caused by the viscosity of air enables obtaining a certain sound absorption [20].
Recently, increasing interest has emerged in granular porous materials [20,21,22,23,24], considered to be a promising alternative to the more traditional fibrous or foam sound absorbers, thanks to their advantage of merging a good sound absorption with interesting mechanical properties and low production costs [25,26].
Granular materials are made of assemblies of particles that can have the same or different shape and diameter. The grains, that can be hollow, porous or solid, represent the rigid frame of the medium while the fluid (i.e., air), saturating the interconnected cavities, can be assumed as an equivalent homogeneous fluid, characterized by two effective (or equivalent) properties: the equivalent dynamic density ρeq and equivalent dynamic bulk modulus Keq. At the macroscopic level, the viscous and thermal losses that occur in porous media and are responsible of the energy sound dissipation, can be related to the so-called transport (or non-acoustic or macroscopic) parameters: depending on the model chosen to characterize the acoustic performance of the investigated materials, these parameters differ in number and type. The appropriate knowledge of the relationships relating the acoustic behavior to the microstructure is of importance to customize the material for specific target frequencies. As effectively summarized and described in [27,28], these models can be mainly sorted into empirical, phenomenological, and semi-phenomenological/microstructural models. The Delany-Bazley model [29], designed for fibrous and cellular materials and based on airflow resistivity as relevant parameter, and the Miki model [30], which improved the previous one with the inclusion of two additional non-acoustic parameters, porosity and tortuosity, belong to the first group. The Voronina–Horoshenkov model [31], suitable for loose granular materials, is of empirical type as well, and considers the characteristic particle dimension and specific density of the grain base in addition to porosity and tortuosity. In [32], the authors assumed that pore geometry and pore size distribution obey an approximately statistical distribution. The Hamet–Berengier [33] and Attenborough [34] models are located in the phenomenological group: the first results useful for porous pavements, the latter for fibrous and granular materials and is based on five parameters (airflow resistivity, porosity, tortuosity, steady flow shape factor and dynamic shape factor). The Johnson–Champoux–Allard [35,36] and the Champoux–Stinson [37] models fall into the semi-phenomenological/microstructural group and involve five non-acoustic parameters: porosity, airflow resistivity and tortuosity are common to both, whereas the JCA model uses thermal and viscous characteristic lengths, and the Champoux–Stinson model considers viscous and thermal shape factors.
Subsequent implementations of the JCA model, such as the six-parameter Johnson–Champoux–Allard–Lafarge (JCAL) model or the eight-parameter model of Johnson–Champoux–Allard–Pride–Lafarge (JCAPL), involve more parameter, such as viscous and thermal tortuosities and permeabilities. Compared to the JCA model, they provide more precision at low frequencies [38]. In general, the more sophisticated models require more parameters and have better performances. Nevertheless, as a counterpart, they are more complex and demanding. All the aforementioned models require physical techniques to measure the non-acoustic parameters. Some of them involve expensive set-ups and even complex or destructive tests. Recently, multiscale analyses have been developed to compute non-acoustic parameters by means of numerical simulations at the microstructural level [21,22]. The multiscale approach, which establishes micro–macro relationships, bypasses the difficulty of direct measurements by developing specific finite-element analyses.
Each model has its application field, related to the type of material its development is based on, and respective limitations and advantages. More details about these aspects and model comparisons can be found in [21,22,25,27,28,39,40,41].
In this work, the five-parameter JCA model, better described in Section 2.2, was selected to perform the investigation: it is one of the most known generalized models, suitable for the accurate description of the wide-band sound propagation in porous materials. It is a robust model as it is applicable to the random geometry of porous materials, it allows rapid calculation and the five parameters, having a physical meaning, and can be directly measured by experiments. The JCA model, coupled with the four-microphone impedance tube and inversion methods, results to be a well-established and fast technique to investigate the intrinsic properties of a material, thus being a valuable alternative whenever direct measurements are not available.
2.2. JCA Model and Inverse Method
The JCA model assumes that rigid-frame open-cell porous media can be seen as an equivalent fluid of effective, or equivalent, dynamic density ρeq and equivalent dynamic bulk modulus Keq. These equivalent properties depend on five transport (or macroscopic–non-acoustic) parameters: open porosity Φ; static airflow resistivity σ; tortuosity αꝏ; viscous characteristic length Λ; and thermal characteristic length Λ’. These parameters are referred to the geometry of the porous material and describe the complexity of the porous network.
By definition, open porosity Φ is a measure of the volume fraction of air (Vfluid) in the total volume (Vtot) or the complement to unit of the ratio between the solid volume of the frame (Vsolid) on the total volume [42]:
Airflow resistivity expresses the resistance opposed to the airflow while passing through the material. It can be calculated as [42]
with Δp as the pressure drop across the medium, vairflow the amount of airflow passing through the material and d its thickness.
Tortuosity α∞ is an intrinsic property of the porous frame, related to the micro-geometry of the interlinked cavities. It is a dimensionless quantity that expresses the tortuous fluid paths through the porous material. It can be calculated as [42]
where v is the microscopic velocity of an ideal inviscid fluid within the pores and V a homogenization volume that expresses the volume of free fluid contained in the cavities. Tortuosity cannot be lower than 1.
Viscous characteristic length Λ is used to describe the viscous forces generating within the cavities at high frequencies and is related to the characteristic dimension of the connection between pores—particularly to the mean diameter of the hole connecting two adjacent cells, expressed in micrometers. It is given by [42]
where S is the specific surface that denotes the total contact surface between the frame and the pores.
Thermal characteristic length Λ’ describes the thermal exchanges between the solid frame and its saturating fluid at high frequencies and it is related to the pores dimension, especially to the mean diameter of the cell in micrometers; it can be expressed as [42,43]:
Alternatively, Λ and Λ’ can be calculated in function of the above-described parameters, as follows [38]:
where η is the viscosity of air, c1 and c2 are pore shape parameters, related, respectively, to the viscous and thermal dissipation, and they can assume values in the following ranges:
In the case of the granular material shaped in spheres, the calculation of the macroscopical parameters can be simplified in function of the porosity Φ and particle radius r as follows [21,23]:
where θ is expressed as
The purpose of the model is to finally obtain the acoustic behavior of the analyzed material, so the procedure to compute the sound absorption coefficient is made with the following steps:
- Once the five non-acoustic parameters (Φ, σ, αꝏ, Λ, Λ’) are obtained with one of the methods described below, it is possible to calculate the effective quantities ρeq and Keq;
- From the equivalent properties, one can predict the acoustic parameters: characteristic impedance Zc and complex wave number kc;
- From Zc and kc, the surface impedance Zs can be deduced;
- Finally, from Zs the normal incident sound absorption coefficient α can be calculated.
Starting from the five non-acoustic parameters, the equivalent properties ρeq and Keq can be computed as follows:
where ρ0 is the density of air, ω = 2πf is the angular frequency, η is the air viscosity, κ is the specific heat ratio and Np is Prandtl number of the saturating air.
Once the effective properties are obtained, it is possible to determine the complex acoustical parameters [44]; the characteristic impedance Zc:
and the complex wave number kc:
From these acoustic properties, the surface impedance Zs can be derived as follows:
Finally, the normal incidence sound absorption coefficient α is calculated as
where c0 is the speed of sound in air.
Classical methods to estimate the non-acoustic properties can be mainly classified in three groups [45]:
- 1.
- Direct methods, which allow obtaining the macroscopic parameters through direct measurements, thus requiring specific laboratory equipment or a dedicated setup for the determination of each single property;
- 2.
- Indirect methods, based on an acoustic model providing the relations and formulas that link the non-acoustic parameters to the acoustic measurements;
- 3.
- Inverse methods, consisting of an optimization problem where, once the difference between the experimentally measured and analytically estimated acoustic performances is minimized, the non-acoustic properties are progressively refined to an optimum value.
Indirect and inverse methods are based on impedance tube measurements or ultrasound measurements. The indirect method uses the equivalent properties, ρeq and Keq, obtained from measured Zc and kc values by using an impedance tube, and combine (17) with (18) as follows [45]:
At this point, it is possible to extract non-acoustic parameters from the limit behavior of the effective properties [44]:
where c is the speed of sound within the material.
Alternatively, in [45], a straightforward procedure is proposed where, in addition to the effective properties ρeq and Keq, the direct measurement of the open porosity Φ is necessary. In this case, the analytical solutions suitable to obtain the macroscopic parameters starting from the effective properties are reported below [45,46]:
where Ka = κP0/Φ, with P0 static pressure, is the equivalent adiabatic bulk modulus of the equivalent fluid.
Inverse methods generally need a surface acoustic property to start with, such as the sound absorption coefficient or surface impedance, both obtained from impedance tube measurements. The optimization process is based on the fact that the unknown parameters (in this paper, the five non-acoustic parameters) are adjusted so that the estimated surface acoustic property is as close as possible to the one experimentally obtained. The objective function is designed as a cost function where small values mean close agreement.
There are different optimizing methods: for instance, the group of global optimization techniques includes the simulated annealing [20], based on Monte Carlo iteration, and the class of evolutionary algorithms, such as genetic algorithms [42,44] and differential evolution algorithms [38]; moreover, there are standard minimization procedures, such as nonlinear best-fit [42,47], which is a direct search method that requires an initial trial guess of the parameters and operates within a research domain set on the lower and upper bound constraints for all the variables.
2.3. Experimental Characterization—Four-Microphone Impedance Tube
In this paragraph, the experimental set-up used for the characterization of the samples is described. The measurements of the acoustic properties have been performed by means of the four-microphone impedance tube method, following the process given by the ASTM E2611 standard [48]. On one end of the apparatus features, a loudspeaker generates a plane wave field inside the tube. The other end can be configured with two different types of termination (anechoic and/or reflecting), to perform the investigation with two different boundary conditions. Two microphones are mounted in front of the sample, at the “emitting side” of the tube, and the other two microphones are placed close to the sample at the “receiving side” of the tube.
A transfer matrix approach can be used, allowing to relate the particle velocities (ui) and the sound pressures (pi) at both surfaces of the tested sample. Denoting the front surface of the sample with the coordinate x = 0 and the back surface with x = d, the resulting transfer matrix can be written as
Thanks to the comparison between the signals measured by the four microphones, it is possible to apply the decomposition technique: referring to Figure 2, the upstream and downstream sound field can be distinguished in two forward travelling waves (A and C) and two backward travelling waves (B and D).

Figure 2.
Schematic drawing of a four-microphone impedance tube.
The wave components A–D represent the complex amplitudes of the incident and reflected waves on both sides of the sample and can be derived from the complex transfer functions Hi,ref measured between the -ith microphone (i = 1,…, 4) and the reference (ref) microphone. In this study, the first microphone was selected as the reference microphone, but generally any of the four microphones can be chosen for this role. At this point, an interchanging procedure must be applied between the transducers to correct the measured transfer functions for amplitude and phase mismatches. Once the corrected transfer functions are obtained by dividing the measured transfer functions by relative correction transfer functions, the four components A, B, C and D can be obtained. These coefficients are used for the derivation of the transfer matrix terms. Pressures and particle velocities at both sides of the sample can be determined in terms of incident and reflected plane wave components. In the case of geometrically symmetric specimens, since the physical properties are the same on either side, reciprocity and symmetry can be applied and a single set of measurements is sufficient to characterize the material. The acoustical properties of the sample can thus be calculated as a function of the transfer matrix elements, the acoustic impedance of air, the sample thickness and the wavenumber in air. In particular, the following properties are obtained:
- -
- Normal incidence sound absorption coefficient, α;
- -
- Normal incidence sound transmission loss, TL;
- -
- Propagation wavenumber inside the material, kc;
- -
- Characteristic impedance inside the material, Zc.
The Applied Acoustic Laboratory impedance tube at the University of Brescia is composed of two 1200 mm long-segments, with an internal diameter of 46 mm, determining a cross-section that ensures that the plane-wave assumption is verified up to approximately 3700 Hz. The loudspeaker is installed in an isolated and sealed volume at the source endpoint of the tube. Through the connection to the generator of a multichannel analyzer, a wide-band white noise test signal (50 Hz–5 kHz) is created inside the tube. As the samples tested in this article are symmetric, it was not necessary to use a double boundary condition, and the second endpoint of the tube was equipped with an anechoic termination.
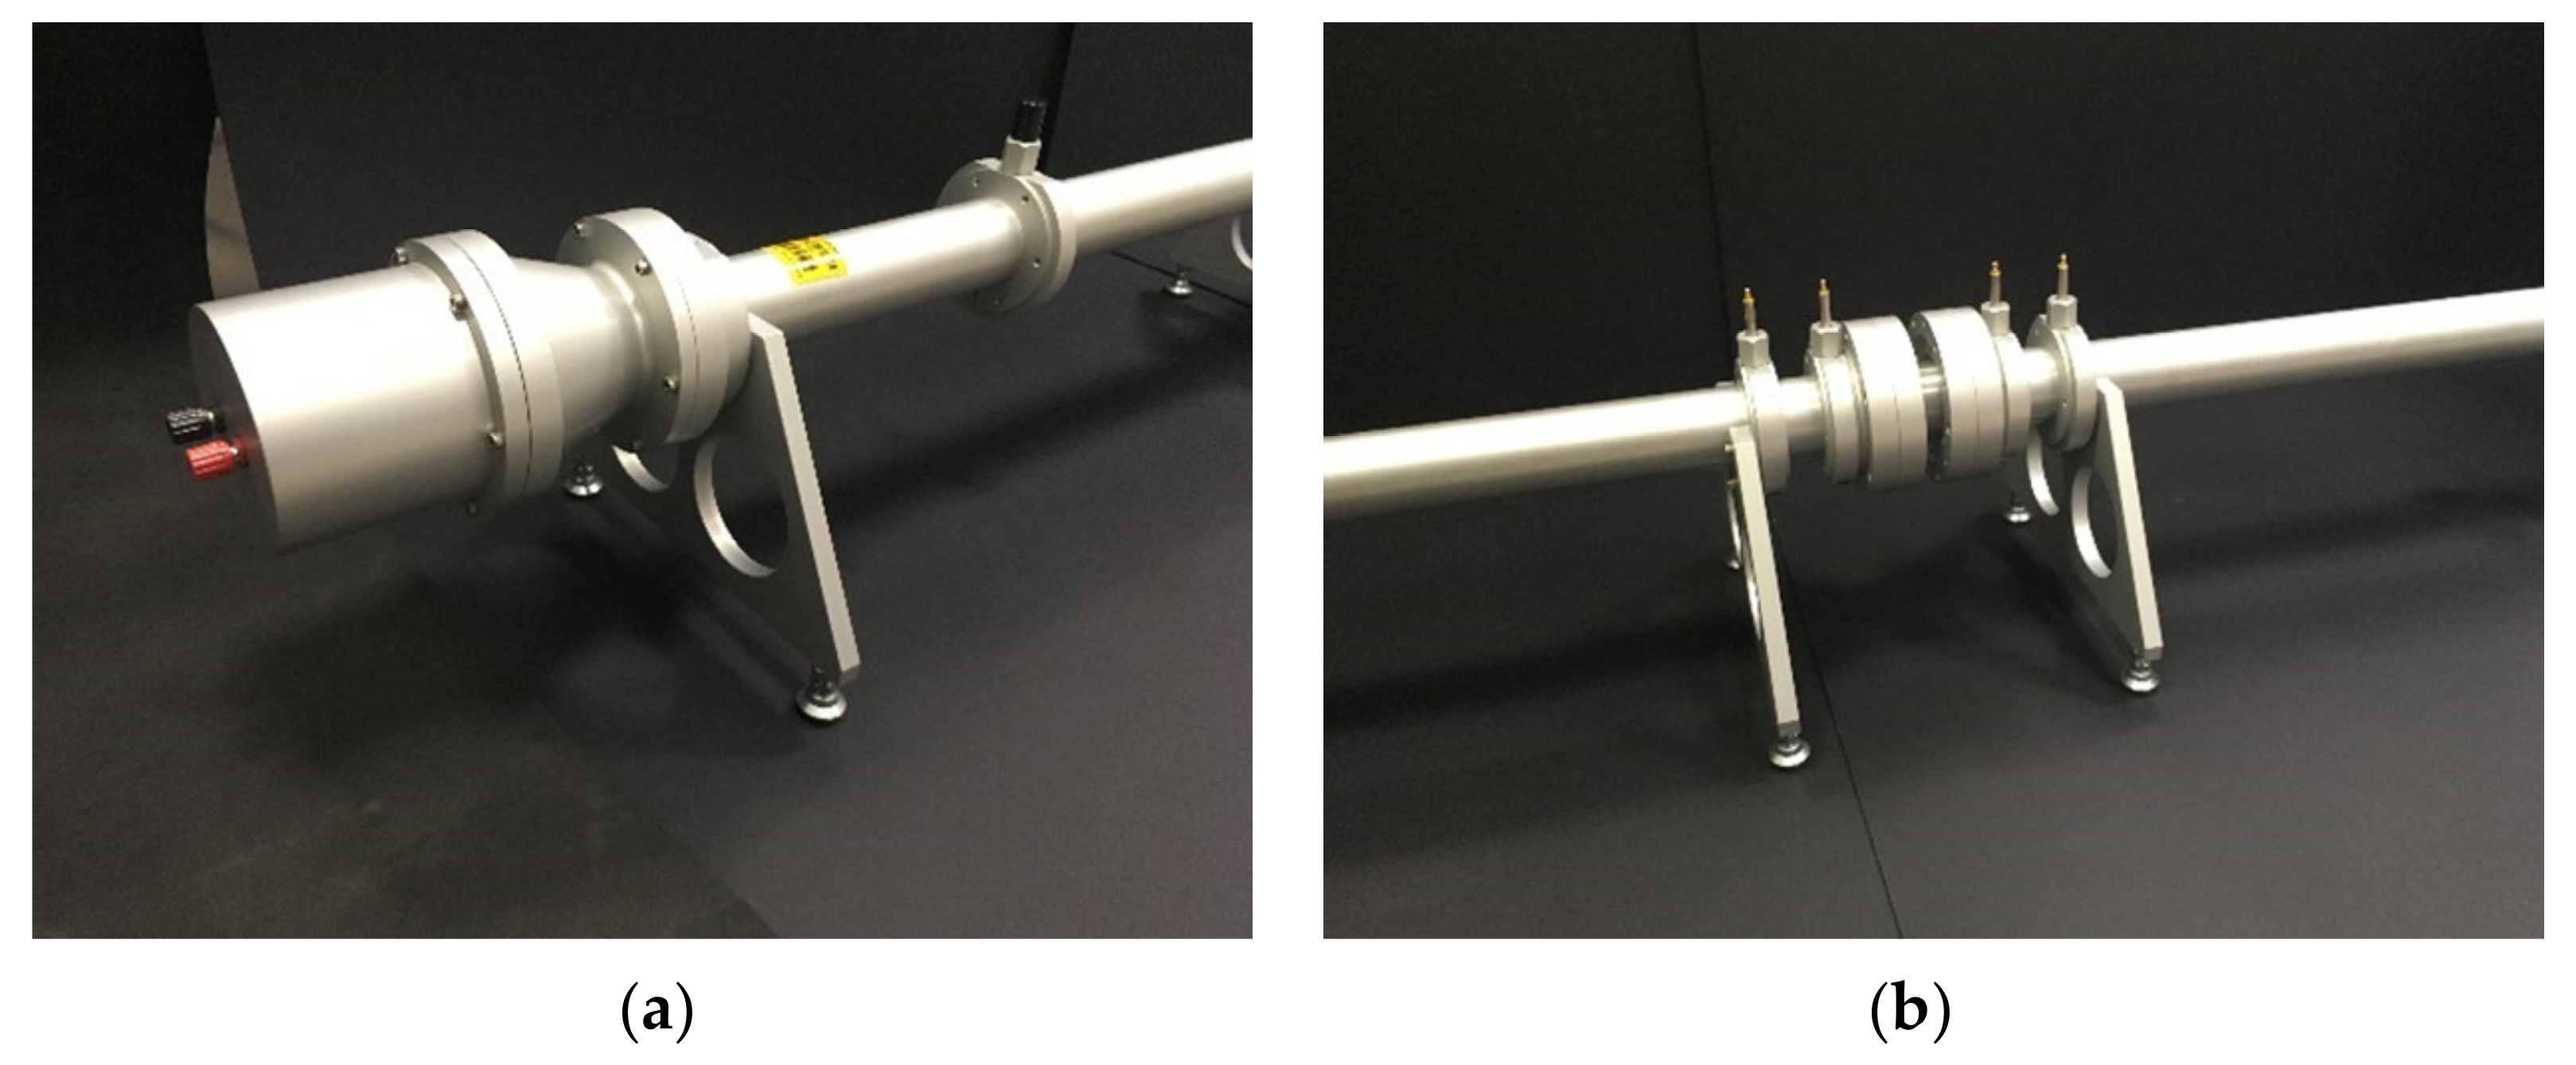
The sample holder is a detachable unit, made of separate segments of tube of appropriate length, which can be usually chosen to be 50, 100 or 200 mm long. Once carefully filled with the material to be tested, the holder is placed in the central section of the tube, between two microphone pairs, and it is additionally sealed to the main parts of the tube by means of O-rings and petroleum jelly for assuring air tightness. Four PCB microphones Type 130F22 are inserted in openings sealed with O-rings and flush mounted with the inner surface of the tube. The microphone pairs are spaced 500 mm for low-frequency measurements and 45 mm for high-frequency measurements. It is worth noting that this study focuses on high-frequency characterization (200–3150 Hz). This choice was made because the JCA model used for the inverse characterization is less accurate in the low frequency range, as discussed in [38]. The transducers are connected to an OROS OR 36 multichannel analyzer which measures the complex transfer functions between the microphones. All the microphones were calibrated before the test by using a Bruel and Kjaer pistonphone Type 4228. In Figure 3, some details of the four-microphone impedance tube used for the experiments are shown.
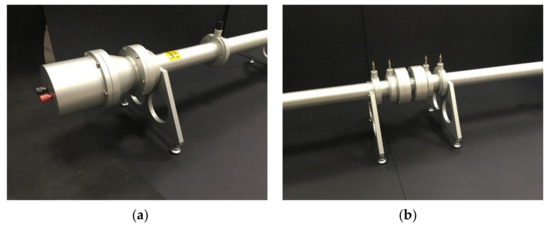
Figure 3.
Details of the four-microphone impedance tube: (a) the sound source; and (b) central part with the inserted sample holder and the two microphone pairs.
To determine the transfer matrix elements, it is necessary to measure the complex sound pressure, including amplitude and phase, at four positions. Once microphone 1 is chosen as a reference, the standard procedure requires a first measurement with all the microphones placed in the port corresponding to their respective number, and then three other measurements are made by physically switching the location of each microphone with the reference microphone 1. This enables obtaining the correction of the transfer functions for phase and amplitude mismatches. In this way, for each tested sample, four measurements have to be executed. A self-built MATLAB® code allows one to post-process the measured transfer functions and to describe the acoustic behavior of the tested material, giving as an output the normal incidence sound absorption coefficient α, the normal incidence sound transmission loss TL, the characteristic acoustic impedance Zc, the speed of sound c and the propagation wavenumber kc in the tested material. To correct the speed of sound in the air and the air density values, the temperature and atmospheric pressure were measured before each test and then considered during the post-processing phase.
3. Tested Samples
Among the different types of waste resulting from the steel production, slags probably represent the main (90% by mass) and most hazardous one, due to the possible content of heavy metals such as chromium, manganese and iron. In order to make slag suitable for recycling and reuse, a deep knowledge of its composition and physical properties is needed, to apply appropriate stabilization and inertization methods that allow environmentally sustainable applications of slags.
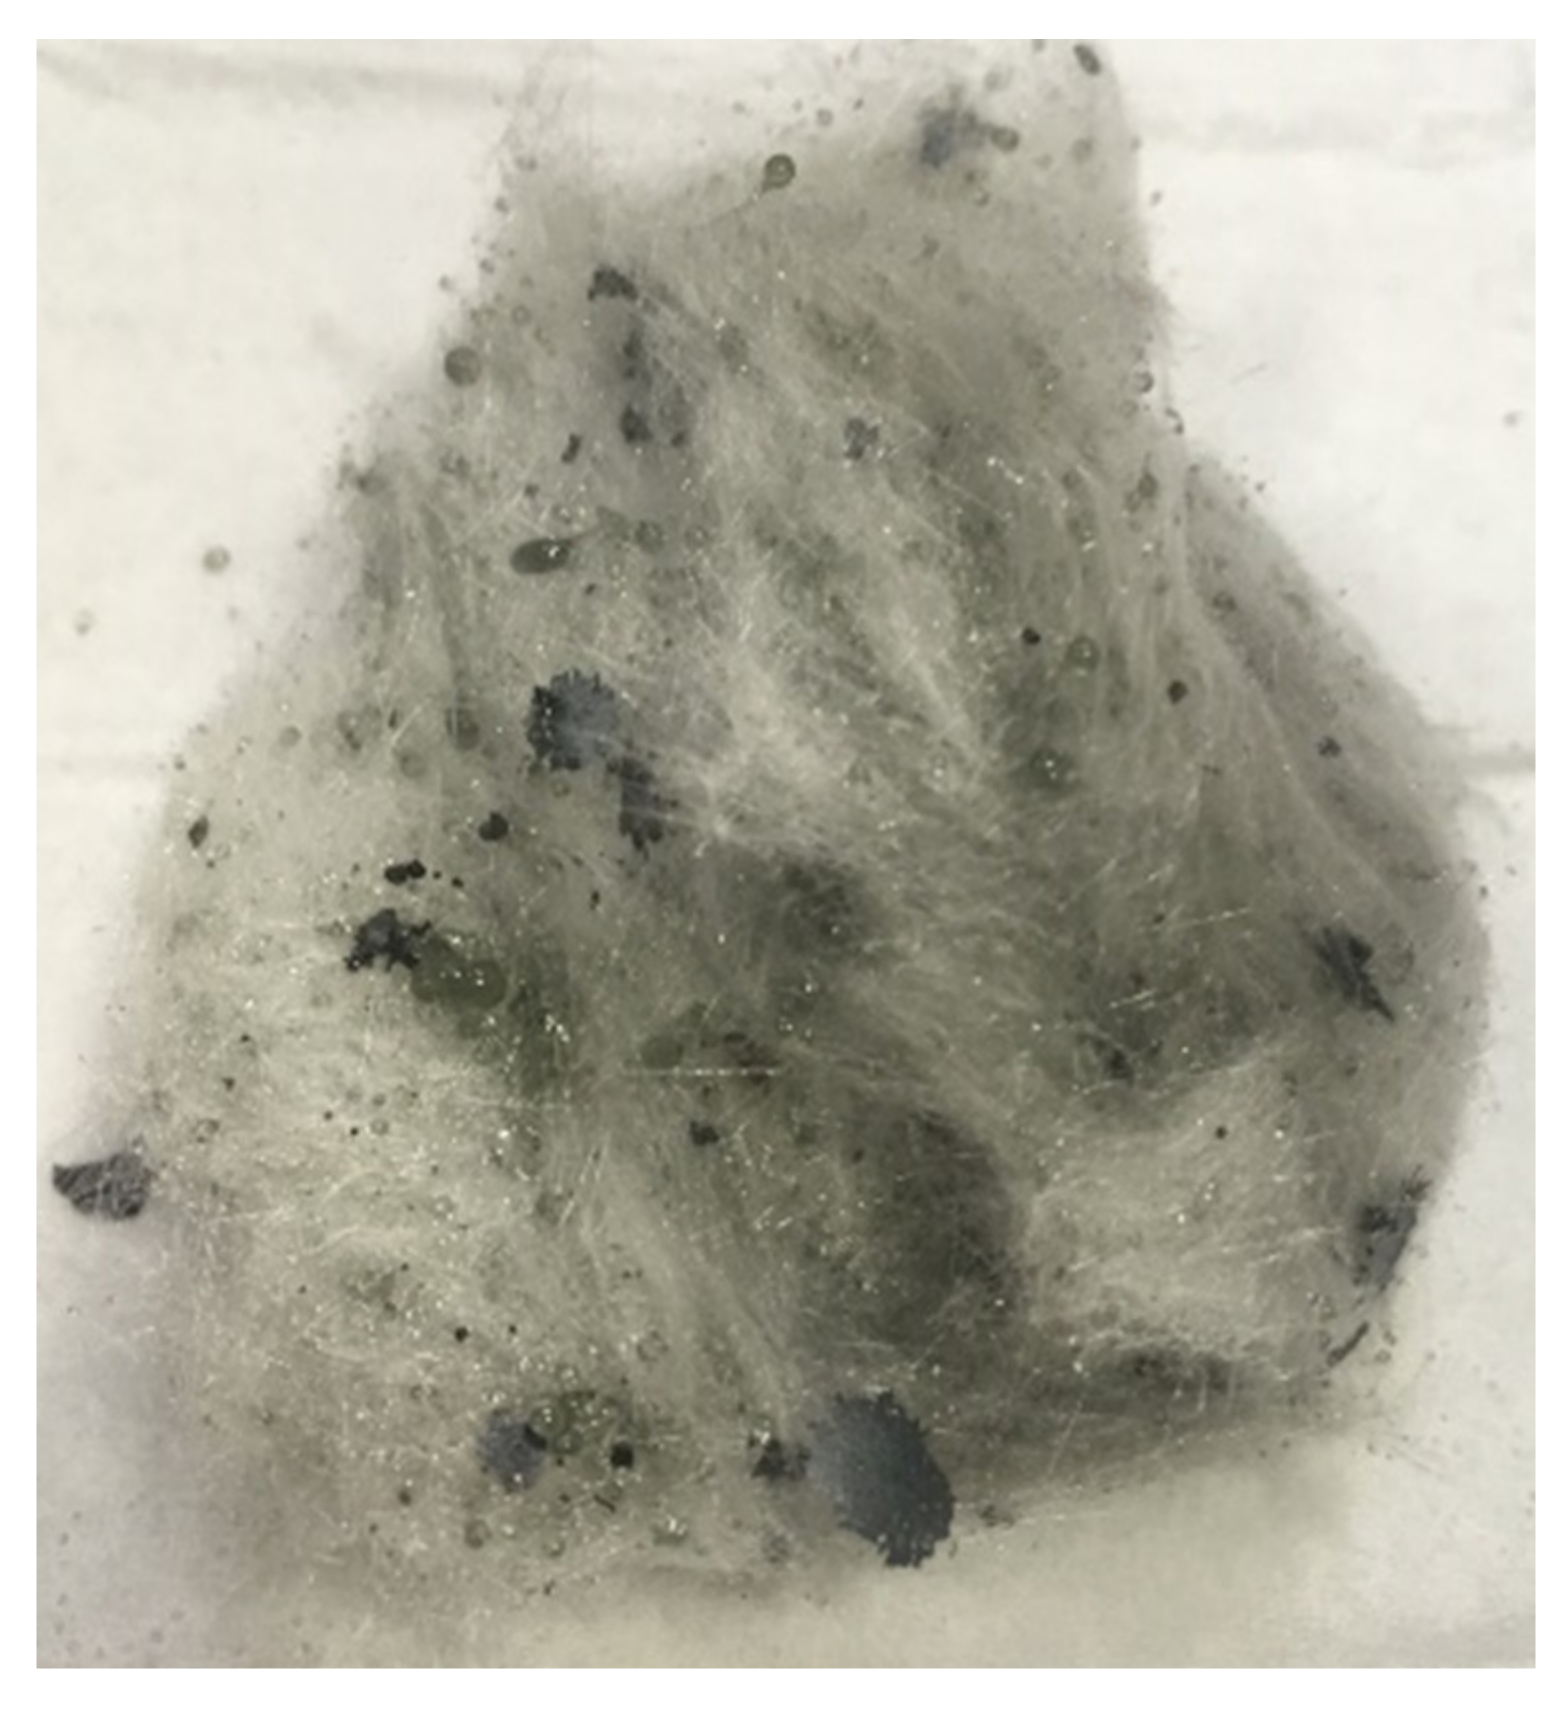
In this work, three types of steelwork waste materials were analyzed: wool derived from white dross, spheres derived from black slag, and spheres encapsulated in an inert material. The first material is a white wool, made of long fibers, similar to mineral wool or glasswool. This material is derived from a centrifuge process of the white dross and it features inclusions of transparent spheres and thin dark flakes, as shown in Figure 4.
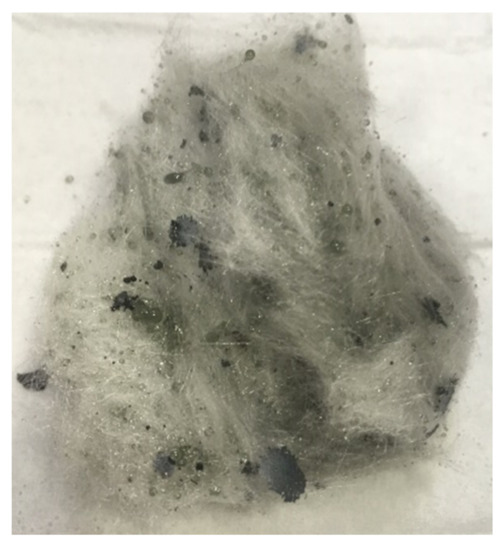
Figure 4.
Sample of wool derived from white dross.
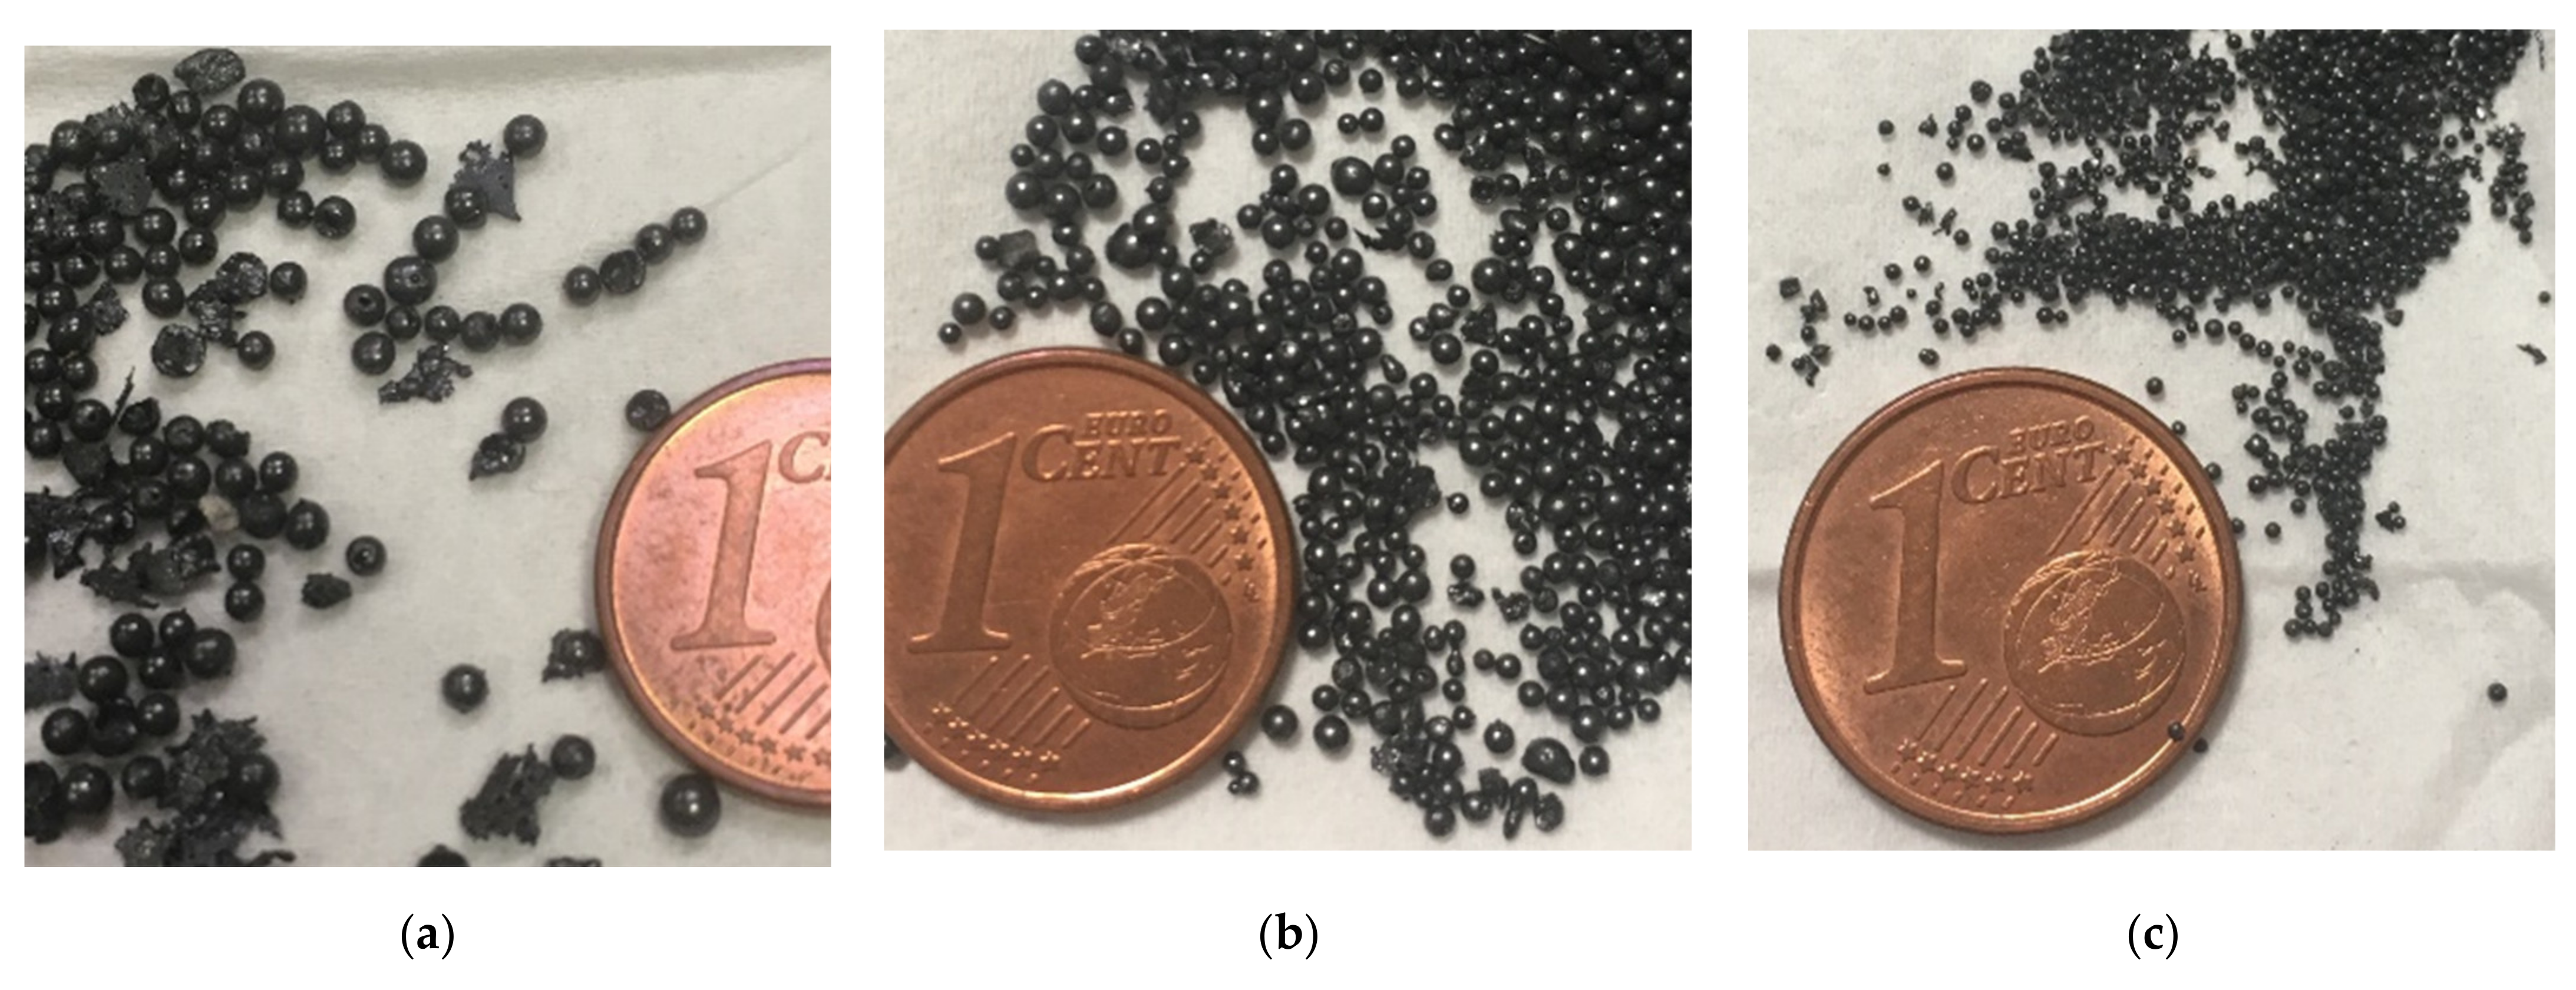
The second material is a conglomerate of spheres derived from black slag, as shown in Figure 5. Three diameters () ranges were obtained by using progressive sieves on a sample of unselected byproduct. The samples are categorized as “BIG” ( [1.4; 2.0) mm), “MEDIUM” ( [0.71; 1.4) mm) and “SMALL” ( (0; 0.71) mm) depending on the dimension of the spheres. The composition of the sample is approximately: 15% BIG, 35% MEDIUM and the remaining 50% SMALL spheres.
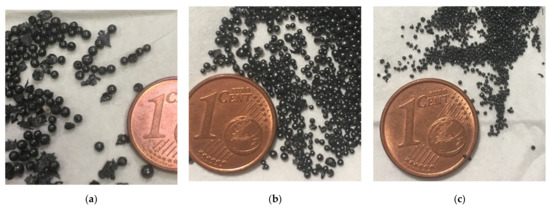
Figure 5.
Conglomerate of spheres derived from black slag: (a) sample “BIG”, with [1.4; 2.0) mm; (b) sample “MEDIUM” with [0.71; 1.4) mm; and (c) sample “SMALL” with (0; 0.71) mm.
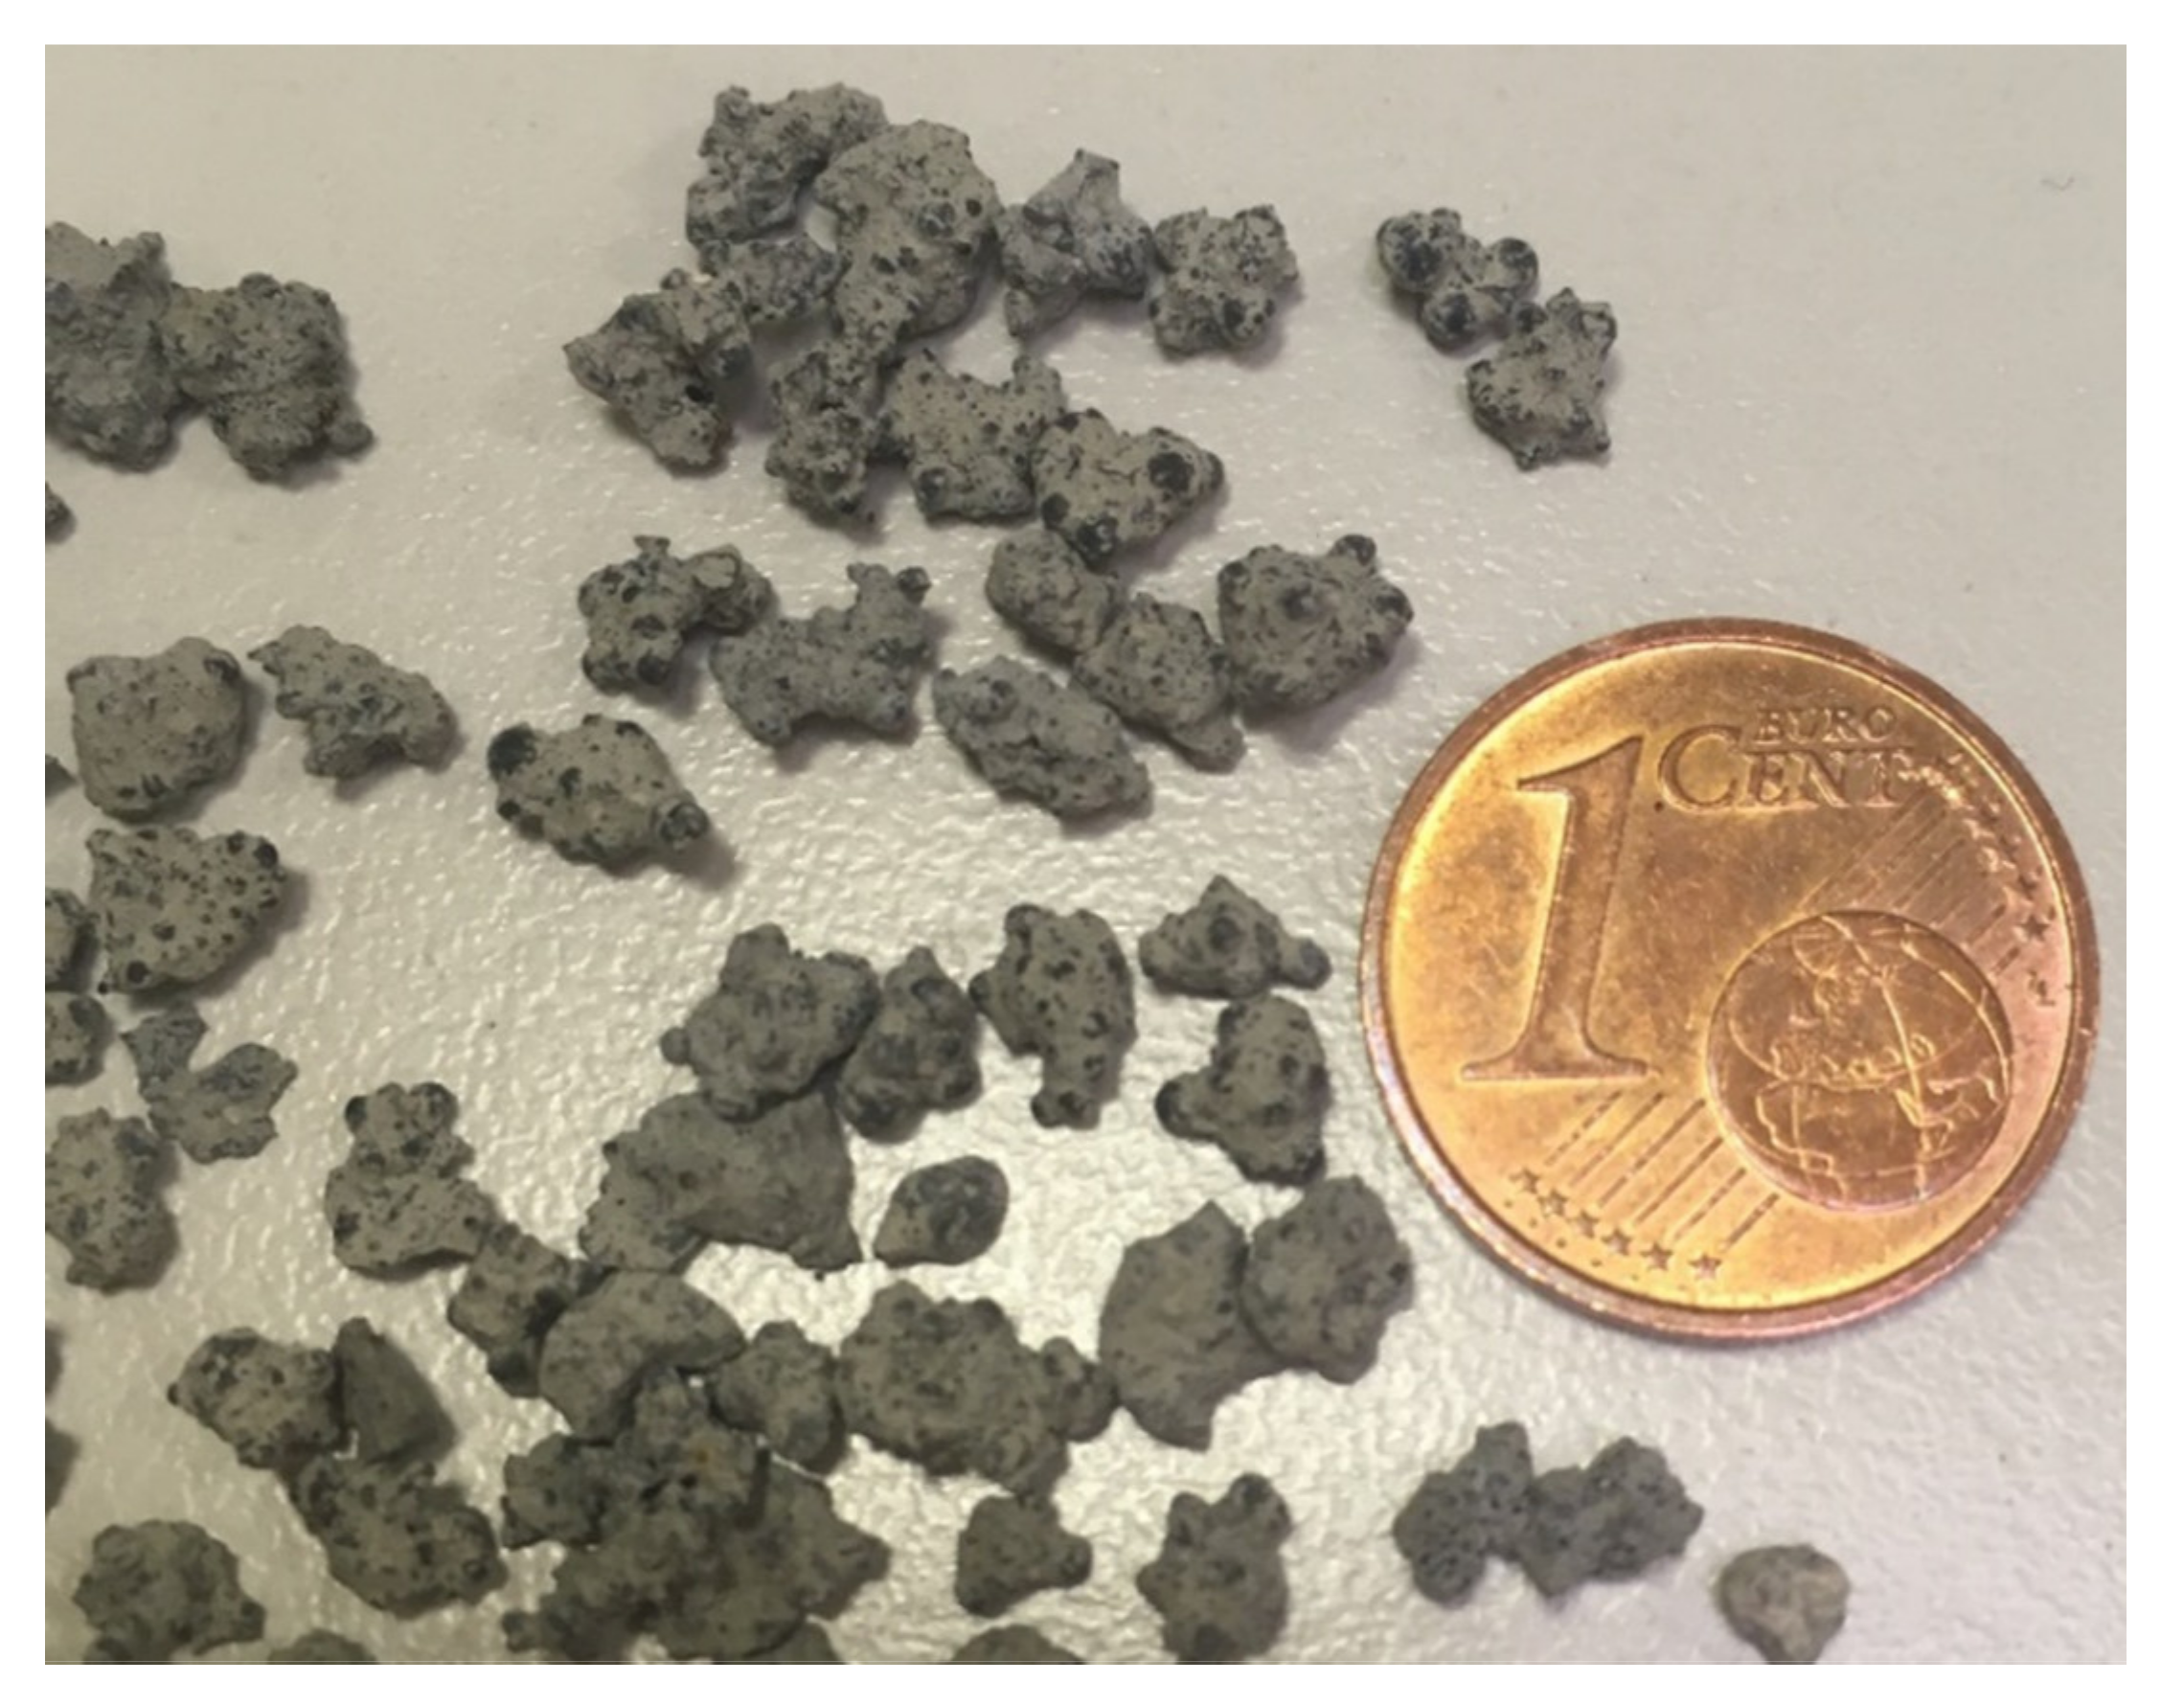
The third material is made of spherical black slag embedded in inert material, resulting in an irregular granular assembly, as shown in Figure 6. After the spherification process, a fluid cement consisting of mixtures of hydraulic binders (lime, silica and alumina) is mixed with the slag spheres. This mixture completely covers the granules and makes them inert. Table 1 reports the samples thickness, the net weight and the density of the different materials considered in this work, together with the diameter ranges of slag spheres specimens.
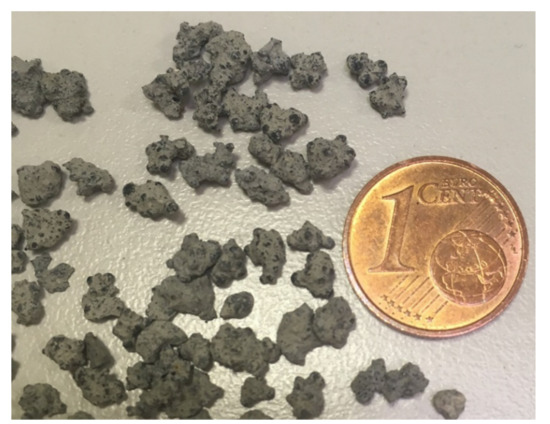
Figure 6.
Sample of slag spheres encapsulated in inert material.

Table 1.
Characteristics of the analyzed specimen: sample thickness, net weight and density.
The second and third material specimens were prepared in the following way:
- 1.
- The front surface of the sample holder cylinder was terminated with a protective layer, sealed by glue along the perimeter to contain loose granules and guarantee flat surface;
- 2.
- A quantity of granules freely fell and randomly into the sample holder while kept in vertical position;
- 3.
- A slight manual vibration was applied to pack the granules;
- 4.
- Occasionally, the loose samples were compacted with a soft pressure on the top end to ensure the correct filling and to level the surface;
- 5.
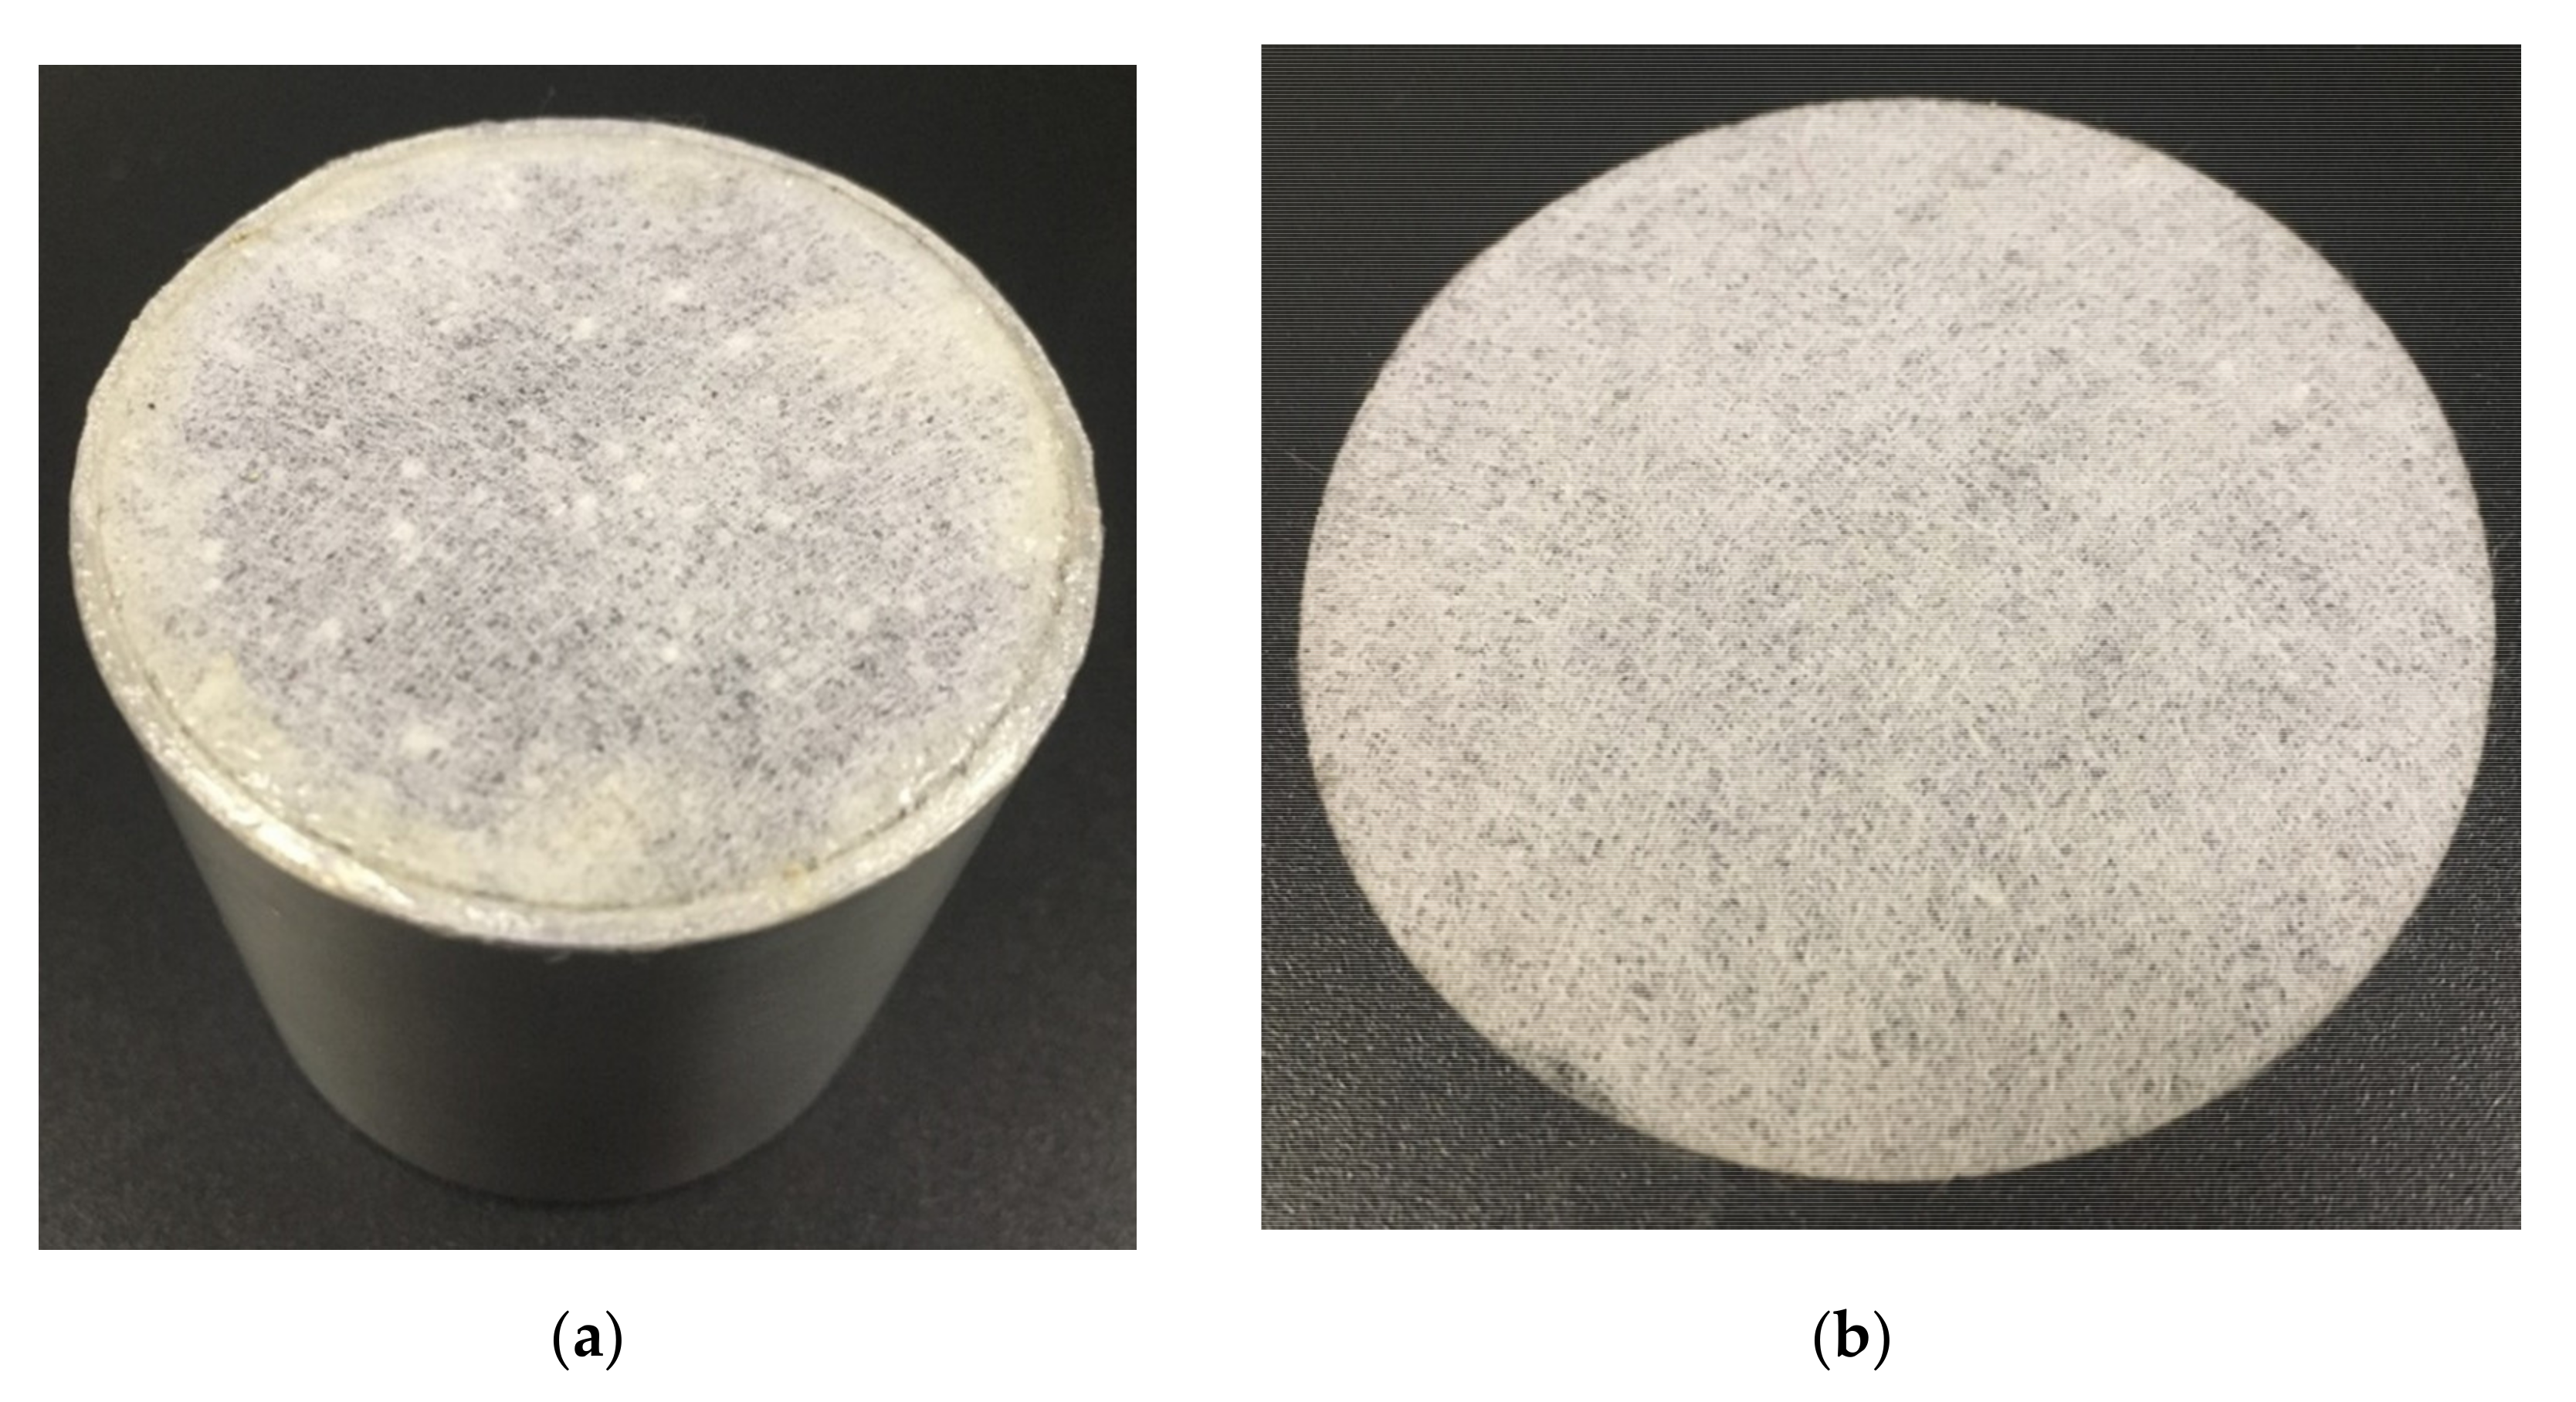
- A non-woven fabric layer, glued along the perimeter, was applied to close the other side of the sample holder.
Previous separate measurements had confirmed that the protective layer, Figure 7, has no influence on the acoustic properties of the tested samples.
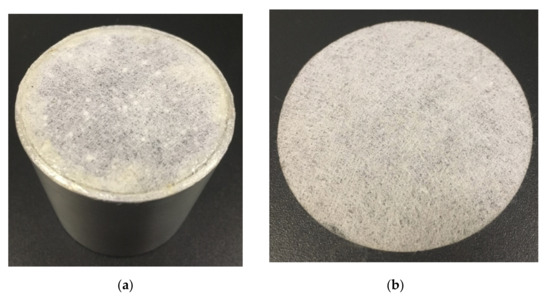
Figure 7.
Examples of protective layers: (a) top surface of the sample closed by the protective layer sealed by glue; and (b) protective layer.
4. Results and Discussion
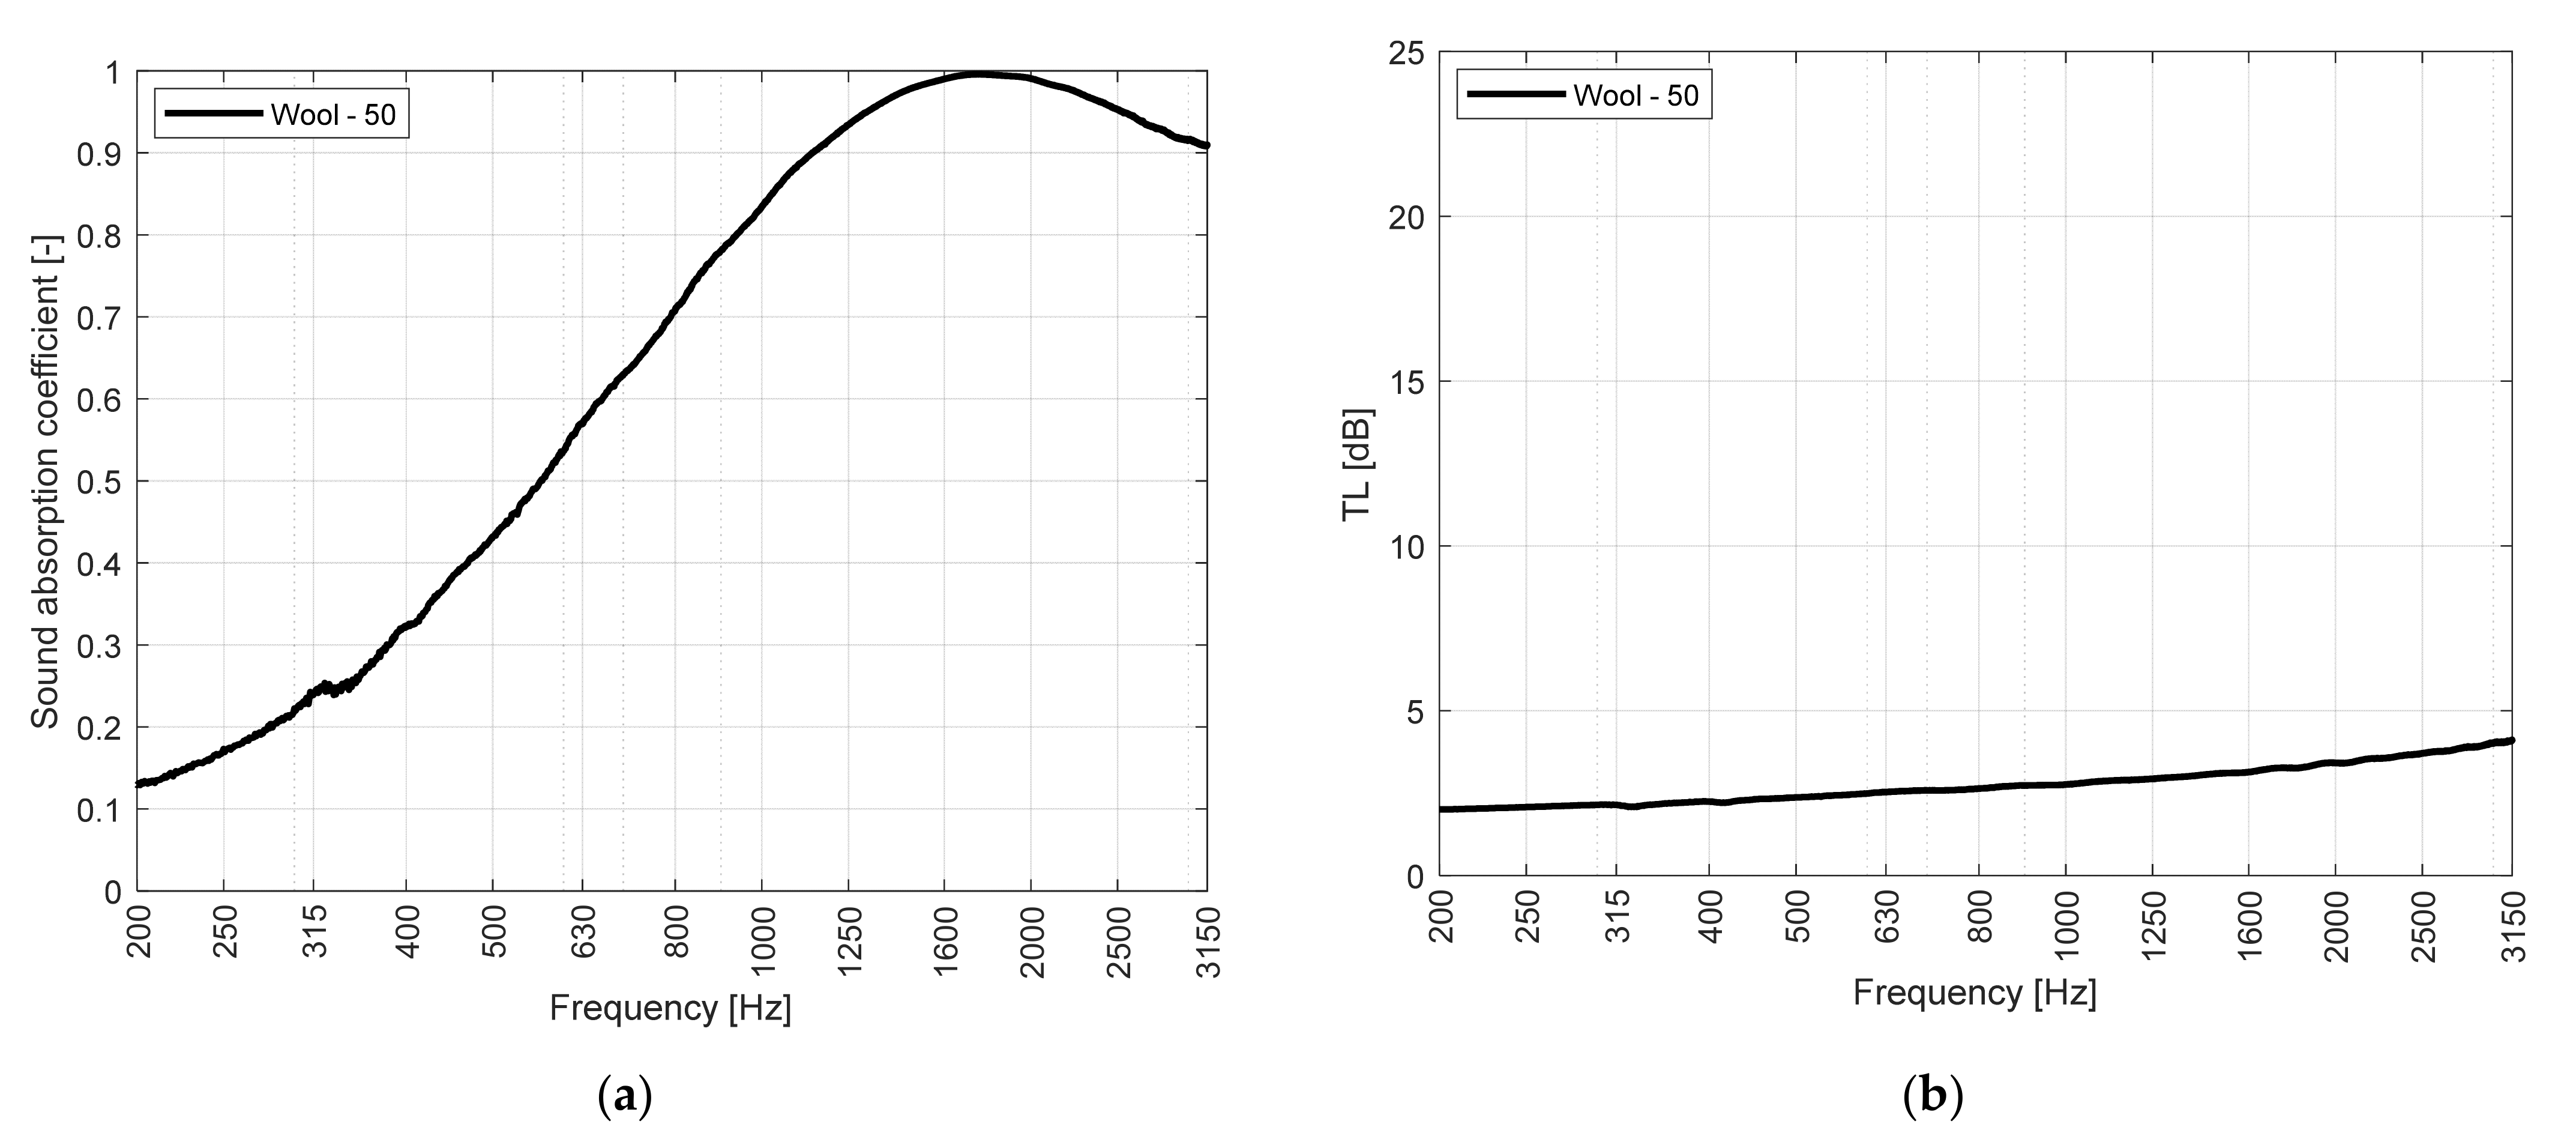
In Figure 8, the measured sound absorption coefficient and transmission loss of the white dross wool are presented. This material features an “S-shaped” absorption curve with the characteristic behavior typical of porous–fibrous materials, that is low values at low frequencies and values approaching a unit value at high frequencies: in particular, α starts with a value of 0.13 at 200 Hz, it linearly increases and around 1700 Hz, it reaches the unit value. The TL curve is also typical for fibrous materials, it does not reach high values but at about 1250 Hz, it shows a change in slope with an increasing trend.
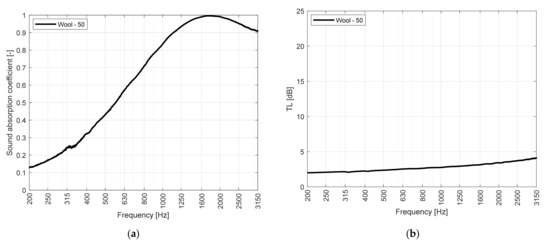
Figure 8.
Acoustic properties of white dross wool sample: (a) sound absorption coefficient; and (b) transmission loss.
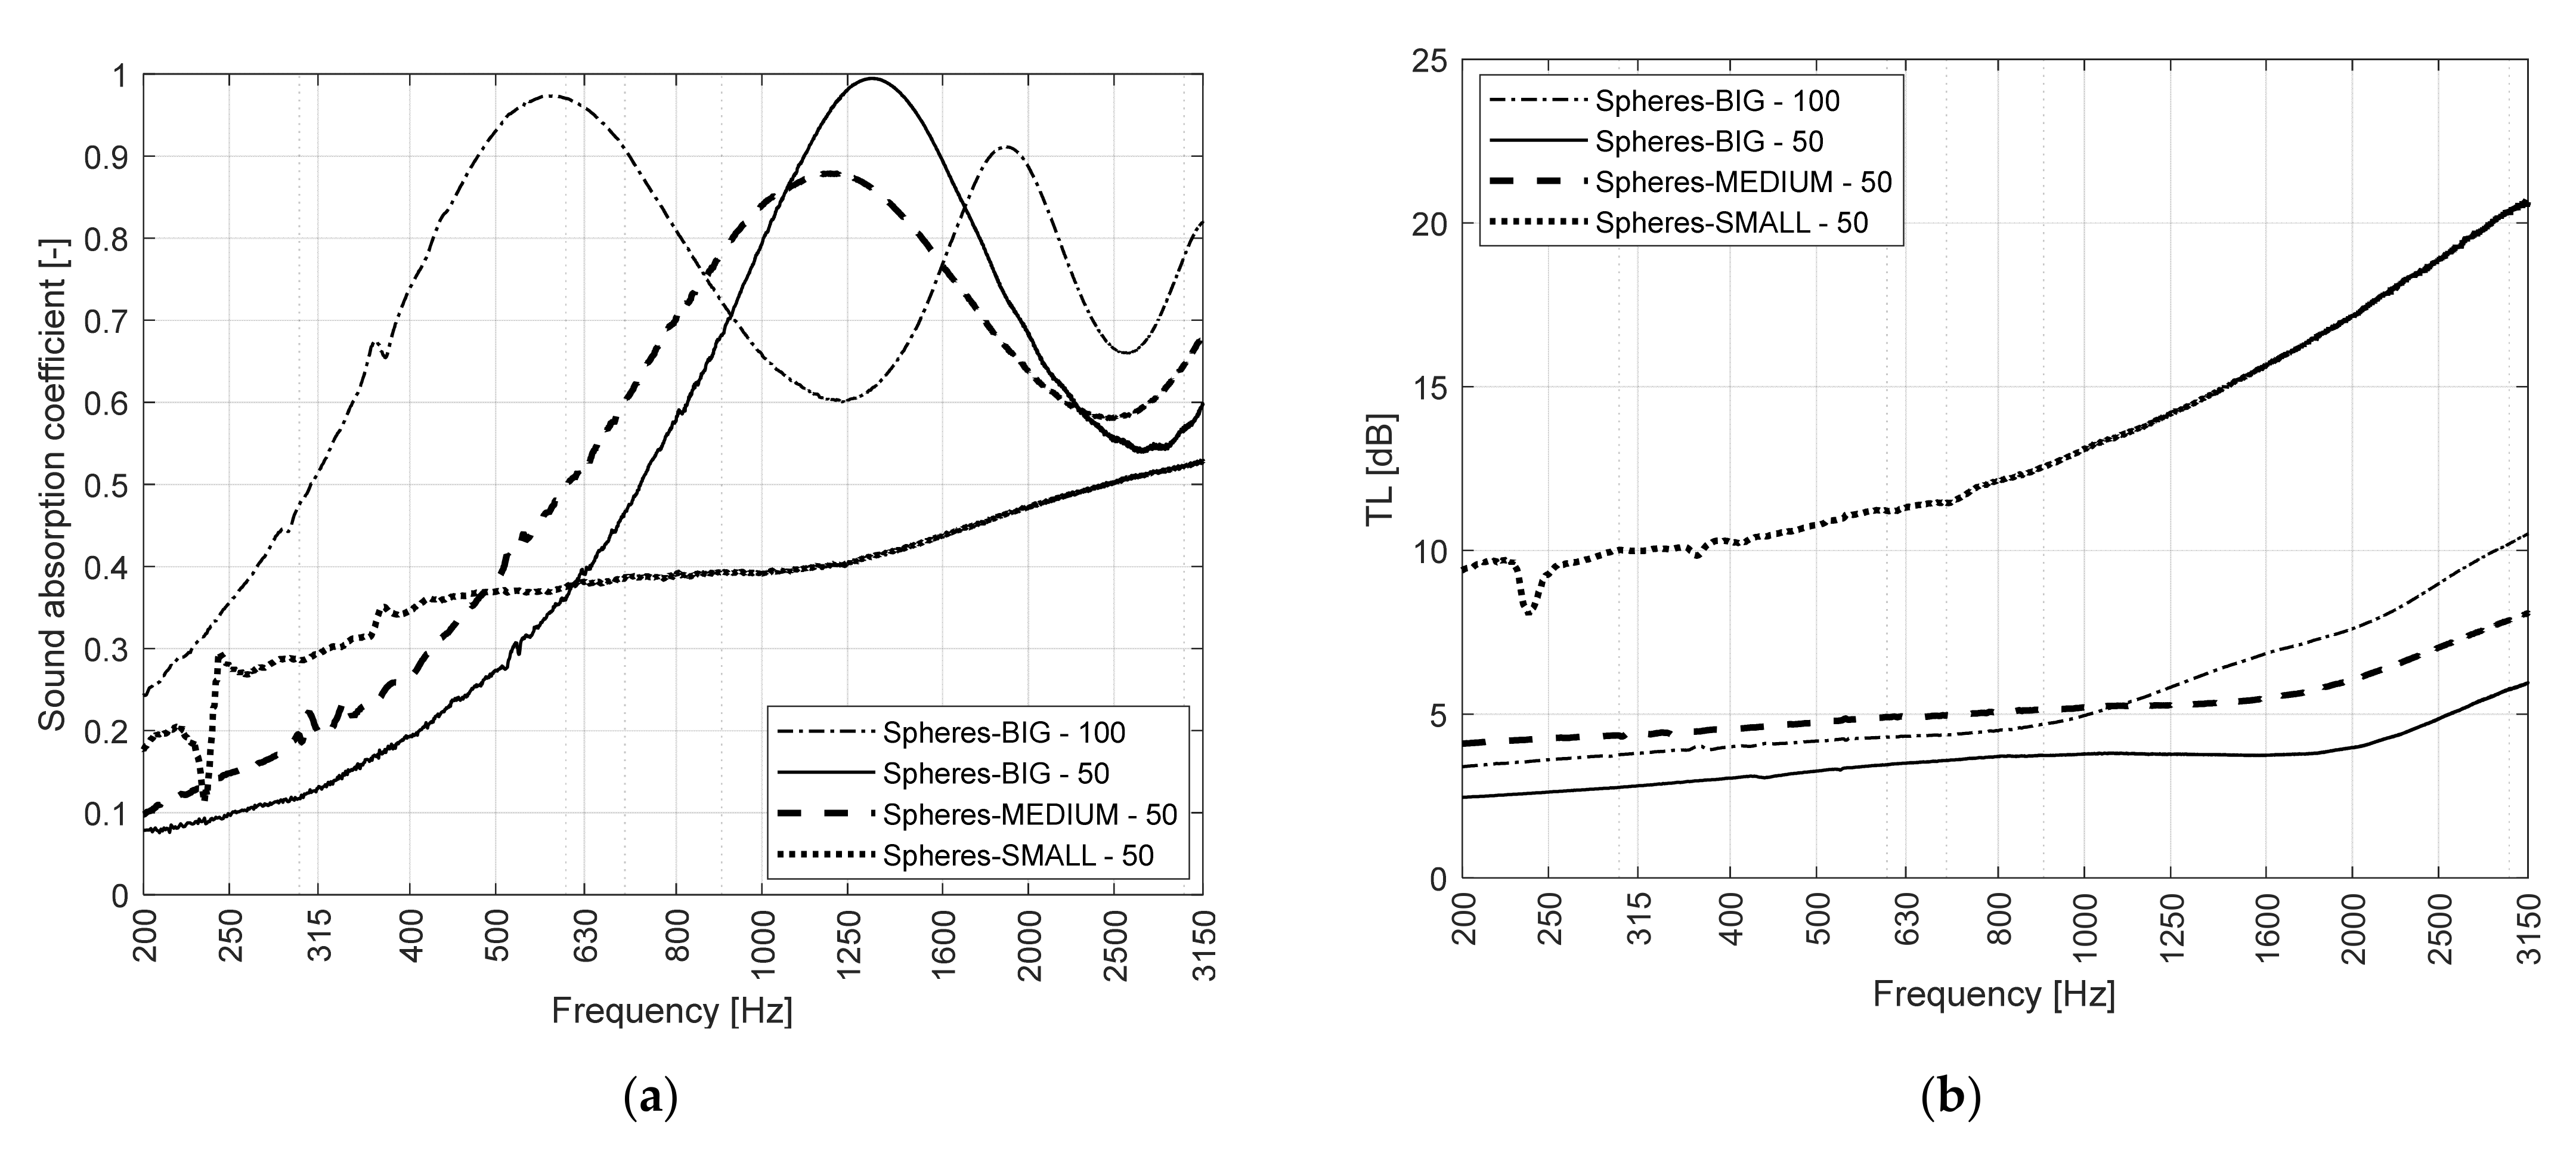
In Figure 9, the acoustic performances of all the samples made of slag spheres of the three diameter ranges are shown in the same graph. The absorption coefficient curves of BIG and MEDIUM samples can be referred to the typical quarter wavelength resonance behavior of granular materials: the oscillations of the sound absorption for granular materials are caused by the air gap around the granules. If the gap between granules is too small or too large, not enough friction and subsequent heat transfer can develop between the air and the solid skeleton of the pore wall during the propagation of sound waves [20]. The first peaks are, respectively, at about 580 Hz for sample BIG of 100 mm length, 1330 Hz for sample BIG with 50 mm of thickness and about 1190 Hz for sample MEDIUM, which is 50 mm long. As the dimension of the sample increases, a more complex gap distribution occurs together with longer channels. While the acoustic wave propagates, the air particle collisions and the flow volume raise within the pores, resulting in a higher dissipation of energy. When the natural frequency of the spheres mix decreases, the sound absorption peak shifts to a lower frequency.
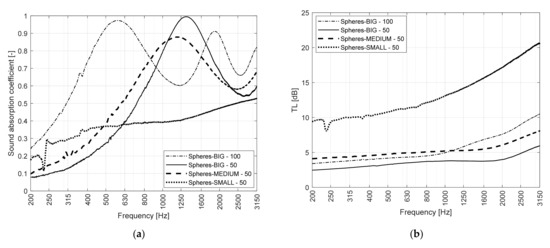
Figure 9.
Acoustic properties of slag spheres samples BIG, MEDIUM and SMALL: (a) sound absorption coefficient; and (b) transmission loss.
It can be observed that for the SMALL sample, a smooth absorptive behavior is present where the resonance peaks and throughs are suppressed. As stated in [31], for large grain mixes, the absorption coefficient spectrum shows an oscillating trend, corresponding to resonance maxima and minima. On the contrary, small grain mixes lose the resonant behavior, featuring a less pronounced trend. For this reason, the transmission loss of SMALL sample is higher than the one measured for the BIG and MEDIUM samples throughout the whole frequency range of interest. This may be caused by the nature of the SMALL sample, featuring spheres with (0; 0.71) mm. Such structure can be considered since compact sand and its higher density results in a very high airflow resistance. This gives rise to a reflective behavior. In the frequency range between 200 and 300 Hz, a drop in both α and TL values of the SMALL sample were observed, probably because of the rigid frame resonance of the system.
Figure 10 shows the absorption curve of the slag spheres sample embedded inside an inert material. Additionally, in this case, the graph shows the typical quarter wavelength resonance behavior of granular materials. The first peak almost reaches a unit value around 1390 Hz. The transmission loss remains quite low throughout the whole frequency range of interest.
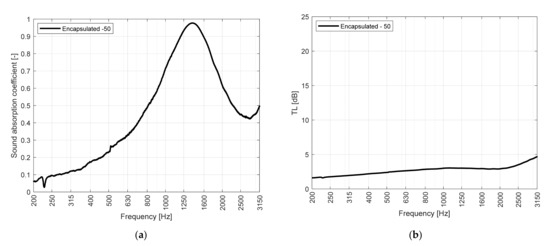
Figure 10.
Acoustic properties of slag spheres encapsulated in inert material: (a) sound absorption coefficient; and (b) transmission loss.
In order to easily compare the performances of different materials, the weighted noise reduction coefficient (NRC) and the sound absorption average (SAA) [49] are used to summarize the absorption characteristics of the tested samples by single rating numbers: they range between 0 and 1, in the case of perfectly reflective or perfectly absorptive materials, respectively. As stated by the standard, NRC is rounded off to the nearest multiple of 0.05, while SAA is rounded off to the nearest multiple of 0.01. Table 2 reports the sound absorption coefficients for the twelve one-third octave bands from 200 to 2500 Hz of the investigated waste materials and their respective NRC and SAA values.

Table 2.
Sound absorption coefficients for the twelve one-third octave bands from 200 to 2500 Hz of the tested materials and the respective noise reduction coefficient (NRC) and sound absorption average (SAA).
In this paragraph, the inverse method based on the standard minimization approach is applied in order to derive the main non-acoustic parameters of the different materials considered in this article. For this analysis, the selected optimization objective function is the difference between the sound absorption coefficient measured by means of the four-microphone impedance tube and the absorption coefficient predicted by using the JCA model. Thus, the investigated cost function is defined as
The purpose is to determine the best solution of the unknown parameters to minimize the cost function. According to the literature [20,26,38], the intervals of the five non-acoustic parameters are set as
To better understand the degree of agreement between measurements and predictions, using the method described in [44], the relative error E% was estimated for all the predictions as
As shown in Table 3, the error was evaluated for each computed third octave band and then the average value of the relative error for the single material is given in the last column.

Table 3.
Relative errors for third octave bands and average values of the relative errors.
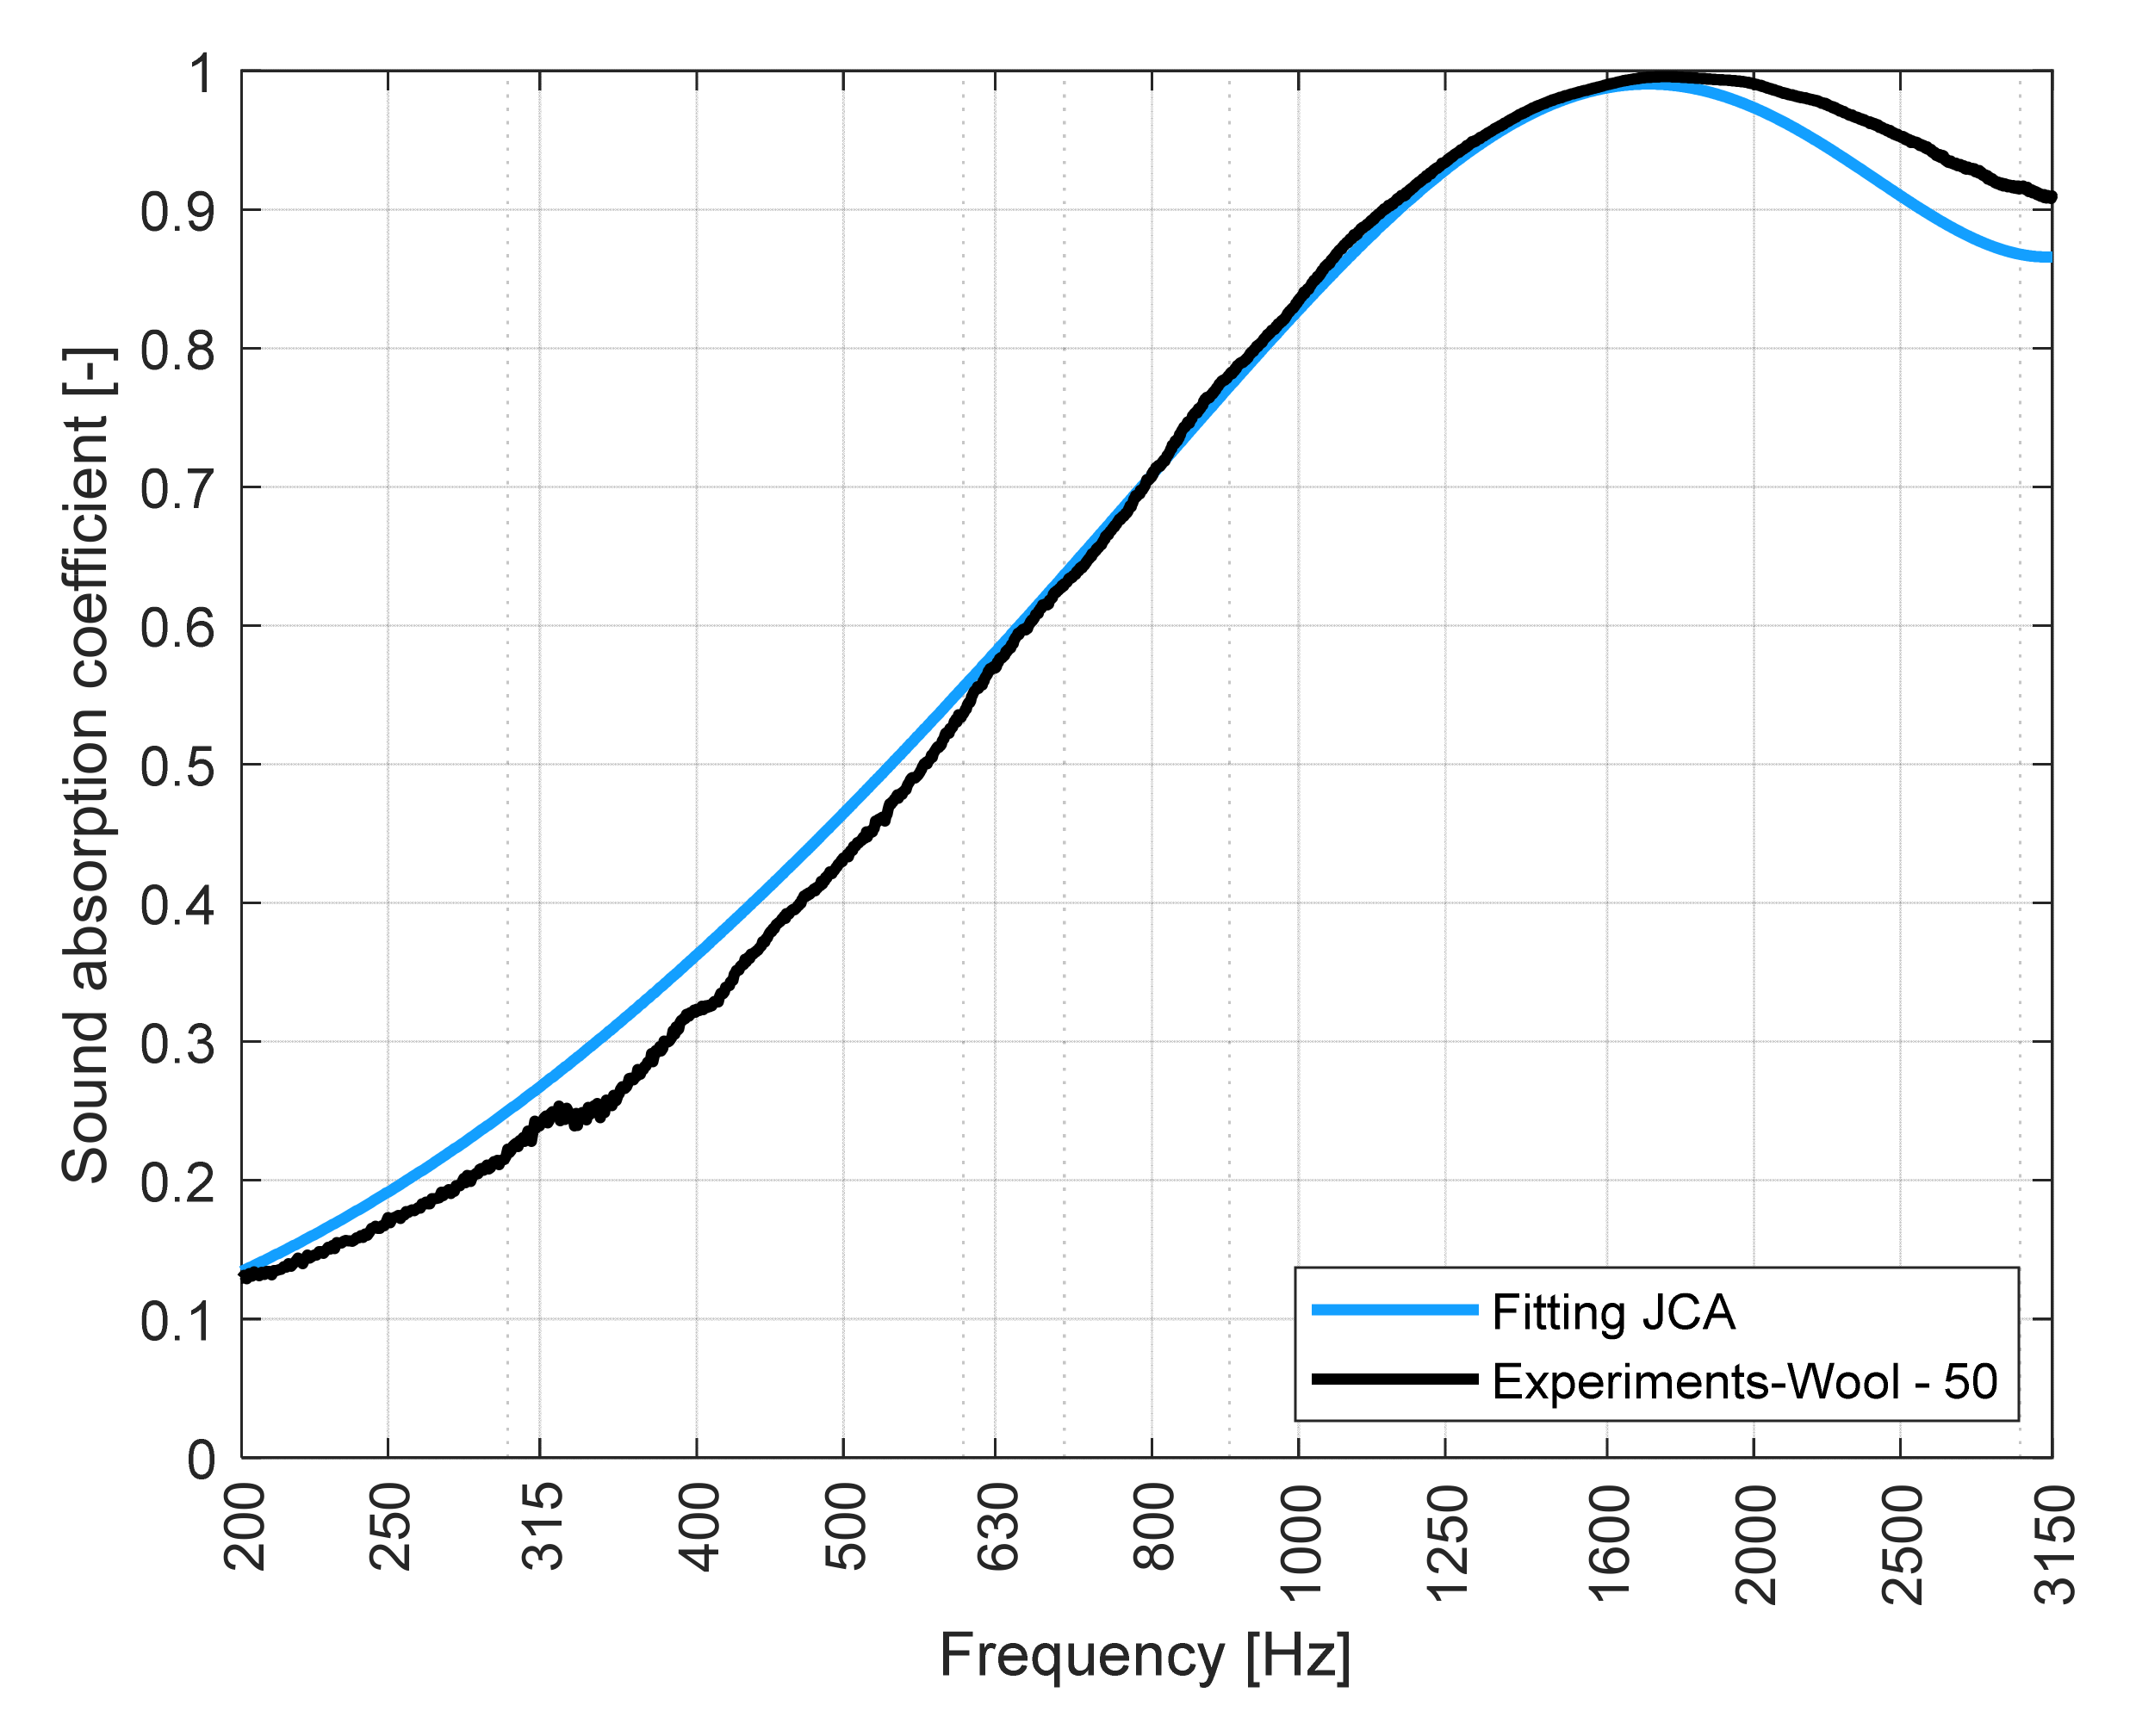
Figure 11 refers to the wool sample and shows the comparison between the absorption experimentally obtained coefficient and the one estimated by using the JCA model—achieved by means of the iterative minimization method. It can be noted that there is a good agreement between the two curves with respect to the frequency range considered, except for a slight overestimation upstream of 630 Hz in the predicted curve, and a little drop downstream of 1600 Hz which is not present in the measured curve.
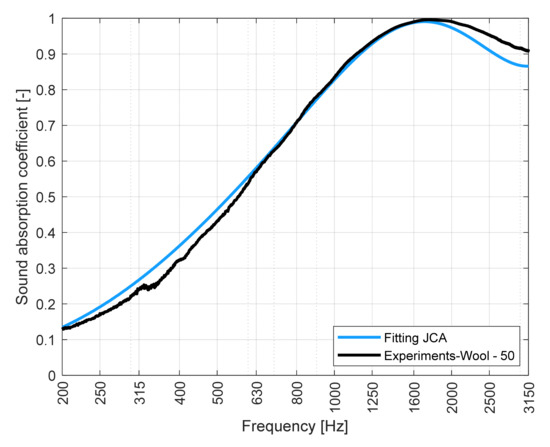
Figure 11.
Comparison between experimental and predicted sound absorption coefficient for the wool sample derived from white dross.
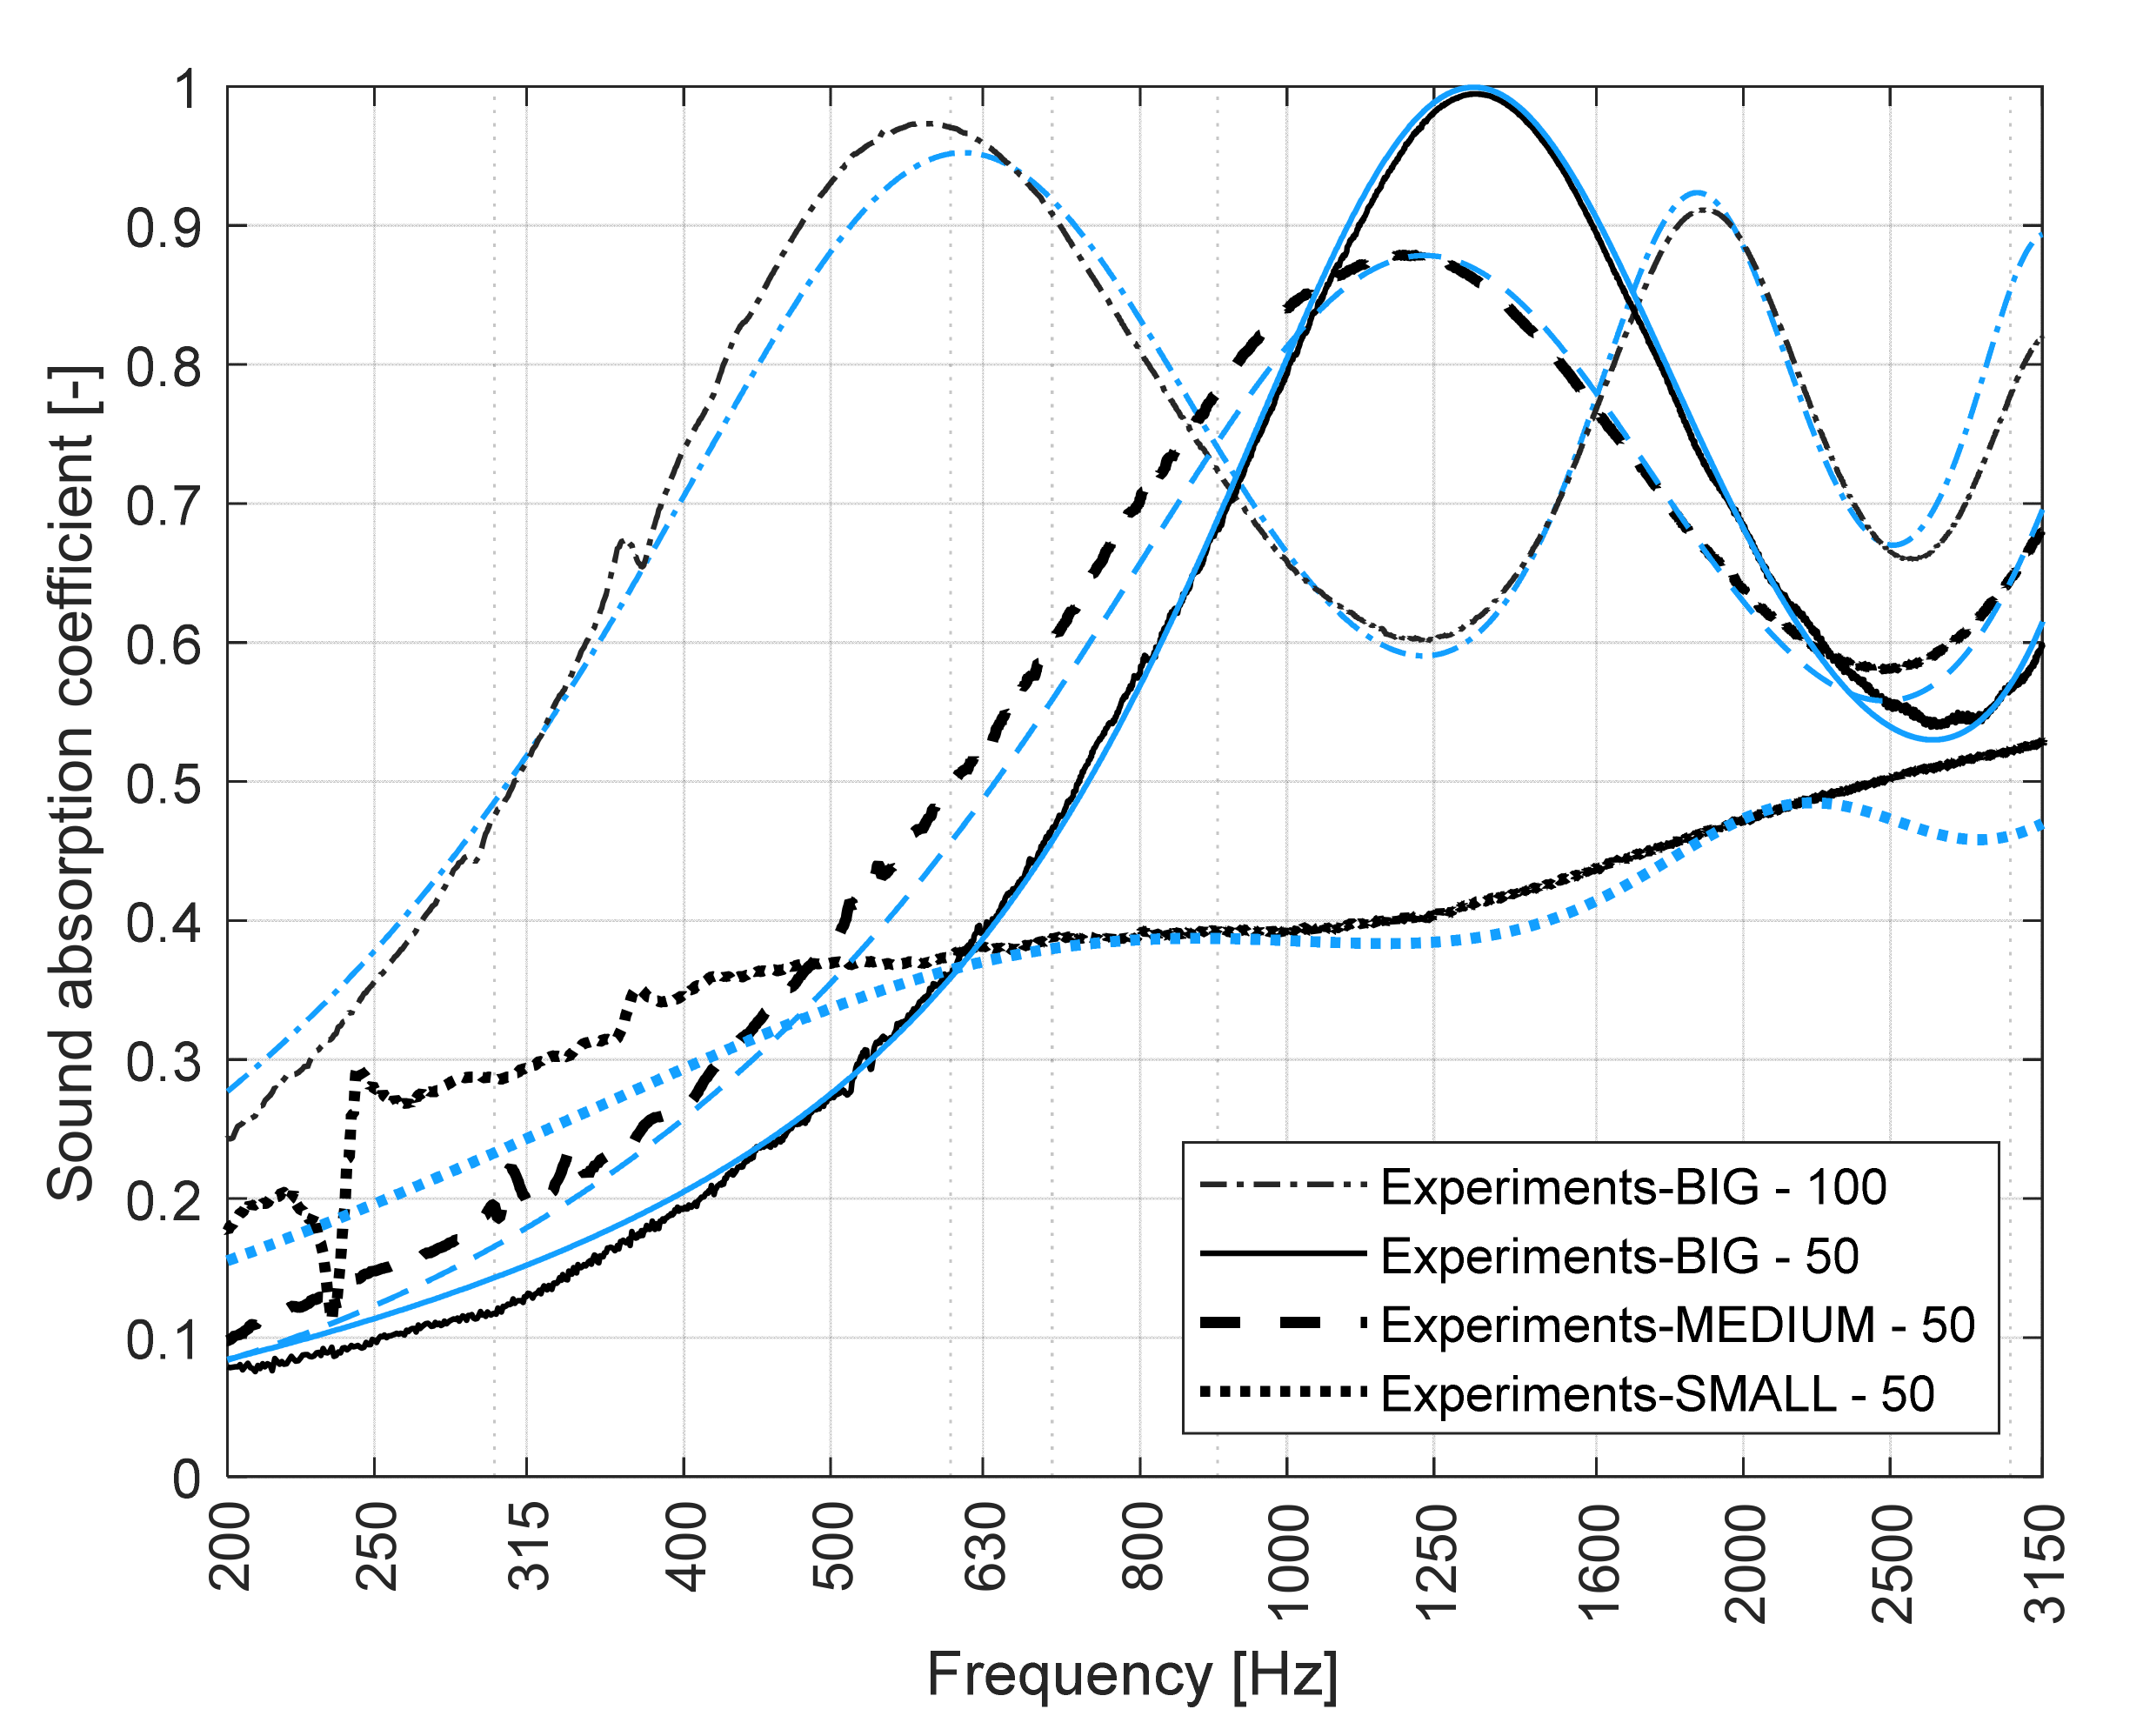
In Figure 12, the experimental and predicted curves are depicted for the three slag spheres samples: BIG, MEDIUM and SMALL. The predictions referring to BIG and MEDIUM samples are in good agreement with the experimental curves, showing the classic resonant behavior. In particular, sample BIG—50 features a high degree of agreement between the two curves above 500 Hz. In the high frequency range, a slight discrepancy can be observed for sample BIG—100. For the sample SMALL, the estimated curve fairly approximates the measured curve, but it does not follow the trend in an optimal way along the entire frequency range. This is probably caused by the nature of the SMALL sample, which is neither an absorbing nor an insulating material.
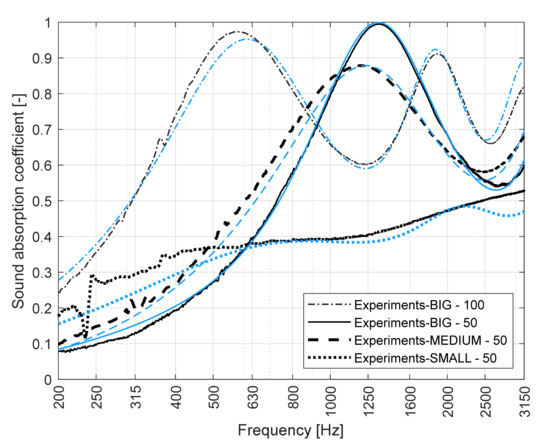
Figure 12.
Comparison between experimental and predicted sound absorption coefficients for slag spheres samples BIG, MEDIUM and SMALL. Blue lines are referred to the respective JCA fittings.
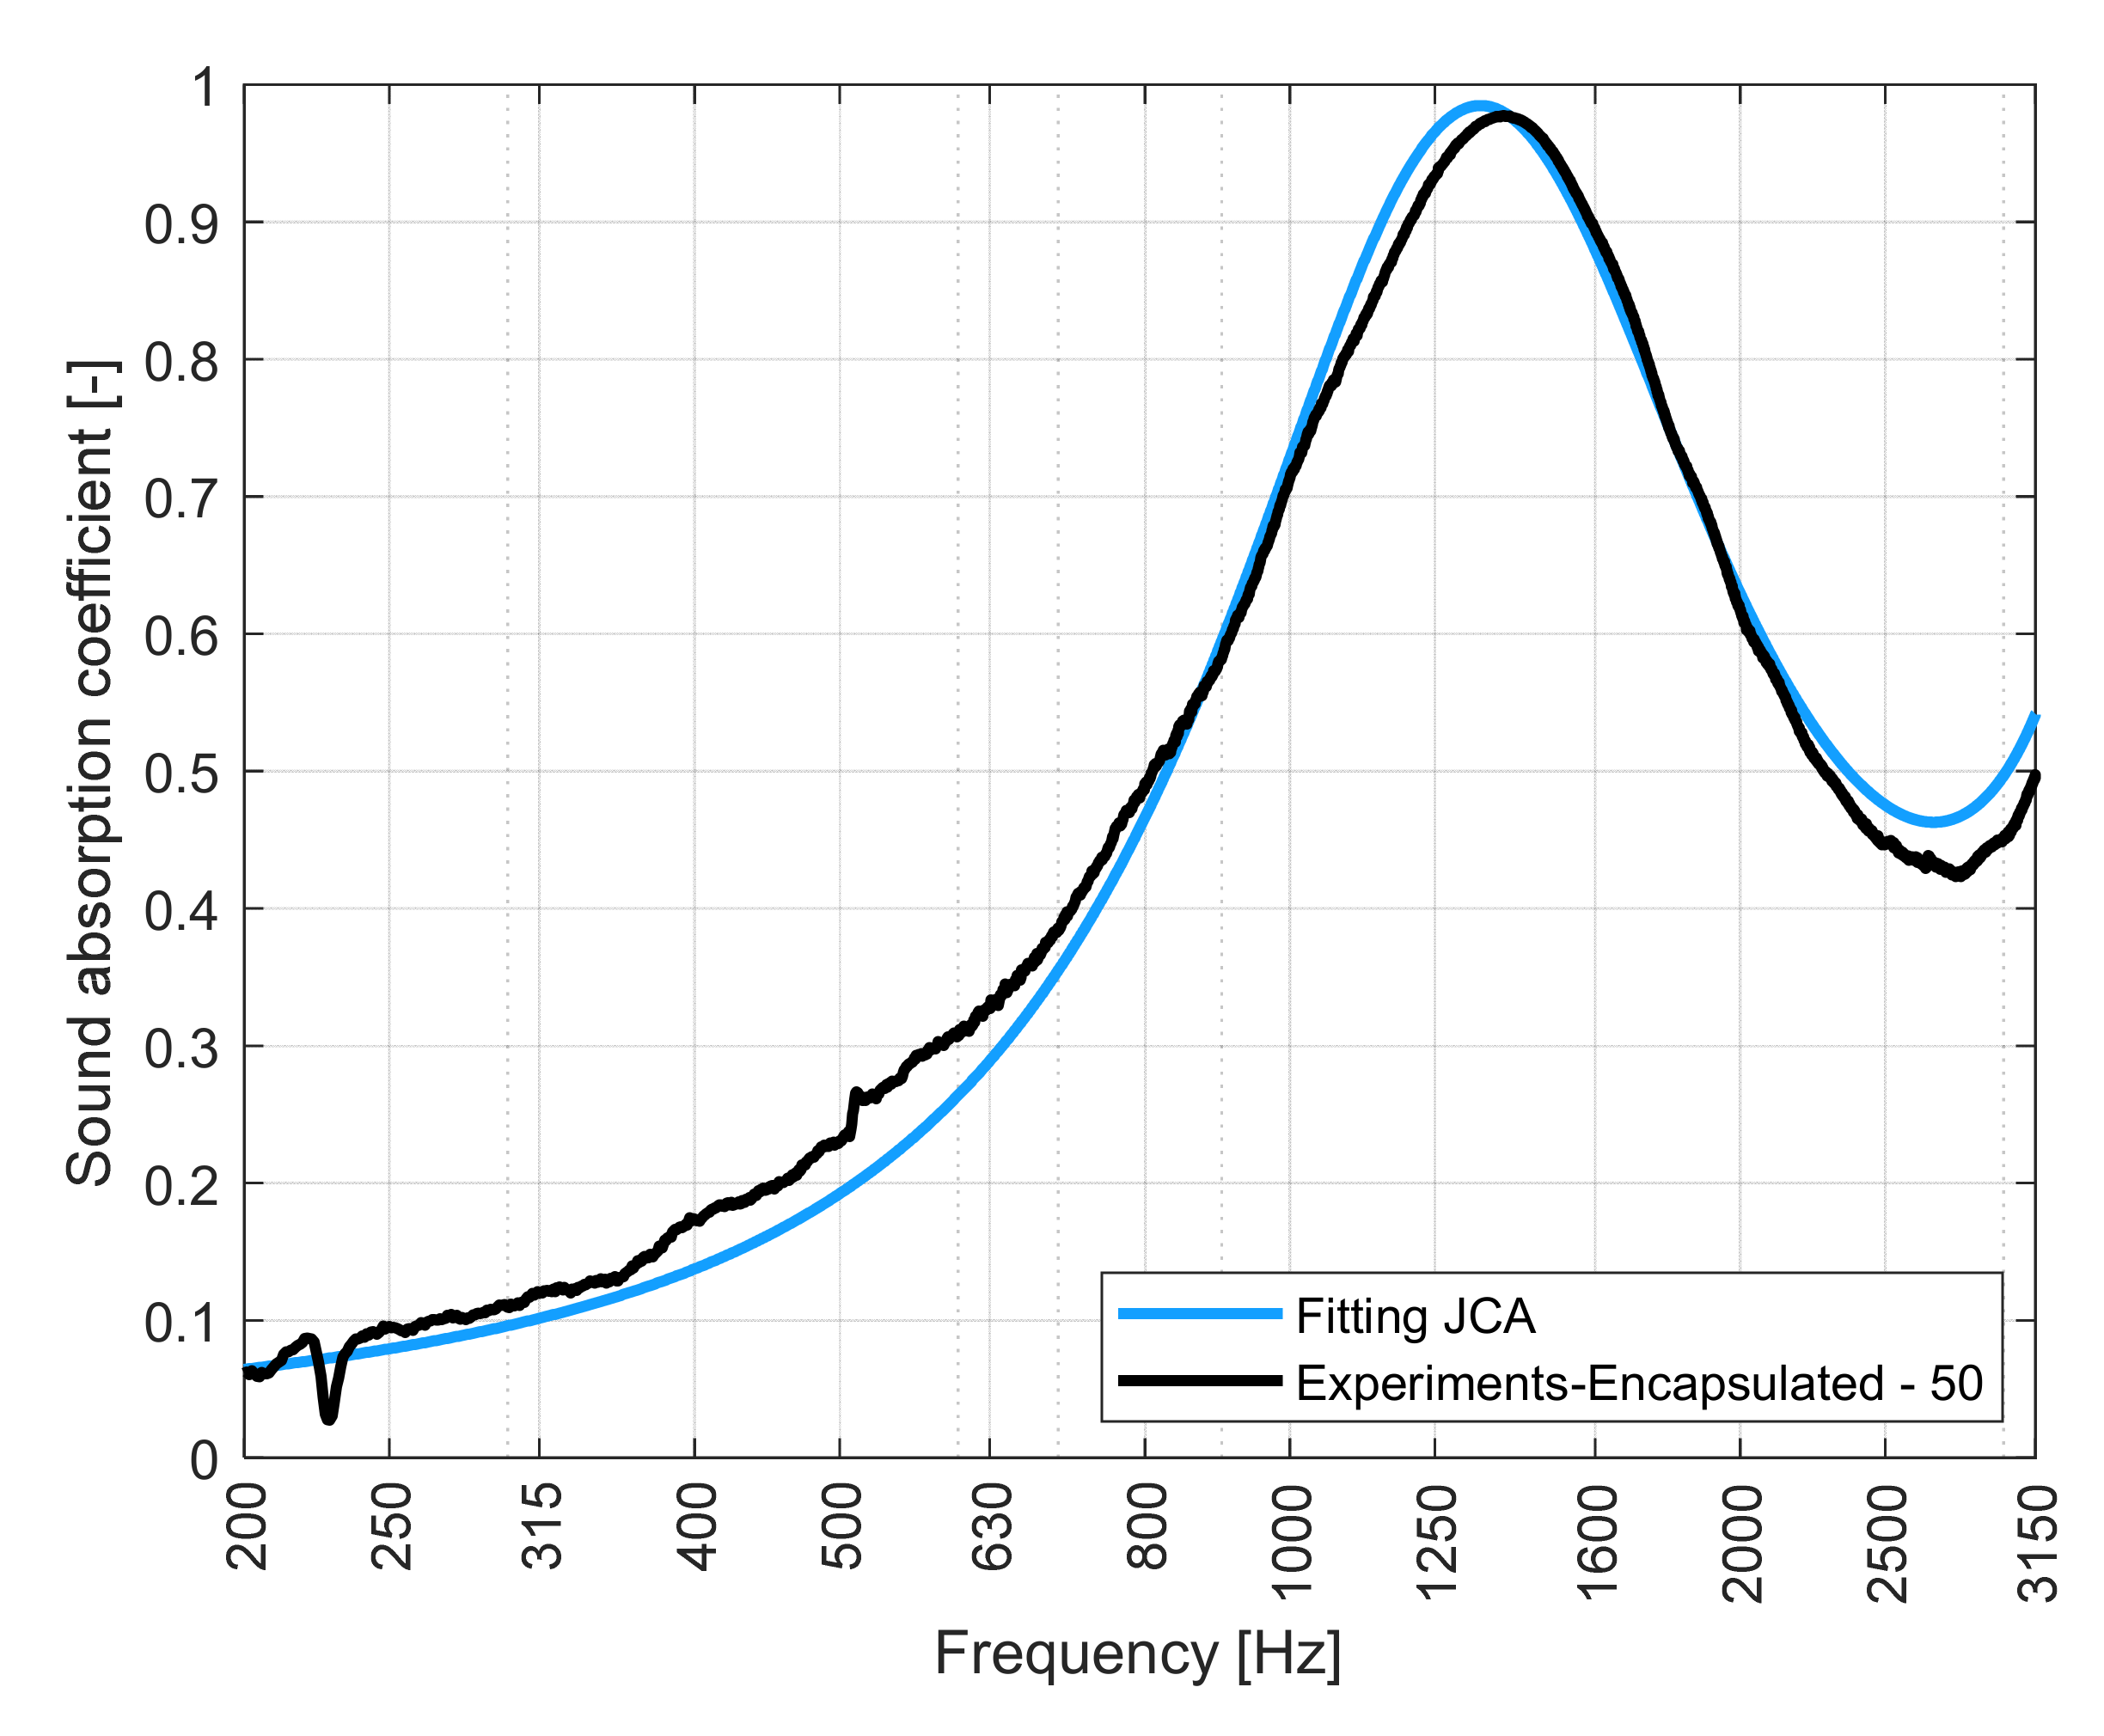
Figure 13 shows, overall, a good correspondence between the estimated and the measured absorption curves relative to the sample made of encapsulated slag spheres.
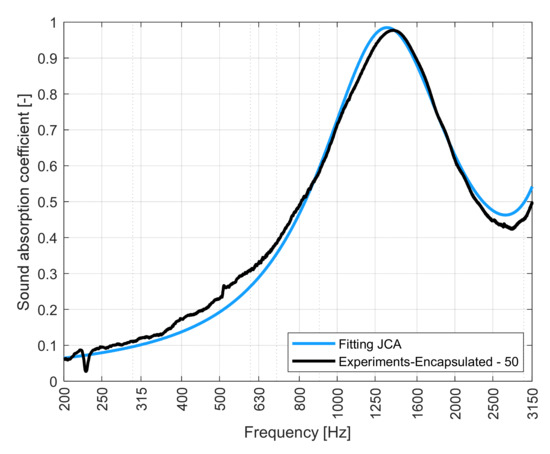
Figure 13.
Comparison between experimental and predicted sound absorption coefficient for the sample made of encapsulated spheres.
Table 4 summarizes the values of the five non-acoustic parameters obtained by applying the optimization procedure. The achieved parameters seem to be consistent with what can be found in the literature for similar materials. Nevertheless, in [21], the authors stated that the porosity of the random close packing of spherical beads should remain constant to a value of approximately 0.36, when the ratio between the sample holder diameter and the tested spheres diameter exceeds the value of 10. This corresponds to the characteristics of the case at hand, since the internal diameter of the sample holder is 46 mm and the diameter of the largest spheres is 2 mm. However, the discrepancies may be due to the fact that, in this study, the spherical particles have not a single diameter value, but they are indeed assembled in diameter ranges, thus, the internal arrangement may be different from the one described in [21]. In order to completely validate the optimal parameters identified by the inverse technique, the next step of the research will be the direct experimental measurement of the five non-acoustic parameters.

Table 4.
Inversely determined non-acoustic parameters.
5. Conclusions
In this paper, the acoustic characterization of some steel industry waste materials derived from black and white slags is provided. The measurements performed by using a four-microphone impedance tube allowed us to obtain the acoustic properties of the tested samples. As a result, the analyzed materials can be mainly considered as porous media featuring interesting sound absorption and insulation characteristics. The wool derived from white dross exhibits a trend of the sound absorption which is typical of fibrous material, while slag spheres and encapsulated spheres behave as granular materials, with an oscillating tendency whose peaks are due to the resonance of the particle frame at a frequency corresponding to the one of a quarter wavelength resonator having the same thickness. Only the SMALL sample showed a more insulating than absorptive behavior, due to its higher density and airflow resistance values. It can be said that the SMALL sample acoustically behaves like compact sand. In order to determine the non-acoustic parameters of the samples, without the possibility of performing direct measurements, an inverse characterization technique was applied. Based on the JCA model, the inverse technique used relies on a standard iterative optimization procedure: the minimization is performed between the sound absorption coefficient measured in a four-microphone impedance tube and the one estimated by optimizing the inversion values into the JCA model. The optimization intervals were set according to the literature data. The five resulting non-acoustic parameters are compatible and comparable with the ones which can be found in other studies dealing with porous and granular media. The fact that some samples are made by spheres assembled by ranges of diameters and not by single diameter values explains possible discrepancies with literature data. The next step of the research will be focused on the validation of the inversion procedure and of the optimized non-acoustic parameters, by means of specific experimental measurements. Further investigations on the microstructure and the particle arrangements will allow the optimization and customization of the material for specific noise control applications.
Author Contributions
Investigation, data curation, writing—original draft preparation, visualization, E.L. Methodology, resources, supervision, E.A.P. Software, S.S. Conceptualization, writing—review and editing, E.A.P. and E.L. All authors have read and agreed to the published version of the manuscript.
Funding
This research received no external funding.
Institutional Review Board Statement
Not applicable.
Informed Consent Statement
Not applicable.
Data Availability Statement
Not applicable.
Acknowledgments
The authors would like to thank ORI Martin (Brescia), particularly Maurizio Zanforlin, for providing the material and technical insight on the manufacturing and inertization processes.
Conflicts of Interest
The authors declare no conflict of interest.
References
- Smol, M. Towards Zero Waste in Steel Industry: Polish Case Study. J. Steel Struct. Constr. 2015, 1, 102. [Google Scholar] [CrossRef]
- Branca, T.A.; Colla, V.; Algermissen, D.; Granbom, H.; Martini, U.; Morillon, A.; Pietruck, R.; Rosendahl, S. Reuse and Recycling of By-Products in the Steel Sector: Recent Achievements Paving the Way to Circular Economy and Industrial Symbiosis in Europe. Metals 2020, 10, 345. [Google Scholar] [CrossRef]
- Neri, M.; Pilotelli, M.; Traversi, M.; Levi, E.; Piana, E.A.; Bannò, M.; Cuerva, E.; Pujadas, P.; Guardo, A. Conversion of End-of-Life Household Materials into Building Insulating Low-Cost Solutions for the Development of Vulnerable Contexts: Review and Outlook towards a Circular and Sustainable Economy. Sustainability 2021, 13, 4397. [Google Scholar] [CrossRef]
- Motz, H.; Geiseler, J. Products of steel slags an opportunity to save natural resources. Waste Manag. 2001, 21, 285–293. [Google Scholar] [CrossRef]
- Pasetto, M.; Baldo, N. Mix design and performance analysis of asphalt concretes with electric arc furnace slag. Constr. Build. Mater. 2011, 25, 3458–3468. [Google Scholar] [CrossRef]
- Gökalp, İ.; Uz, V.E.; Saltan, M.; Tutumluer, E. Technical and environmental evaluation of metallurgical slags as aggregate for sustainable pavement layer applications. Transp. Geotech. 2018, 14, 61–69. [Google Scholar] [CrossRef]
- Brand, A.S.; Fanijo, E.O. A Review of the Influence of Steel Furnace Slag Type on the Properties of Cementitious Composites. Appl. Sci. 2020, 10, 8210. [Google Scholar] [CrossRef]
- Abu-Eishah, S.I.; El-Dieb, A.S.; Bedir, M.S. Performance of concrete mixtures made with electric arc furnace (EAF) steel slag aggregate produced in the Arabian Gulf region. Constr. Build. Mater. 2012, 34, 249–256. [Google Scholar] [CrossRef]
- Pellegrino, C.; Cavagnis, P.; Faleschini, F.; Brunelli, K. Properties of concretes with Black/Oxidizing Electric Arc Furnace slag aggregate. Cem. Concr. Comp. 2013, 37, 232–240. [Google Scholar] [CrossRef]
- Coppola, L.; Buoso, A.; Coffetti, D.; Kara, P.; Lorenzi, S. Electric arc furnace granulated slag for sustainable concrete. Constr. Build. Mater. 2016, 123, 115–119. [Google Scholar] [CrossRef]
- Faleschini, F.; Brunelli, K.; Zanini, M.A.; Dabalà, M.; Pellegrino, C. Electric Arc Furnace Slag as Coarse Recycled Aggregate for Concrete Production. J. Sustain. Metall. 2016, 2, 44–50. [Google Scholar] [CrossRef]
- Rondi, L.; Bregoli, G.; Sorlini, S.; Cominoli, L.; Collivignarelli, C.; Plizzari, G. Concrete with EAF steel slag as aggregate: A comprehensive technical and environmental characterization. Compos. Part B Eng. 2016, 90, 195–202. [Google Scholar] [CrossRef]
- Saxena, S.; Tembhurkar, A.R. Impact of use of steel slag as coarse aggregate and wastewater on fresh and hardened properties of concrete. Constr. Build. Mater. 2018, 165, 126–137. [Google Scholar] [CrossRef]
- Fisher, L.V.; Barron, A.R. The recycling and reuse of steelmaking slags—A review. Resour. Conserv. Recy. 2019, 146, 244–255. [Google Scholar] [CrossRef]
- Guadagnino, P.; Cantone, L.; Conte, P.; Pocina, G.; Matarazzo, A.; Bertino, A. Techniques of reuse for slags and flakes from the steel industry: A circular economy perspective. In Proceedings of the Procedia Environmental Science, Engineering and Management, Rimini, Italy, 6–9 November 2018; Volume 5, pp. 93–99. [Google Scholar]
- Alves, J.; Espinosa, D.; Tenório, J. Recovery of Steelmaking Slag and Granite Waste in the Production of Rock Wool. Mater. Res. 2015, 18, 204–211. [Google Scholar] [CrossRef][Green Version]
- Roy, S.; Miura, T.; Nakamura, H.; Yamamoto, Y. Investigation on applicability of spherical shaped EAF slag fine aggregate in pavement concrete—Fundamental and durability properties. Constr. Build. Mater. 2018, 192, 555–568. [Google Scholar] [CrossRef]
- Roy, S.; Miura, T.; Nakamura, H.; Yamamoto, Y. Investigation on material stability of spherical shaped EAF slag fine aggregate concrete for pavement during thermal change. Constr. Build. Mater. 2019, 215, 862–874. [Google Scholar] [CrossRef]
- Biot, M.A. Theory of Propagation of Elastic Waves in a Fluid-Saturated Porous Solid. I. Low-Frequency Range. JASA 1956, 28, 168–178. [Google Scholar] [CrossRef]
- Zhou, B.; Zhang, J.; Li, X.; Liu, B. An Investigation on the Sound Absorption Performance of Granular Molecular Sieves under Room Temperature and Pressure. Materials 2020, 13, 1936. [Google Scholar] [CrossRef] [PubMed]
- Viet Dung, V.; Panneton, R.; Gagné, R. Prediction of effective properties and sound absorption of random close packings of monodisperse spherical particles: Multiscale approach. JASA 2019, 145, 3606–3624. [Google Scholar] [CrossRef]
- Zieliński, T.G. Microstructure-based calculations and experimental results for sound absorbing porous layers of randomly packed rigid spherical beads. JASA 2014, 116, 034905. [Google Scholar] [CrossRef]
- Tsuruha, T.; Yamada, Y.; Otani, M.; Takano, Y. Effect of casing on sound absorption characteristics of fine spherical granular material. JASA 2020, 147, 3418–3428. [Google Scholar] [CrossRef] [PubMed]
- Boubel, A.; Bousshine, S.; Garoum, M.; Ammar, A. Experimental Sound Absorption of Several Loose Uncooked Granular Materials. IJITEE 2019, 9, 4578–4583. [Google Scholar] [CrossRef]
- Zalewski, R.; Rutkowski, M. The use of Vacuum Packed Particles with adaptable properties in acoustic applications. J. Ther. Appl. Mech. 2018, 56, 403–416. [Google Scholar] [CrossRef]
- Asdrubali, F.; Schiavoni, S.; Horoshenkov, K. A Review of Sustainable Materials for Acoustic Applications. Build. Acoust. 2012, 19, 283–312. [Google Scholar] [CrossRef]
- Cobo, P.; Simón, F. A comparison of impedance models for the inverse estimation of the non-acoustical parameters of granular absorbers. Appl. Acoust. 2016, 104, 119–126. [Google Scholar] [CrossRef]
- Cobo, P.; Simón, F. Using simulating annealing for the inverse estimation of the non-acoustical parameters of sound absorbers. Build. Acoust. 2017, 24, 295–306. [Google Scholar] [CrossRef]
- Delany, M.E.; Bazley, E.N. Acoustical properties of fibrous absorbent materials. Appl. Acoust. 1970, 3, 105–116. [Google Scholar] [CrossRef]
- Miki, Y. Acoustical properties of porous materials-Generalizations of empirical models. J. Acoust. Soc. Jpn. 1990, 11, 25–28. [Google Scholar] [CrossRef]
- Voronina, V.V.; Horoshenkov, K.V. Acoustic properties of unconsolidated granular mixes. Appl. Acoust. 2004, 65, 673–691. [Google Scholar] [CrossRef]
- Horoshenkov, K.; Swift, M. The acoustic properties of granular materials with pore size distribution close to log-normal. JASA 2001, 110, 2371–2378. [Google Scholar] [CrossRef] [PubMed]
- Bérengier, M.; Stinson, M.; Daigle, G.; Hamet, J. Porous road pavements: Acoustical characterization and propagation effects. JASA 1997, 101, 155–162. [Google Scholar] [CrossRef]
- Attenborough, K. Acoustical characteristics of rigid fibrous absorbents and granular materials. JASA 1983, 73, 785–799. [Google Scholar] [CrossRef]
- Johnson, D.; Koplik, J.; Dashen, R. Theory of dynamic permeability and tortuosity in fluid-saturated porous media. J. Fluid Mech. 1987, 176, 379–402. [Google Scholar] [CrossRef]
- Allard, J.-F.; Atalla, N. Propagation of Sound in Porous Media: Modelling Sound Absorbing Materials, 2nd ed.; Wiley: Hoboken, NJ, USA, 2009; pp. 77–110. [Google Scholar]
- Champoux, Y.; Stinson, M.R. On acoustical models for sound propagation in rigid frame porous materials and the influence of shape factors. JASA 1992, 92, 1120–1131. [Google Scholar] [CrossRef]
- Atalla, Y.; Panneton, R. Inverse acoustical characterization of open cell porous media using impedance tube measurements. Can. Acous. 2005, 33, 11–24. [Google Scholar]
- Kidner, M.R.F.; Hansen, C.H. A comparison and review of theories of the acoustics of porous materials. IJAV 2008, 13, 112–119. [Google Scholar]
- Horoshenkov, K.V. A Review of Acoustical Methods for Porous Material Characterisation. IJAV 2017, 22, 99–103. [Google Scholar] [CrossRef]
- Alba, J.; del Rey, R.; Ramis, J.; Arenas, J. An Inverse Method to Obtain Porosity, Fibre Diameter and Density of Fibrous Sound Absorbing Materials. Arch. Acoust. 2011, 36, 561–574. [Google Scholar] [CrossRef]
- Bonfiglio, P.; Pompoli, F. Inversion problems for determining physical parameters of porous materials: Overview and comparison between different methods. Acta Acust. United Ac. 2013, 99, 341–351. [Google Scholar] [CrossRef]
- Allard, J.F.; Henry, M.; Tizianel, J.; Kelders, L.; Lauriks, W. Sound propagation in air-saturated random packings of beads. JASA 1998, 104, 2004–2007. [Google Scholar] [CrossRef]
- Bonfiglio, P.; Pompoli, F. Comparison of different inversion techniques for determining physical parameters of porous media. In Proceedings of the 19th International Congress on Acoustics, Madrid, Spain, 2–7 September 2007. [Google Scholar]
- Doutres, O.; Salissou, Y.; Atalla, N.; Panneton, R. Evaluation of the acoustic and non-acoustic properties of sound absorbing materials using a three-microphone impedance tube. Appl. Acoust. 2010, 71, 506–509. [Google Scholar] [CrossRef]
- Olny, X.; Panneton, R. Acoustical determination of the parameters governing thermal dissipation in porous media. JASA 2008, 123, 814–824. [Google Scholar] [CrossRef] [PubMed]
- Caniato, M.; D’Amore, G.K.O.; Kaspar, J.; Gasparella, A. Sound absorption performance of sustainable foam materials: Application of analytical and numerical tools for the optimization of forecasting models. Appl. Acoust. 2020, 161, 107166. [Google Scholar] [CrossRef]
- ASTM Standard E2611-19, Test Method for Normal Incidence Determination of Porous Material Acoustical Properties Based on the Transfer Matrix Method; ASTM International: West Conshohocken, PA, USA, 2019. [CrossRef]
- ASTM C423, Complete Document Standard Test Method for Sound Absorption and Sound Absorption Coefficients by the Reverberation Room Method; ASTM International: West Conshohocken, PA, USA, 2017.
Publisher’s Note: MDPI stays neutral with regard to jurisdictional claims in published maps and institutional affiliations. |
© 2021 by the authors. Licensee MDPI, Basel, Switzerland. This article is an open access article distributed under the terms and conditions of the Creative Commons Attribution (CC BY) license (https://creativecommons.org/licenses/by/4.0/).

