Abstract
In the case of prestressed concrete structures, information about the actual state of prestressing is an important basis for determining their load-carrying capacity as well as remaining service life. During the service life of the prestressed concrete structure, the initial level of prestressing is inevitably reduced as a result of the actions of various factors. These reductions of prestressing force are considered as prestress losses, which are influenced by construction stages, used materials, prestressing technology, or required length of service life. Available standards enable the determination of the expected values of prestress losses. Ultimately, their calculation is part of the design procedure of every prestressed concrete structure. However, aging and often neglected infrastructure in Europe is also exposed to factors, such as environmental distress, that are not considered in standard calculations. Therefore, verified and reliable methods for determining the actual state of prestressing are needed. This paper presents an experimental program of an indirect method for the evaluation of the value of prestressing force in seven prestressed concrete sleepers. Particularly, the non-destructive saw-cut method as a pivotal object of this study is performed and assessed. Furthermore, the Barkhausen noise technique is used as a comparative method. Subsequently, the experimental campaign is supported by the numerical analysis performed in the ATENA 3D software. Finally, the experimentally determined values of residual prestressing force are compared to the expected level of prestressing according to Eurocodes.
1. Introduction
In the field of civil engineering, prestressed concrete structures are generally considered one of the most recent types of constructions. The first successful applications of prestressed concrete were performed in the early 20th century and are attributed to French engineer Eugène Freyssinet [1]. He succeeded in replacing low-strength steel by using high-strength steel. For more than a century, prestressed concrete structures have become a common part of civil engineering since this type of construction material has many applications in bridge engineering and other engineering structures [2]. According to records, more than 45% of bridges built in the United States of America since 2010 have been designed as prestressed concrete structures [3]. Nowadays, new materials such as ultra-high-performance concrete (UHPC) can improve the mechanical properties of these structures [4]. The advantages of prestressed concrete come from the essence of preloading of structures by compressive force. This compressive load results in compressive stress that partially or fully counteracts tensile stress in the member, which is the crucial pitfall of plain concrete. Consequently, the invention of prestressed concrete has enabled the design of long-span bridges or the reduction of cross-sectional dimensions of the member. Moreover, in contrast to reinforced concrete, compressive stress in prestressed concrete results in a crack-free structure with preserved stiffness, lower deflections, and better protection against environmental distress. However, the design process is more complicated, and a higher level of quality control is required [1,2,5].
Two prestressing technologies are recognized. In the case of pre-tensioned concrete structures, the member is cast around the straight strands or wires that are tensioned between stands. The prestressing force is transferred into the pre-tensioned structure through the bond between the steel reinforcement and concrete. This technology finds its application in short-span or medium-span bridges, structures, or railway sleepers. The second prestressing technology is so-called post-tensioning. In this case, the prestressing force is applied by jacking steel tendons against an already-cast member, so the prestressing is transferred through built-in anchorages. Moreover, if the space between the tendon and the duct is injected with cement grout, strands are protected against corrosion and the prestressing is transferred also through the bond between the steel strands or wires and concrete. This technology enables the design of long-span structures and curved tendons and thus provide suitable redistribution of internal forces by changing the eccentricity of the prestressing force [2,6].
In Slovakia, the first attempts to introduce prestressed concrete bridges date back to the second half of the previous century, so currently, these structures are approaching 60 years of service [7]. Generally, their present structural condition is not appropriate. This fact is closely related to their maintenance, inadequate inspection, external loads, and careless conceptual design [8,9,10]. In the coming decades, many aged bridges will require the evaluation of their load-carrying capacity and remaining service life. This will result in the application of reliable methods for the evaluation of residual prestressing force. Our generation and the next will have to decide whether these bridges should be replaced by new, technically more advanced structures or preserved after certain strengthening. The general condition of existing bridges not only reflects the level of development of the society in which they were built but also the cultural and economic power of the present generation, as they reflect the care for these inherited engineering works [11]. This is not a problem only in Slovakia as the aging transport infrastructure in most European countries and the United States of America is more than 50 to 60 years old and requires rehabilitation based on structural assessments [12,13]. Currently, the research activities of the Department of Structures and Bridges are focused mainly on reliability assessments and investigations of existing steel and concrete bridges, along with their possible rehabilitation [14].
In general, the value of prestress losses is less than 25% of the initial prestressing force, while the reported average value based on the results of more than forty studies is 21% [3]. The design of prestressed concrete structures always respects used prestressing technology as it influences the evaluation of prestressing force value over time. Prestress losses that immediately affect the level of prestressing fall into the group of short-term losses (ΣΔσp,short). These include, for example, elastic shortening, anchorage draw-in or slip, short-term steel relaxation, temperature losses, and friction. On the other hand, reductions of prestressing force that occur gradually with time are called long-term losses (ΣΔσp,long). This group is related to material behaviour and includes time-dependent losses such as concrete shrinkage, concrete creep, and long-term steel relaxation [2,5,6]. Nevertheless, prestressed concrete structures in service are influenced also by factors that are not considered in the above-mentioned standard approach for the evaluation of prestress losses. One of the most critical types of damage in tendons leading to additional prestress losses (ΣΔσp,add) is corrosion, which is difficult to detect through regular inspection. Corrosion-induced failure may cause an unexpected collapse of a bridge. Once corrosion is found in a tendon, it is a difficult task to quantify the level of corrosion and its location through the entire length of the tendon [15]. In the case of prestressing steel corrosion or stress evaluation, the usage of magnetic Barkhausen noise (MBN) can offer an effective tool for its assessment [16,17,18]. Consequently, the application of methods considering all factors decreasing the value of prestressing force is necessary. Figure 1 represents the idealized relation between stress in a prestressing tendon and time. In this figure, σp,max is maximum prestressing steel stress and σp,m0 is stress after transmission according to Eurocodes.
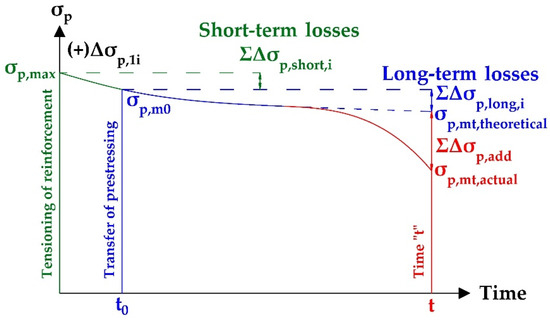
Figure 1.
Stress in a prestressing tendon over time.
2. Monitoring of Prestressing Force
Nowadays, several methods for monitoring the prestressing force value are available. These approaches fall into two main categories: direct and indirect methods. The principle of direct methods is the evaluation of the prestressing force directly from the results of the measurement (elasto-magnetic method, vibration-based methods, etc.) [19]. The benefit of these techniques is the possible real-time monitoring of the prestressing force. Unfortunately, the application of direct methods in existing structures is very limited [20]. Therefore, the implementation of indirect methods for determining the state of prestressing on prestressed concrete structures in service appears to be a suitable alternative. On one hand, direct methods are mainly non-destructive, but on the other hand, indirect methods can be both non-destructive and destructive (or semi-destructive). Classification of indirect methods according to their influence on the investigated structure is in some cases problematic and depends on the point of view of the author. Generally, the techniques with only a local effect on the structure can be considered as non-destructive or semi-destructive, as damages caused by their application can be properly and easily repaired without any long-term impact on the structure’s integrity and durability. Indirect methods for determining the state of prestressing include, for example, methods based on stress relief in a concrete member such as the saw-cut method, stress-relief coring technique (or drilling method), strand-cutting method (or wire-cutting method), exposed strand method, and structural response methods (crack initiation method and crack reopening method) [21,22,23].
The presented paper is focused on the study of the non-destructive saw-cut method performed on seven prestressed concrete sleepers. Subsequently, obtained results are verified using MBN and compared with values of prestressing force determined using standard calculation. The concept of the saw-cut method is the isolation of a concrete block from acting forces caused by saw-cuts. The value of the prestressing force is then derived from stress (or strain) change monitored in the area adjacent to performed saw-cuts. It can be stated that the concrete block is fully isolated if the increasing depth of the performed saw-cuts no longer initiates any significant change of the measured stress (strain). Recorded stress is the basis for the evaluation of the residual prestressing force value in the examined structure. If it is possible to determine the ratio of the released stress, e.g., by application of validated results of numerical analysis, full isolation of the concrete block is not necessary. This approach is used in the case of old structures with considerably low concrete cover, which limits the maximal depth of the applied saw-cuts. Consequently, saw-cuts have only a negligible local impact on the prestressed concrete structure. For this reason, the saw-cut method is considered a non-destructive indirect method [23,24]. When using the saw-cut method on an unloaded structure, the residual prestressing force can be determined according to Equation (1). This equation is applicable in the case of an uncracked member with a linear distribution of stress. Nevertheless, if the investigated prestressed concrete structure is loaded by the external load, additional stress resulting from this load has to be considered. In Equation (1), σc,0 represents the initial stress in the concrete member, MG is the bending moment due to dead load, epi is the eccentricity of prestressing reinforcement from the neutral axis of an ideal cross-section, while Iyi (second moment of inertia), Ai (cross-sectional area), and zi (position of neutral axis from the edge of the cross-section) are characteristics of the ideal cross-section. In both mentioned cases, using results directly from the numerical analysis is practical.
Pmt,actual = − [ σc,0 − (MG/Iyi) × zi]/[(1/Ai) + (epi/Iyi) × zi]
The future of non-destructive saw-cut testing is very promising. Several experiments have been conducted in the field of evaluation of residual prestressing force [1,3,21,23]. The results suggest that techniques such as stress relief methods that provide general information of the state of prestressing are more applicable for subsequent determination of the load-carrying capacity of prestressed concrete bridges in service. Results obtained from the limited number of tendons (e.g., using the elasto-magnetic method, strand-cutting method, or wire-cutting method, etc.) should not be generalized, since this assumption could lead to incorrect conclusions about the actual state of prestressing. The application of the saw-cut method is suitable mainly when testing prestressed concrete bridges consisting of individual girders. Fortunately, a large amount of aging prestressed concrete short-span and medium-span bridges consist of individual beams. The concept of isolating a concrete block in the case of prestressed concrete slabs or box girder bridges should also be further investigated. The application of stress relief methods on these types of structures can be similar to cases of massive structures (e.g., dams), which were tested, for example, in [25,26].
Another possible way to determine stress in prestressing wires is via MBN, which can be found in ferromagnetic bodies as a result of the discontinuous motion of domain walls [27]. Microstructure imperfections act as pinning sites for domain walls in motion. Moreover, the initiation of domain wall motion can also be detected when the magnetic field attains critical strength, which depends on the pinning strength of pinning sites in the microstructure. Electromagnetic pulses produced during discontinuous domain wall motion can be acquired on the surface. Apart from the microstructure, stresses also remarkably affect Barkhausen noise via domain wall alignment [28,29,30,31,32,33,34]. On the other hand, lattice imperfections affect mainly the length of domain wall motion. Increasing of Barkhausen noise versus increasing tensile stress in Fe alloys is due to positive magnetostriction [30,31,32]. The Barkhausen noise method is time-saving and portable. However, this technique is sensitive against surface damage, expressed in such terms as the alteration of the microstructure as well as the stress state. These surface damages, which are not unusual in the case of prestressing wires in existing structures, can negatively influence the accuracy of the measurement. Nowadays, MBN has already been adapted for the assessment of the extent of corrosion in wires [17,35]. Thus, a presented study is focused on its verification in the field of prestressed concrete structures assessment.
3. Experimental Program
The presented experimental program was performed to broaden current limited knowledge about the non-destructive saw-cut method, which was studied, for example, in [21,23]. Obtained results were verified using the Barkhausen noise technique, which was performed on one prestressing wire in Specimen 4 as a comparative method.
In the experimental campaign, seven pre-tensioned sleepers were tested in the Laboratory of Civil Engineering of the University of Žilina. One of the specimens can be seen in Figure 2. The length of each specimen was 2600 mm. The cross-section of sleepers was variable with a minimal height of 175 mm in the middle area and the maximal height was 234 mm. The minimal width of the cross-section at the bottom edge was 220 mm, while the maximal value was 300 mm. The upper edge of the sleepers was wide, ranging from 145.9 mm to 171 mm. Additional dimensions and the reinforcement layout of tested prestressed concrete sleeper type B70 W-49 G is shown in Figure 3. The producer declares that the specimens were made from concrete strength class C50/60 [36] and their weight was 288 kg. Prestressing was provided by overall eight prestressing wires with a diameter of 7 mm, whereas the surface of wires was smooth. At the time of testing, investigated specimens were one year old.
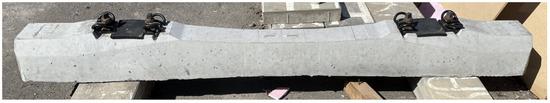
Figure 2.
Investigated prestressed concrete sleeper.
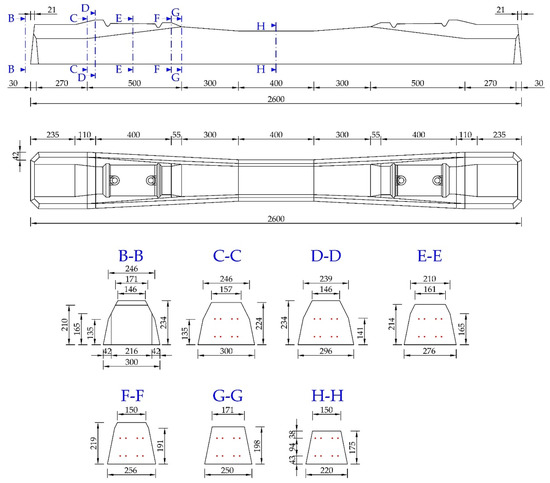
Figure 3.
Dimensions of specimens (prestressed sleeper B70 W-49 G).
3.1. Material Properties
Knowledge of material properties is crucial information for experimental and numerical evaluation of residual prestressing force values [37]. Consequently, the experimental measurements included the determination of material properties.
3.1.1. Concrete
The experiment included the laboratory test of two cylinders with a diameter of 70 mm that were removed from the prestressed concrete sleeper, see Figure 4. For the removal of cylindrical samples from the sleeper, a core drill with an outer diameter of 78 mm was used. The height of the tested cylinder samples was 140 mm. Successful analysis of prestressing using saw-cut methods depends mainly on the correct determination of the concrete’s modulus of elasticity. Provided laboratory testing of the material properties of concrete provided the value of the secant modulus of elasticity and the cylindrical compressive strength. The mean cylindrical compressive strength fc,cyl was 63.3 MPa and the mean secant modulus of elasticity Ec was 37.4 GPa. Obtained results from material properties testing are presented in Table 1. Parenthetically, when using the saw-cut method, the values of the compressive strength of concrete are not strictly required as they do not affect the local stress change in the area adjacent to the performed saw-cuts. In the material properties testing, linear foil strain gauges HBM LY41-50/120 made of ferritic steel (temperature matching code “1”: 10.8 × 10⁻⁶/K) with a measuring grid length of 50.0 mm and a total length of 63.6 mm were installed on the samples.
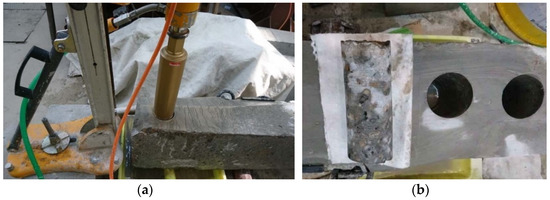
Figure 4.
Preparation for material properties testing. Drilling (a); removed samples (b).

Table 1.
Materials properties of concrete.
3.1.2. Prestressing Steel
Determination of the prestressing wires’ properties was performed as part of the experimental program, too. After the application of saw-cuts, prestressing wires were exposed and then two samples were removed from the prestressed concrete sleeper for material testing, see Figure 5. Eventually, based on the laboratory tensile test, the mean measured tensile strength of the prestressing wires fp was 1736 MPa and the mean 0.1% proof-stress fp0.1 was 1547 MPa. Obtained properties are listed in Table 2. The evaluation test procedure according to ISO 6892-1:2019 [38] was performed using the Instron Universal Testing Machine with a testing capacity up to 200 kN. The test rates and control were set according to “Method A” recommended ranges. The diameter of the prestressing wire with a smooth surface was 7 mm, so its cross-sectional area Ap was 38.5 mm2. The stress–strain curve of the tested samples of prestressing wires is shown in Figure 6.
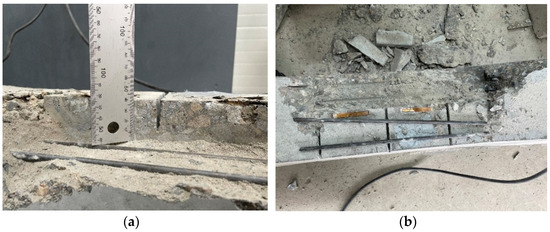
Figure 5.
Sampling procedure of steel. Exposed prestressing wires (a); samples (b).
Table 2.
Materials properties of prestressing steel.
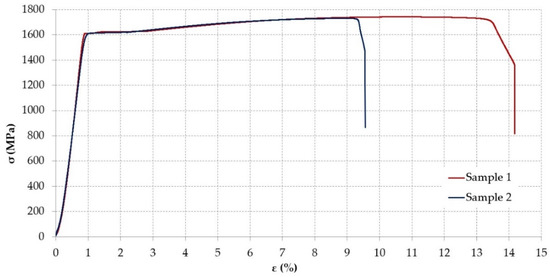
Figure 6.
Stress–strain curve of tested samples of prestressing wires.
3.2. Saw-Cut Method
Overall, three saw-cuts with an identical axial distance of 120 mm were applied on the upper edge in the middle area of the prestressed concrete sleepers. The sawing was performed in three increments, whereas the depth of the saw-cuts was 10, 20, and 30 mm. The measurement is shown in Figure 7. Maximal depth was chosen with respect to specimens’ reinforcement. We intended to avoid cutting the sleepers’ prestressing wires, which could affect the integrity of specimens. After each step, we waited for the stabilization of the recorded stress (strain) reading. In the experimental measurements, linear foil strain gauges HBM LY41-50/120 made of ferritic steel (temperature matching code “1”: 10.8 × 10⁻⁶/K) with a measuring grid length of 50.0 mm and a total length of 63.6 mm were used to record the strain. The linear foil strain gauges were installed in the middle of the axial distance between the saw-cuts. Transversely, they were applied to the centre of the upper edge of the sleepers. The scheme of saw-cuts and position of strain gauges can be seen in Figure 8.
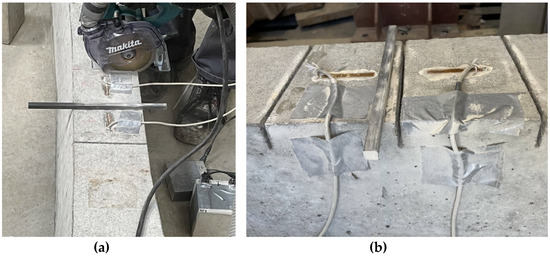
Figure 7.
Application of the saw-cut method. Sawing (a); final saw-cuts (b).
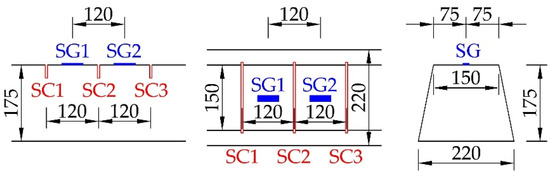
Figure 8.
Position of saw-cuts (SC) and strain gauges (SG).
Quality of the specimens’ surface and grain size are important factors for stress (or strain) measurements. Thus, a foil strain gauge should be selected considering these parameters. It is necessary to identify the aggregate grain size of the examined prestressed concrete structure and then prepare a smooth surface before installing a strain gauge. These difficulties result from the inhomogeneity of the concrete. Generally, in the case of precast concrete members, such as prestressed concrete sleepers, the better quality of used concrete can be expected. Nevertheless, some aged monolithic structures can be, in terms of concrete quality, very problematic. For the strain measurements, as can be seen in Figure 9, the measuring grid length of the strain gauge should be at least five times as long as the largest aggregate grain size. In the case of the precast concrete sleepers in question, the 50 mm long measuring grid was sufficient.
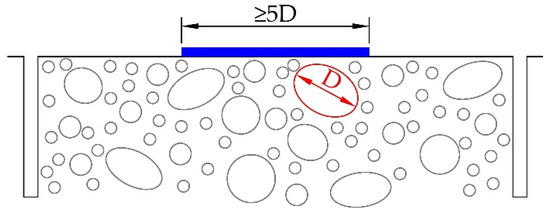
Figure 9.
Length of measuring grid of strain gauges considering aggregate grain size.
Analysed specimens were supported by two lines at a distance of 100 mm from the ends, see Figure 10. Supports consisted of steel rollers, thus the static scheme of the simply supported beam with the effective length of 2400 mm was created.
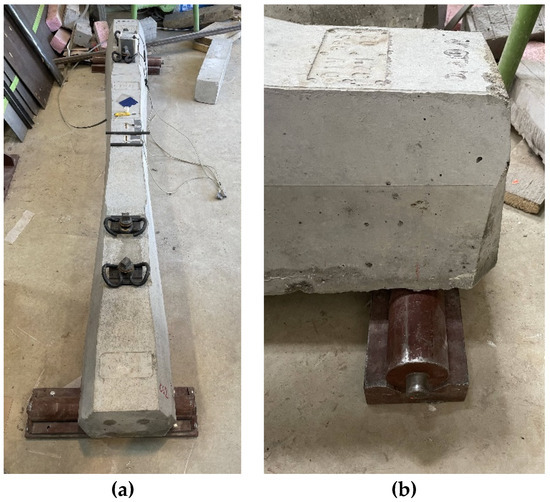
Figure 10.
Supported prestressed concrete sleeper during the experiment (a) view, (b) detail.
Recorded stress readings from testing of all seven specimens are presented in Figure 11. Evaluation of obtained results was based on the real value of the concrete’s modulus of elasticity determined via removed cylindrical samples in the experimental program.
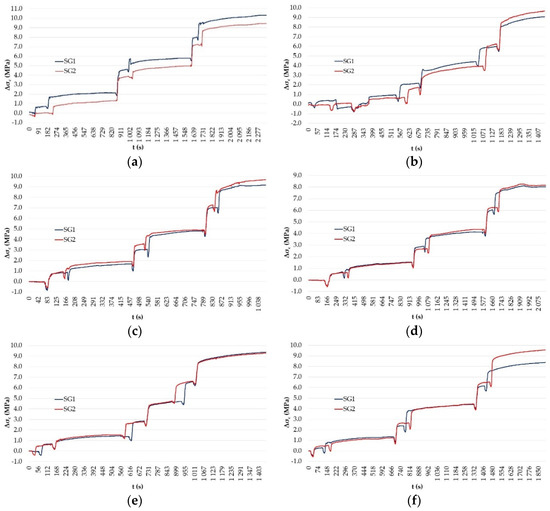
Figure 11.
Recorded stress relief in specimens. 1 (a); 2 (b); 3 (c); 4 (d); 5 (e); 6 (f); 7 (g).
3.3. Barkhausen Noise Technique
The Barkhausen noise investigation was carried out on one upper prestressing wire from Specimen 4. The scheme of the test is displayed in Figure 12. The experiment consisted of MBN measurement of the prestressing wire in the prestressed concrete sleeper at three points (Points I-III), removing of the wire, and subsequent calibration measurement in the laboratory under predefined loads (tensile stresses: 0; 100; 200; 400; 600; 800; 1000; and 1200 MPa). Finally, the obtained MBN signals were compared with signals measured on the specimen. For the measurement, the RollScan 350 (Stresstech, Jyväskylä, Finland) was used. The analysis was carried out with the MicroScan 600 Software with the following parameters: magnetising voltage, 5 V; magnetising frequency, 125 Hz; sensor type, S1-18-12-01; frequency range of magnetic Barkhausen noise pulses in the range of 10–1000 kHz. The signals were obtained by averaging 10 MBN bursts. Magnetic Barkhausen noise refers to the root mean square effective (RMS) value of the signal [16,17,39]. Performance of the MBN measurement can be seen in Figure 13, whereas obtained results are presented in Figure 14. The investigation provided the following detected values of rms of MBN (mV): 270.44 ± 14.0 (Point I); 255.51 ± 15.0 (Point II); and 287.76 ± 15.5 (Point III).
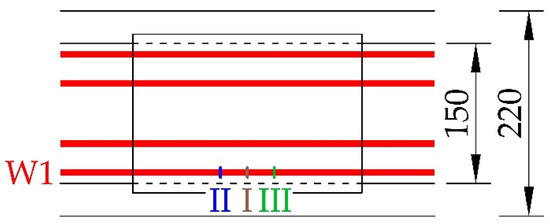
Figure 12.
Scheme of MBN measurement (Specimen 4; Wire 1).
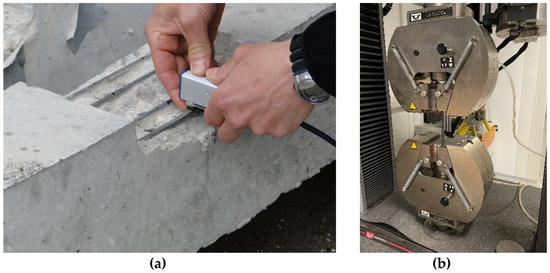
Figure 13.
Magnetic Barkhausen noise measurement (a); calibration (b).
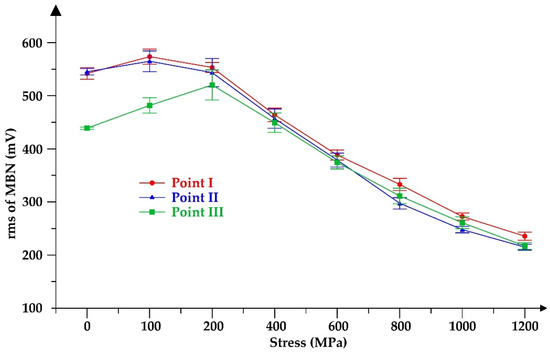
Figure 14.
MBN as a function of stress (Specimen 4; Wire 1).
4. Numerical Analysis
For the verification of experimental measurements, a nonlinear numerical analysis using the ATENA 3D software (version ATENA 5.7.0n, Červenka Consulting, Prague, Czech Republic) was performed [40,41]. The pre-tensioned concrete sleeper was modelled to simulate stress relief after the application of saw-cuts. The numerical 3D model is shown in Figure 15. Individual parts of the prestressed concrete sleeper (macro-elements) were assigned the real dimensions, but some minor simplifications were applied in regard to preserving the global behaviour of the specimen. Consequently, stress relief was observed only in the middle area where the saw-cuts were performed. A cross-section of the investigated middle area of the prestressed concrete sleeper was modelled with real geometry. The line supports were modelled at a distance of 100 mm from the ends of the specimen, and as a result, the effective length of the prestressed concrete sleeper with the static scheme of the simply supported beam was 2400 mm. Thus, the actual position of supports in the experimental program was respected. The prestressing wires were modelled as prestressing reinforcement bars (1D elements) using the bond model “perfect connection”.
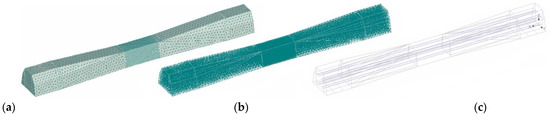
Figure 15.
3D numerical model (a); FE mesh (b); prestressing reinforcement wires (c).
Material parameters were adopted in compliance with material properties testing, which was part of the experiment. Nevertheless, detailed material properties that were not determined experimentally were defined according to the recommendations listed in [40]. Prestressed concrete sleepers were modelled using material “3D Nonlinear Cementitious 2”. The finite element (FE) mesh has a crucial influence on the applicability of the results. Generally, it is recommended to use at least four to six elements per thickness of macro-element. All used elements were tetrahedral element CCIso Tetra, see Figure 15. Global element size was set to 0.065 m, whereas the decisive central macro-element important for saw-cut testing analysis was refined into tetrahedral elements with a size of 0.015 m. The contacts between macro-elements were attributed mesh refinement with a magnitude of 0.50. Based on previously mentioned parameters, an automatic mesh generator implemented in the ATENA 3D software generated meshes and data of the FE model. The ATENA FE library includes 3D solid tetrahedral element CCIso Tetra, which the detailed mathematical description containing interpolation functions is given in [40]. The geometry of the used tetrahedral element CCIso Tetra is presented in Figure 16.
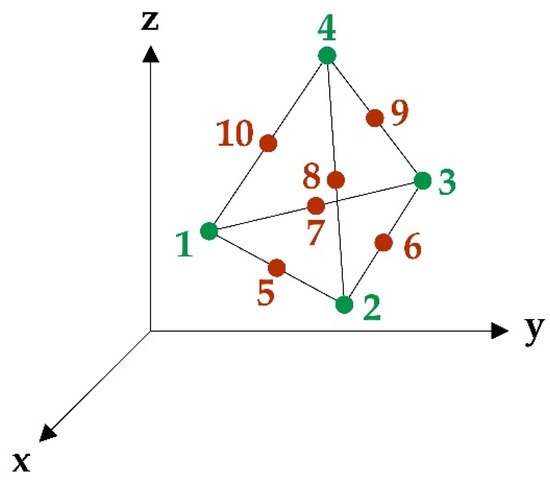
Figure 16.
Geometry of tetrahedral element CCIso Tetra [40].
The Fracture–Plastic “3D Nonlinear Cementitious 2” Model combines constitutive models for tensile—fracturing, and compressive—plastic behaviour. The fracture model of the numerical simulation is established on the classical orthotropic smeared crack formulation and crack band model. The analysis employs the Rankine failure criterion, exponential softening, and it can be used as a rotated or fixed crack model. The Menétrey–Willam failure surface is the basis for the hardening and softening plasticity model. Eventually, the model operates a return mapping algorithm for the integration of constitutive equations. The development of an algorithm for the combination of the two models is considered. The combined algorithm is based on a recursive substitution, and it allows for the two models to be developed and formulated separately. The material model formulation is established on the strain decomposition into elastic, plastic, and fracturing components. More information about the Fracture–Plastic Constitutive Model can be found in [40]. The relation between uniaxial stress and strain for concrete material can be seen in Figure 17a. In performed numerical analysis, the prestressing reinforcement was modelled as discrete in the form of reinforcement bars (truss elements). The assumption of elastic-perfectly plastic (bilinear law) was applied. The stress–strain curve for prestressing steel adopted in the numerical model is shown in Figure 17b [40,41,42].
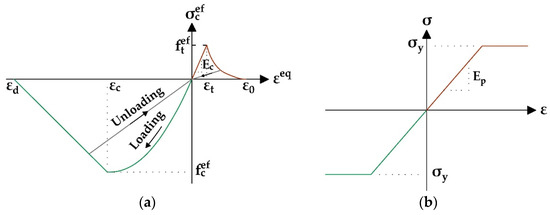
Figure 17.
Uniaxial stress–strain curve for concrete (a); stress–strain curve for wires (b) [40].
The analysis was performed using the Newton–Raphson method that keeps the load increment unchanged and iterates displacements until equilibrium is satisfied within the given tolerance. Thus, this method should be applied when load values must be exactly met. It should be used in the case of loads including body forces, temperature, shrinkage, and prestressing. Overall, three loading cases were used: supports (LC1), body force (LC2), and prestressing (LC3).
The application of the saw-cuts in the 3D numerical analysis was modelled using “construction stages”. In Stage 0, the initial cross-section of the prestressed concrete sleeper was used. Subsequently, the saw-cuts were applied gradually by increasing their depth by 10 mm (Stages 1 to 3). These stages respect the process of sawing that was practiced in the experimental campaign. As a result of numerical analysis, stress change was observed after every stage and later compared to experimental measurements. The view of the middle area of the specimen in each construction stage is shown in Figure 18.
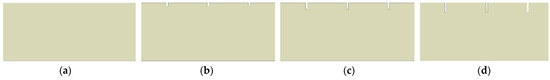
Figure 18.
Stage 0: h = 0 mm (a); Stage 1: h = 10 mm (b); Stage 2: h = 20 mm (c); Stage 3: h = 30 mm (d).
The location of stress monitoring points, which can be seen in Figure 19, was adopted according to the real position of strain gauges in the experiment. In the 3D model, each strain gauge was represented by nine monitoring points at a distance of 5 mm from each other. Finally, the stress change was determined as the average of the values obtained at the individual monitoring points over a length of 50 mm, which was chosen to express the measuring grid length of the strain gauges.
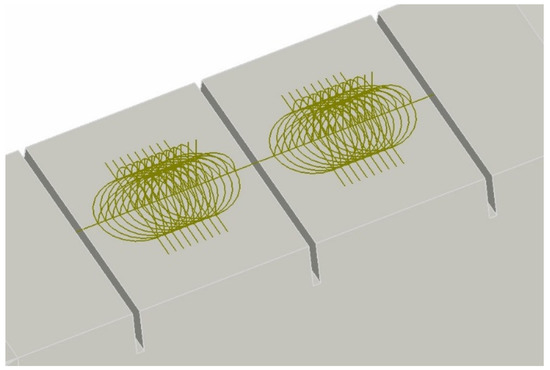
Figure 19.
Stress monitoring points in the numerical model.
5. Discussion
As a part of the prestress losses evaluation, the stress in the prestressing wires, considering the expected prestress losses after one year (365 days), was determined according to the Eurocodes [43,44,45]. The maximal value of stress in prestressing steel of 1389 MPa was calculated using Equation (2), the end of the curing after three days, and relative humidity of 65%, were taken into account. Accordingly, Equation (3) enables determining the overall maximal prestressing force in specimens (Pmax). In these two equations, fp represents tensile strength, fp,0.1 is 0.1% proof-stress, and Ap is the value of the cross-sectional area of prestressing steel.
σp,max = min [0.80 × fp; 0.90 × fp,0.1] = 1389 MPa
Pmax = Σ [σp,max,i × Ap,i] = 428 kN
The standard value of prestressing force determined in compliance with the Eurocodes [43,44,45] after 365 days in one wire was 45.5 kN, whereas the overall residual prestressing force in the prestressed concrete sleeper (Pmt,theoretical) was 364.1 kN. The expected value of prestress losses in one wire was 7.9 kN and the total value (ΔPmt,theoretical) in all eight wires was 63.5 kN. Consequently, in a period of 365 days, the maximal prestressing force was expected to be decreased by 14.8%. Comparisons of stress relief results from the experimental measurements and numerical analysis are displayed in Figure 20. In this figure, stress relief curves from the numerical analysis (for prestress losses of 10, 15, and 20%) are compared to the experimentally measured values. As can be seen in Figure 21, the initial stress value does not influence the percentage stress relief rate. The example of stress change from numerical analysis for a specimen with expected prestress losses of 15% is presented in Figure 22. Obtained results from the numerical and experimental analyses suggest that percentage stress relief should not be influenced by the type of prestressed concrete member. A similar experiment was performed on post-tensioned beam and stress [23,24]. Therefore, local stress change monitored in the area adjacent to performed saw-cuts should be universal.
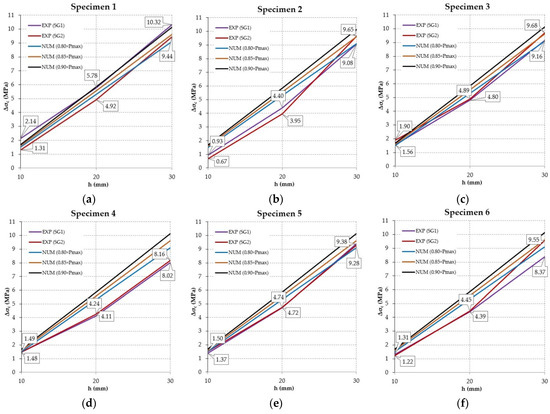
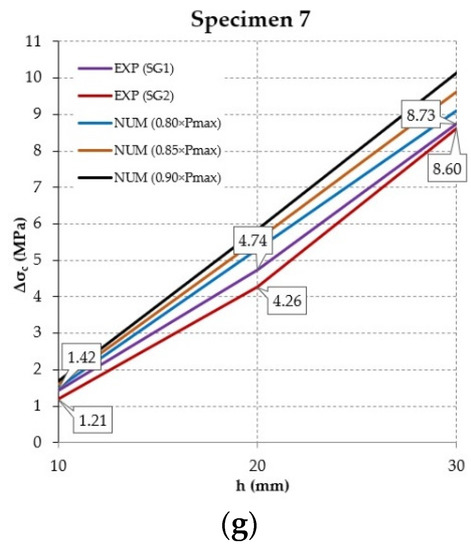
Figure 20.
Comparison of experimental and numerical analyses. 1 (a); 2 (b); 3 (c); 4 (d); 5 (e); 6 (f); 7 (g).
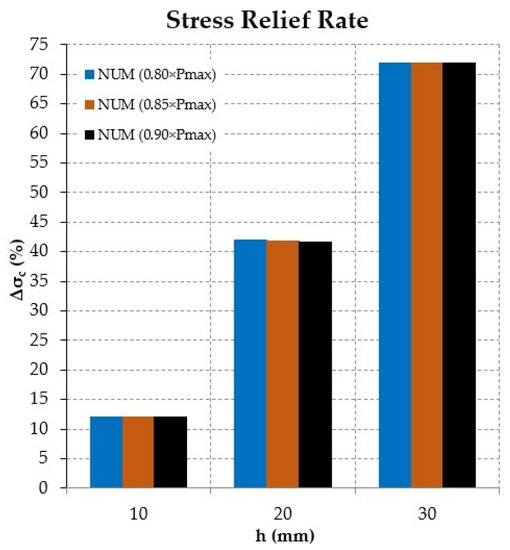
Figure 21.
Stress relief rate for three depths of saw-cuts.
Figure 22.
Stress change for p = 0.85×Pmax. Stage 0 (a); Stage 1 (b); Stage 2 (c); Stage 3 (d).
The methodology for assessment of prestress by the use of Barkhausen noise in wires is based on the measurement of Barkhausen noise emission in the prestressed state directly in the sleeper and fitting the data with calibration evolution (further details can be found in [39]). Barkhausen noise tends to grow versus tensile stress due to the realignment of domain walls into the direction of load. However, the wires matrix has been already fully strained along the wire length [16]. For this reason, this mechanism is consumed and the evolution between Barkhausen noise and amplitude of tensile stresses is reversed (further details can be found in [16]). The values of stress and prestress losses in the investigated wire from Specimen 4 determined using the magnetic Barkhausen noise are listed in Table 3. In the middle, Point I, the prestress losses determined using the MNB technique represented 26.4 ± 5.7%.
Table 3.
Results from the MBN measurement (Specimen 4; Wire 1).
6. Conclusions
This paper focused on the comparison of the standard value of prestress losses with the experimentally determined actual state of prestressing performed on precast pre-tensioned sleepers. Based on the experimental and numerical analyses, the following conclusions can be summarized:
An essential fact resulting from our investigation is that the presented methods can be performed without the application of an external load. Therefore, the application of these techniques on existing prestressed concrete bridges (or structures in general) can be performed quickly and easily and does not require expensive tools.
In the case of saw-cuts with a depth of 20 mm, obtained stress relief curves show some discrepancies from the linear association between stress change and the depth of saw-cuts. These differences could be attributed to unsatisfactory stabilization of strain reading and should be studied in the future. Therefore, it is suitable to apply saw-cuts gradually to check the expected linearity of the stress relief curve. On the other hand, 10- and 30-mm deep saw-cuts showed good conformity with the numerical analysis.
Residual prestressing force determined using the saw-cut method after one year in almost all tested prestressed concrete sleepers varied from 80 to 90% (in some cases even lower). Consequently, according to numerical and experimental analysis, the value of prestress losses was mainly from 10 to 20%. These values are related to the standard maximal value of prestressing force (Pmax). As a result, obtained prestress losses show good agreement with the Eurocodes (14.8%). In practical use, it would be necessary to use a conservative value to determine the load-carrying capacity of the prestressed concrete structure.
Obtained results suggest that a relatively small intervention into the concrete structure could lead to notable local stress relief. In the case of 30-mm deep saw-cuts in the axial distance of 120 mm, it was possible to evoke approximately 70% stress change. Such intervention was negligible in comparison to the cross-section of the prestressed concrete structure. Hence, the integrity of the structure was preserved, and simultaneously, important data about residual prestressing force could be recorded. In practice, the underestimation of the value of prestressing losses affected, for example by corrosion, can lead to failure of the prestressed concrete structure.
An important factor for the successful indirect determination of residual prestressing force using the saw-cut method is knowledge of real material properties. The modulus of elasticity plays an especially key role in the presented method. Unreliable values of material properties can lead to dangerous discrepancies, which would ensue in an incorrect evaluation of load-carrying capacity and remaining service life of the investigated prestressed concrete structure.
In our opinion, the main outcome of our study is that the measurements confirmed the assumption of linear association between the depth of saw-cuts and stress relief. This fact could help engineers in cases when it is not possible to cause 100% stress change in the monitored area. The axial distance between saw-cuts of 120 mm seems to be sufficient, as the installed strain gauges should not be damaged during sawing.
The application of the magnetic Barkhausen noise technique confirmed the results obtained from saw-cut testing. However, values of prestress losses determined using the MBN method seemed to be more conservative. The interval of prestress losses after the evaluation is wide. Therefore, the practical use of this method is dependent on the quality of the performed measurement and the state of investigated prestressing wire. These results can be negatively influenced by surface damage of prestressing steel. Therefore, a detailed inspection of the investigated wire should be part of the evaluation. Naturally, the detection of microscopic damages is quite complicated.
According to the saw-cut method, in the case of Specimen 4, the prestress losses seemed to be higher than 20%. Consequently, the agreement between the saw-cut method and the MBN technique (26.4 ± 5.7% in Point I) was sufficient.
Our results are encouraging but should be further validated by analysing a larger number of specimens. On a wider level, research is also needed to determine the accuracy of the given approach by comparing it with other methods for residual prestressing force monitoring. Introduced experimental measurements were conducted only on members under compressive stress. Therefore, further analysis which could provide data about tensile stress relief would contribute to our knowledge in this field. We hope that our conclusions might be useful in the field of non-destructive assessment of existing prestressed concrete bridges (or structures). However, given that our findings are based on a limited number of performed tests, the results from such an experimental program should, therefore, be treated with considerable caution. In practice, the application of at least two different indirect methods could provide adequate data about the actual state of prestressing.
Author Contributions
Conceptualization, J.K., F.B. and M.M.; data curation, J.P., M.N. and F.B.; software, J.K. and F.B.; validation, J.K., J.P., M.M., M.N. and F.B.; formal analysis, J.K.; measurements, J.K., F.B., J.P. and M.N.; writing—original draft preparation, J.K., M.N. and M.M.; visualization, J.K. and F.B. All authors have read and agreed to the published version of the manuscript.
Funding
This publication was realized with the support of the Slovak Grant Agency under contracts No. 1/0045/19 and No. 1/0306/21 and Operational Program Integrated Infrastructure 2014-2020 of the project: Innovative Solutions for Propulsion, Power and Safety Components of Transport Vehicles, code ITMS 313011V334, co-financed by the European Regional Development Fund.
Institutional Review Board Statement
Not applicable.
Informed Consent Statement
Not applicable.
Data Availability Statement
Not applicable.
Conflicts of Interest
The authors declare no conflict of interest.
Nomenclature
| SC | saw-cut, |
| CS | concrete specimen, |
| FE | finite element, |
| SG | strain gauge, |
| MBN | magnetic Barkhausen noise, |
| LC | load case, |
| UHPC | ultra-high performance concrete, |
| t0 | time of transmission of prestressing (days), |
| t | time of prestressing determination (days), |
| σp,max | maximum prestressing steel stress according to Eurocodes (MPa), |
| σp,m0 | prestressing steel stress after transmission according to Eurocodes (MPa), |
| σp,mt,theoretical | prestressing steel stress according to Eurocodes (MPa), |
| σp,mt,actual | actual (residual) prestressing steel stress (MPa), |
| ΣΔσp,short,i | short-term losses (MPa), |
| ΣΔσp,long,i | long-term losses (MPa), |
| ΣΔσp,add,i | additional losses (MPa), |
| ε | strain (%), |
| D | diameter of the largest aggregate grain size (m), |
| σc,0 | initial stress in concrete (MPa), |
| Δσc | change in stress (MPa), |
| Pmax | maximum prestressing force according to Eurocodes (kN), |
| Pmt,theoretical | prestressing force according to Eurocodes (kN), |
| Pmt,actual | actual (residual) prestressing force (kN), |
| ΔPmt,theoretical | prestress losses according to Eurocodes (kN), |
| ΔPmt,actual | actual (experimentally determined) prestress losses (kN), |
| Ai | ideal cross-sectional area (m2), |
| Ap | cross-sectional area of prestressing steel (m2), |
| epi | ideal eccentricity of prestressing force from the neutral axis (m), |
| Iyi | ideal second moment of inertia (m4), |
| zi | position of the neutral axis of an ideal cross-section from the edge (m), |
| MG | moment due to dead load (kNm), |
| Ec | secant modulus of elasticity of concrete (MPa), |
| Ep | modulus of elasticity of prestressing steel (MPa), |
| fc,cyl | cylindrical compressive strength of concrete (MPa), |
| fp | tensile strength of prestressing steel (MPa), |
| fp,0.1 | 0.1% proof-stress of prestressing steel (MPa). |
References
- Bonopera, M.; Chang, K.-C.; Lee, Z.-K. State-of-the-Art Review on Determining Prestress Losses in Prestressed Concrete Girders. Appl. Sci. 2020, 10, 7257. [Google Scholar] [CrossRef]
- Hurst, M.K. Prestressed Concrete Design, 2nd ed.; E & FN SPON, An Imprint of Routledge: London, UK, 1998. [Google Scholar]
- Abdel-Jaber, H.; Glisic, B. Monitoring of prestressing forces in prestressed concrete structures—An overview. Struct. Control Health Monit. 2019, 26, e2374. [Google Scholar] [CrossRef]
- Pokorný, P.; Kolísko, J.; Čítek, D.; Kostelecká, M. Effect of Elevated Temperature on the Bond Strength of Prestressing Reinforcement in UHPC. Materials 2020, 13, 4990. [Google Scholar] [CrossRef] [PubMed]
- Navrátil, J. Prestressed Concrete Structures, 2nd ed.; Technical University of Ostrava, Faculty of Civil Engineering: Ostrava, Czech Republic, 2014. [Google Scholar]
- Moravčík, M. Design of Prestressed Structures According to Eurocodes, 1st ed.; EDIS: Žilina, Slovakia, 2017. [Google Scholar]
- Halvonik, J.; Borzovic, V.; Paulik, P. Slab-on-girder Bridges in Slovakia. In Proceedings of the International Fib Symposium on Conceptual Design of Structures, Madrid, Spain, 26–28 September 2019; pp. 113–120. [Google Scholar]
- Bujňáková, P.; Strieška, M. Development of Precast Concrete Bridges During the Last 50 Years in Slovakia. In Proceedings of the International Scientific Conference on Sustainable, Modern and Safe Transport, TRANSCOM 2017, Smokovec, Slovak Republic, 31 May–2 June 2017; Volume 192, pp. 75–79. [Google Scholar] [CrossRef]
- Bujňáková, P. Anchorage System in Old Post-tensioned Precast Bridges. Civ. Environ. Eng. 2020, 16, 379–387. [Google Scholar] [CrossRef]
- Rehacek, S.; Citek, D.; Krystov, M.; Kolisko, J. Quality Control of the Concrete and Corrosion Damage of Cables of Prestressing Reinforcement of KA Beams, Bridge in Chomutov. In Proceedings of the XXV International Conference and Meeting of Departments, CONSTRUMAT 2019, Zuberec, Slovakia, 29–31 May 2019. [Google Scholar] [CrossRef]
- Gocál, J.; Odrobiňák, J. On the Influence of Corrosion on the Load-Carrying Capacity of Old Riveted Bridges. Materials 2020, 13, 717. [Google Scholar] [CrossRef] [PubMed]
- Koteš, P.; Vičan, J.; Nikolič, R. Evaluation of Elder and Historical Bridges. In Proceedings of the 9th International Conference Bridges in Danube Basin 2016, Zilina, Slovakia, 30 September–1 October 2016; Volume 156, pp. 186–190. [Google Scholar] [CrossRef]
- Ghaffary, A.; Moustafa, M.A. Synthesis of Repair Materials and Methods for Reinforced Concrete and Prestressed Bridge Girders. Materials 2020, 13, 4079. [Google Scholar] [CrossRef]
- Vičan, J.; Gocál, J.; Meliš, B.; Koteš, P.; Kotula, P. Real Behaviour and Remaining Lifetime of Bridge Structures. Commun. Sci. Lett. Univ. Zilina 2008, 10, 30–37. Available online: http://komunikacie.uniza.sk/index.php/communications/article/view/1042 (accessed on 5 April 2021).
- Jeon, C.-H.; Nguyen, C.D.; Shim, C.-S. Assessment of Mechanical Properties of Corroded Prestressing Strands. Appl. Sci. 2020, 10, 4055. [Google Scholar] [CrossRef]
- Neslušan, M.; Bahleda, F.; Trojan, K.; Pitoňák, M.; Zgútová, K. Barkhausen noise in over-stressed wires. J. Magn. Magn. Mater. 2020, 513, 167134. [Google Scholar] [CrossRef]
- Neslušan, M.; Bahleda, F.; Minárik, P.; Zgútová, K.; Jambor, M. Non-destructive monitoring of corrosion extent in steel rope wires via Barkhausen noise emission. J. Magn. Magn. Mater. 2019, 484, 179–187. [Google Scholar] [CrossRef]
- Šrámek, J.; Neslušan, M.; Bahleda, F.; Zgútová, K.; Schenk, P. Influence of sample size and magnetizing voltage on Barkhausen noise during bending and uniaxial tensile test. Acta Phys. Polonica A 2020, 137, 640–643. [Google Scholar] [CrossRef]
- Jang, J.; Smith, A.W. Data-driven models for temperature distribution effects on natural frequencies and thermal prestress modeling. Struct. Control Health Monit. 2020, 27, e2489. [Google Scholar] [CrossRef]
- Lan, C.; Zhou, Z.; Ou, J. Monitoring of structural prestress loss in RC beams by inner distributed Brillouin and fiber Bragg grating sensors on a single optical fiber. Struct. Control Health Monit. 2014, 21, 317–330. [Google Scholar] [CrossRef]
- Bagge, N.; Nilimaa, J.; Elfgren, L. In-situ Methods to Determine Residual Prestress Forces in Concrete Bridges. Eng. Struct. 2017, 135, 41–52. [Google Scholar] [CrossRef]
- Bagge, N.; Nilimaa, J.; Blanksvärd, T.; Elfgren, L. Instrumentation and Full-Scale Test of a Post-Tensioned Concrete Bridge. Nordic Concr. Res. 2014, 51, 63–83. [Google Scholar]
- Kraľovanec, J.; Moravčík, M.; Bujňáková, P.; Jošt, J. Indirect Determination of Residual Prestressing Force in Post-Tensioned Concrete Beam. Materials 2021, 14, 1338. [Google Scholar] [CrossRef]
- Kraľovanec, J.; Moravčík, M. Numerical verification of the saw-cut method. IOP Conf. Ser. Mater. Sci. Eng. 2021, 1015, 012031. [Google Scholar] [CrossRef]
- Fedele, R.; Maier, G. Flat-jack tests and inverse analysis for the identification of stress states and elastic properties in concrete dams. Meccanica 2007, 42, 387–402. [Google Scholar] [CrossRef]
- Garbowski, T.; Maier, G.; Novati, G. Diagnosis of concrete dams by flat-jack tests and inverse analyses based on proper orthogonal decomposition. J. Mech. Mater. Struct. 2011, 6, 181–202. [Google Scholar] [CrossRef]
- Varga, R. Domain walls and their dynamics, 1st ed.; Pavol Jozef Šafárik University: Košice, Slovakia, 2014. [Google Scholar]
- Liu, J.; Tian, G.Y.; Gao, B.; Zeng, K.; Zheng, Y.; Chen, J. Micro-macro characteristics between domain wall motion and magnetic Barkhausen noise under tensile stress. J. Magn. Magn. Mater. 2020, 493, 165719. [Google Scholar] [CrossRef]
- Yamazaki, T.; Furuya, Y.; Nakao, W. Experimental evaluation of domain wall dynamics by Barkhausen noise analysis in Fe30Co70 magnetostrictive alloy wire. J. Magn. Magn. Mater. 2019, 475, 240–248. [Google Scholar] [CrossRef]
- Santa-aho, S.; Vippola, M.; Sorsa, A.; Leiviskä, K.; Lindgren, M.; Lepistö, T. Utilization of Barkhausen noise magnetizing sweeps for case-depth detection from hardened steel. NDT E Int. 2012, 52, 95–102. [Google Scholar] [CrossRef]
- Gupta, B.; Ducharne, B.; Uchimoto, T.; Sebald, G.; Miyazaku, T.; Takagi, T. Non-destructive testing on creep degraded 12% Cr-Mo-W-V ferritic test samples using Barkhausen noise. J. Magn. Magn. Mater. 2020, 498, 166102. [Google Scholar] [CrossRef]
- Čížek, J.; Neslušan, M.; Čilliková, M.; Mičietová, A.; Melikhova, O. Modification of steel surfaces induced by turning: Non-destructive characterization using Barkhausen noise and positron annihilation. J. Phys. D Appl. Phys. 2014, 47, 1–17. [Google Scholar] [CrossRef]
- Ktena, A.; Hristoforou, E.; Gerhardt, G.J.L.; Missell, F.P.; Landgraf, F.J.G.; Rodrigues, D.L.; Albertis-Campos, M. Barkhausen noise as a microstructure characterization tool. Phys. B 2014, 435, 109–112. [Google Scholar] [CrossRef]
- Sorsa, A.; Santa-Aho, S.; Wartiainen, J.; Souminen, L.; Vippola, M.; Leviskä, K. Effect of shot peening parameters to residual stress profiles and Barkhausen noise. J. Nondestruct. Eval. 2018, 37, 10. [Google Scholar] [CrossRef]
- Kypris, O.; Nlebedim, I.C.; Jiles, D.C. Measuring stress variation with depth using Barkhausen signals. J. Magn. Magn. Mater. 2016, 407, 377–395. [Google Scholar] [CrossRef]
- STN EN 206+A1:2017-05. Concrete. Specification, Performance, Production and Conformity; Slovak Technical Standard; Slovak Office of Standards, Metrology and Testing: Bratislava, Slovakia, 2017. [Google Scholar]
- Paulík, P.; Bačuvčík, M.; Ševčík, P.; Janotka, I.; Gajdošová, K. Experimental Evaluation of Properties of 120 Years Old Concretes at Two Concrete Bridges in Slovakia. Solid State Phenom. 2016, 249, 227–234. [Google Scholar] [CrossRef]
- ISO 6892-1:2019. Metallic Materials–Tensile Testing—Part 1: Method of Test at Room Temperature; International Organization for Standardization: Geneva, Switzerland, 2019. [Google Scholar]
- Neslušan, M.; Bahleda, F.; Moravčík, M.; Zgútová, K.; Pastorek, F. Assessment of Tendon Prestressing after Long-Term Service via the Barkhausen Noise Technique. Materials 2019, 12, 3450. [Google Scholar] [CrossRef]
- Červenka, V.; Jendele, L.; Červenka, J. ATENA Program Documentation—Part 1. Theory; Červenka Consulting: Prague, Czech Republic, 16 September 2020; Available online: www.cervenka.cz/assets/files/atena-pdf/ATENA_Theory.pdf (accessed on 3 April 2021).
- Červenka, J.; Procházková, Z.; Sajdlová, T. ATENA Program Documentation—Part 4-2. Tutorial for Program ATENA 3D; Červenka Consulting: Prague, Czech Republic, 28 September 2017; Available online: www.cervenka.cz/assets/files/atena-pdf/ATENA-Engineering-3D_Tutorial.pdf (accessed on 3 April 2021).
- Červenka, V.; Červenka, J. ATENA Program Documentation—Part 2-2. User’s Manual for ATENA 3D; Červenka Consulting: Prague, Czech Republic, November 2017. Available online: www.cervenka.cz/assets/files/atena-pdf/ATENA-Engineering-3D_Users_manual.pdf (accessed on 3 April 2021).
- STN EN 1992-1-1+A1. Eurocode 2: Design of Concrete Structures—Part 1–1: General Rules and Rules for Buildings; Slovak Technical Standard; Slovak Office of Standards, Metrology and Testing: Bratislava, Slovakia, 2015. [Google Scholar]
- STN EN 13230-1. Railway Applications–Track–Concrete Sleepers and Bearers—Part 1: General Requirements; Slovak Technical Standard; Slovak Office of Standards, Metrology and Testing: Bratislava, Slovakia, 2016. [Google Scholar]
- STN EN 13230-2. Railway Applications–Track–Concrete Sleepers and Bearers—Part 2: Prestressed Monoblock Sleepers; Slovak Office of Standards, Metrology and Testing: Bratislava, Slovakia, 2016. [Google Scholar]


Publisher’s Note: MDPI stays neutral with regard to jurisdictional claims in published maps and institutional affiliations. |
© 2021 by the authors. Licensee MDPI, Basel, Switzerland. This article is an open access article distributed under the terms and conditions of the Creative Commons Attribution (CC BY) license (https://creativecommons.org/licenses/by/4.0/).