Article

Phase Compensation Technique for Effective Heat Focusing in Microwave Hyperthermia Systems

The Electrical and Electronic Engineering Department, Yonsei University, Seoul 03772, Korea
*
Author to whom correspondence should be addressed.
Appl. Sci. 2021, 11(13), 5972; https://doi.org/10.3390/app11135972
Submission received: 6 May 2021 / Revised: 22 June 2021 / Accepted: 25 June 2021 / Published: 27 June 2021

Abstract

:
In this paper, effective electromagnetic (EM) focusing achieved with a phase compensation technique for microwave hyperthermia systems is proposed. To treat tumor cells positioned deep inside a human female breast, EM energy must be properly focused on the target area. A circular antenna array for microwave hyperthermia allows EM energy to concentrate on a specific target inside the breast tumor. Depending on the cancerous cell conditions in the breast, the input phases of each antenna are calculated for single and multiple tumor cell locations. In the case of multifocal breast cancer, sub-array beam focusing via the phase compensation technique is presented to enhance the ability of EM energy to concentrate on multiple targets while minimizing damage to normal cells. To demonstrate the thermal treatment effects on single and multiple tumor locations, the accumulation of the specific absorption rate (SAR) parameter and temperature changes were verified using both simulated and experimental results.

1. Introduction

Breast cancer treatments have been investigated throughout the past decade, and thermal treatments for breast cancer using microwaves are being rapidly developed to reduce the dangerous side effects associated with conventional methods [1]. Primary breast cancer treatments include surgical operations, radiotherapy, chemotherapy, and hyperthermia. Among these, microwave hyperthermia is an effective treatment that uses a beneficial heating effect. Because cancerous tissues are highly vascularized, and it is harder to remove excess heat from them than from healthy tissues, thermal damages are sensitive to the cancer [2]. A non-invasive microwave hyperthermia system for cancer treatment is reliable, cost effective, and painless compared with surgical operations. Furthermore, hyperthermia has a synergistic effect when used in combination with radiation oncology or chemotherapy [3,4,5,6]. In hyperthermic systems, tumor cells are damaged under the temperature range of 43–47 °C, while normal cells are not damaged [7]. Non-invasive microwave hyperthermia employing an antenna array is a reliable treatment method that can achieve effective breast tumor necrosis [8]. In this procedure, electromagnetic (EM) energy is radiated from array elements and concentrated on the tumor region, where heating is applied for treatment [9,10,11].
Microwave hyperthermia for deep-seated tumors inside the human breast should be designed so that EM energy can be transferred well into the interior of the body. The human body is composed of various dielectric tissues that make it difficult to provide a suitable EM energy concentration because of dielectric losses [12]. One of the challenges of this treatment method is to design microwave hyperthermia systems that, while focusing the EM energy into the human body, heat only malignant tissues, without overheating normal tissues [13]. Mathematically, accurate EM energy focusing methods are essential for optimal accumulation. Many techniques, such as the time reversal method, specific absorption rate (SAR) optimization, temperature optimization, and phased array, have been researched to prove the efficacy of hyperthermia treatments [14,15,16,17,18,19]. The SAR optimization technique can assume the correlation between SAR and temperature to anticipate deviations in thermal boundary conditions [14,15,16]. Temperature-based optimization seeks to optimize the temperature distribution; however, this method is dependent on the properties of the thermal tissue, which results in very large uncertainty and higher computational costs than the SAR-based optimization technique [14,19].
Therefore, the SAR optimization method for effective energy focusing using a phased array is a very attractive technique due to the practicality of its implementation and its simple procedure [14,15,16,17,19,20,21]. To deliver microwaves inside the breast, the input phase of each antenna should differ depending on the location of the tumor cells. Strong constructive interference in the target area can be achieved with accurate phase control. Narrowband phased-array antenna systems for treating single targets that operate on a single frequency best suited for healing superficial and single tumor locations are presented in [18,20,21]. However, these systems have some issues, such as the relatively large number of hot spots, poor resolutions, and their limitation to unicentric breast cancers. Multifocal/multicentric breast cancers, which occur when there is more than one distinct type of tumor cell in a single quadrant, are more aggressive and are associated with worse outcomes than unifocal cancers [22]. Hyperthermia therapy for multiple tumor locations has been studied by [23,24]. In [23], iron oxide nanoparticle-loaded nanocapsules were injected into different tumor positions to be used with magnetic hyperthermia therapy. In [24], a multi-frequency excitation approach for multiple tumor locations was proposed for enhanced EM energy penetration and the resolution of its localization. However, the nanocapsule must be injected into the treatment area [23], and the power source unit is too complex to provide the signals required for multiple-frequency excitation [24].
In this paper, effective EM focusing with a novel phase compensation technique for multifocal microwave hyperthermia is proposed. A narrowband signal at 2.45 GHz is applied to the array antenna elements to organize a simple power supply circuit. The antenna array configuration is optimized for application to a small female breast and for an effective electric field (E-field) concentration on the target area. To deliver a useful therapeutic result, each antenna excites an equal polarization signal, which requires elaborate control of the input phase. Depending on the tumor condition in the breast phantom, the input phases of each antenna are calculated for single and multiple targets with phase delay compensation. For multifocal breast cancer, the energy localization on each tumor cell is important for the minimization of damage to normal cells. To enhance the EM energy focused on multiple targets, the sub-arrays are designated near each tumor location for maximum energy transformation. Therefore, sub-array antennas with a phase compensation technique applying a modified phase are proposed for multicentric breast carcinoma. To demonstrate the thermal treatment effects under single and multiple tumor conditions, the SAR distributions and temperature changes are obtained via simulations and experiments with a breast phantom.

2. The Antenna Array System for Microwave Hyperthermia Treatment

The antenna array configurations for breast cancer treatments are determined by the type, aperture size, and polarization characteristics of the designed single antenna. The prototype of the tapered slot antenna (TSA) and circular array configuration presented in this paper were proposed in our previous paper [25], which aimed to use the above elements in microwave imaging and hyperthermia systems. To verify the antenna performances, a 3D simulation of a cylindrical breast phantom was performed and the SAR and temperature results were presented in 2D planes. An antenna for delivering microwaves to a deep-seated tumor should be designed to induce strong constructive interference of the E-field. Therefore, an antenna array is used to deliver EM energy to tumor cells located deep inside the breast phantom. Each antenna is arranged vertically to be efficiently organized around the small female breast phantom and for effective E-field synthesis [16,21].

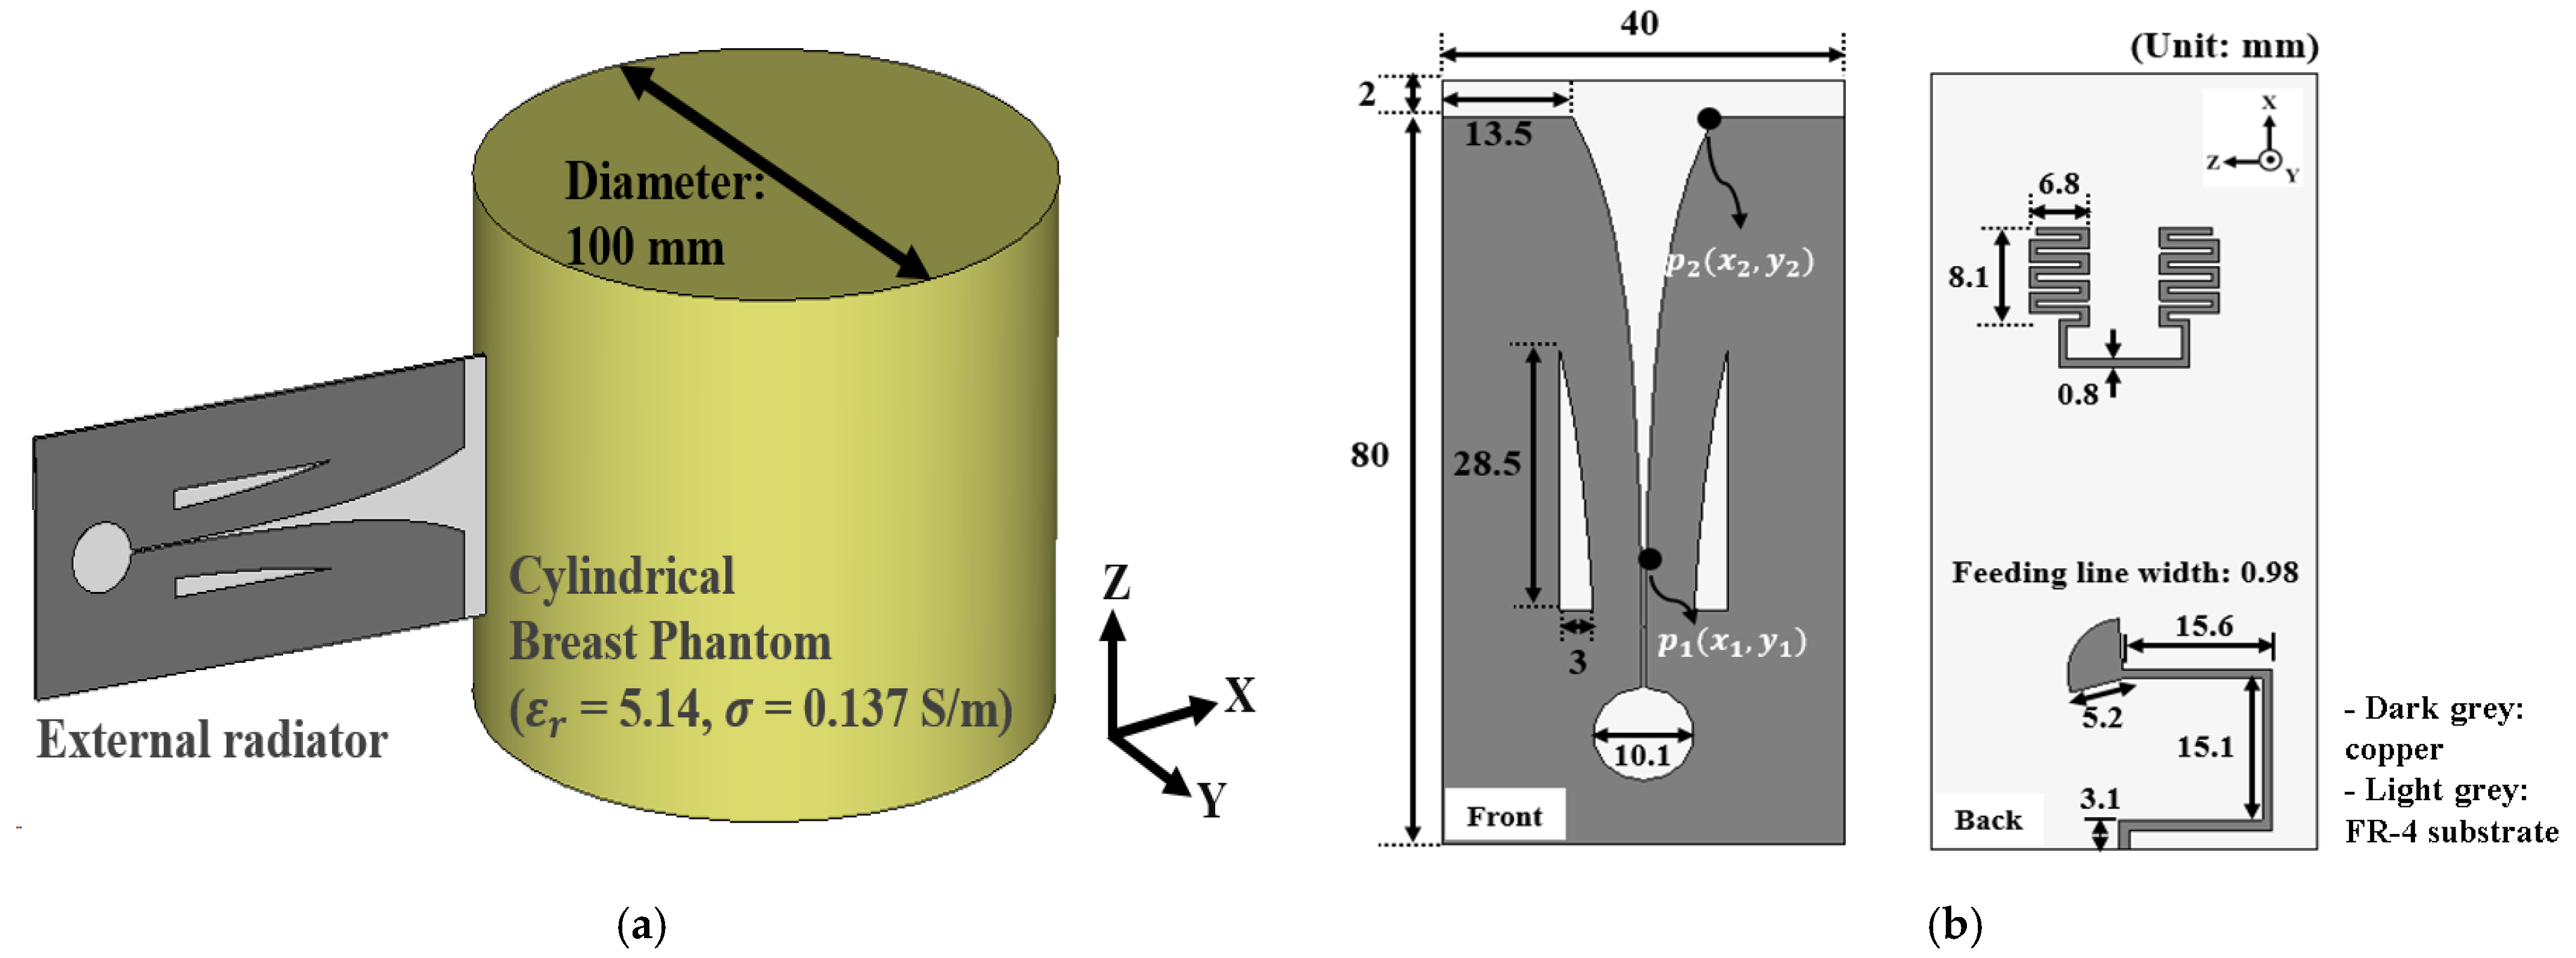
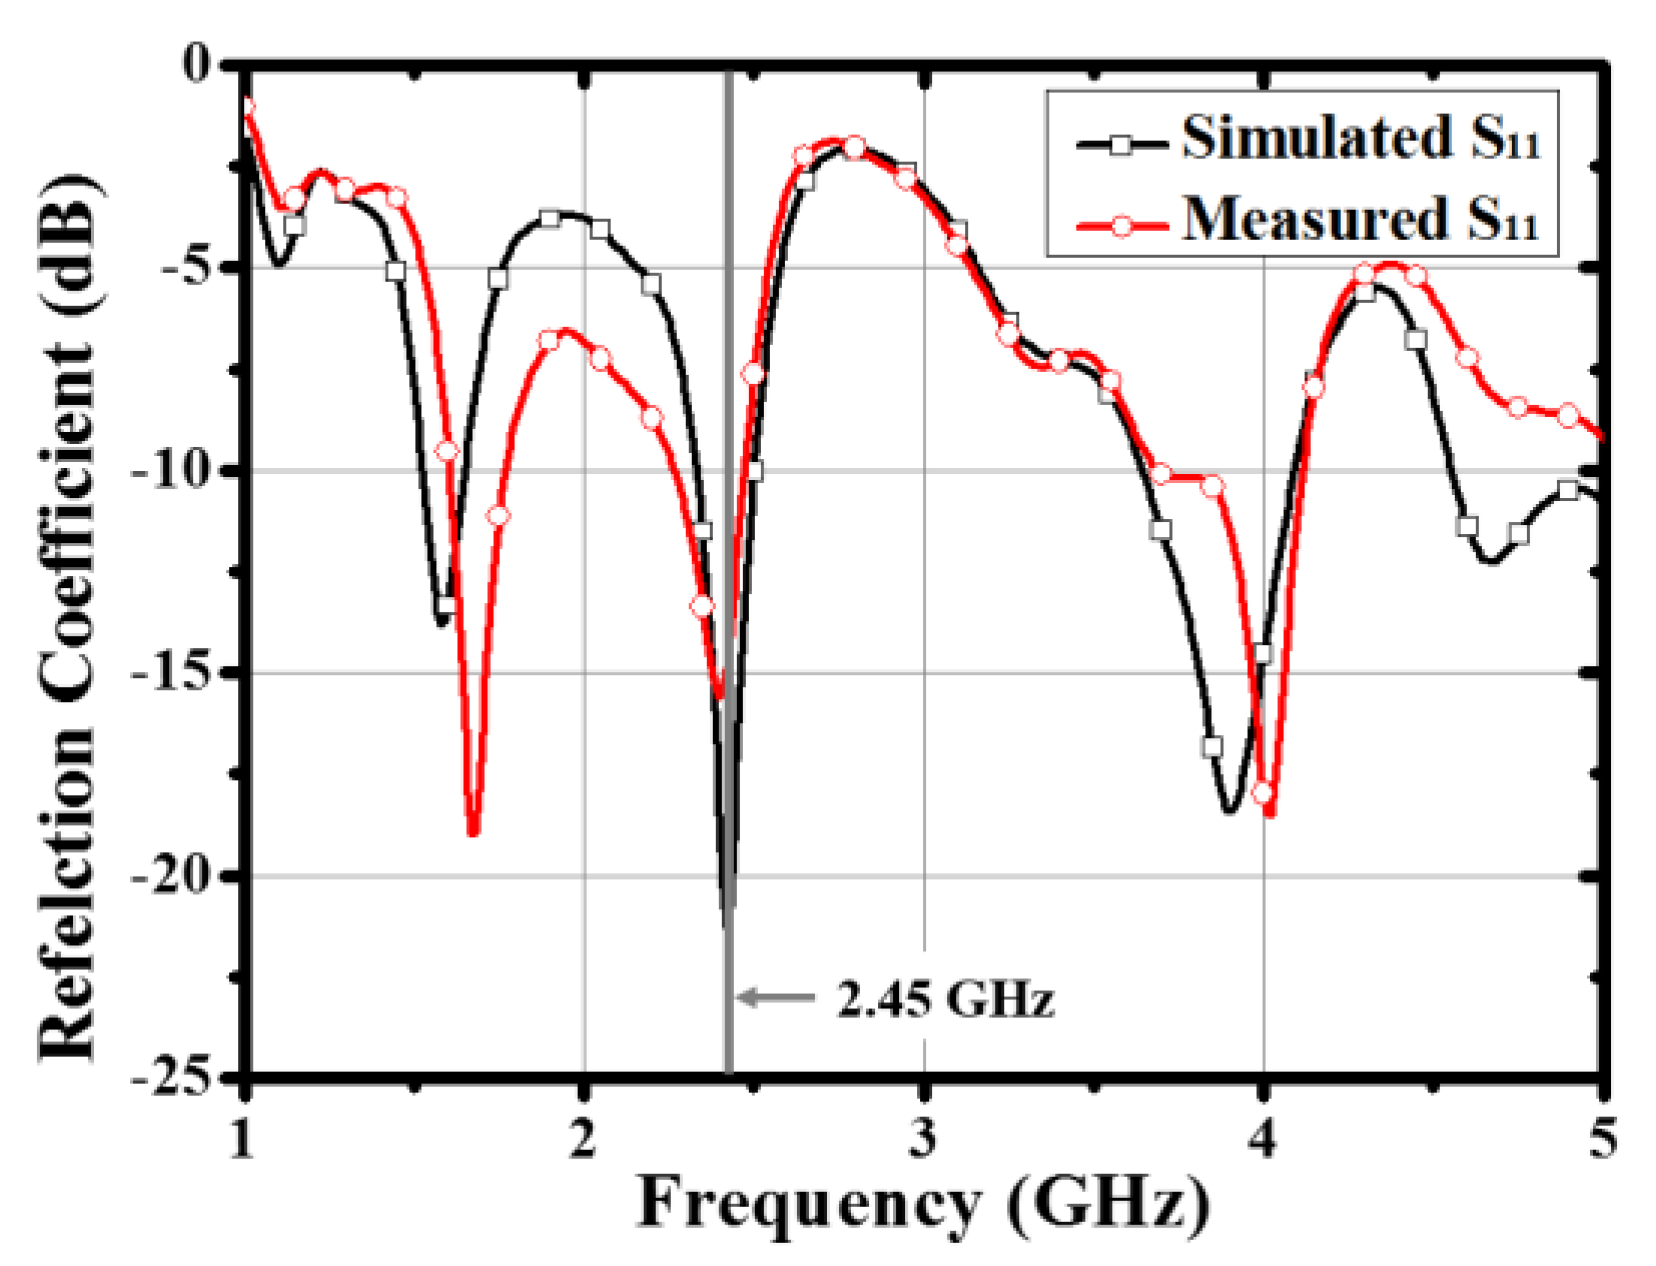
2.1. The Antenna for the Array Configuration

Since this paper is a part of ongoing research related to our existing work, the antenna for microwave hyperthermia used in this study was a TSA, based on our previous study [25]. The designed TSA has a small aperture size for easier application, and has been optimized to effectively deliver EM energy into the breast. The design configuration of a single antenna is presented in Figure 1a. To verify the EM effects on the 2D plane, a cylindrical shaped artificial breast phantom that takes into account the breast’s fatty component ( ε r = 5.14, σ = 0.137 S/m) was modelled as homogeneous medium [26]. The designed TSA was printed on an 0.8-mm-thick FR-4 substrate ( ε r = 4.3, tanδ = 0.025) over an 80 mm × 40 mm area, as shown in Figure 1b [25]. The meander line was designed beneath the tapered slot of the TSA to operate at 2.45 GHz for the microwave hyperthermia treatment. In Figure 2, the simulated and measured reflection coefficients are compared. The reflection coefficient ( S 11 ) was measured under the condition presented in Figure 1a, where the designed antenna is in direct contact with the phantom. For the antenna measurement and thermal experiment, a gelatin-based phantom was fabricated, and the dielectric property of performed phantom is ε r = 5.1 at 2.45 GHz [27].
For effective electric field concentration in the female breast phantom, each antenna is arranged vertically. For these antennas’ arrangement, the same linear polarization profile in each array antenna element is related to the effective hyperthermia treatment. In Figure 3, the E-field distribution at 2.45 GHz in the breast phantom, including in the tumor, is presented. A spherical breast tumor of radius r = 5 mm is positioned in the center of the cylindrical phantom. As shown in this figure, the polarization of the single TSA antenna is well-formed along the z-axis. A full simulation was performed with FIT-based CST Studio Suite 2019 [28].

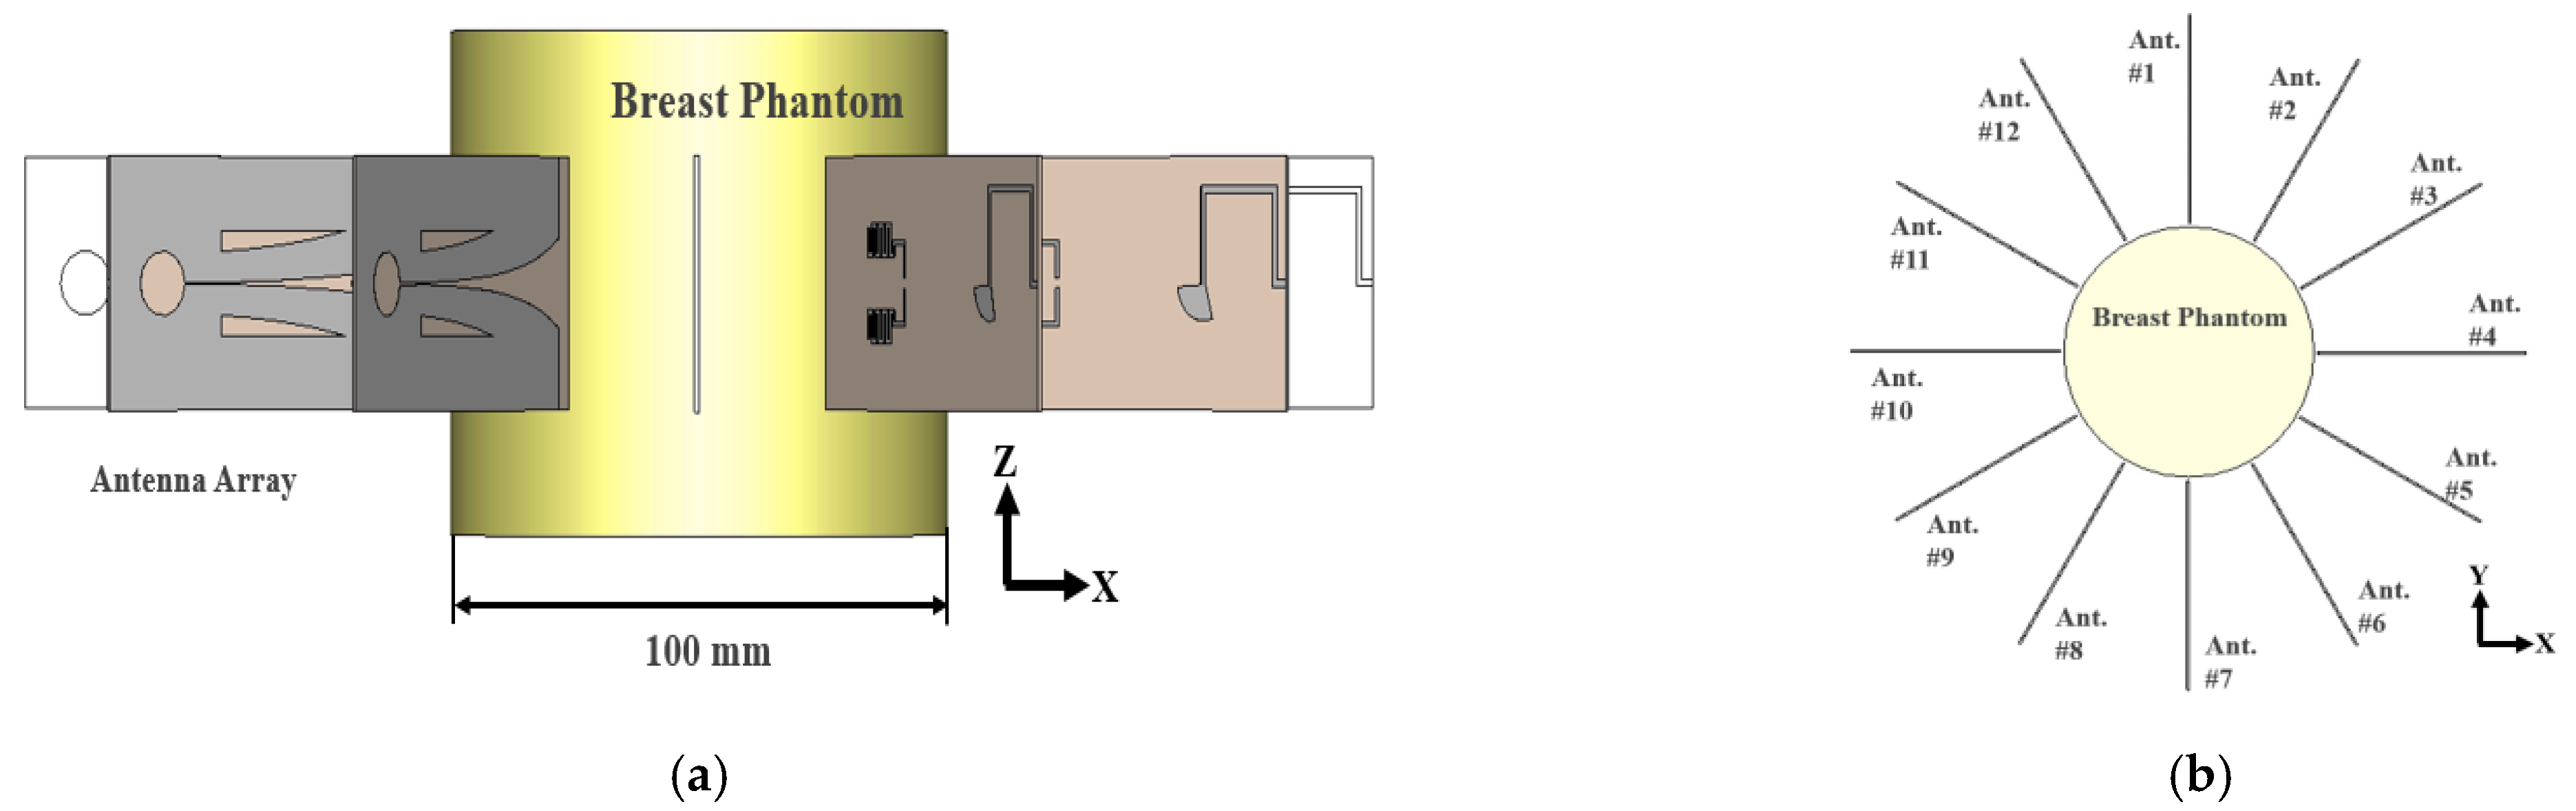
2.2. Antenna Array Configuration for Effective Electric Field Concentration

As mentioned in the previous section, the designed TSA antenna is linearly polarized along the radiation direction, and each antenna should be aligned along the surface of the cylindrical phantom for effective E-field synthesis. The number of radiators, which should be determined for the successful E-field concentration on the target area, was set at 12 due to the SAR accumulation in the breast phantom, in accordance with our previous study [25]. The array configurations for inducing microwave hyperthermia along the xz- and xy-planes are presented in Figure 4a,b, respectively. To feed the array antenna, simultaneous excitation is induced with an EM simulation tool. To apply the input power to each antenna, a discrete port is assigned to each TSA and the open boundary condition in CST is set to analyze the antennas’ performances. The narrowband antennas are arranged at regular intervals for vertical linear polarization along the z-axis.

2.3. The Specific Absorption Rate and Temperature Increase

The EM field produced by the TSA antenna array elements propagates toward the inside of the breast phantom and concentrates in the target area. The localized EM energy is used to calculated the SAR parameter, which is defined as a measure of energy absorbed per unit mass of the human body in the unit time t. The SAR is defined as the time derivative of the incremental energy (dW) absorbed by the incremental mass (dm) [29].
SAR   = ( d dt ) ( dW dm ) = ( d dt ) [ dW ρ ( dV ) ]
The incremental mass dm can be replaced with a volume element dV for a given density of the tissue ρ . The SAR factor can also be defined for time-harmonic E-fields using the Poynting vector theorem [30]:
SAR   = ( σ 2 ρ ) | E i ¯ | 2
where σ is the electrical conductivity of the tissue material and E i ¯ is the intensity of the internal E-field in volts per meter. The average SAR parameter is defined as the ratio of the total power absorption per unit mass of the exposed human body. The induced E-field interacts with the body and changes the temperature depending on the square of the magnitude of the E-field strength.
The analysis of temperature distribution as a function of the applied external E-field was conducted to broaden our study to incoporate multiphysics methods. To show the rate of temperature increase in human tissue exposed to external microwave energy, the Pennes bioheat equation is given below [31]:
ρ C p T t = 1 2 σ | E ¯ | 2 + · ( k T ) + W b C b ( T b T ) v
where ρ , C p , k, and σ are the density, heat capacity, thermal conductivity, and electric conductivity of tissue, respectively, and W b and C b are the perfusion rate and heat capacity of blood, respectively. The external E-field is an essential factor for determining the temperature increase in the exposed tissue over a certain period of time following the EM exposure of the TSA antennas’ array.

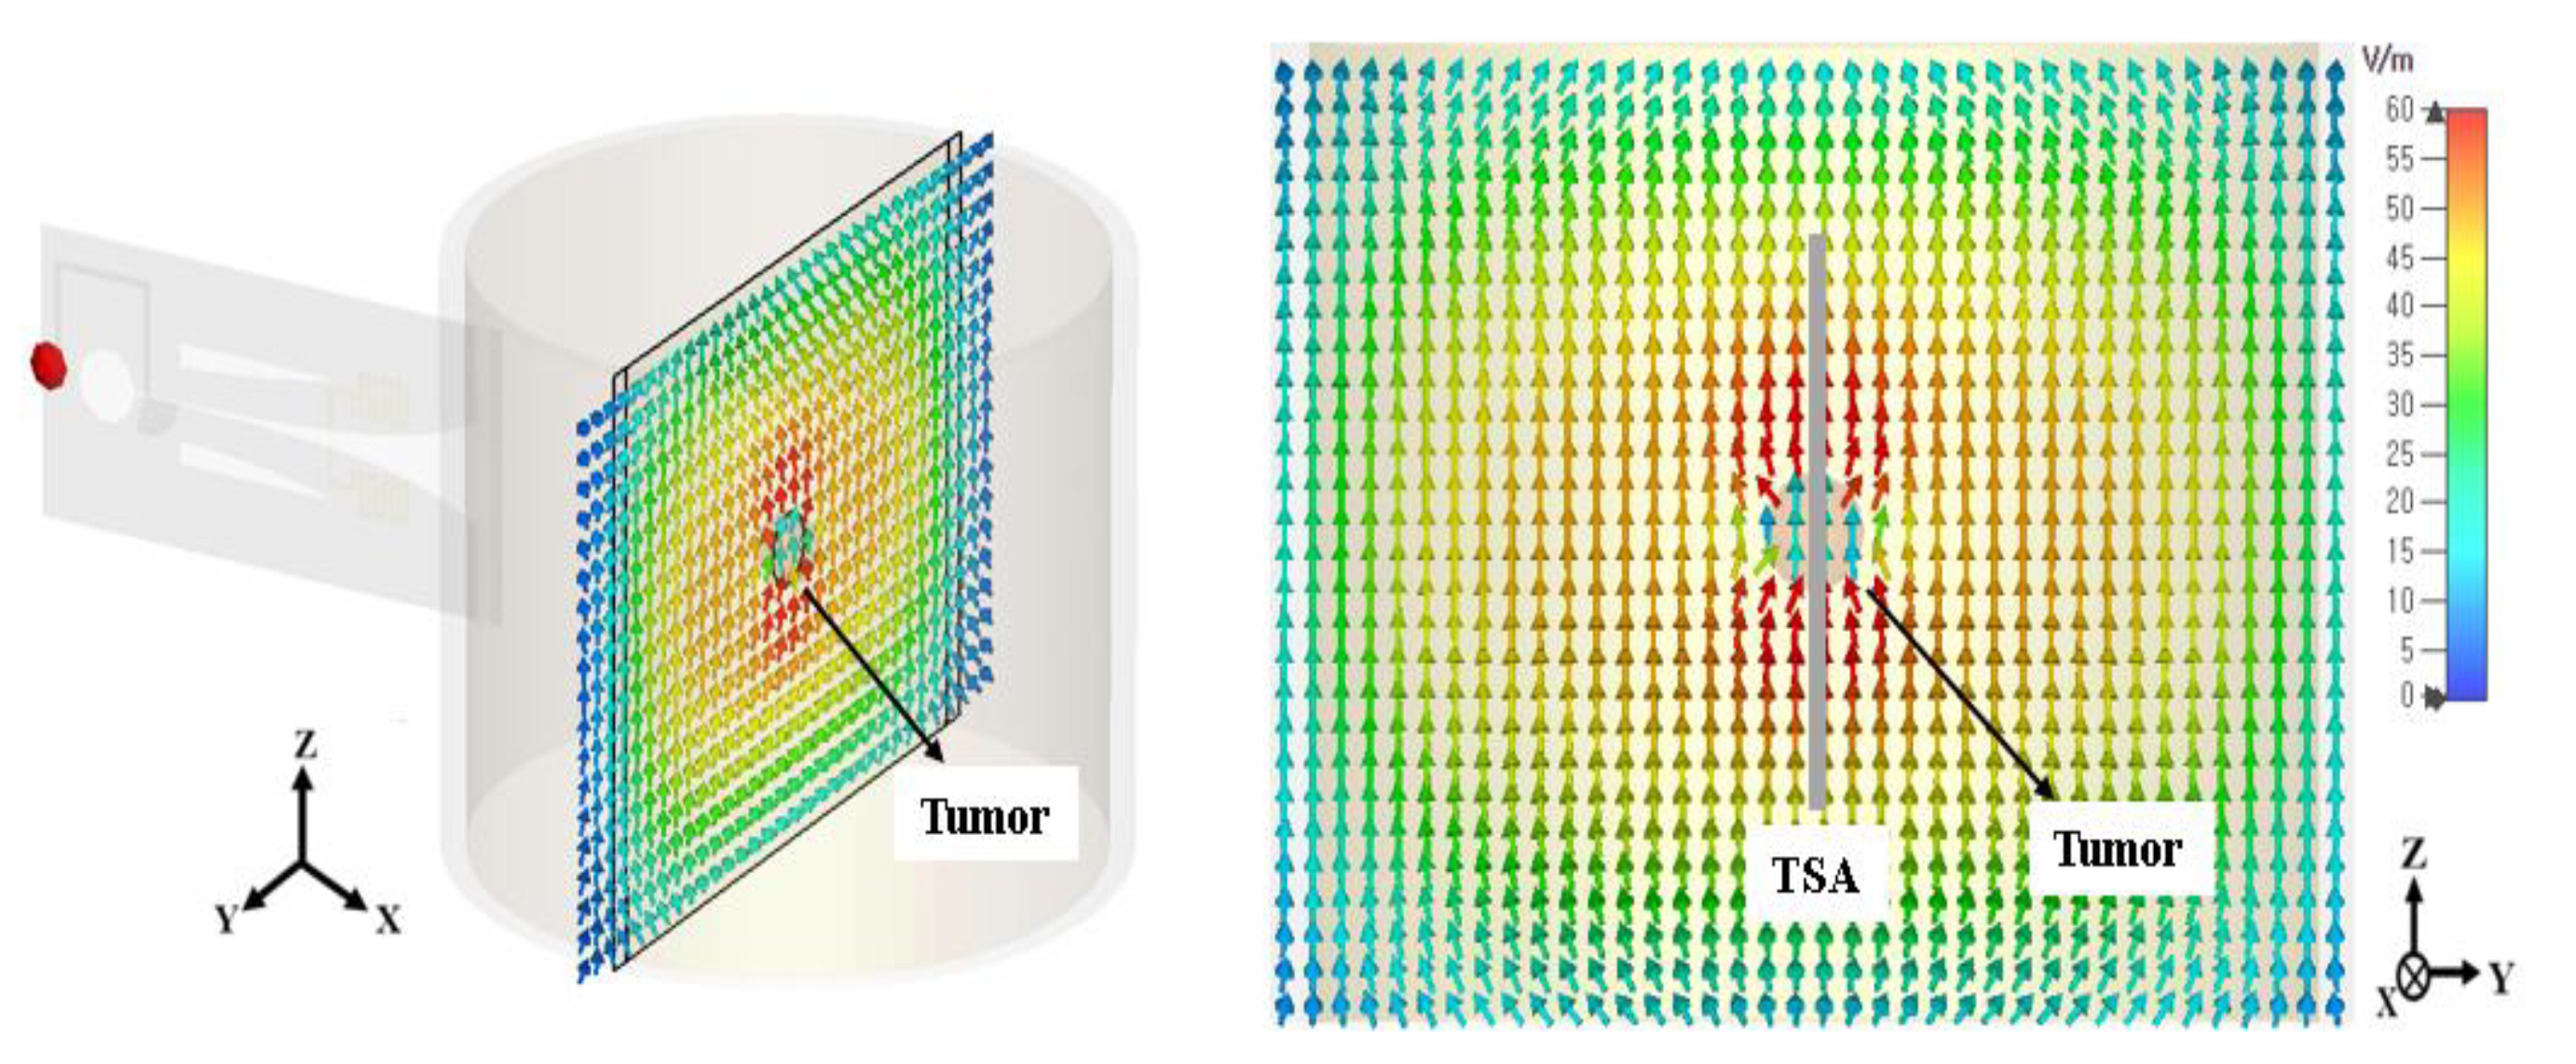
3. Electromagnetic Focusing for Microwave Hyperthermia

3.1. Electromagnetic Focusing for Unifocal Breast Cancers

Each TSA antenna radiates with precise input phase characteristics to provide effective treatment to randomly positioned cancer cells in the breast phantom. The radius of the breast tumor for microwave hyperthermia treatment was set at 5 mm. The breast tissue properties of the fat and the tumor applied to all simulations are presented in Table 1 to verify the SAR and temperature distributions.
The phase delay of each antenna ( φ n ) should be compensated to focus the E-field on the target position, thereby localizing the heat operation to a treatment area. The input phase characteristics of the TSA antenna array can be defined by compensating the phase delay caused by the different path lengths of the antennas to the target tumor. Hence, the in-phase condition of the radiated E-fields can be satisfied with an unifocal breast cancer, leading to strong constructive interference. Figure 5 presents a schematic view of the EM waves focusing on the breast phantom while the array configuration encircles the breast phantom. The phase delay of each antenna is calculated to meet the requirements for the in-phase condition of the E-field deep inside the phantom. The locations of the antennas are defined as ( x n , y n ) and the cancer location in the phantom is defined as ( x t 1 , y t 1 ) . The path length from each antenna to the cancer location defined by 2D Cartesian coordinates can be defined as:
PL n = ( x t 1 x n ) 2 + ( y t 1 y n ) 2
where n is the current antenna number. The radius of the breast phantom is 50 mm, with the middle defined as (0,0), so with Cartesian coordinates, each path length between the radiating antenna and cancer location can be calculated and converted to the phase as follows:
φ PL n = k × PL n × 180 π = 2 π λ eff × PL n × 180 π
where k is the wave number, and λ eff is the effective wavelength in the phantom ( ε r = 5.14 ) at 2.45 GHz. To determine the input phases of each antenna, the phase delay should be calculated accordingly:
φ n = φ PL n φ min
where φ min is the minimum phase value among the 12 path lengths. Therefore, the calculated final input phase φ n is the total compensating input phase to satisfy the in-phase condition on the focusing area. Thus, φ n of each antenna is calculated depending on the tumor position.
To verify that the EM was focusing on the unifocal cancer, the input phases of each antenna when the tumor was positioned at (20,0) mm and (15,15) mm were calculated for the xy-plane in Table 2. These calculated input phases ( φ n ) were aimed to enhance the constructive interference of the E-field at the focal point, which leads to a high SAR distribution on the treatment area. The maximum SAR distribution values at (20,0) mm and (15,15) mm according to the xy-planes presented in Figure 6a,b are 23.1 W/kg and 27.7 W/kg, respectively, at the focal points.

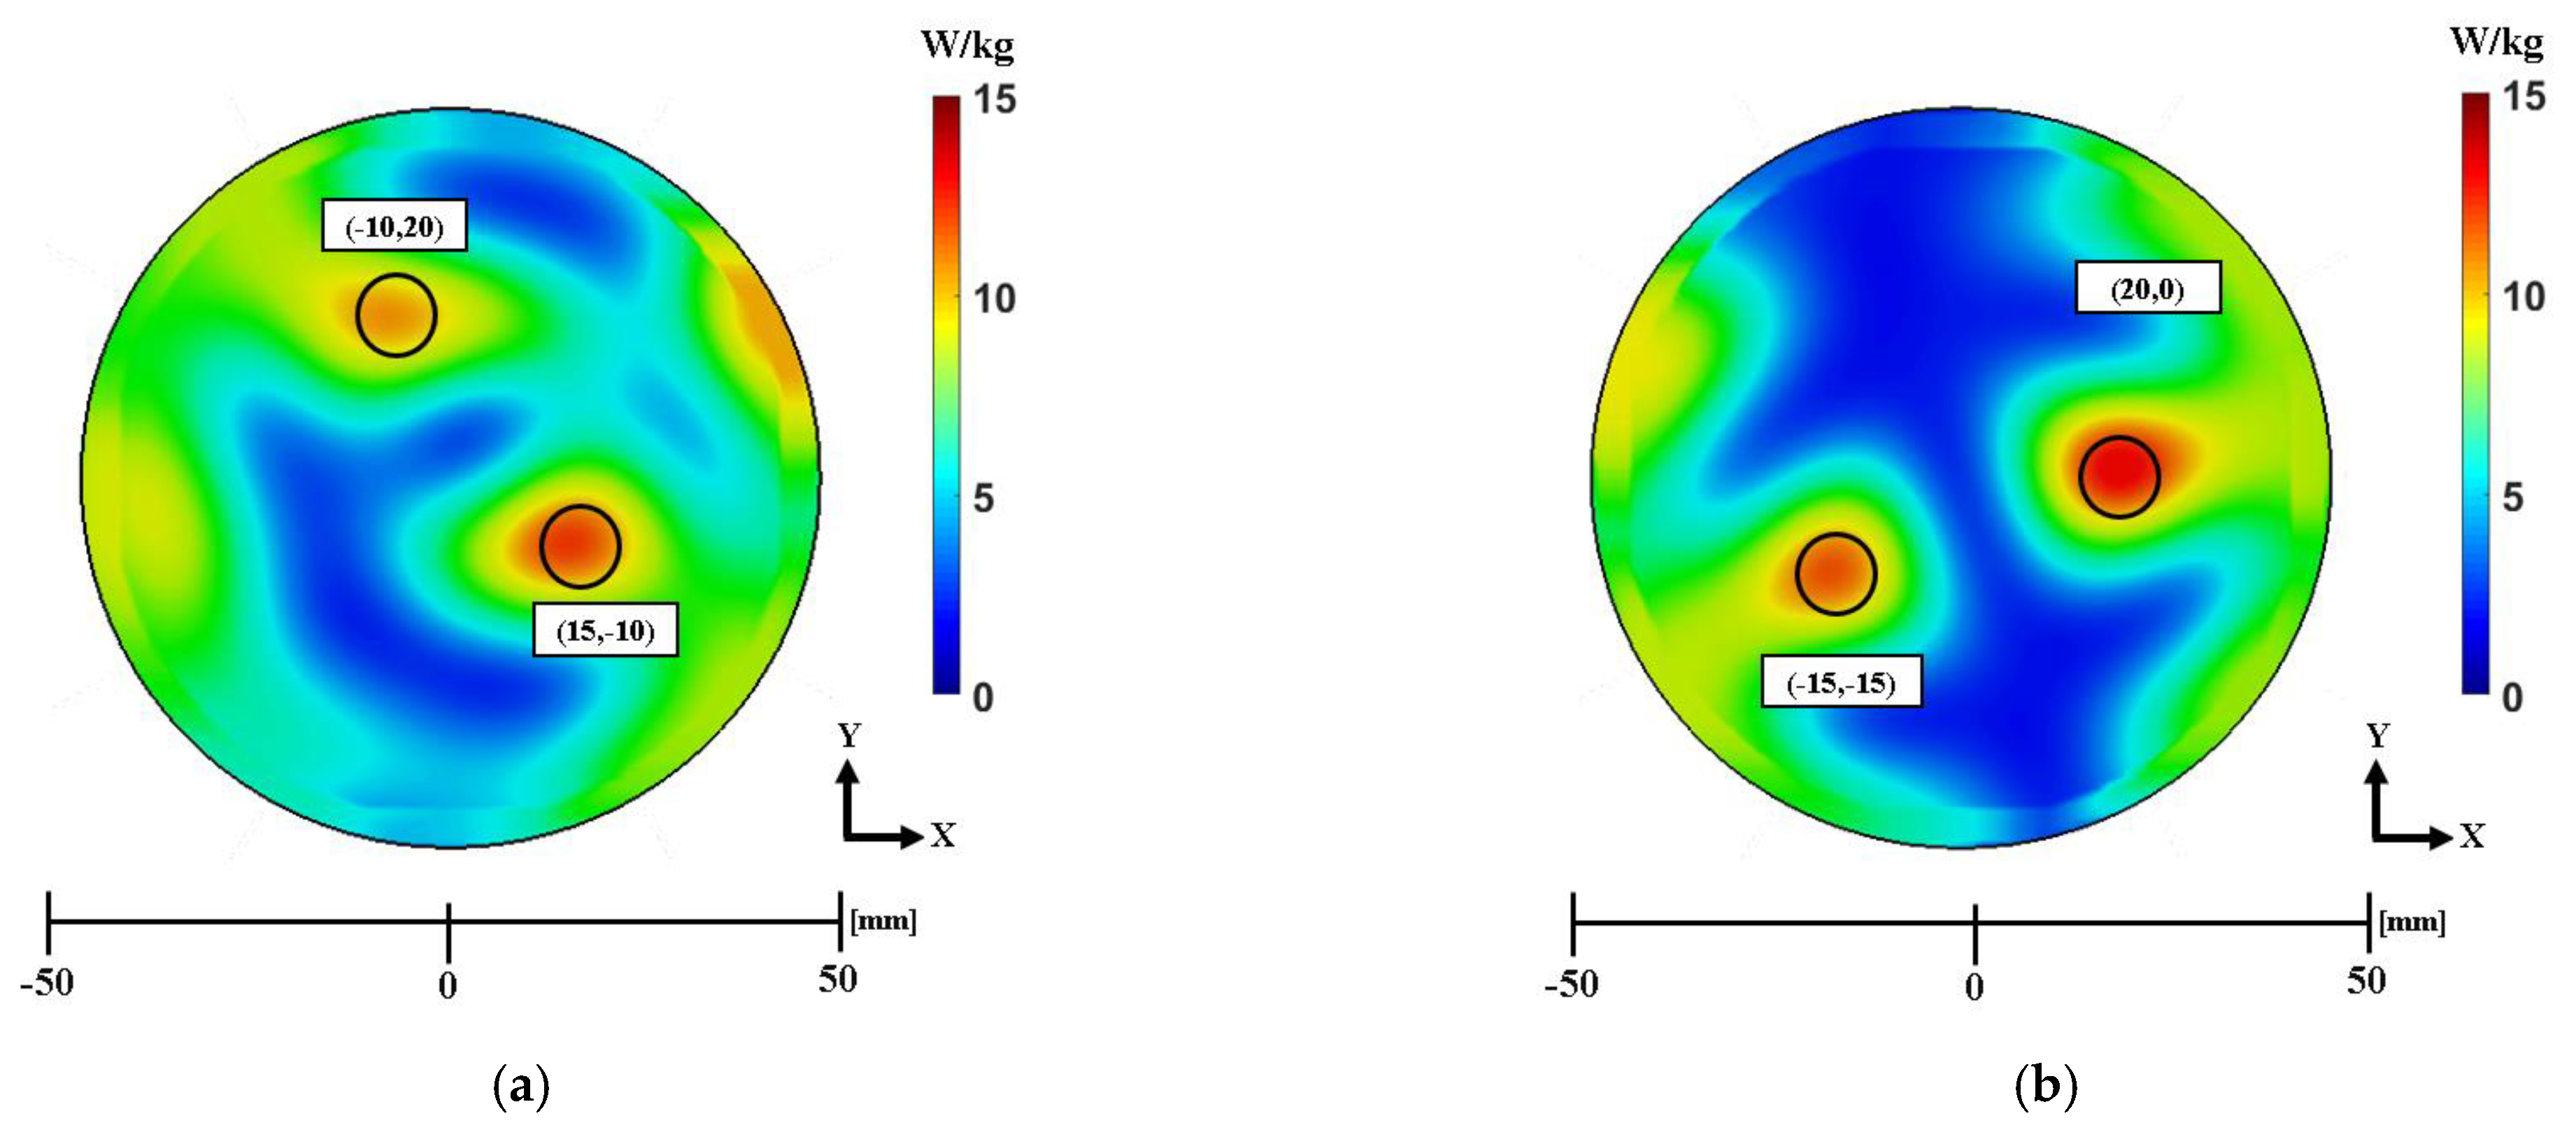
3.2. Electromagnetic Focusing for Multifocal Breast Cancer

In the case of multifocal breast cancer, time and costs can be reduced by treating multiple tumors simultaneously rather than sequentially. Unlike for a single tumor, the calculation method for the input phases ( φ n ) for multiple targets should be modified to deliver precise EM energy deposition. In deep-seated tumors, the TSA antennas should transfer adequate energy to necrotize the tumor cells without harming the normal tissue. To enhance the thermal focusing, an exquisite phase control technique should be applied to each microwave antenna, and unwanted electric field focusing should be avoided. Thus, the multiple E-field focusing technique with a sub-array antenna configuration and phase compensation technique will be discussed.
The configuration of the E-field focused on two breast tumors with an antenna sub-array is presented in Figure 7. The radii of the two breast tumors for multifocal breast cancer were set at 5 mm as well. The magnitude of the radiated E-field is decreased due to the dielectric loss component of the breast phantom. Therefore, in terms of the tumor positions, designating the antennas that are closest to the tumor cell as a sub-array ensures E-field concentration on each breast tumor. Therefore, as shown in Figure 7, sub-arrays #1 and #2 consist of antennas #1–6 and #7–#12, respectively. Tumor cells #1 and #2 are located at positions ( x t 1 ,   y t 1 ) and ( x t 2 , y t 2 ) in the phantom, respectively. To focus the E-field on two breast tumors at the same time, each antenna sub-array radiates the E-field onto tumor cells #1 and #2. The input phase of each antenna sub-array should be calculated separately to provide optimal focusing depending on the multiple targets. The phase delay of each antenna is calculated to meet the requirement of the in-phase condition of the E-field deep inside the phantom. Hence, the path length from each antenna sub-array to the tumor cells using 2D Cartesian coordinates can be defined as follows:
PL n 1 = ( x t 1 x n 1 ) 2 + ( y t 1 y n 1 ) 2 PL n 2 = ( x t 2 x n 2 ) 2 + ( y t 2 y n 2 ) 2
where n 1 and n 2 are the antenna numbers of sub-arrays #1 and #2, respectively. The calculated path lengths can be converted to the phases of each sub-arrays accordingly:
φ PL n 1 = k × PL n 1 × 180 π = 2 π λ eff × PL n 1 × 180 π φ PL n 2 = k × PL n 2 × 180 π = 2 π λ eff × PL n 2 × 180 π
where k is the wave number and λ eff is the effective wavelength in the phantom ( ε r = 5.14 ) at 2.45 GHz, and φ PL n 1 and φ PL n 2 are the calculated phases of antenna sub-arrays #1 and #2, respectively. To decide the input phases of each antenna, the phase delay should be calculated as follows:
φ n 1 = φ PL n 1 φ min 1 φ n 2 = φ PL n 2 φ min 2
where φ min 1 and φ min 2 are the minimum phase values of the phases in sub-array #1 and #2, respectively. Therefore, the calculated final input phases φ n 1 and φ n 2 are the total compensating input phases to satisfy the in-phase condition of each tumor. Thus, φ n 1 and φ n 2 of each antenna are calculated and applied depending on the position of the tumor cells.
The positions of two tumor cells at (15,10) mm and (−15,−10) mm on the xy-plane are presented in Figure 8a. Antennas #1–#6 transmit microwaves to tumor #1, while #7–#12 transmit EM energy to tumor #2 in the simultaneous cancer treatment regimen. The calculated input phases aimed to concentrate the E-field on the two tumors in different positions. However, the SAR patterns were formed at positions away from the desired locations, and an unwanted E-field was applied to the breast phantom, as shown in Figure 8b. Although each antenna sub-array focused the electric field on different targets (tumors #1 and #2), incorrect field synthesis occurred outside of the target area due to the interactions of the E-fields passing through the tumor cells. In addition, unwanted E-field synthesis was observed due to interferences from the TSA antennas, which were facing each other. To minimize unwanted interference and provide a correct beamforming condition to the target positions, the phase compensation technique will be discussed in the next section.

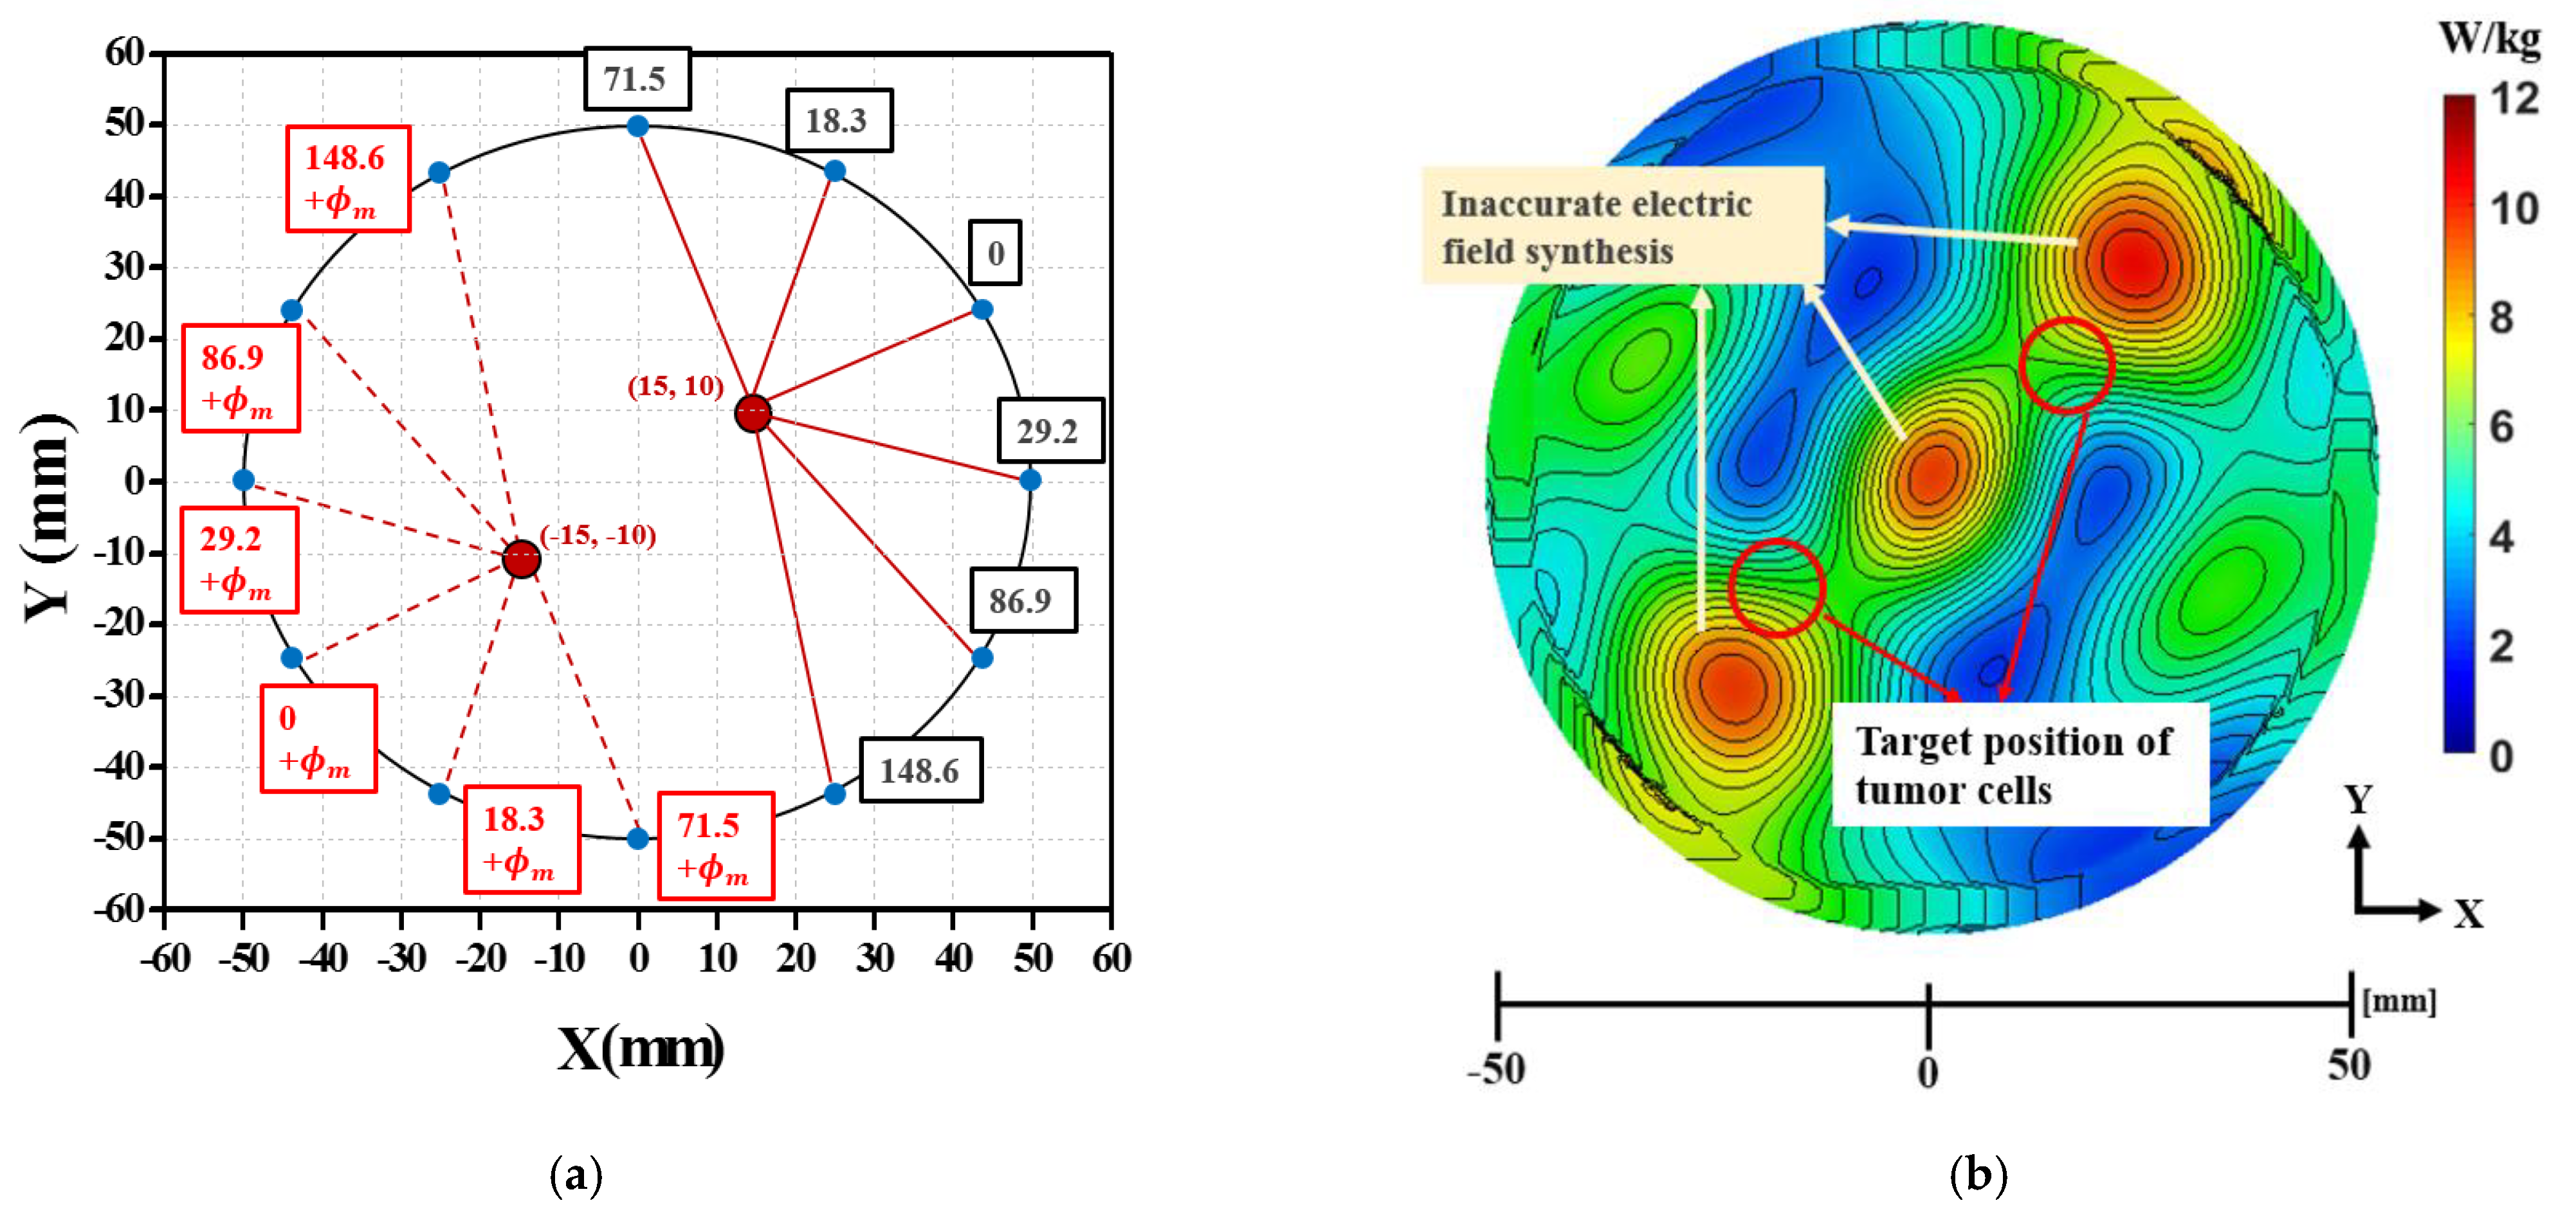
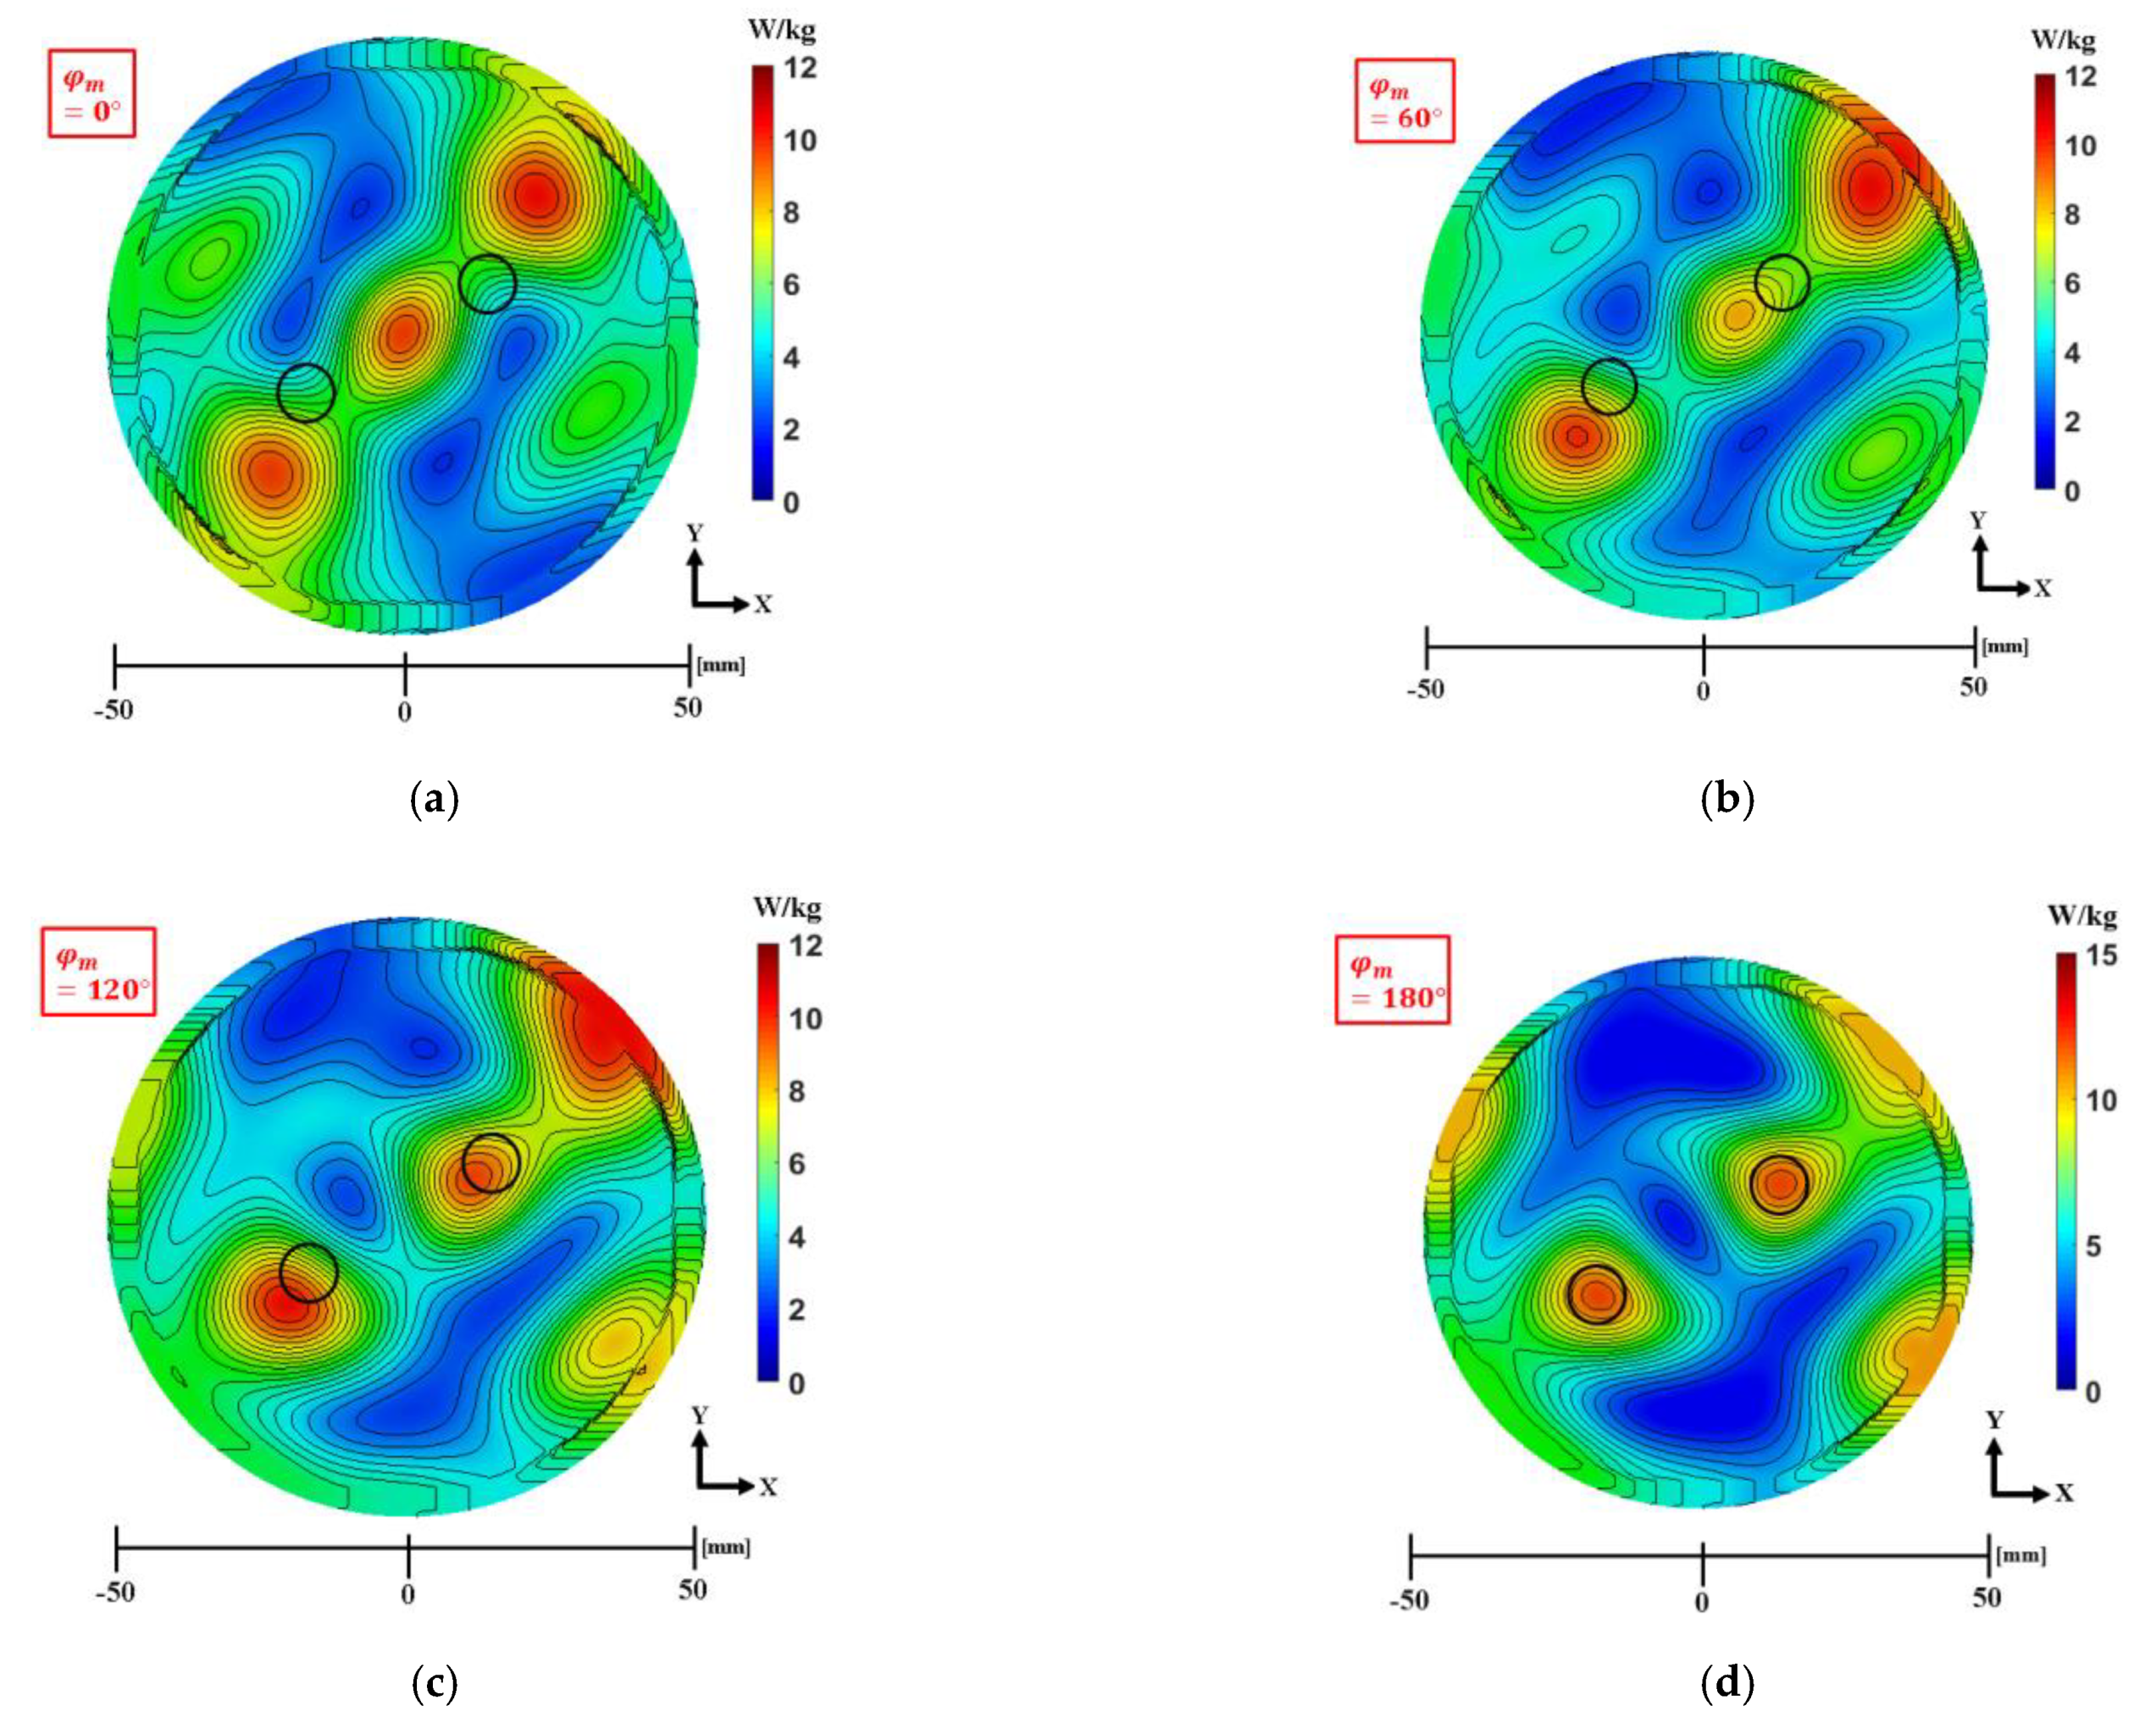
3.3. Phase Compensation Technique for Multiple Focusing

As mentioned in the previous section, unwanted E-field focusing occurred due to the interactions between the sub-arrays. In circular antenna arrays, the interferences between the antennas on opposite sides are most severe. An inaccurate synthesis of the E-field inside the breast phantom can degrade the success of the hyperthermia treatment. Therefore, in this section, the phase compensation technique is applied to enhance the SAR focusing in the target points.
To minimize the number of unwanted interferences, each input phase was calculated to satisfy the in-phase condition in the target tumors, and the phase compensation technique was applied to allow destructive interference to occur between the sub-arrays, as shown in Figure 8a. In the calculated input phase of sub-array #2, the modified phase φ m was added to antennas #7–#12 to compensate for phase φ n 2 in Equation (10):
φ n 2 * = φ n 2 + φ m
where φ n 2 * is the modified phase applied to sub-array #2. The input phases depending on the different values of the modified phases are reported in Table 3, and the SAR distributions with phase compensation depending on the modified phase values are presented in Figure 9. The added modified phases φ m are 0 ° , 60 ° , 120 ° , and 180 ° , respectively. In Figure 9, the modified phase is insufficient for achieving destructive interference in the unwanted spot, and inaccurate E-field synthesis is still observed. However, when the modified phase φ m is 180 ° , sub-arrays #1 and #2 are out-of-phase, so destructive interference occurs outside the cancer spots, and maximum SAR occurs at (15,10) mm and (−15,−10) mm, as shown in Figure 9d. In this condition, the E-fields are well concentrated on the desired positions, leading to successful thermal therapeutic effects.
To confirm the out-of–phase condition between sub-array #1 and #2, the modified phase φ m = 180 ° is applied in sub-array #2 for two other cases of tumor locations: case 1—two tumors are at (−10, 20) mm and (15,−10) mm; case 2—two tumors are at (20,0) mm and (−15,−15) mm. The input phases for case 1 and 2 are shown in Table 4. In Figure 10a,b, the SAR distributions in accordance with the input phases in Table 4 are presented. As a result, the maximum SARs are presented at (−10, 20) mm and (15,−10) mm in Figure 10a, and (20,0) mm and (−15,−15) mm in Figure 10b, respectively. By applying the modified phase, φ m = 180 ° in sub-array #2, the out-of-phase condition is achieved between sub-array #1 and #2 and the EM energy is well-focused in the target areas.

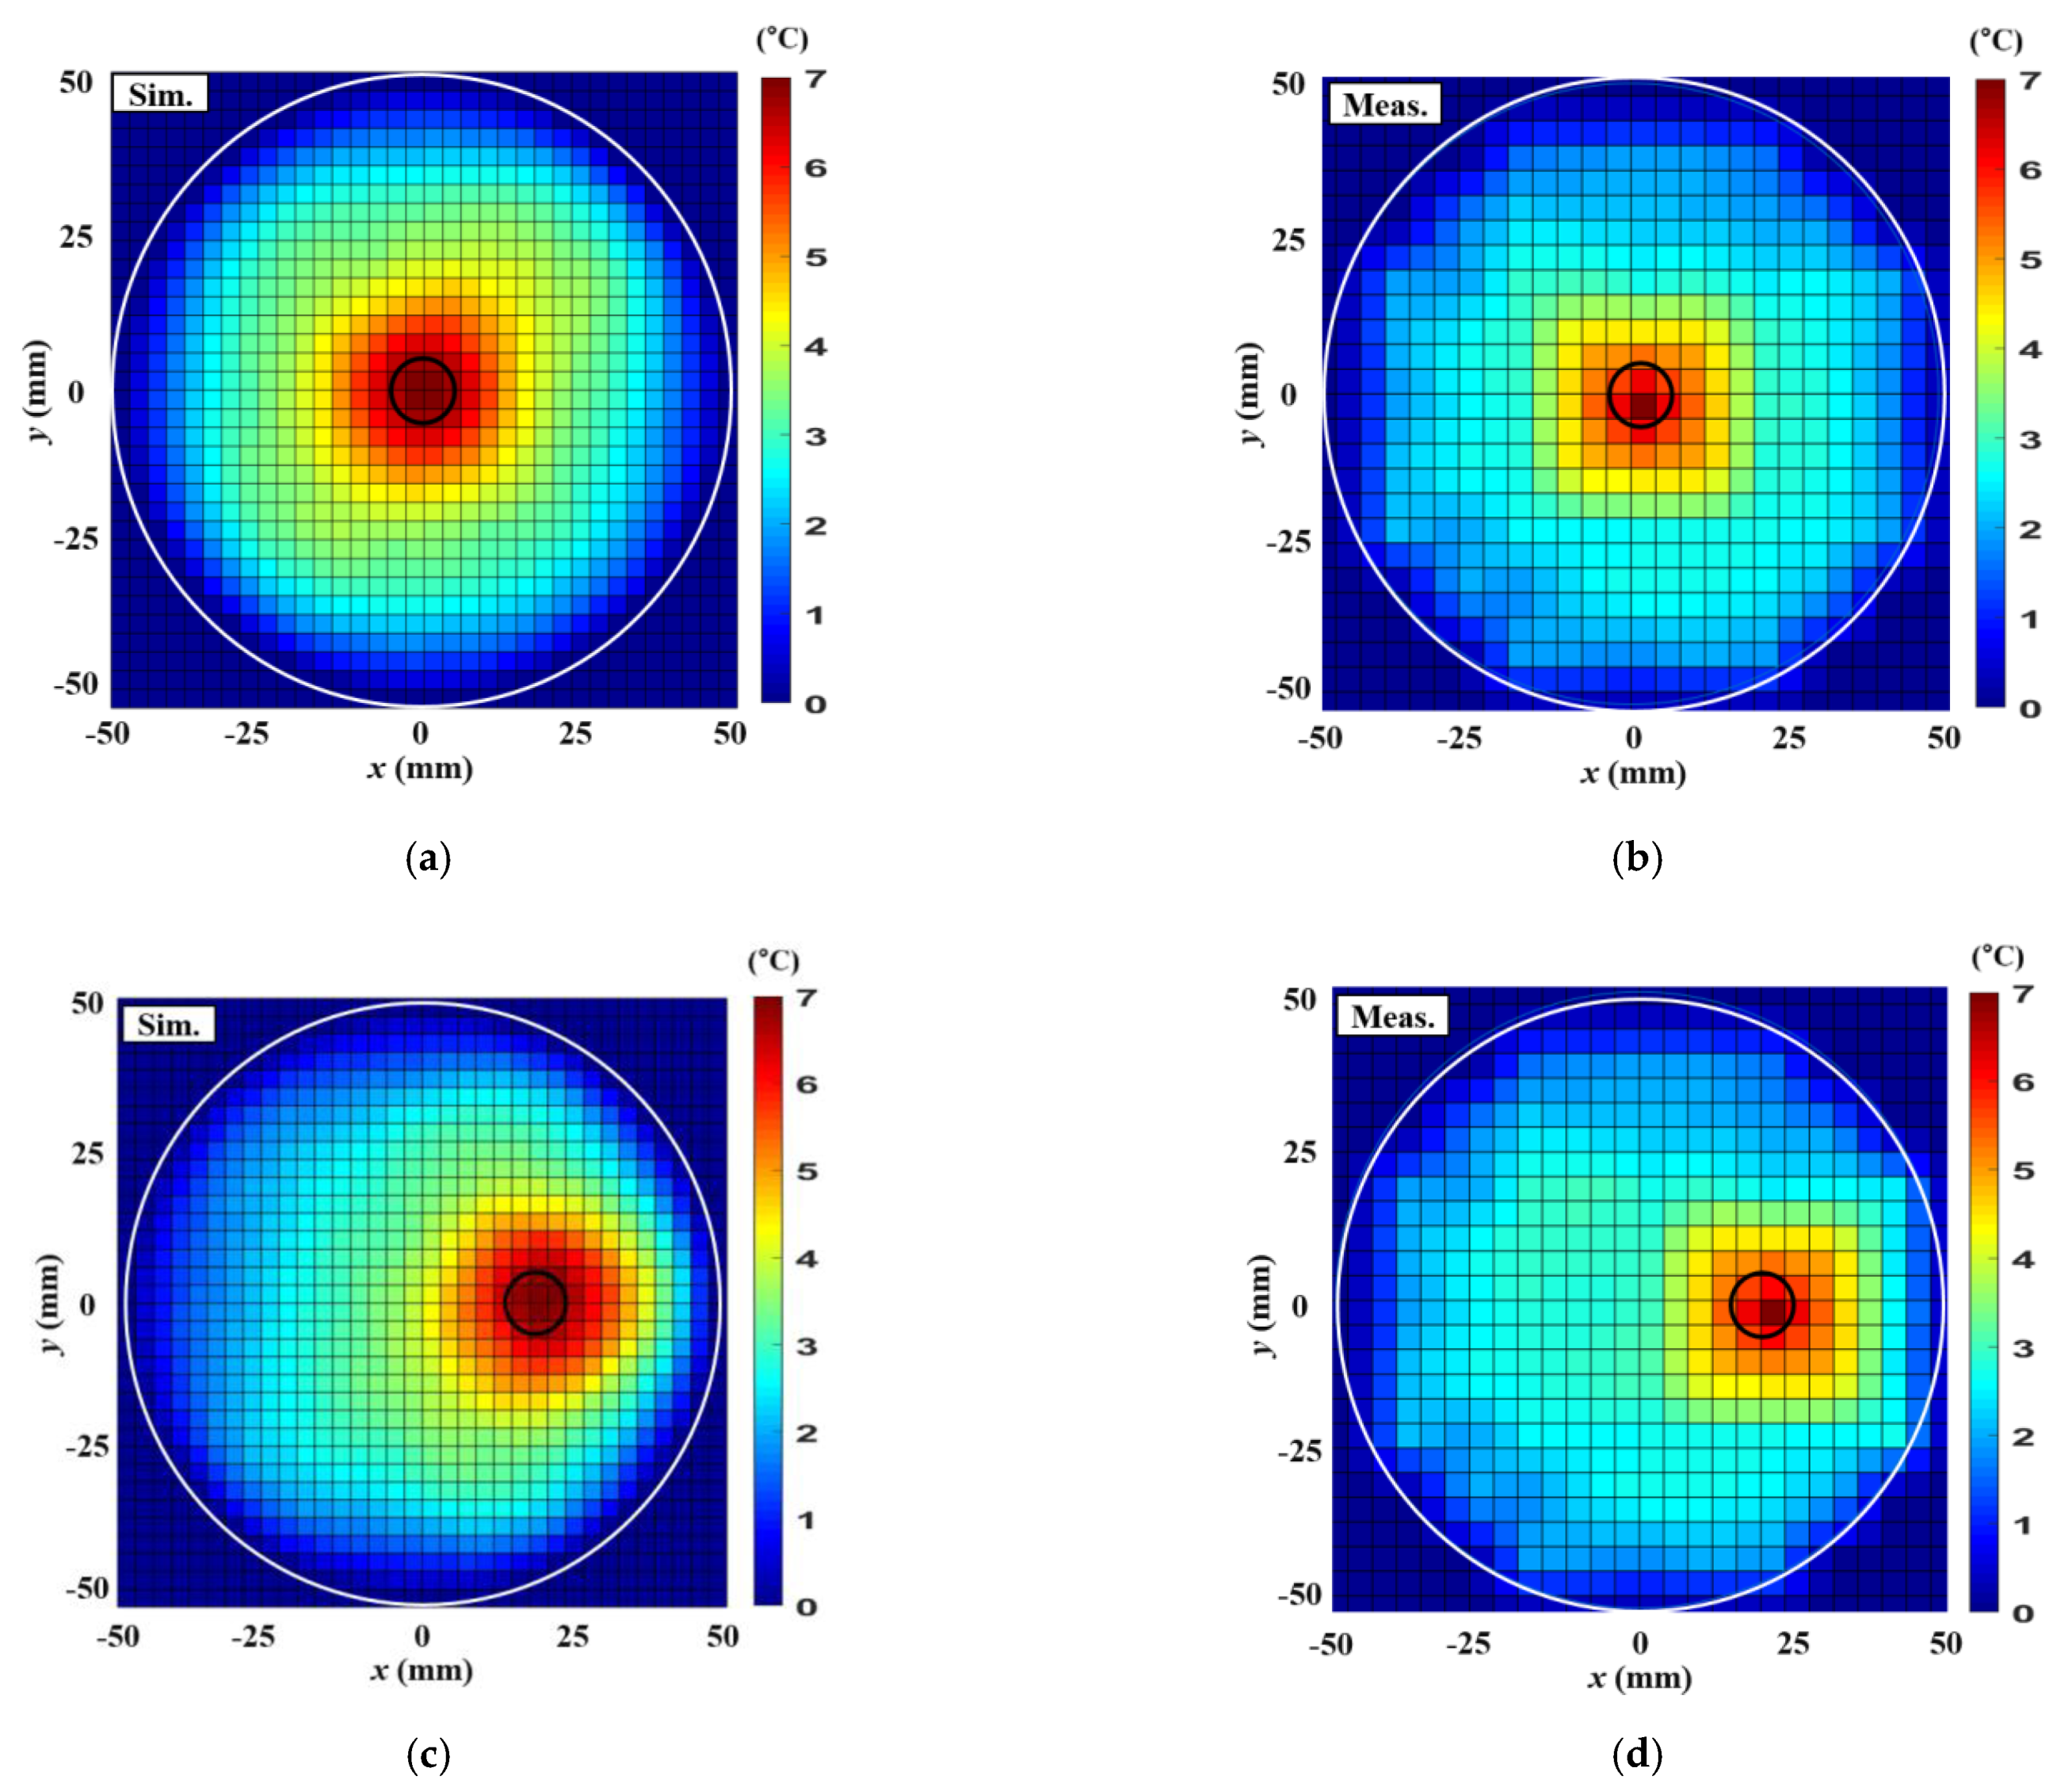
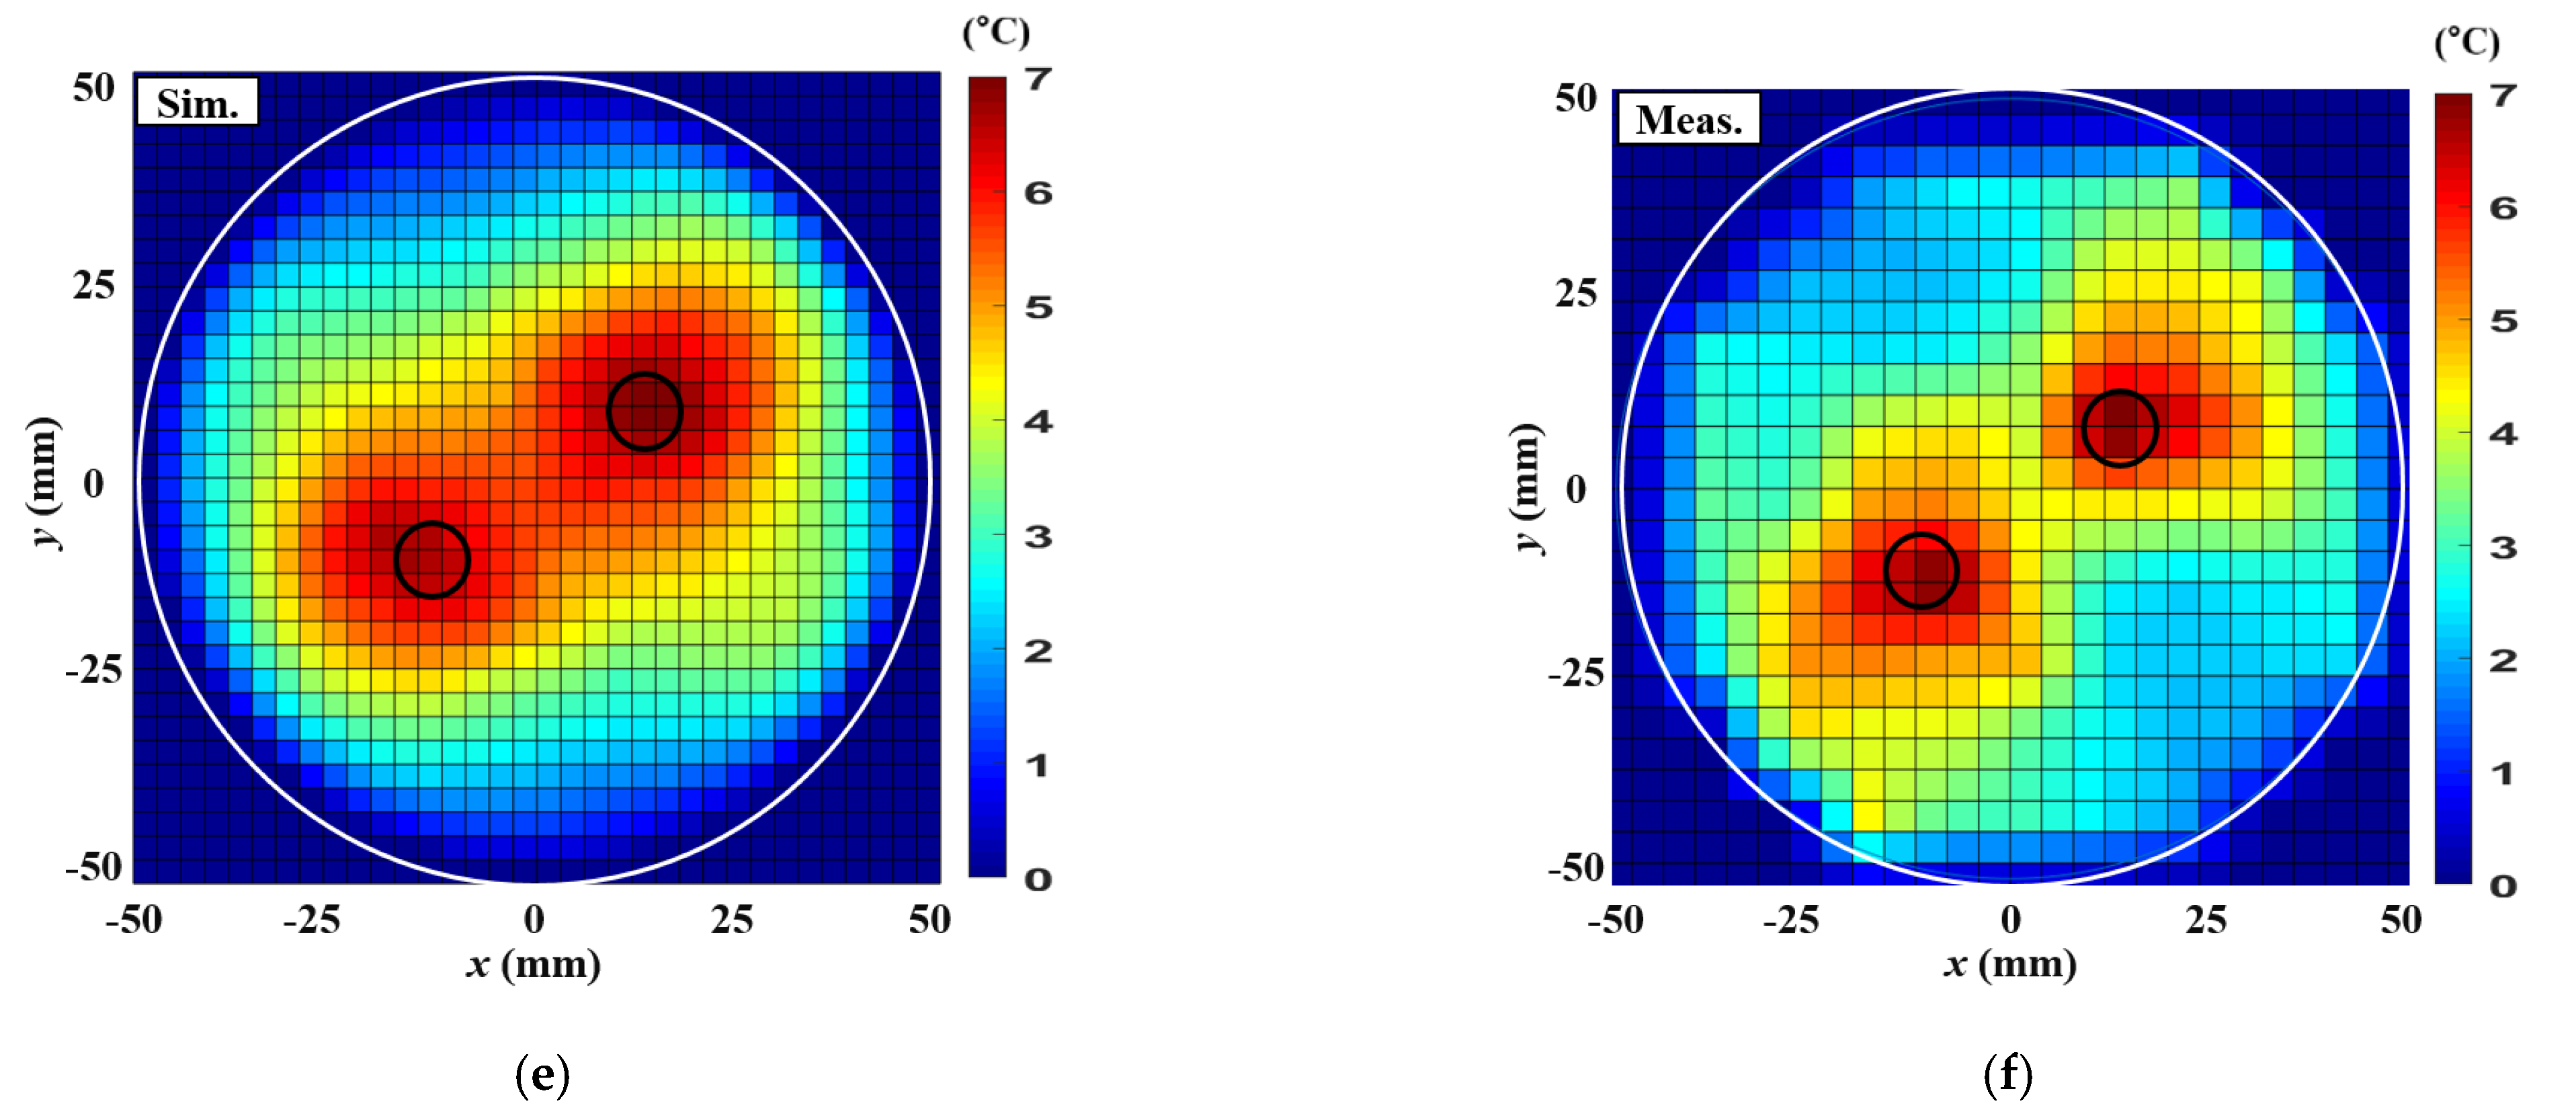
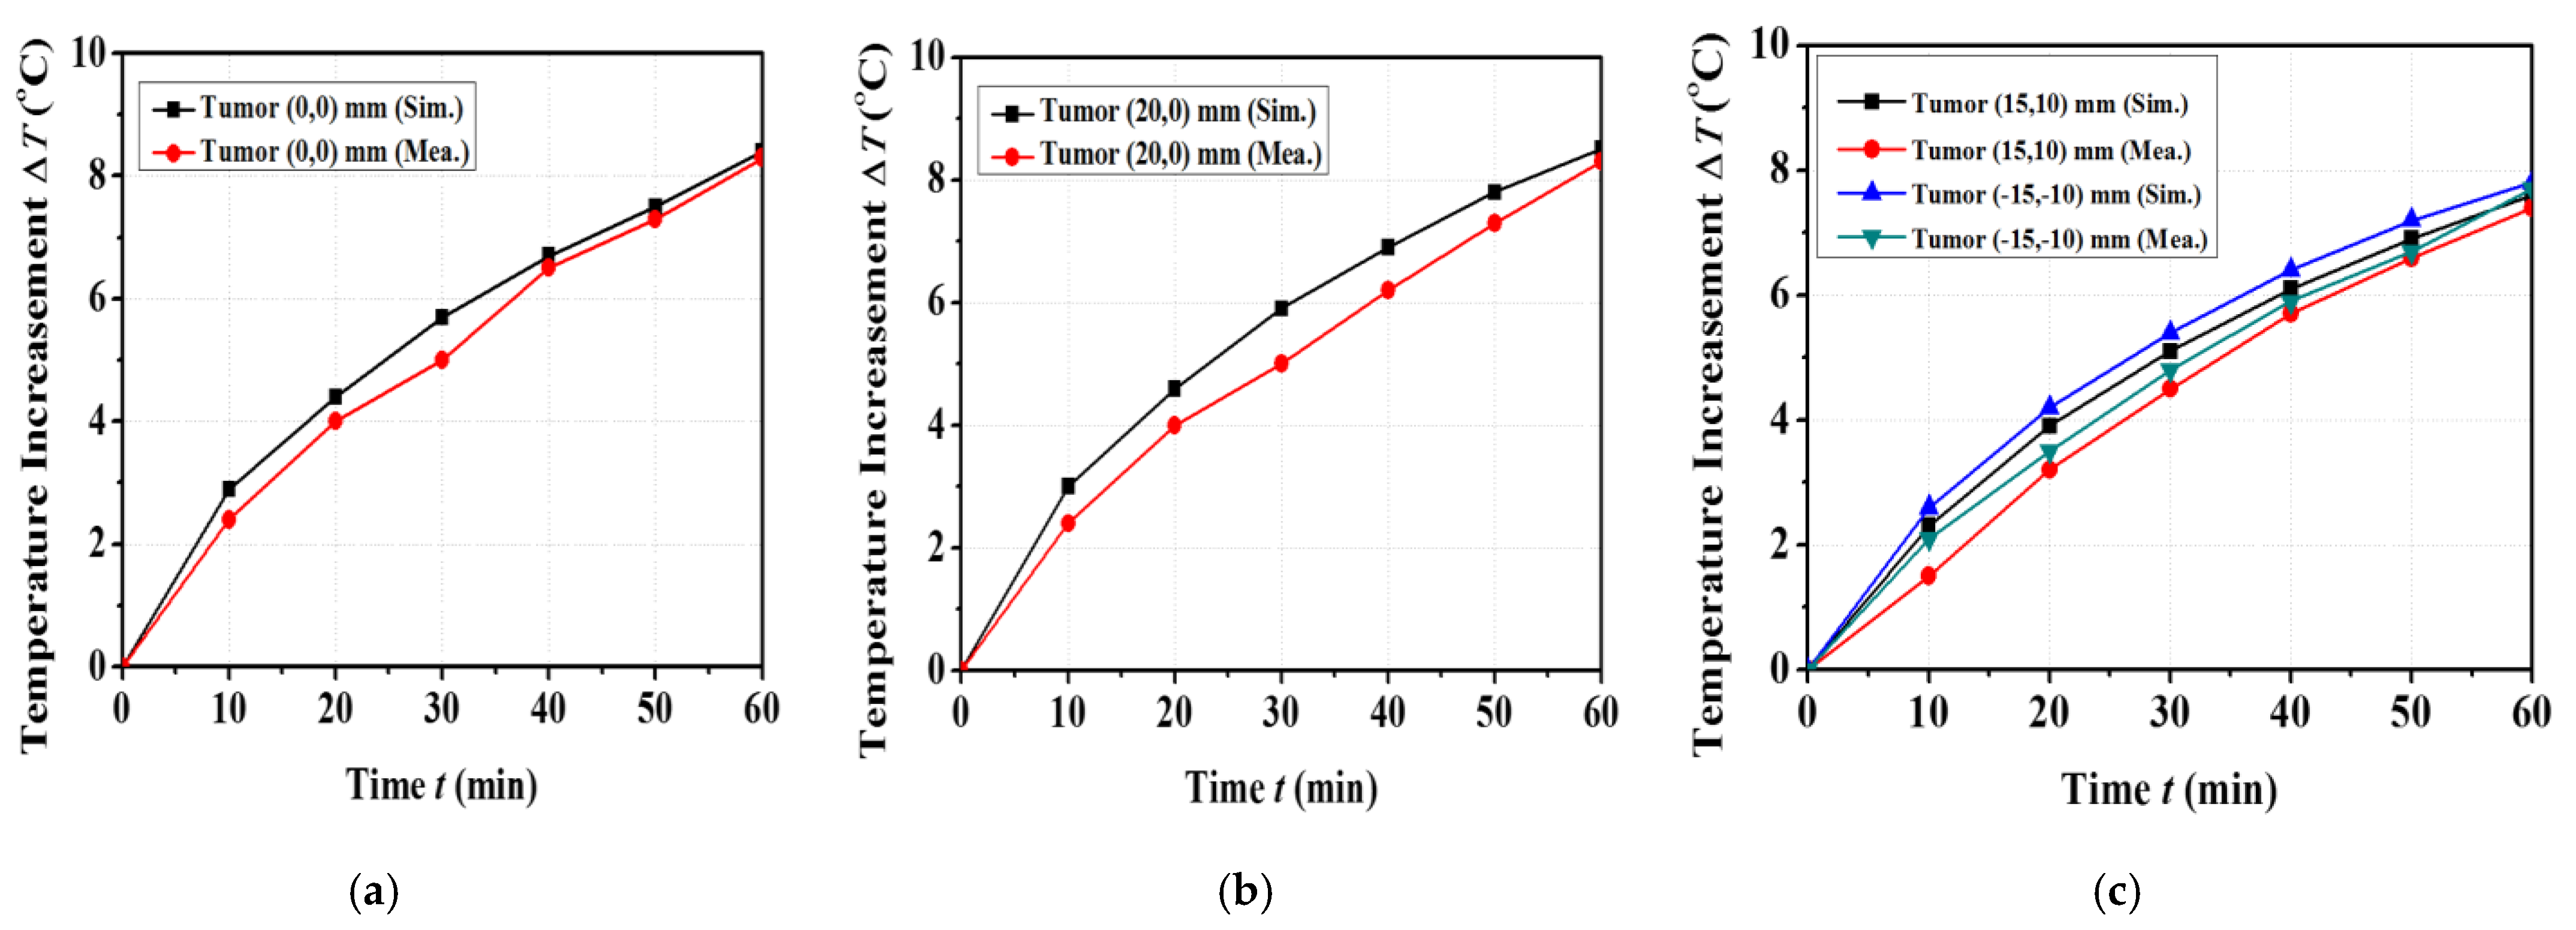
4. Thermal Experiment Results

To verify the thermal effects, the temperature measurement setup and block diagram of the temperature measuring system are presented in Figure 11a,b, respectively. At the boundaries of the phantom in simulation, the initial temperature was set to 0   ° C for a clear comparison of the measured temperature increase. The thermal experiments consisted of four stages of radio frequency (RF) signal generation and amplification, RF energy excitation, an experiment on the fabricated phantom, an experiment on the thermal effect, and an evaluation of the effects of the temperature rise [19]. The thermal effects on tumor necrosis were verified by analyzing the effective treatment area (ETA) [8], which was regarded as a region in which the tumor satisfies the temperature increase requirement of 7–10 .
To verify the heating effect on both a single tumor and on multiple tumors, the thermal measurements were conducted as follows: two for single tumor cases and one for a double tumor case. The first and second cases were conducted on a single tumor located at (0,0) mm and (20,0) mm, respectively, and the third case was conducted on two tumors located at (15,10) mm and (−15,10) mm. The phases of each antenna array were applied to the delay lines based on the calculated input phases. The thermal increase that occurred inside the cylindrical breast phantom was measured using a multi-channel thermometer with 12 probes and a data logger to manage the real time temperature data. The probe was set to detect the middle of the cylindrical phantom in the vertical axis. The simulated and measured results of the thermal effects on a single tumor cell and two tumor cells are shown in Figure 12a–f. The target positions of the tumor cells are marked with a black circle. To achieve an optimum temperature increase during a 1-h period heating, the total input powers of the array antenna were decided by the bio-heat equation supported by the CST Studio Suite [27]. The total input powers for the single tumor cells at (0,0) mm and (20,0) mm were 7.1 W and 6 W, respectively. The simulated and measured maximum temperature increases were 8.4 and 8.3 for the single tumor cell at (0,0) mm, and 8.5 and 8.3 for the single tumor cell at (20,0) mm, respectively. The target therapeutic areas of the multifocal breast cancer were at (15,10) mm and (−15,−10) mm, as shown in Figure 12e,f. To provide a heating effect on two targets simultaneously, phase compensation was applied in sub-array #2, and the input phases were controlled with delay lines. The induced total RF power was 7.1 W for 1-h treatment. The simulated and measured maximum temperature increases were 7.8 and 7.7 , respectively. The temperature transient distribution over time and the simulation and measurement results are shown in Figure 12a–c, where a single tumor was present at (0,0) mm and (20,0) mm, and two tumors at (10,15) mm and (−10,−15) mm. All the temperature results were post-processed using MATLAB. As shown in Figure 13, the temperature increased gradually over time. When comparing the simulation and measurement results, the hot spots were well-formed, and the results were well-matched. Moreover, the ETAs covered the target tumor cell positions and areas, thereby leading to effective thermal therapeutic effects. The inducing power, simulated SAR, and thermal effects achieved with the proposed TSA antenna array are summarized in Table 5.

5. Conclusions

An antenna array that uses the phase compensation technique to effectively concentrate EM energy during microwave hyperthermia treatment for deep-seated breast cancer was proposed in this paper. The thermal effect was determined based on the E-field absorbed in the therapeutic region. To deliver EM energy inside the human breast, the input phases of each antenna should be controlled based on the location of the tumor cells. Strong constructive interference in the target area can be achieved when each TSA has equal polarization characteristics. Therefore, the direction of each antenna and array configuration was optimized for effective E-field synthesis. Moreover, accurate phase control is needed on the target area to minimize thermal damage to normal cells. The input phase of each antenna in the 12-element array was calculated for single and multiple targets depending on the tumor condition in the breast phantom. For multiple targets in particular, sub-array beam focusing was applied to simultaneously provide therapeutic effects on the multifocal breast cancer. To minimize interference between the sub-arrays, the values of the modified phase for phase compensation were added to the antennas in one of the sub-arrays so that sub-arrays #1 and #2 were out-of-phase. The temperature distribution of the single tumor and multiple tumor cases were simulated and measured to verify the therapeutic performance of the proposed approach. Consequently, the proposed 12-element array system and the phase compensation technique provided enhanced therapeutic capabilities for breast cancer hyperthermia treatment.

Author Contributions

Data curation and writing—original draft preparation, S.L.; writing—review and editing, S.L. and Y.J.Y.; supervision, Y.J.Y. Both authors have read and agreed to the published version of the manuscript.

Funding

This research received no external funding.

Institutional Review Board Statement

Not applicable.

Informed Consent Statement

Not applicable.

Data Availability Statement

The data presented in this study are available on request from the corresponding author. The data are not publicly available due to privacy restrictions.

Acknowledgments

This paper was supported by the National Research Foundation of Korea (NRF) grant funded by the Korea government (MSIT) (No. NRF-2019R1A2C1005764).

Conflicts of Interest

The authors declare no conflict of interest.

References

  1. Sung, H.; Ferlay, J.; Siegel, R.L.; Laversanne, M.; Soerjomataram, I.; Jemal, A.; Bray, F. Global cancer statistics 2020: GLOBOCAN estimates of incidence and mortality worldwide for 36 cancers in 185 countries. CA Cancer J. Clin. 2021, 71, 209–249. [Google Scholar] [CrossRef] [PubMed]
  2. Cala, P.; Bienkowski, P. Antenna array for microwave ablation or hyperthermia working in the ISM 2.4 GHz band. Przegl. Elektrotech. 2018, 94, 238–241. [Google Scholar]
  3. Gas, P. Essential Facts on the History of Hyperthermia and their Connections with Electromedicine. Przegl. Elektrotech. 2011, 87, 37–40. [Google Scholar]
  4. Peeken, J.C.; Vaupel, P.; Combs, S.E. Integrating hyperthermia into modern radiation oncology: What evidence is necessary? Front. Oncol. 2017, 7, 132. [Google Scholar] [CrossRef] [PubMed] [Green Version]
  5. Refaat, T.; Sachdev, S.; Sathiaseelan, V.; Helenowski, I.; Abdelmoneim, S.; Pierce, M.C.; Woloschak, G.; Small, W.; Mittal, B.; Kiel, K.D. Hyperthermia and radiation therapy for locally advanced or recurrent breast cancer. Breast 2015, 24, 418–425. [Google Scholar] [CrossRef] [Green Version]
  6. Amin, M.; Huang, W.; Seynhaeve, A.L.B.; ten Hagen, T.L.M. Hyperthermia and Temperature-Sensitive Nanomaterials for Spatiotemporal Drug Delivery to Solid Tumors. Pharmaceutics 2020, 12, 1007. [Google Scholar] [CrossRef] [PubMed]
  7. Choi, W.C.; Kim, K.J.; Kim, J.; Yoon, Y.J. Compact microwave radiator for improving heating uniformity in hyperthermia system. IEEE Antennas Wirel. Propag. Lett. 2014, 13, 1345–1348. [Google Scholar] [CrossRef]
  8. Krenacs, T.; Meggyeshazi, N.; Forika, G.; Kiss, E.; Hamar, P.; Szekely, T.; Vancsik, T. Modulated Electro-Hyperthermia-Induced Tumor Damage Mechanisms Revealed in Cancer Models. Int. J. Mol. Sci. 2020, 21, 6270. [Google Scholar] [CrossRef]
  9. Converse, M.; Bond, E.J.; Van Veen, B.D.; Hagness, S.C. A computational study of ultra-wideband versus narrowband microwave hyperthermia for breast cancer treatment. IEEE Trans. Microwave Theory Tech. 2006, 54, 2169–2180. [Google Scholar] [CrossRef] [Green Version]
  10. Iero, D.A.M.; Crocco, L.; Isernia, T. Thermal and microwave constrained focusing for patient-specific breast cancer hyperthermia: A robustness assessment. IEEE Trans. Antennas Propag. 2014, 62, 814–821. [Google Scholar] [CrossRef]
  11. Nguyen, P.T.; Abbosh, A.; Crozier, S. Microwave hyperthermia for breast cancer treatment using electromagnetic and thermal focusing tested on realistic breast models and antenna arrays. IEEE Trans. Antennas Propag. 2015, 63, 4426–4434. [Google Scholar] [CrossRef]
  12. Bellizzi, G.G.; Sumser, K.; VilasBoas-Ribeiro, I.; Curto, S.; Drizdal, T.; van Rhoon, G.; Franckena, M.; Paulides, M.M. Standardization of patient modeling in hyperthermia simulation studies: Introducing the Erasmus Virtual Patient Repository. Int. J. Hyperth. 2020, 37, 608–616. [Google Scholar] [CrossRef] [PubMed]
  13. Fadeev, A.M.; Ivanov, S.M.; Perelstein, E.A.; Polozov, S.M. Thermometry system development for thermoradiotherapy of deep-seated tumours. J. Phys. Conf. Ser. 2017, 941, 012086. [Google Scholar] [CrossRef]
  14. Gaffoglio, R.; Righero, M.; Giordanengo, G.; Zucchi, M.; Vecchi, G. Fast Optimization of Temperature Focusing in Hyperthermia Treatment of Sub-Superficial Tumors. IEEE J. Electromagn. RF Microw. Med. Biol. 2021. [Google Scholar] [CrossRef]
  15. Bellizzi, G.G.; Paulides, M.M.; Drizdal, T.; van Rhoon, G.C.; Crocco, L.; Isernia, T. Selecting the optimal subset of antennas in hyperthermia treatment planning. IEEE J. Electromagn. RF Microw. Med. Biol. 2019, 3, 240–246. [Google Scholar] [CrossRef]
  16. Gas, P.; Miaskowski, A. SAR optimization for multi-dipole antenna array with regard to local hyperthermia. Przegl. Elektrotech. 2019, 95, 17–20. [Google Scholar] [CrossRef] [Green Version]
  17. Curto, S.; Garcia-Miquel, A.; Vidal, N.; Lopez-Villegas, J.M.; Prakash, P. Design and characterisation of a phased antenna array for intact breast hyperthermia. Int. J. Hyperth. 2018, 34, 250–260. [Google Scholar] [CrossRef] [Green Version]
  18. Fenn, A.J. An adaptive microwave phased array for targeted heating of deep tumours in intact breast: Animal study results. Int. J. Hyperth. 1999, 15, 45–61. [Google Scholar] [CrossRef]
  19. Kok, H.P.; Wust, P.; Stauffer, P.R.; Bardati, F.; van Rhoon, G.C.; Crezee, J. Current state of the art of regional hyperthermia treatment planning: A review. Radiat. Oncol. 2015, 10, 1–14. [Google Scholar] [CrossRef] [Green Version]
  20. Gas, P.; Miaskowski, A.; Subramanian, M. In Silico Study on Tumor-Size-Dependent Thermal Profiles inside an Anthropomorphic Female Breast Phantom Subjected to Multi-Dipole Antenna Array. Int. J. Mol. Sci. 2020, 21, 8597. [Google Scholar] [CrossRef]
  21. Stang, J.; Haynes, M.; Carson, P.; Moghaddam, M. A preclinical system prototype for focused microwave thermal therapy of the breast. IEEE Trans. Biomed. Eng. 2012, 59, 2431–2438. [Google Scholar] [CrossRef] [Green Version]
  22. Cabioglu, N.; Ozmen, V.; Kaya, H.; Tuzlali, S.; Igci, A.; Muslumanoglu, M.; Kecer, M.; Dagoglu, T. Increased lymph node positivity in multifocal and multicentric breast cancer. J. Am. Coll. Surg. 2009, 208, 67–74. [Google Scholar] [CrossRef] [PubMed]
  23. Zhang, Z.; Song, S. Thermosensitive/superparamagnetic iron oxide nanoparticle-loaded nanocapsule hydrogels for multiple cancer hyperthermia. Biomaterials 2016, 106, 13–23. [Google Scholar] [CrossRef] [PubMed]
  24. Nizam-Uddin, N.; Abdulkawi, W.M.; Elshafiey, I.; Sheta, A.F.A. Toward a multi-target multi-channel hyperthermia treatment system: Proof of concept with numerical simulations. Int. J. Heat Mass Transf. 2020, 150, 119257. [Google Scholar] [CrossRef]
  25. Lim, S.; Yoon, Y.J. Wideband-Narrowband Switchable Tapered Slot Antenna for Breast Cancer Diagnosis and Treatment. Appl. Sci. 2021, 11, 3606. [Google Scholar] [CrossRef]
  26. Gabriel, C. Compilation of the Dielectric Properties of Body Tissues at RF and Microwave Frequencies; King’s Coll London: London, UK, 1996. [Google Scholar]
  27. Henin, B.; Abbosh, A.M.; Al Abdulla, W. Electro-biomechanical breast phantom for hybrid breast imaging. In Proceedings of the 2015 International Symposium on Antennas and Propagation (ISAP), Hobart, TAS, Australia, 9–12 November 2015; pp. 1–3. [Google Scholar]
  28. CST Studio Suite. 2019. Available online: https://www.3ds.com/products-services/simulia/products/cst-studio-suite/ (accessed on 20 August 2018).
  29. Vander Vorst, A.; Rosen, A.; Kotsuka, Y. RF/Microwave Interaction with Biological Tissues; John Wiley & Sons: Hoboken, NJ, USA, 2006. [Google Scholar]
  30. Farahat, A.E.; Kahil, H.M.; Hussein, K.F.A. Microwave Diathermy for Deep Heating Therapy of Knee Joint. Prog. Electromagn. Res. C 2020, 99, 15–33. [Google Scholar] [CrossRef] [Green Version]
  31. Pennes, H.H. Analysis of tissue and arterial blood temperatures in the resting human forearm. J. Appl. Physiol. 1948, 1, 93–122. [Google Scholar] [CrossRef]
  32. Gonzalez, F.J. Non-invasive estimation of the metabolic heat production of breast tumors using digital infrared imaging. Quant. Infrared Thermogr. J. 2011, 8, 139–148. [Google Scholar] [CrossRef]
Figure 1. (a) Simulation configuration of the single tapered slot antenna (TSA) and (b) geometry of this antenna for microwave hyperthermia [25].
Applsci 11 05972 g001
Figure 2. The simulated and measured reflection coefficients for the used TSA antenna.
Applsci 11 05972 g002
Figure 3. Simulated E-field distribution at 2.45 GHz in the breast phantom derived from a single TSA antenna.
Applsci 11 05972 g003
Figure 4. The 3D model of the cylindrical TSA antenna array with vertical polarization: (a) xz-plane and (b) xy-plane.
Applsci 11 05972 g004
Figure 5. The EM waves focusing on the breast phantom with different path lengths from TSA antennas.
Applsci 11 05972 g005
Figure 6. The 2D section of SAR distributions focused at different tumor positions: (a) (20,0) mm and (b) (15,15) mm.
Applsci 11 05972 g006
Figure 7. Configuration of the six-element antenna sub-array focusing system for two breast tumors.
Applsci 11 05972 g007
Figure 8. (a) Two breast tumor locations at (15,10) mm and (−15,−10) mm, and (b) the 2D section of SAR distribution with inaccurate E-field synthesis.
Applsci 11 05972 g008
Figure 9. The 2D section of SAR distributions with the phase compensation technique depending on the values of the modified phase (black circles: tumor position): (a) φ m = 0 ° , (b) φ m = 60 ° , (c) φ m = 120 ° and (d) φ m = 180 ° .
Applsci 11 05972 g009
Figure 10. The 2D section of SAR distributions with the phase compensation technique (modified phase, φ m = 180 ° ): (a) two breast tumors located at (−10,20) mm and (15,−10) mm, (b) two breast tumors located at (20,0) mm and (−15,−15) mm.
Applsci 11 05972 g010
Figure 11. (a) Configuration of the temperature measurement setup, and (b) block diagram of the temperature measuring system [25].
Applsci 11 05972 g011
Figure 12. The 2D sections of temperature distribution after the 1-h heating on a single tumor at (0,0) mm: (a) simulation result and (b) measurement result. Temperature distribution after 1-h heating on a single tumor at (20,0) mm: (c) simulation result and (d) measurement result. Temperature distribution for 1-h heating on multiple tumors with phase compensation at (15,10) mm and (−15,−10) mm: (e) simulation result and (f) measurement result.
Applsci 11 05972 g012aApplsci 11 05972 g012b
Figure 13. The transient temperature distribution at the tumor center: (a) single tumor at (0,0) mm, (b) single tumor at (20,0) mm, and (c) two tumors at (15,10) mm and (−15,−10) mm.
Applsci 11 05972 g013
Table 1. Dielectric and thermal properties of breast tissues at 2.45 GHz [32].
PropertiesFatTumor
Dielectric permittivity ε r 5.1455
Loss tangent tan δ 0.1370.29
Density ρ ( kg / m 3 )920920
Thermal conductivity σ (W/K/m)0.420.42
Heat capacity C p (J/K/kg)30003000
Table 2. Calculated input phases for unifocal breast cancer.
Position of Single Tumor ( x t 1 , y t 1 ) Antenna Number
123456789101112
(20, 0) mm159 ° 90.6 ° 27.8 ° 0 ° 27.8 ° 90.6 ° 159 ° 216.3 ° 253.7 ° 266.7 ° 253.7 ° 216.3 °
(15,15) mm53.8 ° 0 ° 0 ° 53.8 ° 126.6 ° 194.2 ° 244.6 ° 271.3 ° 271.3 ° 244.6 ° 194.2 ° 126.6 °
Table 3. Calculated input phases with a modified phase for two different breast tumors.
Modified Phase, φ m Antenna Number
123456789101112
0 ° 71.5 ° 18.3 ° 0 ° 29.2 ° 86.9 ° 148.6 ° 71.5 ° 18.3 ° 0 ° 29.2 ° 86.9 ° 148.6 °
60 ° 71.5 ° 18.3 ° 0 ° 29.2 ° 86.9 ° 148.6 ° 131.5 ° 78.3 ° 60 ° 89.2 ° 146.9 ° 208.6 °
120 ° 71.5 ° 18.3 ° 0 ° 29.2 ° 86.9 ° 148.6 ° 191.5 ° 138.3 ° 120 ° 149.2 ° 206.9 ° 268.6 °
180 ° 71.5 ° 18.3 ° 0 ° 29.2 ° 86.9 ° 148.6 ° 251.5 ° 198.3 ° 180 ° 209.2 ° 266.9 ° 328.6 °
Table 4. Calculated input phases for multifocal breast cancer for φ m = 180 ° .
Position   of   Multiple   Tumors   ( x t 1 , y t 1 ) ,   ( x t 2 , y t 2 ) Antenna Number
123456789101112
Case 1—(−10,20) mm,(15, −10) mm199.5°148.6°86.8°29.2°18.3°467.72°429.9°369.2°293.8°219.9°180°
Case 2—(20,0) mm, (–15, −15) mm159.6°90.9°27.9°27.9°90.9°233.9°180°180°233.9°307°374.9°
Table 5. Comparison of the simulation and measurement results.
ParametersSingle Tumor at (0,0) mmSingle Tumor at (20,0) mmTwo Tumors at (15,10) mm, (−15,−10) mm
Input RF power (W)7.167.1
Maximum SAR in the simulation (W/kg)18.123.114.1
Maximum temperature increase in simulation ( )8.48.57.8
Maximum temperature increase in measurement ( )8.38.37.7
ETA in simulation ( mm 2 )226.9201153.9
ETA in measurement ( mm 2 )216.3195.9132.7
Publisher’s Note: MDPI stays neutral with regard to jurisdictional claims in published maps and institutional affiliations.

