Article

Numerical Investigation of Latent Thermal Storage in a Compact Heat Exchanger Using Mini-Channels

KTH Royal Institute of Technology, 100 44 Stockholm, Sweden
*
Author to whom correspondence should be addressed.
Appl. Sci. 2021, 11(13), 5985; https://doi.org/10.3390/app11135985
Submission received: 28 May 2021 / Revised: 23 June 2021 / Accepted: 24 June 2021 / Published: 27 June 2021
(This article belongs to the Special Issue Phase Change Materials: Design and Applications)

Abstract

:
This paper aims to numerically investigate the thermal enhancement of a latent thermal energy storage component with mini-channels as air passages. The investigated channels in two sizes of internal air passages (channel-1 with dh = 1.6 mm and channel-2 with dh = 2.3 mm) are oriented vertically in a cuboid of 0.15 × 0.15 × 0.1 m3 with RT22 as the PCM located in the shell. The phase change is simulated with a fixed inlet temperature of air, using ANSYS Fluent 19.5, with a varying number of channels and a ranging air flow rate entering the component. The results show that the phase change power of the LTES improves with by increasing the number of channels at the cost of a decrease in the storage capacity. Given a constant air flow rate, the increase in the heat transfer surface area of the increased number of channels dominates the heat transfer coefficient, thus increasing the mean heat transfer rate (UA). A comparison of the channels shows that the thermal performance depends largely on the area to volume ratio of the channels. The channel type two (channel-2) with a slightly higher area to volume ratio has a slightly higher charging/discharging power, as compared to channel type one (channel-1), at a similar PCM packing factor. Adding fins to channel-2, doubling the surface area, improves the mean UA values by 15–31% for the studied cases. The variation in the total air flow rate from 7 to 24 L/s is found to have a considerable influence, reducing the melting time by 41–53% and increasing the mean UA values within melting by 19–52% for a packing factor range of 77.4–86.8%. With the increase in the air flow rate, channel type two is found to have considerably lower pressure drops than channel type one, which can be attributed to its higher internal hydraulic diameter, making it superior in terms of achieving a relatively similar charging/discharging power in exchange for significantly lower fan power. Such designs can further be optimized in terms of pressure drop in future work, which should also include an experimental evaluation.

1. Introduction

Integration of thermal energy storage in ventilation systems can be advantageous to decrease system-associated costs, including capital and operational, and contribute to peak power savings [1,2]. Latent Thermal Energy Storage (LTES) is a favorable solution due to the large storage capacity of Phase Change Materials (PCM) and its low volume. The major obstacle associated with the LTES is the low thermal conductivity of the Phase Change Materials [3]. This results in a low charging/discharging power, requiring enhancement in heat transfer mechanisms [4]. The thermal performance of such a system is intensified even further in cases where air is used as the heat transfer fluid (HTF) [5].
The thermal performance of LTES systems working with air was addressed in some research [6,7,8,9,10]. Dolado et al. [6], working on a real scale air–PCM heat exchanger, pointed out that the bottleneck of the heat transfer, particularly at low air flow rates, could be due to the high resistance on the air side. The analysis showed that the system performance was improved by increasing the flow rate of air or decreasing the air channel thickness; however, at the cost of having a higher fan energy consumption.
Vakilaltojjar and Saman [7] analyzed a plate encapsulating PCM system working with air and reported that the thermal performance could be improved by decreasing the dimensions of the air channels and the PCM slabs.
Marin et al. [8] investigated an LTES system, enhanced with graphite, and concluded that in cases with the PCM–graphite composite, as the storage medium, the thermal performance of the LTES was controlled by the resistance on the air side, due to the reduced resistance of the storage medium. On the other hand, in cases where pure PCM was employed, the resistances on the PCM and the airside were competitive.
Herbinger et al. [10] performed a parametric study of an air–PCM heat exchanger for ventilation systems, considering square channels of 2 × 2 cm2, 4 × 4 cm2 and 6 × 6 cm2. They found that as the channel dimension decreased, the charging/discharging power increased, and the best thermal performance was achieved for the smallest channels. However, in the study, the influence of reducing the hydraulic diameter of the channels and subsequently the increase in the heat transfer coefficient of air and its effect on the thermal performance was lacking.
The hydraulic diameter ( d h ) of the flow passages can be reduced significantly by using mini- and micro-channels. Mini/micro-channels proved to be significantly beneficial in various industries and applications such as the refrigeration/heat pump industry and electronics cooling [11,12,13,14]. Kandlikar et al. [11] classified the passages based on the dimensions of the hydraulic diameter ( d h ) to conventional channels for d h > 3 mm, mini-channels for 0.2 mm < d h   < 3 mm and micro-channels for 0.01 mm < d h   < 0.2 mm. Kandlikar et al. [11] showed that the fluid heat transfer coefficients for circular passages are inversely proportional to the hydraulic diameter, given a fixed flow rate. However, the increase in heat transfer coefficient is achieved at a considerable cost of an increase in the pressure drop. Besides the hydraulic diameter, with rectangular channels, the aspect ratio of the channels as a fraction of the width to the height can influence the heat transfer coefficient. Wibulawas [15], in a study on laminar flow in heat transfer in non-circular ducts, showed that, given a constant Graetz number (Gz = d h l RePr ), the Nusselt number either under constant heat flux or constant wall temperature conditions increases with the increase in the aspect ratios of the channels.
Rectangular mini-channels with low hydraulic diameters and high area-to-volume ratios have the potential to enhance the heat transfer on both the air and PCM sides with having relatively high PCM packing factors (PF). This is particularly beneficial in LTES applications related to air as the HTF, where there are needs for enhancement due to low thermal conductivities of air and PCMs.
Mini/micro-channels can be fabricated conventionally using extrusion or Additive Manufacturing (AM) processes [16,17,18,19,20]. However, an extrusion process is associated with certain limitations and restrictions in producing complex features. Additive Manufacturing (AM), known as 3D printing, is an alternative new fabrication method capable of manufacturing complex geometric features, including the embedding of internal/external thermal enhancers and bypassing many limitations associated with conventional methods. However, 3D printing is also associated with certain disadvantages such as higher surface roughness, limited options in printing materials, and higher cost per part in mass productions, as compared to the conventional methods [21].
This paper numerically investigates the novel idea of incorporating mini-channel profiles into LTES components with dry air as the HTF. Three-dimensional simulations of transient phase change were performed using ANSYS Fluent 19.5. An enthalpy–porosity method is used in this commercial software for solid–liquid phase change simulations. In this method, the mushy zone at which the phase change is happening is dealt with as a porous structure, and the liquid flow in this zone is treated as a liquid flow through a porous structure [22,23].
Two types of mini-channels were studied. The first channel is an existing extruded aluminum profile and the second channel, with and without external fins, is a conceptual design capable of being manufactured via 3D printing. The mini-channels have relatively similar volumes but different internal hydraulic diameters ( d h channel 1 = 1.6 and d h channel 1   = 2.3) and aspect ratios ( AR channel 1   = 0.86 and AR channel 2   = 20). The compact LTESs are modeled three-dimensionally for a laminar air flow regime. The thermal performance of the LTES in charging/discharging with varying number of channels and ranging flow rates was analyzed and evaluated.

2. Materials and Methods

The numerical model to simulate melting and solidification processes of RT22 in an air–PCM heat exchanger using mini-channels is presented and described below.

2.1. Physical Model

Simulations of melting and solidification processes of RT22 as PCM were performed with two types of mini-channels. The air–PCM heat exchanger, as shown in Figure 1, is a cuboid of 0.15 × 0.15 × 0.1 m3 comprised of a duct shell and the mini-channels. The PCM is located in the shell, and air, as the HTF, flows through mini-channels. To reduce the computational effort of modeling the phase change process, a symmetric domain of one channel was simulated.
Two types of channels, with specified dimensions shown in Figure 2, were considered in the study. The mini-channel type one (channel-1) is an existing product of Hydro Aluminum, manufactured through an extrusion and studied for the first time in an LTES component. Channel-1 has hydraulic diameters of 1.63 mm and 1.59 mm for the middle and the side passages, respectively. The mini-channel type two (channel-2) is a conceptual design with the purpose of improving the thermal performance of channel-1. This channel could be potentially manufactured via metal 3D printing as a fast and quick production method for innovative prototypes, using AlSi10Mg alloy as the material, with and without external fins. Channel-2 has a slightly higher area-to-volume ratio ( A s   Vol   ) than channel-2, providing a higher heat transfer surface given a similar PCM packing factor. Channel-2 was proposed with a hydraulic diameter and aspect ratio higher than Channel 1 to achieve a potentially higher heat transfer coefficient of air and a lower pressure drop. It has a hydraulic diameter of 2.27 mm and an aspect ratio of 17.5. The geometrical characteristics of the channels with their material properties are summarized in Table 1.
In the cuboid, the mini-channels with varying quantities are oriented vertically. In the case of channel-1, due to limitations in the production procedures of the cuboid, including the restrictions associated with brazing and welding processes, the channels need to maintain a minimum distance of 5 mm. In the case of channel-2, due to the inherited characteristics of the 3D-printing method, this distance could be lowered down to 1–2 mm. Thus, the number of channels per the height of the cuboid was set to five and six for channel-1 and channel-2, respectively. In the case of externally finned channel-2, four fins with a length of 3 mm and thickness of 0.2 mm on each side of the channel-2 were considered, almost doubling the external surface area. The number of channels in width of the cuboid is varied from 12 to 20 with packing factor (PF), defined as a ratio of the PCM volume to the total volume of the cuboid, range of 77.4–86.8%. The details of simulated configurations and the corresponding PFs are summarized in Table 2.

2.2. PCM Thermos-Physical Properties

Material properties of the investigated PCM and RT22 are missing in the literature. RT22 is an organic commercial PCM provided by RUBITHERM undergoing the solid–liquid phase change around 22 °C. The thermo-physical properties, including density in the liquid phase, enthalpy and isobaric specific heat capacity, thermal conductivity and viscosity, were measured experimentally. The liquid density was measured using two pyknometers of 50 and 100 mL, enthalpy and specific heat via a μ DSC evo 7 from the Setaram instrument, thermal conductivity via a Hot Disk TPS-2500 and viscosity via a rotational Brookfield viscometer. The linear correlation of the measured stress with the strain rate in the liquid phase, obtained in the viscosity measurement procedure, shows that RT22 has a Newtonian behavior. The measured properties are shown in Figure 3 as functions of temperature and summarized in Table 3. The measurement methodology via the aforementioned instruments used to measure the thermo-physical properties of RT22 in this paper was explained in detail by Abdi et al. [24] for two other organic PCMs.

2.3. Simulation Model

Three-dimensional modeling of the transient phase change is essential to capture the effect of the axial HTF temperature variations since such an effect is missing in two-dimensional modeling. The transient phase change simulations were carried out in three dimensions for the domain specified in Figure 1, using ANSYS Fluent 19.5. In the modeling of dry air flow, the following conditions were considered:
  • Incompressible laminar air flow;
  • Constant air properties along the channel length;
  • Negligible effects of viscous dissipation.
In modeling solid–liquid phase change, the volume change was neglected and natural convection in the constrained melting was modeled via the Boussinesq approximation. The governing mechanism within the phase change is expressed in Equations (1)–(3):
. V = 0
ρ ( V t + ( . V ) V ) =   ρ g P + . ( τ ) + S
ρ ( H t + . ( VH ) ) = . ( k   T )
An enthalpy–porosity method is used to model the phase change, adding a source term to the momentum equation, defined by the Carmen–Kozeny term shown by Equation (4).
S = ( 1 λ ) 2 ( λ 3 + ε ) A mushy ( V )
Here, λ is the porosity factor ranging from zero to one and A mushy is the mushy parameter, which is an arbitrary number ranging from 105 to 108, representing the convective intensity of the flow within the mushy zone. The lower the mushy numbers, the stronger convective flow is predicted within the mushy zone. In this study, the mushy parameter was set to 108 for both the constrained melting and solidification simulations since it was previously shown to give an appropriate fit to experimental data [25,26,27]. The porosity is incorporated into the sensible and latent energy through Equations (5)–(7).
H = h +   λ L
h =   h ref + T ref T C p dT
Δ H = λ L { λ = 0 if   T < T solidus λ = T   T solidus T liquidus T solidus if   T solidus < T < T liquidus λ = 1 if   T > T liquidus
A simple algorithm was used in the coupling of pressure and velocity. The second-order upwind scheme for discretization of momentum and energy equations and the PRESTO! scheme for pressure correction were used. The first-order implicit scheme was employed with fixed time steps for time discretization. The convergence criterion for the continuity and momentum equations was set to 10−5 and 10−8, respectively.
A mesh independency study was carried out to select the element size for the final grids of air and PCM. In the beginning, the simulations were carried out for the hydrodynamic laminar air flow in a single channel, and the pressure drops along the channel length in different grids were compared. The element size ranged from 0.4 to 0.1 mm and 4 to 1 mm in the cross-sectional plane and along the channel length, respectively. Figure 4a shows the pressure drop along the length channel-2 for the cases 1–4 with the aforementioned ranging element size. As observed in Figure 4a, the simulated pressure drop values vary insignificantly from case 3 to case 4. The mesh independency analysis proceeded for the PCM domain with the element sizes specified in cases 3 and 4 for the air domain. For the PCM domain, the element sized varied in the cross-sectional plane and in length, and the effect on melt fraction was studied. As shown in Figure 4b, the simulated melt fraction changes slightly with refining the cross-sectional PCM mesh from 1 mm to 0.5 mm. Further reducing the cross-sectional element size in the PCM domain down to 0.3 mm showed an insignificant change in comparison to the element 0.5 mm. Figure 4c shows the influence of decreasing the element size from 3 to 1 mm in the axial direction for the PCM domain, making almost no influence on the melt fraction results. Furthermore, the variation in time-step displays its insignificant effect on the simulations, as shown in Figure 4d. In the end, considering the insignificant changes in the hydrodynamic air flow and melting simulations, the following element sizes were chosen. The final grid elements size, perpendicular to the air flow, were set to 0.4 mm, 0.15 mm and 0.1 mm for the PCM, aluminum and air zones, respectively, as shown in Figure 5, and the grid element size in the axial direction was set to 2 mm. The time step was fixed to 0.1 s in the simulations. In the used meshes, the minimum orthogonal mesh quality in the final grid and the maximum skewness factors were 0.5 and 0.8, respectively.
The simulations with the chosen grid based on the performed mesh independency analysis were performed for the specified configurations in Table 2 with inlet HTF temperature of 30 °C and 15 °C for melting and solidifications, respectively. The initial domain temperature was set to 15 °C and 30°C. The total flow rate of the HTF entering the cuboid was varied within a range of 7–24 L/s. The minimum flow rate, corresponding to a room of 20 m2, was chosen based on the Swedish regulation of maintaining a minimum flow rate of 0.35 L/m2·s in the ventilation systems of residential buildings. A parametric study of flow rate with fixed values of 7, 12, 16, 20 and 24 L/s was carried out. As the number of channels was varied, given a constant total air flow rate, the inlet velocity of air flow per channel was calculated and used as the inlet boundary conditions. With the simulated range of flow rate and the varying number of channels from 60 to 100 for channel-1 and 72 to 96 for channel-2, respectively, the Reynolds numbers were within ranges of 250–1440 and 430–1970. The total transient rate of heat transfer is calculated with Equation (8).
Q ˙ ( t ) = N ρ air V   air in A c   c p air abs [ T   air out ( t ) T air in ]
where N is the number of channels, ρ air V HTF in A c is the air mass flow rate per channel, c p air is the air specific heat and T   air out ( t ) T air in is the transient air temperature difference of the outlet and the inlet. The total UA value is calculated as a ratio of the total rate of transferred heat to the logarithmic mean temperature difference (LMTD) between the HTF and the PCM, using Equations (9) and (10).
UA = Q ˙ ( t ) LMTD   ( t )
LMTD   ( t ) = [ T air in T s / m ] [ T   air out ( t ) T s / m ] ln T air in T s / m T   air out ( t ) T s / m
The air heat transfer coefficient is calculated as the ratio of the total heat flux to the logarithmic mean temperature difference between the HTF temperature and the channel wall temperature at the inlet and outlet, as specified in Equations (11) and (12).
u air   ( t ) = Q ˙ ( t ) A air   LMTD air ( t )
LMTD air ( t ) = [ T air in T   w in ( t ) ] [ T   air out ( t ) ( T w out ( t ) ] ln T air in T   w in ( t ) T   air out ( t ) T   w out ( t )
Using the obtained air heat transfer coefficient, the heat transfer coefficient on the PCM side is calculated via Equation (13).
u PCM   ( t ) = 1 A PCM [ 1 UA ( t ) 1 A air u air ( t ) W thickness k w A air ] 1
The total transient power was presented versus relative accumulated extracted/absorbed energy. The relative accumulated energy is defined by Equation (14) as the ratio of accumulated extracted/absorbed energy at each time interval to the total accumulated extracted/absorbed energy.
Q relative ( t ) = initial t Q accumulated ( t ) initial final Q accumulated × 100
To combine the enhancement in the phase change power and the used fan power and evaluate the system performance, performance evaluation criterion (PEC) is defined via Equation (15) as the ratio of the mean phase change power to the product of total air flow and pressure drop.
PEC = Q ˙ mean N   V   air in A c   Δ P

3. Results and Discussion

The symmetrical simulated domains of channel-1 and un-finned channel-2, with the ranging number of channels of 60–100 and 72–96, respectively, have different dimensions in width and height. Thus, to have a fair performance assessment of the two channels, the evaluation is made for cases with possibly similar PCM packing factors (PF). The melt fraction contours for the configurations of channel-1 with PF = 82.4% and the bare and finned configurations of channel-2 with PF = 82% and PF = 80.2%, respectively, are shown in Figure 6 and Figure 7. A comparison of melting and solidification processes shows that in both processes, the growing phase change structure is rather symmetric. This indicates the weak presence of the natural convection in melting and the dominancy of conduction in both melting and solidification.
The phase change progress for the bare channels is more dominant on the sides of the mini-channels and weaker on the tips. The simulated domain for channel-1 is thinner in width and longer in height than that of channel-2. This results in a rapid phase change progress on the side walls of the former, while the phase change of the PCM around the tips of the channel takes a longer time. In the case of channel-2, a rapid phase change occurs around the tips, given the considerably smaller distance between the tips (3 mm). As the phase change completes around the tips, it progresses afterward on the side walls. In the case of finned channel-2, the fins contribute primarily to the phase change of PCM between the fins as it takes a longer time for the phase change of the PCM around the corners of the domain. The major mechanism at which the fins contribute to the phase change is conduction, given the small 5.3 mm distance between fins.
In all the cases, the phase change process evolves axially. As the phase change gets completed at the inlet of the channels, the phase change front develops in the length of the channels, showing a significant axial variation in the HTF temperature.
Figure 8 shows the transient outlet air temperature of the minimum and maximum simulated flow rates within the phase change time for the configurations of channel-1 (PF = 82.4%) and for the bare and finned configurations of channel-2 (PF = 82% and PF = 80.2%). As observed, the outlet temperature increases in melting and decreases in solidification steeply at the beginning of the phase change process due to the sensible heat transfer prior to the initiation of phase change along the channel length. As the PCM at the outlet reaches the onset temperature of the phase change and the entire PCM axially adjacent to the channel wall undergoes the phase change process, the outlet temperature varies less steeply, approaching the inlet temperature at the end of the process. The rather large temperature difference between the outlet and inlet for both melting (Tin = 30 °C) and solidification (Tin = 15 °C) indicates the significant axial HTF temperature variations. The axial air temperature change diminishes as the PCM approaches the complete phase change. This could be observed for both the lower and upper bounds of the investigated flow rate range; however, the temperature difference is significantly larger for the former. The outlet air temperature for channel-1 (PF = 82.4%) and the bare channel-2 (PF = 82%) is rather similar throughout the phase change processes, resulting in similar phase change times. The incorporation of fins results in a lower and higher outlet temperature in melting and solidification, respectively, as compared to the other configurations, and a modest reduction in the phase change time. In the finned configuration (PF = 80.2%), with the minimum total air flow rate of 7 L/s, the phase change time in melting and solidification, respectively, has decreased by 16% and 10%, as compared to the bare channel-2 configuration. On the contrary, the influence of increasing the air flow rate is rather considerable for all the shown cases. For a packing factor range of 86.8% to 77.4%, varying the air flow rate from 7 to 24 L/s reduces the melting and solidification time by 41% to 53% and 39% to 53%, respectively.
The effect of air flow rate increase on the transient power during phase change as a function of relative accumulated energy is shown in Figure 9. At the minimum air flow rate, the transient power is rather similar for the shown cases of channel-1 and channel-2, and the gain in the finned channel-2 is insignificant. Increasing the flow rate to the upper bound of 24 L/s increases the transient power considerably, indicating the resistance on the air side is not negligible. However, the enhancement effect of the increased air flow rate is accompanied by a significant increase in the pressure drop. A comparison of the channels at the maximum flow rate shows that the channel-1 case gives a slightly higher transient power up to about 70% of the relative stored/extracted energy, as compared to the channel-2 case. For the rest of the process, the channel-2 case has a higher power. The rapid reduction in the power of channel-1 at the end of the processes is attributed to the completion of the phase change adjacent to the side walls and the relatively weaker heat transfer around the tips of channel-1. In the case of channel-2, the phase change is ongoing adjacent to the side walls throughout the entire process. The finned channel-2 case shows a higher rate of heat transfer in both melting and solidification processes than the bare channel-2, despite having a lower mass of PCM with about 1.8% lower packing factor.
To be able to evaluate and compare the designs with a varying number of channels and packing factors, normalized mean power (represented by the mean UA-value) as an indicator of the thermal performance was used in the following. The mean UA-values are calculated based on 98% completion of the phase change. Figure 10 shows the dependency of UA values as a function of the PCM packing factor for the total range of the simulated air flow rate. The reduction in the packing factor indicates the increase in the number of channels as the vertical data points for a given packing factor designates the variation in the air flow rate. Figure 10 shows that as the PCM packing factor reduces, the mean UA value increases for all the simulated configurations in both melting and solidification processes.
For a constant air flow rate, the increase in the number of channels increases the mean power of phase change. As the number of channels is increased or fins are used (in the case of channel-2), the PCM packing factor reduces, resulting in a reduction in the latent storage capacity. Given a constant total flow rate of the HTF entering the cuboid, the increase in the number of channels reduces the flow rate per channel, resulting in a reduction in the heat transfer coefficient on the air side. However, the effect of the extended heat transfer surface as the number of channels increases is dominant over the reduction in the internal heat transfer coefficient, eventually increasing the total UA value and improving the thermal performance.
Increasing the flow rate improves the normalized mean power for all the cases, particularly for the enhanced case of finned channel-2. For instance, for the configurations of channel-1 with PF = 82.4%, channel-2 with PF = 82% and finned channel-2 with PF = 80.2%, increasing the total flow rate of the HTF from 7 L/s to 24 L/s increases the mean UA values of melting by 30%, 35% and 44%, respectively.
The interesting point is that adding fins to the cases of channel-2 instead of increasing the number of channels can result in higher mean UA values, attributed to the higher air flow per channel in the former case. As an example, given the flow rate range of 7–24 L/s, adding fins to the case with 72 channels (PF = 83%) increases the UA mean value of melting by 21–31%, as compared to the un-finned case with 72 channels (PF = 84.6%). Whereas increasing the number of un-finned channels from 72 (PF = 84.6%) to 84 (PF = 80.2%) enhances the mean UA value of melting by 13–24%. In total, the relative enhancements in the mean UA values of the finned channel-2 cases, as compared to the un-finned cases, lie within 15–31% for the entire range of simulated flow rates and packing factors.
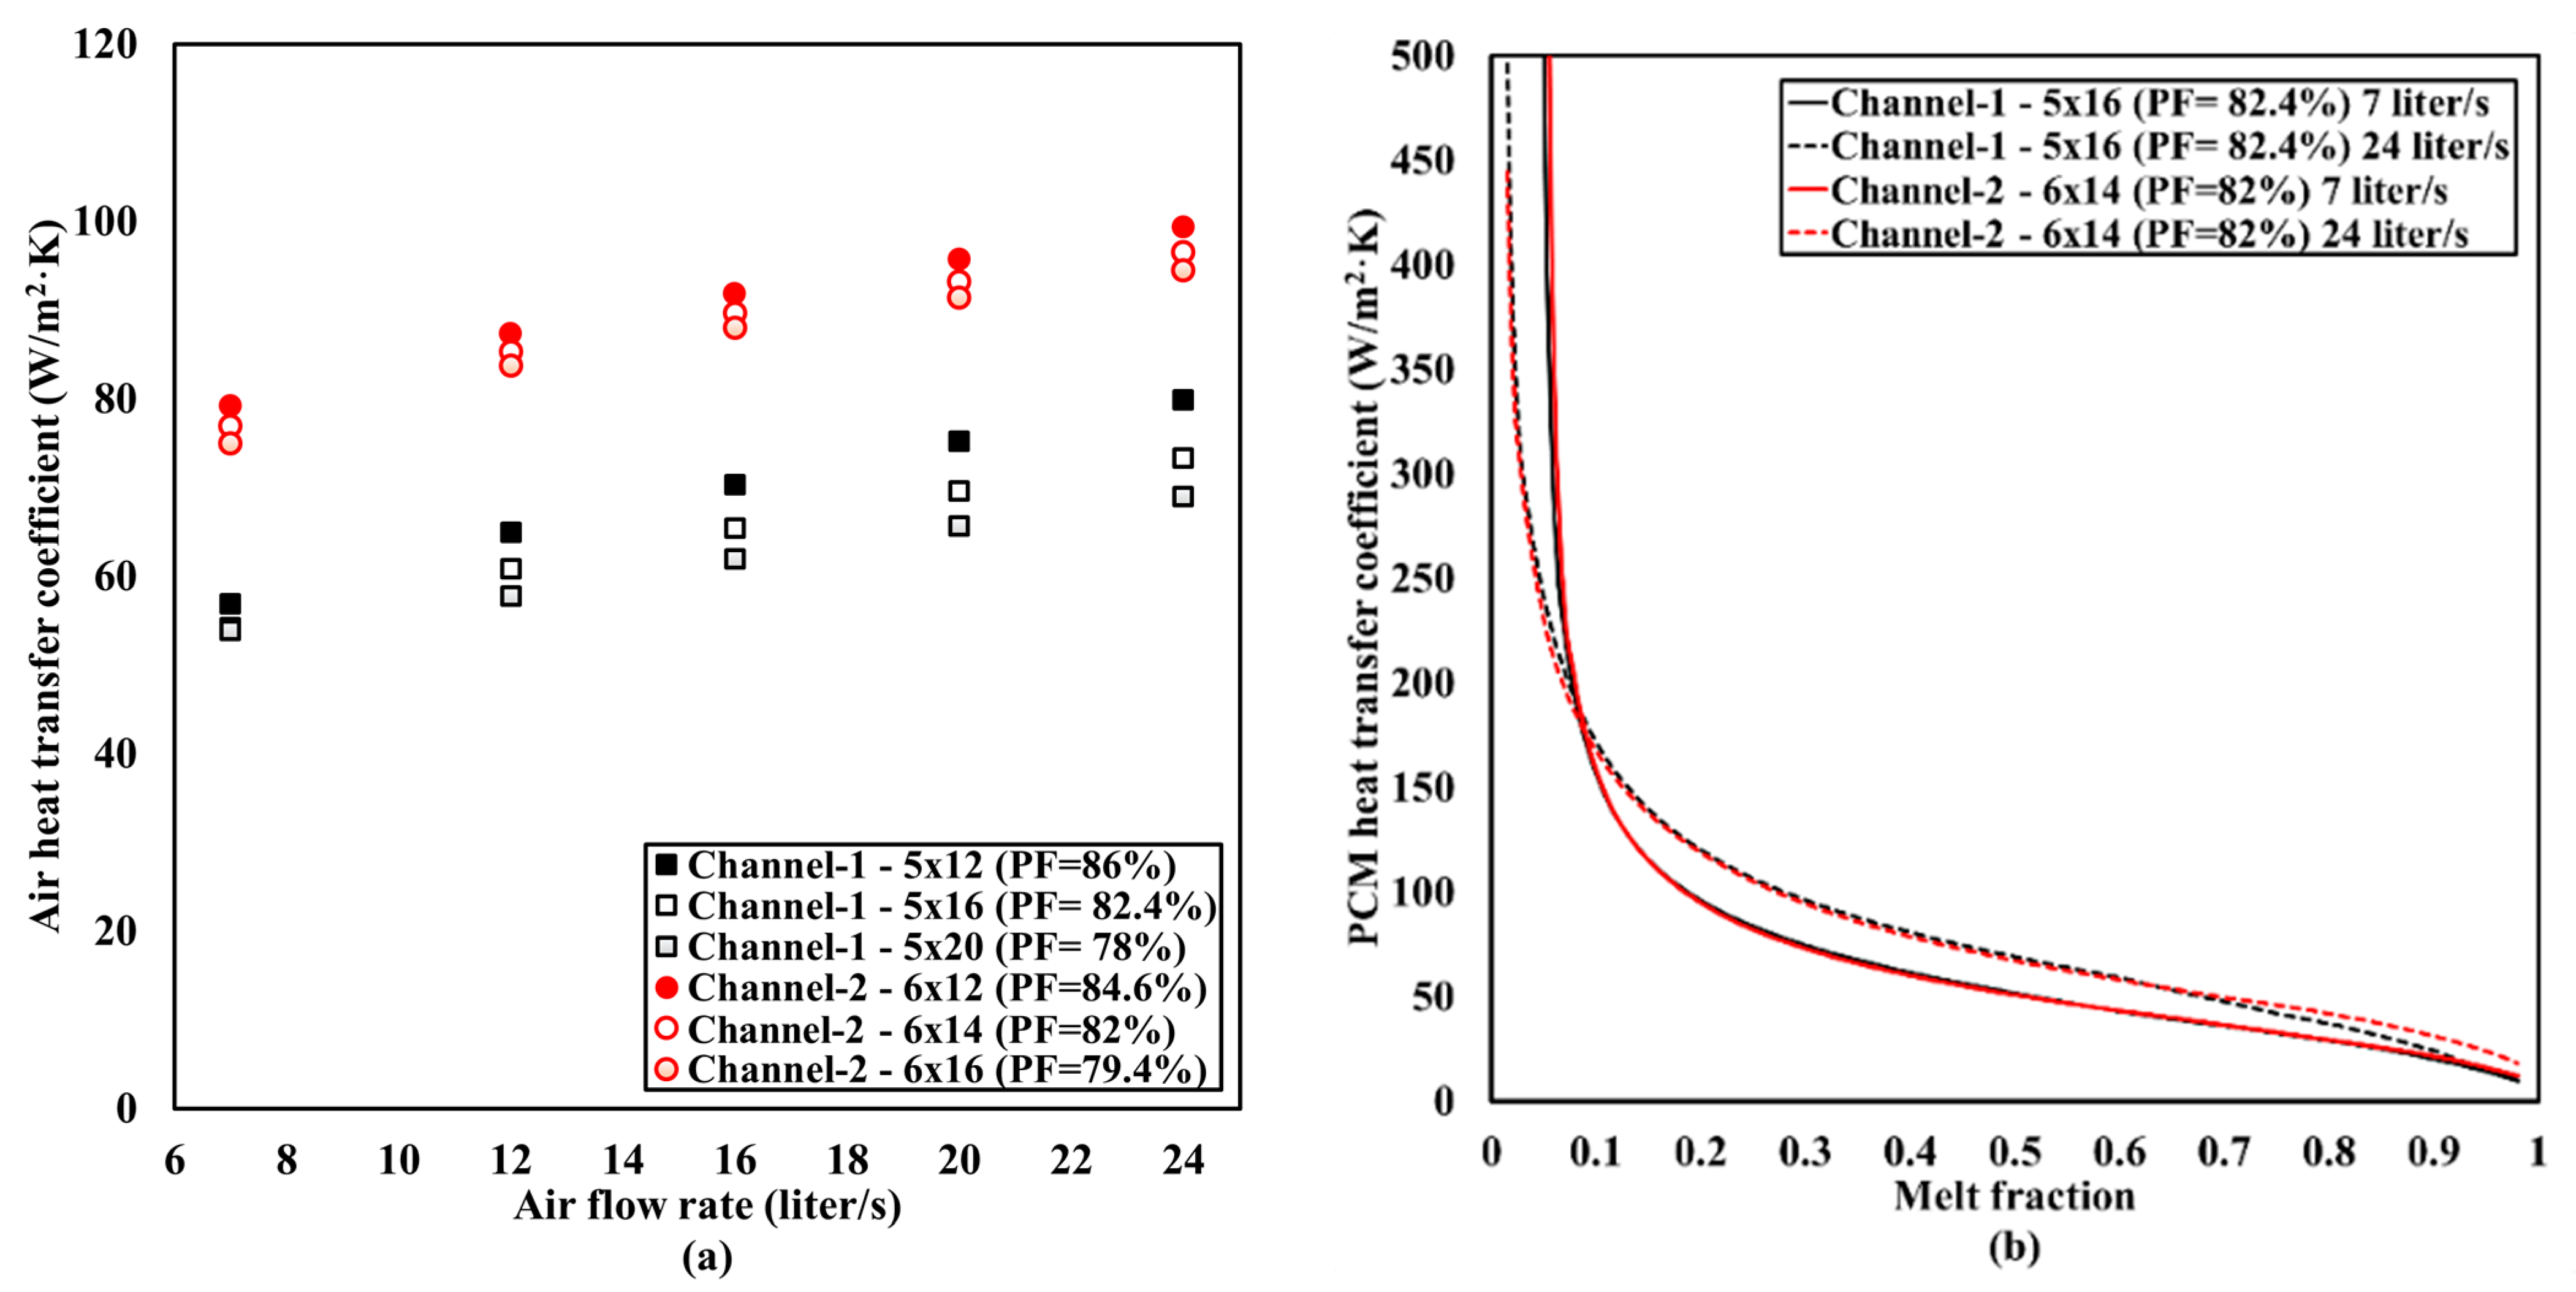
The difference in the air heat transfer coefficient of the two channels has an insignificant effect on their thermal performance within the phase change. Figure 11a shows the air heat transfer coefficients of channel-1 and bare channel-2 averaged over melting as functions of the total air flow rate. Channel-2 has a modestly higher heat transfer coefficient on the air side within the simulated air flow rate, despite its higher hydraulic diameter as compared to channel-1. This is due to the higher aspect ratio of the flow passage. Even though there is a considerable distinction in the air heat transfer coefficient between channel-1 and channel-2, as shown in Figure 11a, the heat transfer coefficient on the PCM side remains unaffected. Figure 11b shows the heat transfer coefficient on the PCM side for channel-1 and channel-2 cases with PF = 82.4% and PF = 82%, respectively, for flow rates of 7 and 24 L/s as functions of melt fraction in the melting process. The PCM heat transfer values drop quickly from the high values at the beginning of the process to levels below the heat transfer coefficients of air, shifting the thermal resistance from the air side to the PCM side.
As observed, the PCM heat transfer coefficients of channel-1 and channel-2 relatively overlap throughout the process. A clear distinction is seen from the lower bound of the air flow rate to the upper bound, implying the PCM heat transfer coefficient could be a function of the internal air flow rate.
The major disadvantage of extending the surface area and UA value through fin incorporation rather than increasing the number of channels is the higher flow rate per channel in the former, given a fixed total flow rate, unfavorably resulting in a higher pressure drop. Figure 12 shows the pressure drop for channel-1 and channel-2 configurations. As seen, with high packing factors and a lower number of channels, the air flow entering each channel increases. In the cases with high packing factors, as the total flow rate increases, the pressure drop increases significantly while the internal air heat transfer coefficient increases modestly. Increasing the number of channels reduces the pressure drop considerably, particularly at high total air flow rates. As an example, at the flow rate of 24 L/s, the pressure drop for channel-1 reduces by 31% and 47% as the number of channels increases from 60 to 80 and 100, and for channel-2 it reduces by 17% and 30% as the number of channels increases from 72 to 84 and 96, respectively. Interesting to point out is the relatively lower pressure drop of channel-2 than channel-1. This is credited mainly to the higher hydraulic diameter of channel-2.
Having a low pressure drop and, consequently, a low fan power as possible is a crucial matter in employing mini-channels in LTES components. This contributes to achieving a higher gain in terms of charging/discharging thermal energy in exchange for fan power. The performance evaluation criterion (PEC) of the compact component defined as the ratio of the mean phase change power to the fan work (Equation (15)) is shown in Figure 13 for the simulated configurations as a function of the total air flow rate. Considering the increase in the total air flow rate, the PEC for both melting and solidification reduces dramatically, indicating a more significant increase in the pressure drop compared to the modest gain in the mean phase change power. The same trend is observed as the number of channels reduces and the packing factor increases. Given a constant total flow rate, channel-2 is superior to channel-1 due to both the relatively higher mean phase change power and the considerably lower pressure drop. In addition, in the case of finned channel-2, fins were able to increase the PEC modestly. Since the pressure drops in the finned channel-2 cases are the same as the un-finned channel-2 cases, the gain in the PEC comes from the modest increase in the mean phase change power.

4. Conclusions

This incorporation of rectangular mini-channels with internal air passages into an LTES component was studied, considering two types of configurations. Three-dimensional phase change simulations of RT22 in a cuboid of 0.15 × 0.15 × 0.1 m3, with vertically oriented channels, were carried out. The channels have different hydraulic diameters and aspect ratios of the internal flow passages while having almost similar volume and external heat transfer surfaces. In channel-2, fins were also investigated to enhance thermal performance.
The simulation results show that the thermal performance of the system is enhanced as the number of channels increases in both the channel-1 and channel-2 cases. The mean UA value increases as the number of channels increases and the PCM packing factor decreases. The enhancement is majorly attributed to the increase in the external surface area with a higher number of channels, while the air flow rate per channel decreases given a constant total air flow rate entering the cuboid.
Increasing the flow rate improves the mean UA value in both melting and solidification. For instance, for channel-1 with PF = 82.4%, channel-2 with PF = 82% and finned channel-2 with PF = 80.2%, the mean UA value of melting increases by 30%, 35% and 44% as the total flow rate of the HTF increases from 7 L/s to 24 L/s, respectively.
The comparison of channel-1 and channel-2 with similar packing factors shows that the difference in the air heat transfer coefficient has an insignificant effect on the mean phase change powers and the mean UA values. For instance, the air heat transfer coefficients of channel-2 with PF = 82.0% are about 30–40% higher than those of channel-1 with PF = 82.4%, for the simulated total flow rate of 7–24 L/s. However, the enhancement in the mean UA values of the former lies within 1–5%, as compared to the latter, credited to its minor higher external surface area. Adding fins to the channel-2 cases, doubling the heat transfer area on the PCM side, can increase the mean UA values by 15–31% for the entire ranges of simulated flow rates and packing factors.
Another benefit with channel-2 is the considerably lower pressure drop as compared to channel-1. This is due to its higher hydraulic diameter, particularly with high total flow rates and high packing factors. Given a constant flow rate, the channel-2 configurations have higher PEC than the channel-1 configurations, achieving a higher gain in stored/extracted thermal energy in exchange for the used fan power.
The results show that the mini-channels could be optimized to have a higher performance in heat transfer with a lower pressure drop. The metal 3D printing method, as an alternative method in manufacturing conceptual designs, could be used in implementing innovative features. This includes optimization of the hydraulic diameter and the aspect ratio of the HTF passages, maximizing the area-to-volume ratio of the channels and manufacturing innovative fin configurations to enhance the heat transfer on the PCM side. Finally, optimization, manufacturing and experimental testing of the mini-channels under laboratory conditions could be the next steps paving the commercialization of such products and their usage on a large scale.

Author Contributions

Conceptualization, A.A.; methodology, A.A.; software, A.A.; investigation, A.A.; data curation, A.A.; writing—original draft preparation, A.A.; writing—review and editing, J.N.C. and V.M.; visualization, A.A.; supervision, J.N.C. and V.M.; project administration, V.M.; funding acquisition, V.M. All authors have read and agreed to the published version of the manuscript.

Funding

This work was supported and funded by the Swedish Energy Agency (P48283-1).

Institutional Review Board Statement

Not applicable.

Informed Consent Statement

Informed consent was obtained from all subjects involved in the study.

Data Availability Statement

The data presented in this study are available on request from the corresponding author.

Acknowledgments

Authors would like to thank Hydro aluminum for providing the aluminum profiles. The computations were enabled by resources provided by the Swedish National Infrastructure for Computing (SNIC) at the PDC Center for High Performance Computing, KTH Royal Institute of Technology, partially funded by the Swedish Research Council through grant agreement no. 2016-07213.

Conflicts of Interest

The authors declare no conflict of interest.

Nomenclature

Accross sectional area ( mm 2 )
Asheat transfer surface area ( mm 2 )
Amushymushy parameter
ARaspect ratio
cpspecific heat ( kJ kg · K )
dhhydraulic diameter (mm)
ggravity ( m s 2 )
kthermal conductivity ( W m · K )
hsensible enthalpy ( kJ kg )
Htotal enthalpy ( kJ kg )
Llatent heat of phase change ( kJ kg )
Nnumber of channels
Q ˙ power (W)
Qenergy ( kJ )
Ppressure (Pa)
ReReynolds number [ ρ Vd h μ ]
Ssource term
ttime (s)
Ttemperature ( )
UAtotal heat transfer unit ( W K )
Uheat transfer coefficient ( W m 2 · K )
Vvelocity ( m s )
Volvolume (m3)

Abbreviations

HTFheat transfer fluid
LMTDlogarithmic mean temperature difference
LTESlatent thermal energy storage
PCMphase change material
PECperformance evaluation criterion

Subscripts

avgaverage
ininlet
mmelting
outoutlet
ssolid
wwall

Greek Letters

α Thermal diffusivity ( K ρ c p )
β expansion coefficient ( 1 K )
Difference
ε small number
λ porosity factor
μ viscosity ( Pa · s )
ρ density ( kg m 3 )

References

  1. Iten, M.; Liu, S.; Shukla, A. A review on the air-PCM-TES application for free cooling and heating in the buildings. Renew. Sustain. Energy Rev. 2016, 61, 175–186. [Google Scholar] [CrossRef]
  2. Khan, Z.; Khan, Z.; Ghafoor, A. A review of performance enhancement of PCM based latent heat storage system within the context of materials, thermal stability and compatibility. Energy Convers. Manag. 2016, 115, 132–158. [Google Scholar] [CrossRef]
  3. Zalba, B.; Marı́n, J.M.; Cabeza, L.F.; Mehling, H. Review on thermal energy storage with phase change: Materials, heat transfer analysis and applications. Appl. Therm Eng. 2003, 23, 251–283. [Google Scholar] [CrossRef]
  4. Xu, T.; Chiu, J.N.; Palm, B.; Sawalha, S. Experimental investigation on cylindrically macro-encapsulated latent heat storage for space heating applications. Energy Convers. Manag. 2019, 182, 166–177. [Google Scholar] [CrossRef]
  5. Wang, X.; Liu, J.; Zhang, Y.; Di, H.; Jiang, Y. Experimental research on a kind of novel high temperature phase change storage heater. Energy Convers. Manag. 2006, 47, 2211–2222. [Google Scholar] [CrossRef]
  6. Dolado, P.; Lazaro, A.; Marin, J.M.; Zalba, B. Characterization of melting and solidification in a real scale PCM-air heat exchanger: Numerical model and experimental validation. Energy Convers. Manag. 2011, 52, 1890–1907. [Google Scholar] [CrossRef]
  7. Vakilaltojjar, S.M.; Saman, W. Analysis and modelling of a phase change storage system for air conditioning applications. Appl. Therm. Eng. 2001, 21, 249–263. [Google Scholar] [CrossRef]
  8. Marin, J.M.; Zalba, B.; Cabeza, L.F.; Mehling, H. Improvement of a thermal energy storage using plates with paraffin–graphite composite. Int. J. Heat Mass Transf. 2005, 48, 2561–2570. [Google Scholar] [CrossRef]
  9. Zalba, B.; Marı́n, J.M.; Cabeza, L.F.; Mehling, H. Free-cooling of buildings with phase change materials. Int. J. Refrig. 2004, 27, 839–849. [Google Scholar] [CrossRef]
  10. Herbinger, F.; Bhouri, M.; Groulx, D. Investigation of heat transfer inside a PCM-air heat exchanger: A numerical parametric study. Heat Mass Transf. 2018, 54, 2433–2442. [Google Scholar] [CrossRef]
  11. Kandlikar, S.; Garimella, S.; Li, D.; Colin, S.; King, M.R. Heat Transfer and Fluid Flow in Minichannels and Microchannels; Elsevier: Amsterdam, The Netherlands, 2005. [Google Scholar]
  12. Lee, P.-S.; Garimella, S.V. Saturated flow boiling heat transfer and pressure drop in silicon microchannel arrays. Int. J. Heat Mass Transf. 2008, 51, 789–806. [Google Scholar] [CrossRef] [Green Version]
  13. Jagirdar, M.; Lee, P.S. Quasi-steady and transient study of heat transfer during sub-cooled flow boiling in a small aspect ratio microchannel. Int. J. Multiph. Flow 2020, 133, 103446. [Google Scholar] [CrossRef]
  14. Zeng, S.; Kanargi, B.; Lee, P.S. Experimental and numerical investigation of a mini channel forced air heat sink designed by topology optimization. Int. J. Heat Mass Transf. 2018, 121, 663–679. [Google Scholar] [CrossRef]
  15. Wibulswas, P. Laminar-Flow Heat-Transfer in non-Circular Ducts. Doctoral Dissertation, University College London, London, UK, 1966. [Google Scholar]
  16. Kaew-On, J.; Sakamatapan, K.; Wongwises, S. Flow boiling heat transfer of R134a in the multiport minichannel heat exchangers. Exp. Therm. Fluid Sci. 2011, 35, 364–374. [Google Scholar] [CrossRef]
  17. Robles, A.; Duong, V.; Martin, A.J.; Guadarrama, J.L.; Diaz, G. Aluminum minichannel solar water heater performance under year-round weather conditions. Sol. Energy 2014, 110, 356–364. [Google Scholar] [CrossRef]
  18. Tang, D.; Fang, W.; Fan, X.; Li, D.; Peng, Y. Effect of die design in microchannel tube extrusion. Procedia Eng. 2014, 81, 628–633. [Google Scholar] [CrossRef] [Green Version]
  19. Duong, V.T. Minichannel-Tube Solar Thermal Collectors for Low to Medium Temperature Applications. Ph. D. Thesis, University of California Merced, Merced, CA, USA, 2015. [Google Scholar]
  20. Rastan, H. Investigation of the Heat Transfer of Enhanced Additively Manufactured Minichannel Heat Exchangers. M.Sc. Thesis, KTH Royal Institute of Technology, Stockholm, Sweden, 2019. [Google Scholar]
  21. Rastan, H.; Abdi, A.; Hamawandi, B.; Ignatowicz, M.; Meyer, J.P.; Palm, B. Heat transfer study of enhanced additively manufactured minichannel heat exchangers. Int. J. Heat Mass Transf. 2020, 161, 120271. [Google Scholar] [CrossRef]
  22. Voller, V.R.; Prakash, C. A fixed grid numerical modelling methodology for convection-diffusion mushy region phase-change problems. Int. J. Heat Mass Transf. 1987, 30, 1709–1719. [Google Scholar] [CrossRef]
  23. Voller, V.R.; Brent, A.D.; Prakash, C. The modelling of heat, mass and solute transport in solidification systems. Int. J. Heat Mass Transf. 1989, 32, 1719–1731. [Google Scholar] [CrossRef]
  24. Abdi, A.; Ignatowicz, M.; Gunasekara, S.N.; Chiu, J.N.W.; Martin, V. Experimental investigation of thermo-physical properties of n-octadecane and n-eicosane. Int. J. Heat Mass Transf. 2020, 161, 120285. [Google Scholar] [CrossRef]
  25. Shmueli, H.; Ziskind, G.; Letan, R. Melting in a vertical cylindrical tube: Numerical investigation and comparison with experiments. Int. J. Heat Mass Transf. 2010, 53, 4082–4091. [Google Scholar] [CrossRef]
  26. Assis, E.; Ziskind, G.; Letan, R. Numerical and Experimental Study of Solidification in a Spherical Shell. J. Heat Transf. 2009, 131, 024502. [Google Scholar] [CrossRef]
  27. Assis, E.; Katsman, L.; Ziskind, G.; Letan, R. Numerical and experimental study of melting in a spherical shell. Int. J. Heat Mass Transf. 2007, 50, 1790–1804. [Google Scholar] [CrossRef]
Figure 1. The physical model and the simulation domain.
Applsci 11 05985 g001
Figure 2. Dimensions of the simulated configurations: (a) channel-1, (b) channel-2 and (c) channel-2 finned.
Applsci 11 05985 g002
Figure 3. Temperature-dependent thermo-physical properties of RT22: (a) liquid density, (b) heat flows upon melting/solidification, (c) thermal conductivity and (d) dynamic viscosity.
Applsci 11 05985 g003
Figure 4. Mesh independency analysis: (a) element size variation for pressure drop simulations of air flow in a single channel-2 and Vair = 5 m/s, (b) element size variation in cross-sectional plane for melt fraction simulations of channel-1 (5 × 16, PF = 82.4%, Vair = 10.1 m/s), (c) element size variation in length for melt fraction simulations of channel-1 (5 × 16, PF = 82.4%, Vair = 10.1 m/s) and (d) time-step variation for melt fraction simulations of channel-1 (5 × 16, PF = 82.4%, Vair = 10.1 m/s).
Applsci 11 05985 g004
Figure 5. Examples of meshed simulation domains for channel-1 (5 × 16, PF = 82.4%) and channel-2 (6 × 14, PF = 82%).
Applsci 11 05985 g005
Figure 6. Melt fraction contours within melting for the configurations of channel-1 (PF = 82.4%), channel-2 (PF = 82%) and channel-2-finned (PF = 80.2%).
Applsci 11 05985 g006
Figure 7. Melt fraction contours within solidification for the configurations of channel-1 (PF = 82.4%), channel-2 (PF = 82%) and channel-2-finned (PF = 80.2%).
Applsci 11 05985 g007
Figure 8. Transient outlet air temperature of flow rates of 7 and 24 L/s: (a) melting-Tin = 30 °C, (b) solidification-Tin = 15 °C.
Applsci 11 05985 g008
Figure 9. Transient power as a function of relative accumulated energy flow rates of 7 and 24 L/s: (a) melting-Tin = 30 °C, (b) solidification-Tin = 15 °C.
Applsci 11 05985 g009
Figure 10. Mean UA values for the range of the simulated flow rate as functions of the PCM packing factor: (a) melting-Tin = 30 °C, (b) solidification-Tin = 15 °C.
Applsci 11 05985 g010
Figure 11. (a) mean air heat transfer coefficient during melting, (b) transient heat transfer coefficient on the PCM side during melting.
Applsci 11 05985 g011
Figure 12. Pressure drop as a function of total air flow rate.
Applsci 11 05985 g012
Figure 13. PEC of the compact component as a function of total air flow rate: (a) melting—Tin = 30 °C, (b) solidification—Tin = 15 °C.
Applsci 11 05985 g013
Table 1. Geometrical characteristics and material properties of the channels.
Channel-1
(Extrusion-Al3003)
Channel-2
(DMLS-AlSi10Mg)
Area   to   volume   ratio   [ A s   Vol   ( m 2 m 3 ) ] 943987
Hydraulic diameter [dh (mm)]1.632.27
Density ( kg m 3 )27302620
Specific heat capacity ( kJ kg · K )892846
Thermal conductivity ( W m · K )162111
Table 2. Investigated configurations.
Number of ChannelsPF (%)
Channel-15 × 1286.8
5 × 1682.4
5 × 2078
Channel-26 × 1284.6
6 × 1482
6 × 1679.4
Channel-2-finned6 × 1283
6 × 1480.2
6 × 1677.4
Table 3. Measured thermo-physical properties of RT22.
Density ( k g m 3 )778 (20 °C)
Specific heat capacity ( kJ kg · K )4.6 (15 °C)–2.4 (30 °C)
Latent heat of phase change ( kJ kg )163.8
ΔTm (°C)
ΔTf (°C)
20.4–23.7
20.1–22.8
Thermal conductivity ( W m · K )0.14 (15, 30 °C)
Viscosity (Pa·s)0.00407 (25 °C)
Thermal expansion coefficient ( 1 K )0.00084
Publisher’s Note: MDPI stays neutral with regard to jurisdictional claims in published maps and institutional affiliations.

