
Radon over Kimberlite Pipes: Estimation of the Emanation Properties of Rocks (Lomonosov Diamond Deposit, NW Russia)


Abstract
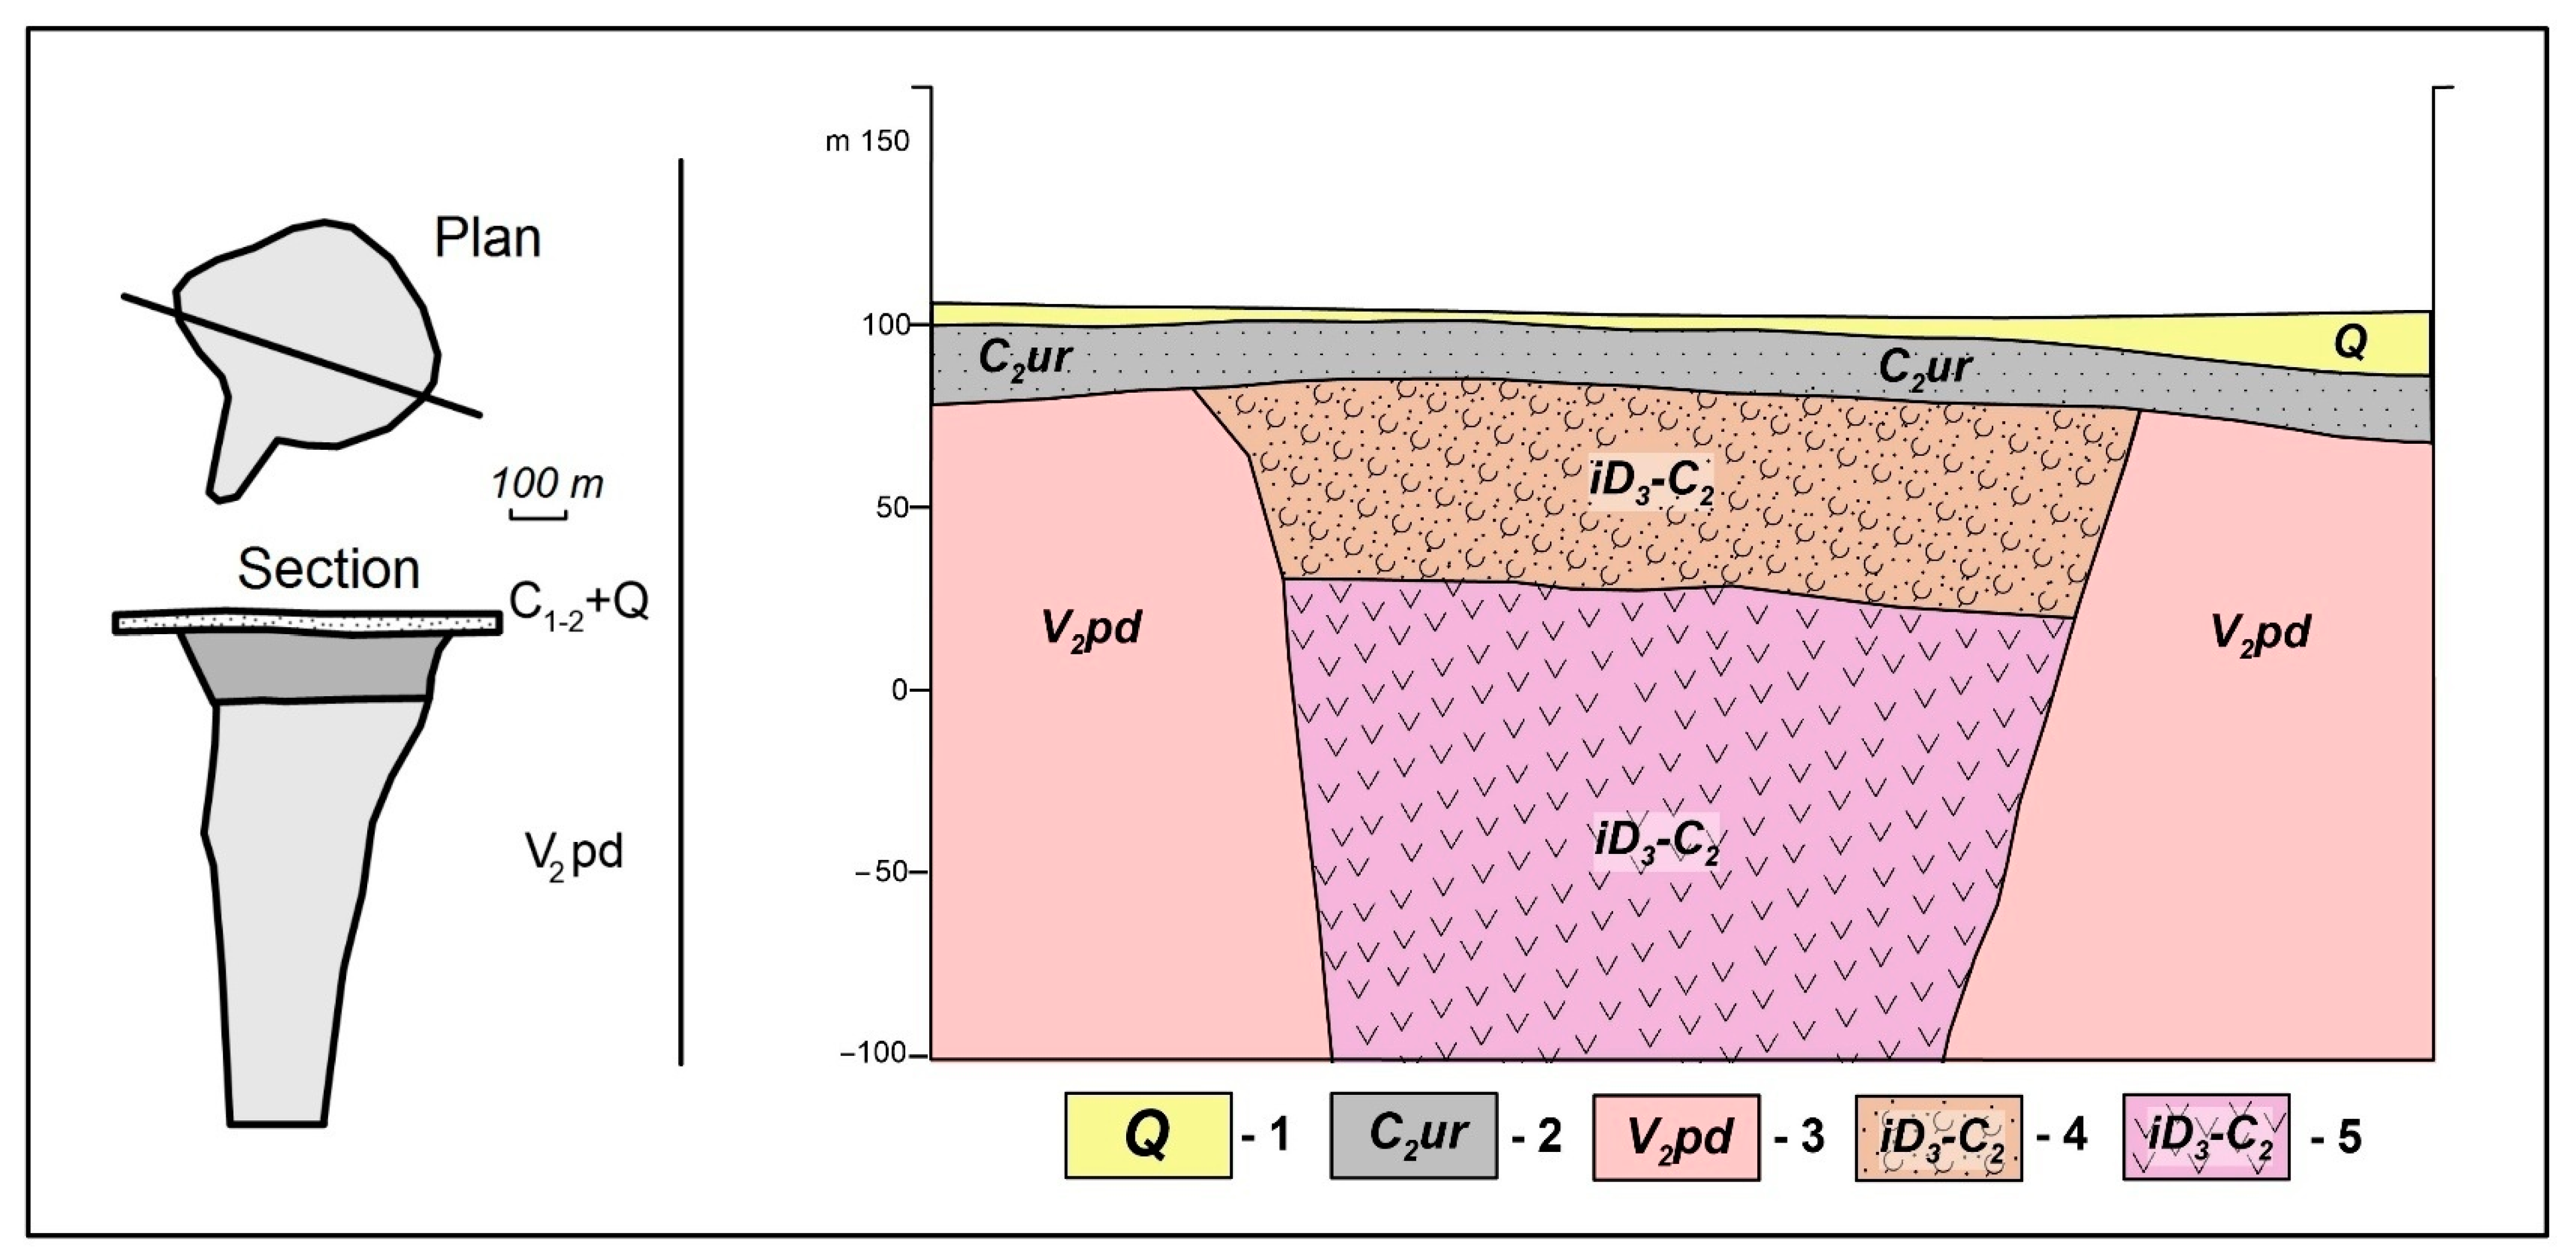
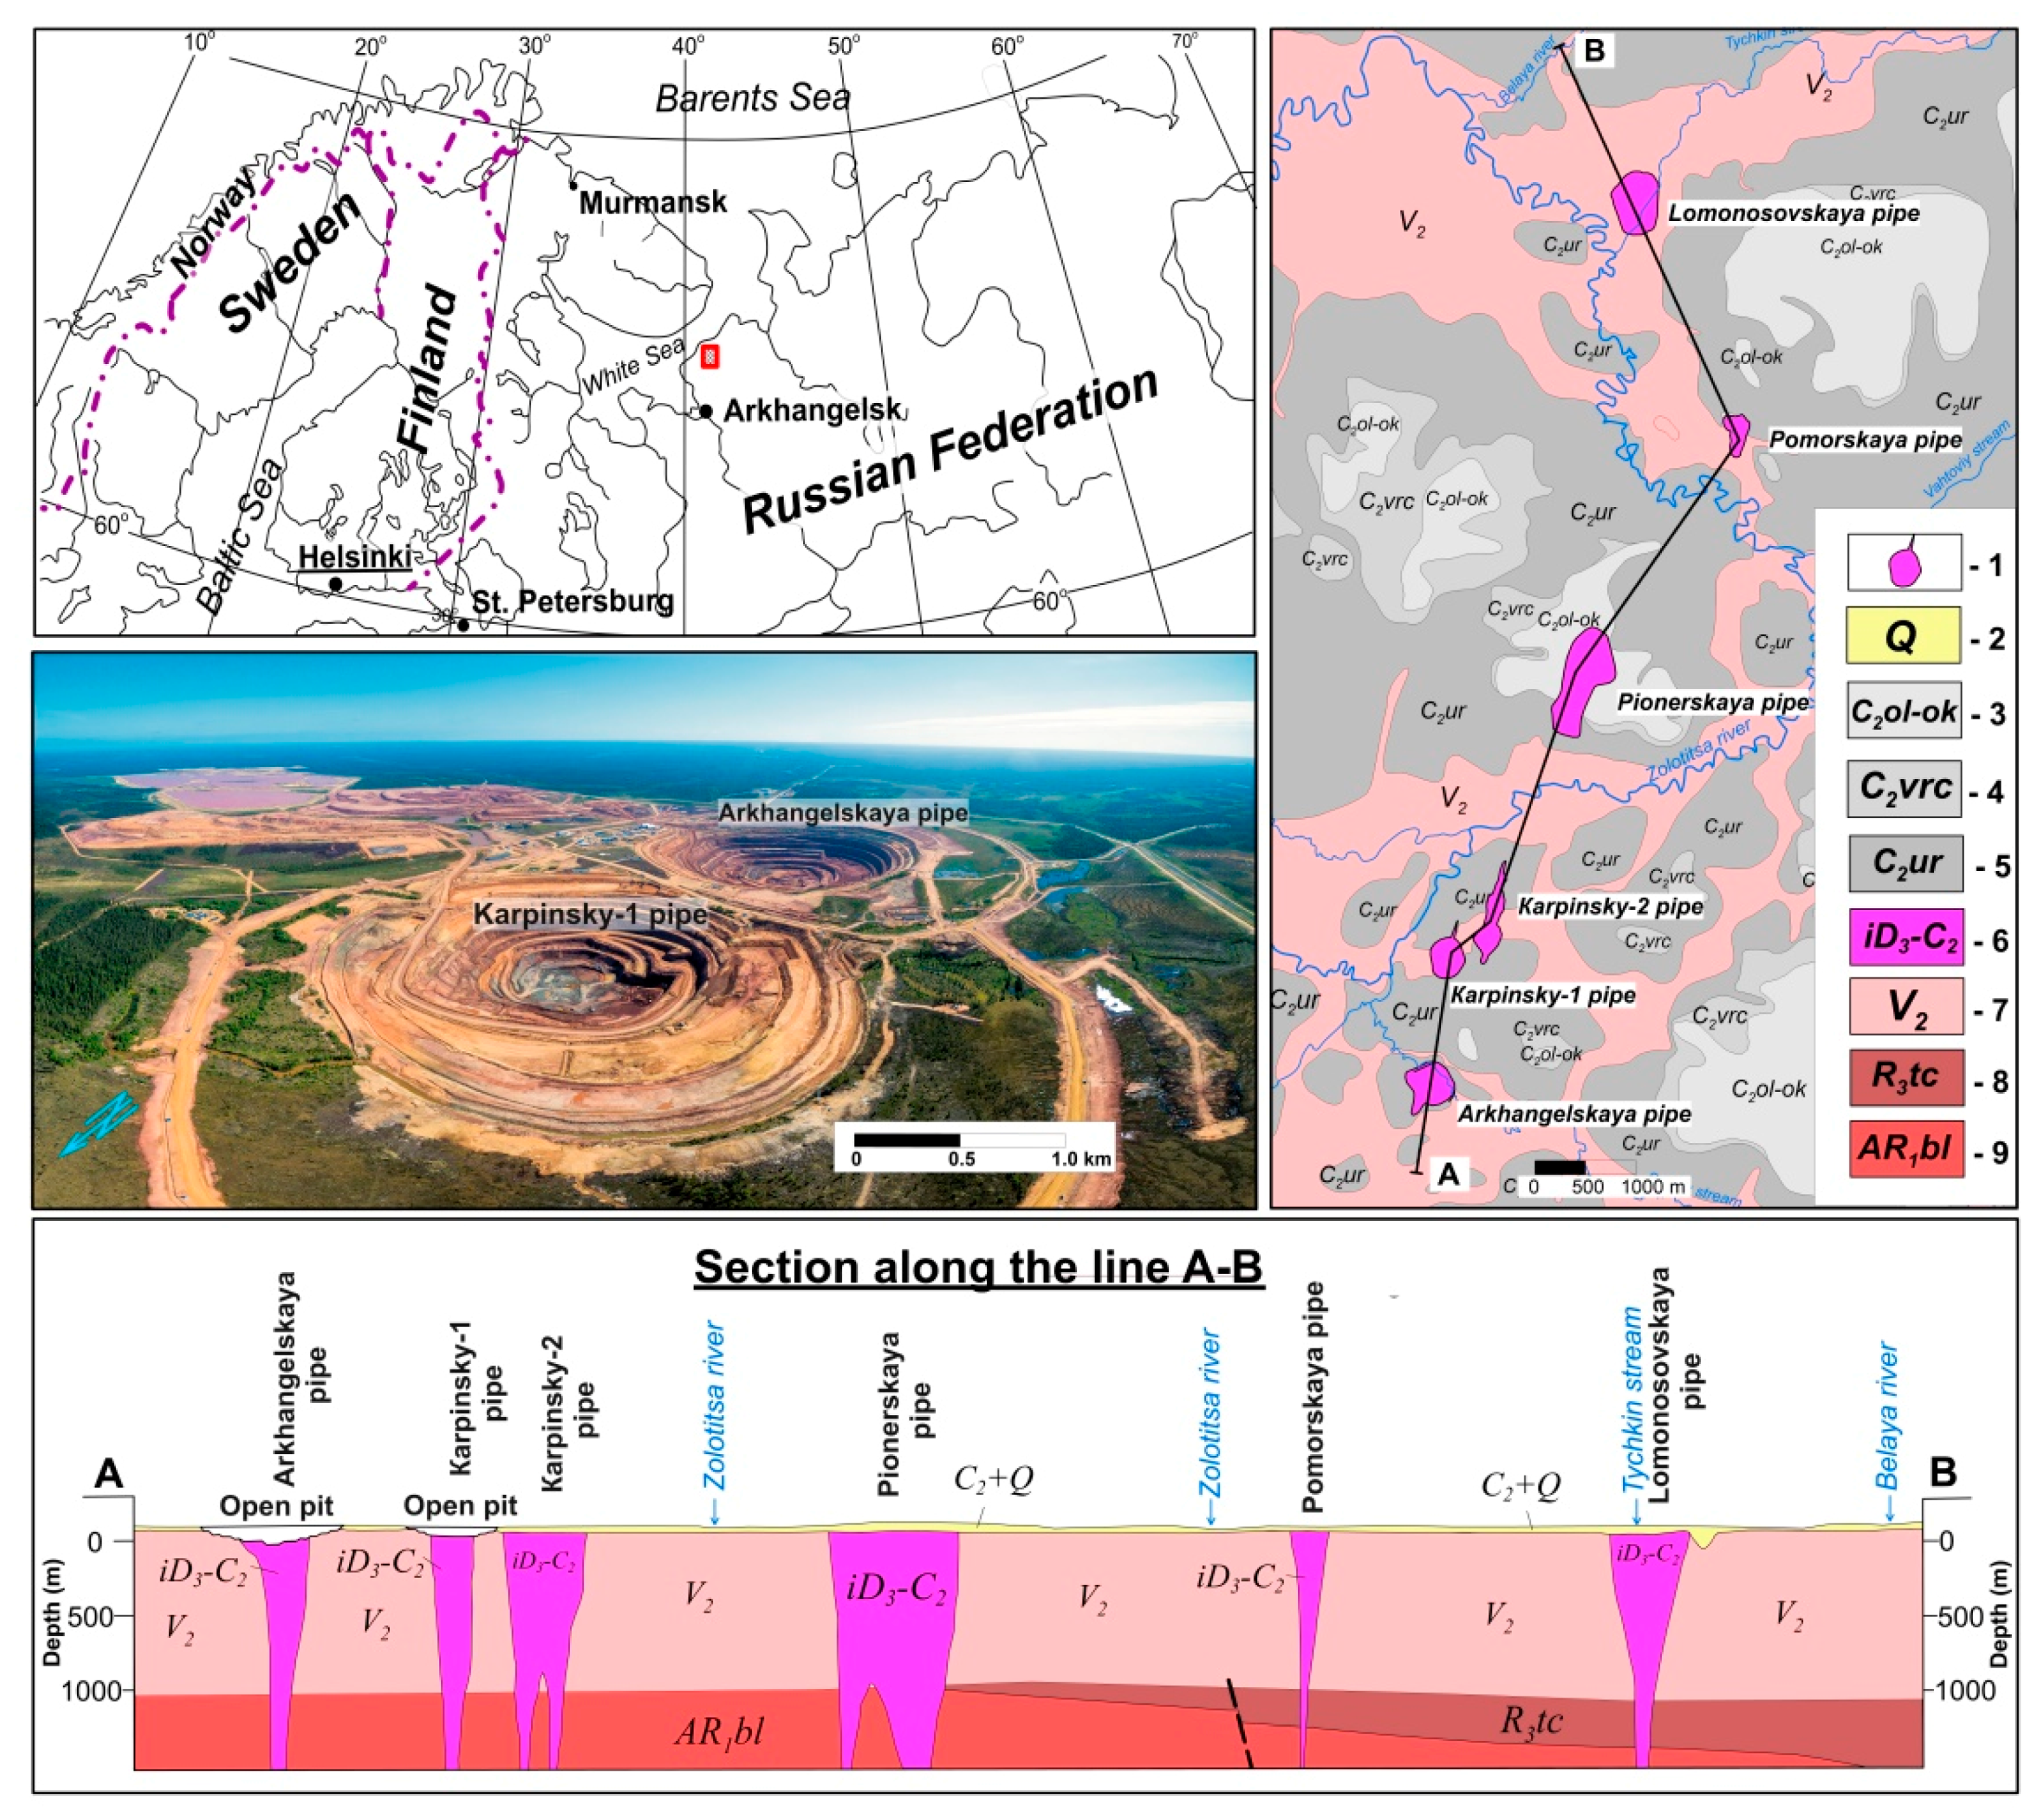
:1. Introduction
2. Material and Methods
2.1. Gamma Spectrometry Measurements
2.2. Radiometric (Emanation) Measurement Method
2.3. Calculation Methods for Assessing the Coefficient of Emanation
2.4. Calculation of Radon Production Rate
2.5. Assessment of Radon Leakage
2.6. Assessment of Density and Porosity Parameters
2.6.1. Assessment of Average (Bulk) Density
2.6.2. Assessment of True Density
Test Preparation
Testing
2.6.3. Porosity Assessment
3. Results and Discussion
3.1. Estimation of the Parameter of Radon Leakage from a Counting Sample
3.2. Results of Measurements of Radiation and Physical Parameters
3.3. Statistical Analysis
4. Conclusions
Author Contributions
Funding
Institutional Review Board Statement
Informed Consent Statement
Data Availability Statement
Acknowledgments
Conflicts of Interest
Appendix A

| Sample ID | Radiation Parameters | Physical Parameters | |||||||
|---|---|---|---|---|---|---|---|---|---|
| Radium-226 Activity (Unsealed Sample), Bq·kg−1 | Radium-226 Activity (Sealed Sample), Bq·kg−1 | Radium-226 Activity (after Opening the Sample), Bq·kg−1 | Emanation Coefficient, % | Volumetric Activity of Radon in the Container, Bq·m−3 | Radon Production Rate *, Bq·m−3·h−1 | Average Density **, g·cm−3 | True Density **, g·cm−3 | Porosity ***, % | |
| Overlying Rocks | |||||||||
| 7CA_13 | 16.43 ± 3.94 | 20.44 ± 4.91 | 18.83 ± 5.08 | 13.75 ± 5.46 | 658 ± 197 | 38.88 | 1.83 | 2.38 | 23.11 |
| GGS-2-10_1_2 | 22.33 ± 4.69 | 26.40 ± 4.22 | 23.17 ± 4.40 | 13.83 ± 3.78 | 1116 ± 335 | 54.64 | 1.98 | 2.94 | 32.65 |
| GGS_2_10_20_5 | 16.12 ± 3.71 | 18.01 ± 3.06 | 17.57 ± 4.57 | 23.47 ± 8.02 | 1120 ± 336 | 59.12 | 1.85 | 2.39 | 22.59 |
| GGS_2_10_30_0 | 12.21 ± 3.42 | 15.88 ± 4.13 | 11.64 ± 3.38 | 24.91 ± 10.67 | 834 ± 250 | 58.32 | 1.95 | 2.50 | 22.00 |
| GGS_2_10_54_1 | 26.59 ± 4.52 | 30.21 ± 4.53 | 27.13 ± 3.53 | 11.09 ± 2.42 | 1637 ± 491 | 51.41 | 2.03 | 2.49 | 18.47 |
| Enclosing Rocks of the Near-Pipe Space | |||||||||
| 16CA_13 | 37.37 ± 5.98 | 39.34 ± 5.51 | 36.44 ± 5.10 | 6.19 ± 1.35 | 755 ± 227 | 37.19 | 2.02 | 2.12 | 4.72 |
| 18CA_13 | 20.05 ± 4.21 | 22.68 ± 4.08 | 19.53 ± 5.08 | 12.74 ± 4.43 | 802 ± 241 | 42.38 | 1.94 | 2.38 | 18.49 |
| CA_5_16 | 11.01 ± 3.19 | 16.05 ± 3.85 | 11.74 ± 3.29 | 29.13 ± 11.82 | 1235 ± 371 | 51.96 | 1.47 | 2.49 | 40.96 |
| CA_13_16 | 22.44 ± 4.94 | 29.67 ± 6.23 | 23.42 ± 5.15 | 22.72 ± 7.60 | 1822 ± 547 | 97.85 | 1.92 | 2.66 | 27.82 |
| CA_14_16 | 25.90 ± 5.96 | 30.73 ± 4.30 | 27.82 ± 6.40 | 12.60 ± 3.73 | 1105 ± 332 | 57.37 | 1.96 | 2.38 | 17.65 |
| CA_21_16 | 56.01 ± 8.96 | 59.84 ± 7.78 | 55.69 ± 6.13 | 6.67 ± 1.25 | 1059 ± 318 | 57.33 | 1.90 | 2.62 | 27.48 |
| CA_6_16 | 35.79 ± 6.80 | 40.69 ± 6.10 | 36.55 ± 5.85 | 11.11 ± 2.68 | 1186 ± 356 | 59.12 | 1.73 | 2.06 | 16.02 |
| CA_7_16 | 21.90 ± 4.16 | 26.84 ± 5.64 | 23.51 ± 4.70 | 15.41 ± 4.92 | 1241 ± 372 | 68.48 | 2.19 | 2.55 | 14.12 |
| CA_8_16 | 25.35 ± 5.83 | 30.82 ± 4.93 | 24.30 ± 5.10 | 19.45 ± 5.65 | 1624 ± 487 | 87.46 | 1.93 | 2.59 | 25.48 |
| CA_19_16 | 28.33 ± 6.80 | 31.46 ± 5.66 | 27.75 ± 5.27 | 10.87 ± 3.13 | 906 ± 272 | 50.67 | 1.96 | 2.70 | 27.41 |
| 24CA_13 | 32.01 ± 6.08 | 35.55 ± 5.33 | 32.60 ± 4.24 | 9.13 ± 1.99 | 1008 ± 302 | 45.64 | 1.86 | 2.12 | 12.26 |
| 40CA_13 | 32.44 ± 5.84 | 40.71 ± 6.11 | 30.30 ± 3.94 | 22.94 ± 5.01 | 2367 ± 710 | 132.03 | 1.87 | 2.69 | 30.48 |
| 11CA_13 | 58.40 ± 9.93 | 63.32 ± 7.60 | 59.9 ± 6.59 | 6.59 ± 1.18 | 1109 ± 333 | 64.99 | 2.06 | 2.23 | 7.62 |
| 12CA_13 | 23.37 ± 4.91 | 26.66 ± 5.60 | 23.45 ± 4.92 | 12.19 ± 3.98 | 962 ± 289 | 44.96 | 1.83 | 2.38 | 23.11 |
| 21CA_13 | 34.41 ± 6.19 | 38.47 ± 5.39 | 33.74 ± 4.72 | 11.42 ± 2.49 | 1283 ± 385 | 60.78 | 1.83 | 2.38 | 23.11 |
| Tuffaceous Sedimentary Rocks of the Peripheral Parts of the Crater | |||||||||
| 30CA_13 | 17.85 ± 4.28 | 27.34 ± 5.19 | 18.17 ± 5.09 | 34.13 ± 12.70 | 2561 ± 768 | 95.94 | 1.36 | 2.15 | 36.74 |
| 31CA_13 | 19.52 ± 5.08 | 21.61 ± 3.89 | 18.92 ± 5.49 | 11.06 ± 4.15 | 792 ± 238 | 33.97 | 1.88 | 2.23 | 15.70 |
| CA_10_16 | 8.94 ± 3.40 | 11.45 ± 2.98 | 8.20 ± 3.53 | 25.15 ± 13.90 | 872 ± 262 | 41.36 | 1.90 | 2.54 | 25.20 |
| CA_12_16 | 23.13 ± 4.86 | 35.25 ± 5.29 | 25.13 ± 5.28 | 31.55 ± 8.96 | 3146 ± 944 | 139.57 | 1.66 | 2.35 | 29.36 |
| 33CA_13 | 44.08 ± 7.93 | 48.40 ± 6.78 | 43.21 ± 5.19 | 9.82 ± 1.99 | 1288 ± 386 | 66.11 | 1.84 | 2.12 | 13.21 |
| Vent Facies Kimberlites | |||||||||
| CA_16_16 | 11.93 ± 3.10 | 13.14 ± 3.42 | 12.21 ± 3.54 | 8.14 ± 3.49 | 135 ± 41 | 15.93 | 1.97 | 2.02 | 2.48 |
| CA_17_16 | 10.84 ± 3.04 | 12.42 ± 3.48 | 11.35 ± 3.52 | 10.67 ± 4.90 | 102 ± 31 | 17.43 | 1.74 | 1.83 | 4.92 |
| 2009_477 | 14.11 ± 3.81 | 15.89 ± 4.13 | 15.27 ± 3.82 | 7.55 ± 3.00 | 212 ± 64 | 18.96 | 2.09 | 2.16 | 3.24 |
| 2013_262 | 13.64 ± 3.41 | 15.03 ± 4.06 | 14.14 ± 4.10 | 7.58 ± 3.30 | 98 ± 29 | 18.60 | 2.16 | 2.17 | 0.46 |
| 37CA_13 | 31.17 ± 4.99 | 31.46 ± 4.40 | 30.64 ± 4.29 | 1.76 ± 0.38 | 56 ± 17 | 9.84 | 2.35 | 2.37 | 0.84 |
Appendix B
Appendix C. Typical Types of the Studied Rocks from the Lomonosov Diamond Deposit


References
- Sabbarese, C.; Ambrosino, F.; D’Onofrio, A.; Pugliese, M.; La Verde, G.; D’Avino, V.; Roca, V. The first radon potential map of the Campania region (southern Italy). Appl. Geochem. 2021, 126. [Google Scholar] [CrossRef]
- Giustini, F.; Ciotoli, G.; Rinaldini, A.; Ruggiero, L.; Voltaggio, M. Mapping the geogenic radon potential and radon risk by using Empirical Bayesian Kriging regression: A case study from a volcanic area of central Italy. Sci. Total Environ. 2019, 661. [Google Scholar] [CrossRef]
- Miklyaev, P.; Petrova, T. Studies of emanation of clay rocks by radon. Geoecology. Eng. Geol. Hydrogeol. Geocryol. 2010, 1, 13–22. [Google Scholar]
- Baskaran, M. Radon: A Tracer for Geological, Geophysical and Geochemical Studies; Springer: Berlin/Heidelberg, Germany, 2016; p. 260. [Google Scholar] [CrossRef]
- Daraktchieva, Z.; Wasikiewicz, J.M.; Howarth, C.B.; Miller, C.A. Study of baseline radon levels in the context of a shale gas development. Sci. Total Environ. 2021, 753. [Google Scholar] [CrossRef] [PubMed]
- Loisy, C.; Cerepi, A. 222Rn as a tracer of water-air dynamics in the unsaturated zone of a geological carbonate formation: Example of an underground quarry (Oligocene Aquitain limestone, France). Chem. Geol. 2012, 296–297. [Google Scholar] [CrossRef]
- Kuo, T.; Tsunomori, F. Estimation of fracture porosity using radon as a tracer. J. Pet. Sci. Eng. 2014, 122. [Google Scholar] [CrossRef]
- Selvam, S.; Muthukumar, P.; Sajeev, S.; Venkatramanan, S.; Chung, S.Y.; Brindha, K.; Babu, D.S.S.; Murugan, R. Quantification of submarine groundwater discharge (SGD) using radon, radium tracers and nutrient inputs in Punnakayal, south coast of India. Geosci. Front. 2021, 12. [Google Scholar] [CrossRef]
- Sahoo, S.K.; Katlamudi, M.; Barman, C.; Lakshmi, G.U. Identification of earthquake precursors in soil 222Rn data of Kutch, Gujarat, India using empirical mode decomposition based Hilbert Huang Transform. J. Environ. Radioact. 2020, 222. [Google Scholar] [CrossRef]
- Kawabata, K.; Sato, T.; Takahashi, H.A.; Tsunomori, F.; Hosono, T.; Takahashi, M.; Kitamura, Y. Changes in groundwater radon concentrations caused by the 2016 Kumamoto earthquake. J. Hydrol. 2020, 584. [Google Scholar] [CrossRef]
- Moreno, V.; Bach, J.; Zarroca, M.; Font, L.; Roqué, C.; Linares, R. Characterization of radon levels in soil and groundwater in the North Maladeta Fault area (Central Pyrenees) and their effects on indoor radon concentration in a thermal spa. J. Environ. Radioact. 2018, 189. [Google Scholar] [CrossRef]
- Tsapalov, A.; Kovler, K.; Miklyaev, P. Open charcoal chamber method for mass measurements of radon exhalation rate from soil surface. J. Environ. Radioact. 2016, 160. [Google Scholar] [CrossRef]
- Yang, Y.; Li, Y.; Guan, Z.; Chen, Z.; Zhang, L.; Lv, C.J.; Sun, F. Correlations between the radon concentrations in soil gas and the activity of the Anninghe and the Zemuhe faults in Sichuan, southwestern of China. Appl. Geochem. 2018, 89. [Google Scholar] [CrossRef]
- Domingos, F.; Pereira, A. Implications of alteration processes on radon emanation, radon production rate and W-Sn exploration in the Panasqueira ore district. Sci. Total Environ. 2018, 622–623, 825–840. [Google Scholar] [CrossRef] [PubMed]
- Pinto, P.V.; Sudeep Kumara, K.; Karunakara, N. Mass exhalation rates, emanation coefficients and enrichment pattern of radon, thoron in various grain size fractions of monazite rich beach placers. Radiat. Meas. 2020, 130. [Google Scholar] [CrossRef]
- McDowall, G.; Koketso, H. Radon emanometry over some kimberlites and lamproites in Southern and Western Botswana. In Proceedings of the 53rd EAEG Meeting; European Association of Geoscientists & Engineers; European Association of Geoscientists & Engineers: Houten, The Netherlands, 1991. [Google Scholar] [CrossRef]
- Bobrov, A. Reflections of some features of the fault zones of the Olkhon and southern Angara regions in radon emanations. Tectonophys. Top. Issues Earth Sci. 2009, 2, 5–9. [Google Scholar]
- Magomedova, A.; Udoratin, V. Volumetric activity of radon in pipes of explosion and magnetic anomalies of the Middle Timan. Bull. IG Komi Sci. Cent. Ural Branch RAS 1991, 10, 28–34. [Google Scholar]
- Kiselev, G.P.; Yakovlev, E.Y.; Druzhinin, S.V.; Zykov, S.B.; Bykov, V.M.; Ocheretenko, A.A. Uranium even isotopes in kimberlites, enclosing and overburden rocks of the Zolotitskoye ore field (Arkhangelsk diamondiferous province). Russ. J. Earth Sci. 2018, 18. [Google Scholar] [CrossRef] [Green Version]
- Kiselev, G.P.; Danilov, K.B.; Yakovlev, E.U.; Druzhinin, S.V. Radiometric and seismic study of Chidvinskaya kimberlite pipe (Arkhangelsk diamondiferous province, North of the East European Craton, Russia). Geofísica Int. 2017, 2, 147–155. [Google Scholar]
- Zaripov, N.R. Clarification of the Red-Colored Rocks of the Zimneberezhny Diamondiferous Region of the Arkhangelsk Province and the Nakynsky Diamondiferous Field of the Yakut Province, Its Connection with the Kimberlite Control Structures. Ph.D. Thesis, Sergo Ordzhonikidze Russian State University for Geological Prospecting, Moscow, Russia, 2017. [Google Scholar]
- Yakovlev, E.Y. Features of radioactive element distribution within the Arkhangelsk diamondiferous province: Possible directions for development of isotope–radiogeochemical methods for kimberlite prospecting in complex landscape–geology and climate conditions of the subarctic zone. Geochem. Explor. Environ. Anal. 2020, 20, 269–279. [Google Scholar] [CrossRef]
- Syam, N.S.; Lim, S.; Lee, H.Y.; Lee, S.H. Determination of radon leakage from sample container for gamma spectrometry measurement of 226Ra. J. Environ. Radioact. 2020, 220–221. [Google Scholar] [CrossRef]
- IAEA. IAEA Annual Report for 2013; International Atomic Energy Agency: Vienna, Austria, 2013. [Google Scholar]
- Mauring, A.; Gäfvert, T. Radon tightness of different sample sealing methods for gamma spectrometric measurements of 226Ra. Appl. Radiat. Isot. 2013, 81. [Google Scholar] [CrossRef]
- Tsapalov, A.; Miklyaev, P.; Petrova, T. The principle of detecting areas with active geodynamics based on the analysis of the 210Pb/226Ra activity ratio in soil samples. ANRI 2013, 1, 9–11. [Google Scholar]
- Afonin, A.; Korchunov, A. Optimizing block parameters measurements for monitoring radon, thoron and their daughter products in various environments. ANRI 2013, 1, 9–11. [Google Scholar]
- International Atomic Energy Agency. Measurement and Calculation of Radon Releases from NORM Residues, Technical Reports Series; International Atomic Energy Agency: Vienna, Austria, 2013; Volume 474. [Google Scholar]
- Pereira, A.; Lamas, R.; Miranda, M.; Domingos, F.; Neves, L.; Ferreira, N.; Costa, L. Estimation of the radon production rate in granite rocks and evaluation of the implications for geogenic radon potential maps: A case study in Central Portugal. J. Environ. Radioact. 2017, 166. [Google Scholar] [CrossRef]
- Phong Thu, H.N.; Van Thang, N.; Hao, L.C. The effects of some soil characteristics on radon emanation and diffusion. J. Environ. Radioact. 2020, 216. [Google Scholar] [CrossRef]
- Soniya, S.R.; Abraham, S.; Khandaker, M.U.; Jojo, P.J. Investigation of diffusive transport of radon through bricks. Radiat. Phys. Chem. 2021, 178. [Google Scholar] [CrossRef]
- Zinchuk, N.; Zinchuk, M. Petrophysical properties of kimberlites and host rocks in prospective territories of the East European platform. Collect. Sci. Work. UkrDGRI 2014, 1, 97–108. [Google Scholar]
- Burmistrov, A.; Garanin, K.; Starostin, V.; Yuzhakov, L. Comparative analysis of the petrophysical parameters of the porphyry kimberlites of the V. Grib pipes (Arkhangelsk region) and Aikhal (Yakutia). Geol. Diam. Present Futur. 2005, 8, 762–772. [Google Scholar]
- Burmistrov, A.; Boguslavskiy, M. Petrophysical properties of kimberlites of the Komsomolskaya pipe and their relationship with the peculiarities of its material composition, formation conditions and diamond content. Moscow Univ. Bull. Geol. 2009, 4, 215–224. [Google Scholar]
- Arbuzov, S.I.; Rihvanov, L.P. Geochemistry of Radioactive Elements; Tomsk Polytechnic University Publishing House: Tomsk, Russia, 2009; p. 300. [Google Scholar]
- Ignatov, P.A.; Novikov, K.V.; Bushkov, K.Y. Reconstruction of faults kinematics in closed areas according to the analysis of micro-faults in the core. Geol. Explor. 2011, 3, 55–60. [Google Scholar]
- Gunin, A.P.; Ignatov, P.A.; Zaripov, N.R.; Novikov, K.V. Signs of exocontacts of kimberlites in the south of the Zolotitsky diamondiferous field of the Arkhangelsk province. New Ideas Earth Sci. 2013, 1, 310–311. [Google Scholar]
- Ignatov, P.A.; Gunin, A.P.; Zaripov, N.R. Connection of Manifestations of Alkaline-Ultrabasic Magmatism with the Structures of the Central Type of the East of the Zimneberezhny Area of the Arkhangelsk Region; Sergo Ordzhonikidze Russian State University for Geological Prospecting: Moscow, Russia, 2013; p. 370. [Google Scholar]
- Ignatov, P.A. Paleohydrogeological Conditions of Formation of Ore Deposits; Sergo Ordzhonikidze Russian State University for Geological Prospecting: Moscow, Russia, 2014; p. 265. [Google Scholar]
- Zaripov, N.R. Clarification (Gleaning) of Red-Colored Vendian-Cambrian Rocks and Its Relationship with Alkaline-Ultrabasic Magmatism of the Arkhangelsk Region; Sergo Ordzhonikidze Russian State University for Geological Prospecting: Moscow, Russia, 2014; p. 170. [Google Scholar]
- Ignatov, P.A.; Zaripov, N.R.; Kim, V.; Gunin, A.P. Types of clarified red-colored kimberlitic host Vendian-Cambrian rocks of the Zimneberezhny district of the Arkhangelsk region. Geol. Explor. 2015, 2, 15–21. [Google Scholar]
- Ignatov, P.A.; Bolonin, A.V.; Vasilyev, I.D.; Shmonov, A.M.; Fomin, A.A.; Kim, V. Folded and discontinuous deformations in the host and overlapping strata in the Arkhangelsk kimberlite pipe. Ores Met. 2012, 1, 42–48. [Google Scholar]
- Ignatov, P.A.; Bolonin, A.V.; Kalmykov, B.A. Paleotectonic structures of the Zimneberezhny diamondiferous area of the Arkhangelsk Region. Bull. MOIP 2008, 3, 13–20. [Google Scholar]
- Ignatov, P.A.; Bolonin, A.V.; Vasilyev, I.D.; Fomin, A.A.; Kim, V. Contacts of the Arkhangelsk kimberlite pipe and deformations of enclosing and overlapping rocks. Geol. Explor. 2009, 5, 28–34. [Google Scholar]
- Novikov, K.V.; Ignatov, P.A. Organization of Databases for Twodimensional Analysis of Fluid Fracturing, Tectonic and Mineralization Features of Kimberlite-Containing Structures; Sergo Ordzhonikidze Russian State University for Geological Prospecting: Moscow, Russia, 2009. [Google Scholar]
- Vasilyev, I.D. Geological Structures in the Near-Pipe Zone of the Arkhangelskaya Pipe and Their Use to Find Diamond Deposits in the Zimneberezhny Area. Ph.D. Thesis, Sergo Ordzhonikidze Russian State University for Geological Prospecting, Moscow, Russia, 2010. [Google Scholar]
- Vasiliev, I.D.; Ignatov, P.A.; Bolonin, A.V.; Shmonov, A.M. Comparison of Sections and Petrochemical Data on the Kimberlitic Strata of the Lomonosov Diamond Deposit; Sergo Ordzhonikidze Russian State University for Geological Prospecting: Moscow, Russia, 2010; p. 195. [Google Scholar]
- Khazanovich-Wulff, K.K. Diatreme Plumes of Astroblem or “Bolide Model” of the Formation of Kimberlite Pipes; Publishing House (Printing House) Moscow State University: Moscow, Russia, 2007; p. 290. [Google Scholar]
- Nikitin, B.M. Deformation of host rocks during formation of kimberlite pipes. Petrology 1980, 11, 41–49. [Google Scholar]
- Milashev, V.A. Pipes; Nedra: Leningrad, Russia, 1984; p. 268. [Google Scholar]
- Malykh, A.V. The Main Features of the Structure of Near-Pipe Space of Tuff Iron Ore and Kimberlite Pipes of the Siberian Platform; Ural State University Publishing House: Ural, Russia, 1989; p. 315. [Google Scholar]
- Kiselev, G.P.; Yakovlev, E.Y.; Druzhinin, S.V. Experimental-Methodical and Research Work on the Predictive-Search Assessment of Lomonosov Deposit Areas That Are Promising for the Search for Kimberlite Pipes Using Radiometric Methods; Bulatov Publishing House, Northern Arctic Federal University: Arkhangelsk, Russia, 2016; p. 138. [Google Scholar]
- Eakin, M.; Brownlee, S.J.; Baskaran, M.; Barbero, L. Mechanisms of radon loss from zircon: Microstructural controls on emanation and diffusion. Geochim. Cosmochim. Acta 2016, 184, 212–226. [Google Scholar] [CrossRef]


| ID Sample | Rock Type | Geological Age | |
|---|---|---|---|
| Overlying Rocks | |||
| 1 | 7CA_13 | Moraine sand and gravel | Q |
| 2 | GGS-2-10_1_2 | Sandstone | C2 |
| 3 | GGS _2_10_20_5 | Sandstone | C2 |
| 4 | GGS _2_10_30_0 | Sandstone | C2 |
| 5 | GGS _2_10_54_1 | Sandstone, siltstone | C2 |
| Enclosing Rocks of the Near-Pipe Space | |||
| 6 | 16CA_13 | Siltstone | V2 |
| 7 | 18CA_13 | Siltstone | V2 |
| 8 | CA_5_16 | Sandstone | V2 |
| 9 | CA_13_16 | Sandstone | V2 |
| 10 | CA_14_16 | Sandstone | V2 |
| 11 | CA_21_16 | Sandstone | V2 |
| 12 | CA_6_16 | Sandstone | V2 |
| 13 | CA_7_16 | Sandstone | V2 |
| 14 | CA_8_16 | Sandstone | V2 |
| 15 | CA_19_16 | Sandstone | V2 |
| 16 | 24CA_13 | Sandstone | V2 |
| 17 | 40CA_13 | Sandstone | V2 |
| 18 | 11CA_13 | Siltstone | V2 |
| 19 | 12CA_13 | Siltstone | V2 |
| 20 | 21CA_13 | Siltstone | V2 |
| Tuffaceous Sedimentary Rocks of the Peripheral Parts of the Crater | |||
| 21 | 30CA_13 | Tuffite | iD3-C2 |
| 22 | 31CA_13 | Tuffite | iD3-C2 |
| 23 | CA_10_16 | Tuffite | iD3-C2 |
| 24 | CA_12_16 | Tuffite | iD3-C2 |
| 25 | 33CA_13 | Tuff | iD3-C2 |
| Vent Facies Kimberlites | |||
| 26 | CA_16_16 | Autolithic breccia | iD3-C2 |
| 27 | CA_17_16 | Autolithic breccia | iD3-C2 |
| 28 | 2009_477 | Autolithic breccia | iD3-C2 |
| 29 | 2013_262 | Autolithic breccia | iD3-C2 |
| 30 | 37CA_13 | Autolithic breccia | iD3-C2 |
| Radiation and Physical Characteristics | ||||||||||
|---|---|---|---|---|---|---|---|---|---|---|
| ARa226 | Kemanation | AVdens | TRdens | Porosity | ||||||
| Range | Mean | Range | Mean | Range | Mean | Range | Mean | Range | Mean | |
| Overlapping Rocks | 15.88–30.21 | 22.19 | 11.09–24.91 | 17.41 | 1.83–2.03 | 1.93 | 2.38–2.94 | 2.54 | 18.47–32.65 | 23.77 |
| Kimberlites | 12.42–31.46 | 17.59 | 1.76–10.67 | 7.14 | 1.74–2.35 | 2.06 | 1.83–2.37 | 2.11 | 0.46–4.92 | 2.39 |
| Host Rocks | 16.05–63.32 | 35.52 | 6.19–29.13 | 13.94 | 1.47–2.19 | 1.89 | 2.06–2.7 | 2.42 | 4.72–40.96 | 21.11 |
| Tuffaceous Sedimentary Rocks | 11.45–48.4 | 28.81 | 9.82–34.13 | 22.34 | 1.36–1.90 | 1.73 | 2.12–2.54 | 2.28 | 13.21–36.74 | 24.04 |
| Radon Production Rate, Bq·m−3·h−1 | ||
|---|---|---|
| Range | Mean | |
| Overlapping Rocks | 38.88–59.12 | 52.47 |
| Kimberlites | 9.84–18.96 | 16.15 |
| Host rocks | 37.19–132.03 | 63.88 |
| Tuffaceous Sedimentary Rocks | 33.97–139.57 | 75.39 |
| ARa226 | Kemanation | ARn222 | AVdens | TRdens | Porosity | |
|---|---|---|---|---|---|---|
| ARa226 | 1 | |||||
| Kemanation | −0.277 | 1 | ||||
| ARn222 | 0.350 | 0.709 | 1 | |||
| AVdens | 0.054 | −0.666 | −0.531 | 1 | ||
| TRdens | 0.092 | 0.294 | 0.335 | 0.155 | 1 | |
| Porosity | 0.043 | 0.753 | 0.691 | −0.648 | 0.646 | 1 |
| Parameter | Factor | ||
|---|---|---|---|
| 1 | 2 | 3 | |
| ARa226 | −0.040 | 0.036 | 0.990 |
| Kemanation | 0.876 | 0.271 | −0.256 |
| ARn222 | 0.776 | 0.288 | 0.418 |
| AVdens | −0.920 | 0.248 | 0.028 |
| TRdens | 0.071 | 0.992 | 0.054 |
| Porosity | 0.774 | 0.572 | 0.036 |
| % of Variance | 52.81 | 21.15 | 17.95 |
Publisher’s Note: MDPI stays neutral with regard to jurisdictional claims in published maps and institutional affiliations. |
© 2021 by the authors. Licensee MDPI, Basel, Switzerland. This article is an open access article distributed under the terms and conditions of the Creative Commons Attribution (CC BY) license (https://creativecommons.org/licenses/by/4.0/).
Share and Cite
Yakovlev, E.; Puchkov, A. Radon over Kimberlite Pipes: Estimation of the Emanation Properties of Rocks (Lomonosov Diamond Deposit, NW Russia). Appl. Sci. 2021, 11, 6065. https://doi.org/10.3390/app11136065
Yakovlev E, Puchkov A. Radon over Kimberlite Pipes: Estimation of the Emanation Properties of Rocks (Lomonosov Diamond Deposit, NW Russia). Applied Sciences. 2021; 11(13):6065. https://doi.org/10.3390/app11136065
Chicago/Turabian StyleYakovlev, Evgeny, and Andrey Puchkov. 2021. "Radon over Kimberlite Pipes: Estimation of the Emanation Properties of Rocks (Lomonosov Diamond Deposit, NW Russia)" Applied Sciences 11, no. 13: 6065. https://doi.org/10.3390/app11136065
APA StyleYakovlev, E., & Puchkov, A. (2021). Radon over Kimberlite Pipes: Estimation of the Emanation Properties of Rocks (Lomonosov Diamond Deposit, NW Russia). Applied Sciences, 11(13), 6065. https://doi.org/10.3390/app11136065