1. Introduction
The process of water freezing in wood has not been fully elucidated theoretically. It is known from molecular physics that the smaller the radius of the capillary, the greater the cooling required to initiate the crystallization process. The walls of macrocapillaries in wood are thin (~0.005 mm) and highly elastic. The water push by the ice can move into the secondary capillaries, and therefore the pressure in the macrocapillaries of the wood cannot increase if it is not at the fiber saturation point. This causes an increase in the freezing temperature of the water in the wood’s capillaries. Lignin reduces the elasticity of cell walls and causes a very low freezing temperature of free water. The content of nutrients in the water of living trees also has an influence, whose freezing temperature is lower than felled ones, even if the lignin content is the same. The freezing temperature of water in the surface layers of wood is lower than inside because its cooling begins from the surface, where the first places of crystallization of water also form. Researchers [
1] described that water to ice transformation leads to an expansion of liquid water in the lumen, thus imparting a compressive stress to the cell wall, which, together with the moisture loss, increase the rigidity of the cell.
The freezing process of bound water in wood is complicated. Due to the thin dispersion construction of bound water, there is no constant and determined freezing temperature. With decreases in water volume, the likelihood of the formation of crystallization centers decreases remarkably, and the duration and the degree of cooling of the water increase. The adsorption water in the monomolecular cannot crystallize because water molecules must be arranged not in one plane, but must form a spatial lattice. To form new H bonds with secondary water molecules (create ice), they must be released from H bonds with capillary walls. Because the H bonds between water molecules are energetically equal to the hydroxyl groups of the wood, under these conditions ice can form in the submicrocapillaries of wood, even at low temperatures [
2]. Previous research [
3] focused on the latent heat of bound water in wood during freezing and defrosting by mathematic equations. As also shown [
3], the specific latent heat of fusion and crystallization of the bound water in wood decreases with a decrease in the temperature. This result explains that the absorption of the bound water in capillary-porous materials, including wood, is accompanied with heat release and with an increase in the alignment of the water molecules in the materials. Heating of frozen wood is fundamentally different from the heating of unfrozen wood. The complexity of the problem lies in the variability in the temperature field over time and in the conditions of the phase transformation of water. Ref. [
4] observed phase transitions of water in pine and cell walls. Samples were prepared on the freezing and melting of water at 10–20 different moisture contents. The results showed that the melting temperature of the free water depends on moisture content. Complete thawing of lumber by moist air occurs during kiln drying in winter conditions. Ice is first completely dissolved during heating. Then, it is heated from 0 °C to the desired temperature in the middle of the dried wood, which is lower than the temperature of the environment. The humidity of the environment in this method is 80% to 90% [
2]. Research [
5] also showed that a significant amount of water is removed from wood during the beginning of the heating phase (thawing).
Next, results [
6] clearly showed that the freezing rate influences the defrosting time and speed. Similarly, others [
7] clearly indicated that the freezing rate significantly influences the thawing time and speed, which increase by 13–17% in the case of slowly frozen wood (at −1 °C·min
−1) compared to rapidly frozen wood (at −10 °C·min
−1).
Some research [
2] discovered that a high freezing rate (−10 °C·h
−1) does not affect wood strength, while slow freezing (by −1 °C·h
−1) significantly reduces all mechanical wood properties, for example, compressive strength (by 20–30%) and the Janka hardness (by 18%). The results of other studies [
8,
9] showed that cyclic freezing and thawing lead to a reduction in all choice mechanical properties by 15–30% (for example, bending strength, tensile strength, etc.). Other authors [
10] discovered that continuous exposure of spruce wood to a temperature of −250 °C for one week significantly affected only the dimensional stability, but mechanical properties were not affected significantly. Similar work [
5] recorded that the long-term exposure (three months) to temperature variations negatively affected the structural integrity of spruce wood. As also shown [
2], the temperature variation and the repeated changing phase of water inside wood increase dimensional instability and reduce the mechanical strength. The results of research [
11] showed that under temperatures below 0 °C, moisture content is the most important factor explaining all mechanical properties. Another study [
12] found that mechanical properties, cleavage, and shear are the most sensitive to changes in temperature.
Frozen wood has a remarkable influence on the processing process. Results [
13] showed that in the cutting process, the highest cutting power corresponded to sawing frozen wood, while there was no significant difference between sawing dry and green wood. Next, researchers [
14,
15] discovered that, especially in environments with sub-zero temperatures, the moisture in frozen logs has a crucial influence on the material’s properties. According to [
14], the hardness of ice increases exponentially along temperature decreases; the efficiency of cutting processes for cutting frozen wood decreases too.
This article deals with the influence of pine wood moisture content on the processes of freezing and subsequent heating of frozen wood in a gaseous environment.
2. Materials and Methods
Pine wood (Pinus sylvestris L.) from the University Forest Enterprise of the Technical University in Zvolen was used for the experiment. The diameter of the log was 37 cm on the narrow end. The total length was 4 m. Mean annual growth was 6 ± 1 mm and the proportion of late wood was 52%.
Two groups of samples with a thickness of 30 mm, width of 120 mm, and length of 500 mm were cut from sapwood. Their average oven-dry density was 395.5 kg·m−3 with a variance from mean value of ± 3.4 kg·m−3. The moisture content of the first group was above the fiber saturation point (FSP). The second group was air-conditioned to an approximately 35% moisture content.
The average moisture content according to [
16], moisture gradient, and the oven-dry density according to [
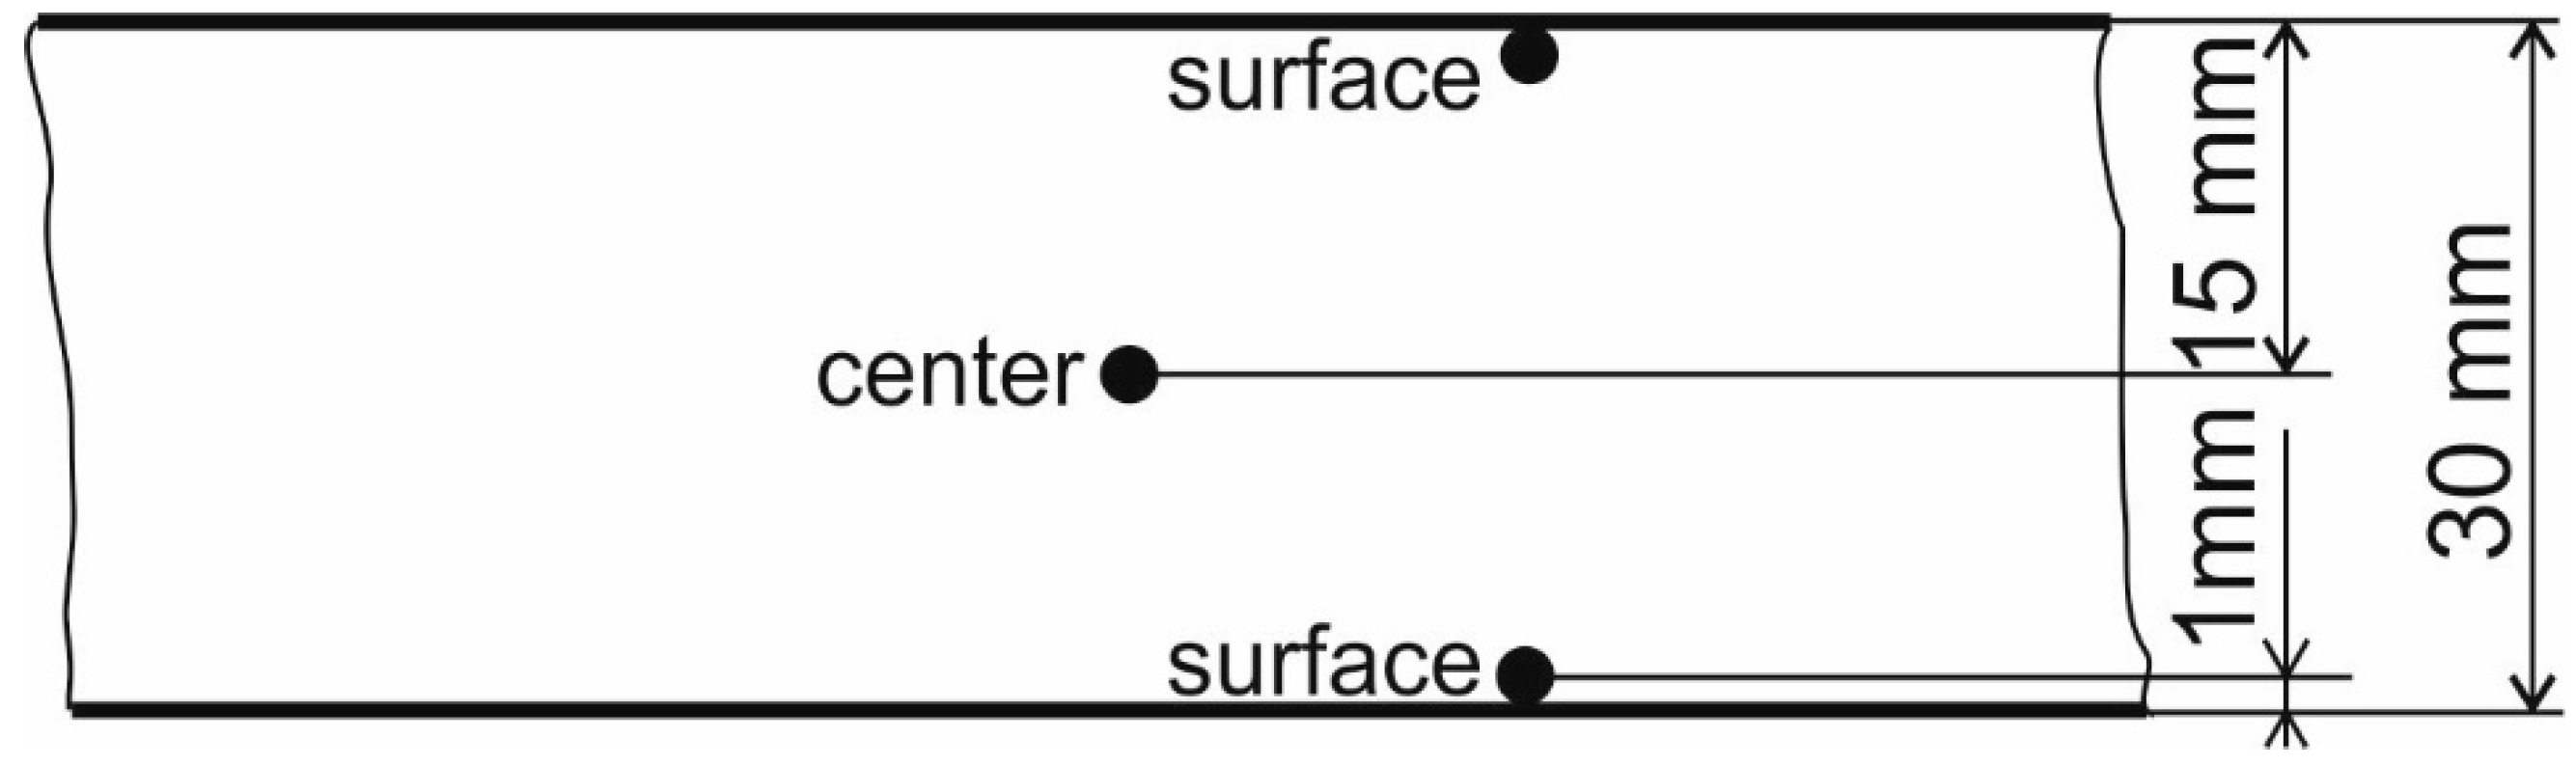
17] for each sample were determined. The temperature on the cross-section of the samples was conducted using T-type thermocouples (Cu-Ni), which were connected to the measuring unit Comet MS6R (COMET SYSTEM, Ltd., Rožnov pod Radhoštem, Czech Republic). The position of thermocouples on the cross-section is shown in
Figure 1.
Thermocouples were placed in the middle of the sample length. The measuring depth was 60 mm. The temperature was measured in 15 samples.
For all the samples, the moisture gradient was determined before and after the drying process. The samples were separated into layers, in which the moisture content of each layer was determined by the oven-dry method. The moisture gradient was calculated using:
where ∆
MC is the moisture gradient (%),
MCc is the moisture content of the middle layer (%),
MCs is the moisture content of the surface (%), and
n is the number of layers.
2.1. Freezing Process
The samples were placed in a Whirlpool AFG6 freezer (Whirlpool Corporation, Wroclaw, Poland). The temperature was set to −25 ± 0.3 °C, which is the average minimum temperature in winter in the north of Slovakia. The temperature inside the freezer and the temperature of samples were measured in 1 min intervals. The samples were placed inside the freezer until the temperature of the samples stabilized. Afterward, the average moisture content (MC) and moisture gradient were measured.
2.2. Heating Process
The heating process was performed using a Memmert HCP 108 humidity chamber (Memmert GmbH + Co. KG, Schwabach, Germany). The parameters of the environment were the same for all samples: temperature
ts = 70 ± 0.1 °C, relative humidity
α = 87% ± 1%, and air velocity
v = 1.5 m·s
−1. These heating parameters were determined for a given wood species and thickness according to [
18]. The basic heating time of 6 h for the samples of 30 mm thickness was determined according to [
18].
The theory of similarity was applied in the mathematical analysis and experimental investigation of the process of heating wood (heat transfer). The theory of similarity proves that dimensionless complexes of physical quantities (so-called similarity criteria) have the same numerical values for similar phenomena. Two similarity criteria are important for convective heat transfer [
2].
2.3. Theoretical Calculation of Frozen Wood Heating Time
2.3.1. Fourier Criterion (Fo)
Physical significance determines the relationship between the rate of change in the temperature field in solids, physical characteristics, and dimensions. The field of application is in the study of non-stationary fields during heating or cooling of a solid [
2].
The theoretical calculation of the defrosting and heating time to the desired temperature in the middle of the samples was performed for boundary conditions of the III kind, because we assumed that
Fo ≥ 4 and that
α = 80%. Fourier’s criterion was calculated according to the equation:
where
a is the thermal conductivity coefficient (m
2·s
−1),
τ is the heating time (s), and
h is the sample thickness (m).
2.3.2. Biot Criterion (Bi)
Physical significance determines the relationship between heat transfer at a solid’s surface and thermal conductivity. The field of application is in the study of thermal conductivity and temperature field. When heating wood in a gaseous environment, the heat transfer coefficient is relatively small, and the surface temperature is always lower than the temperature of the environment. An observable temperature difference Δ
t, and therefore
Bi < ∞, occurs in the boundary layer due to thermal resistance [
2]. Biot’s criterion was calculated according to the equation:
where
λ is the thermal conductivity coefficient (W·m
−1·K
−1), and
α is the heat transfer coefficient.
where
ρ is air density (kg·m
−3),
v is air flow rate (m·s
−1), and dimensionless temperature.
where
ts is the temperature of the environment (°C),
tx is the temperature at that point (°C), and
t0 is the initial temperature of wood (°C).
3. Results and Discussion
A total of 30 samples were used for this experimental work. Their average oven-dry density was 395.5 kg·m
−3 with a variance from mean value of ±3.4 kg·m
−3. The average initial
MC of the first group of samples (
MC > FSP) was 81.38% with a variance of ±0.43%. The average initial
MC of the second group of samples (
MC ≅
FSP) was 35.47% with variance of ±0.21%.
Table 1 shows the average values of the initial
MC after the freezing and heating process, and the moisture losses in the individual stages of the process.
It can be seen from the measured data that with this freezing process, the decrease in the MC of the samples was approximately the same in both groups. On average, moisture content was reduced by 4.2% in both groups. The initial moisture of the samples had no effect on this decrease. Before the freezing process, the average value of the humidity gradient was higher for samples with higher humidity. In both groups, the increase in moisture gradient was similar. Higher values were measured for samples with higher MC. In this group, the value of the humidity gradient increased twice after the freezing process and the standard deviation also increased. Higher moisture loss was in the surface layers (5–6%) due to the sublimation of free water. The change in MC of the middle layers was only about 1%. Humidity affected the amount of moisture gradient after freezing.
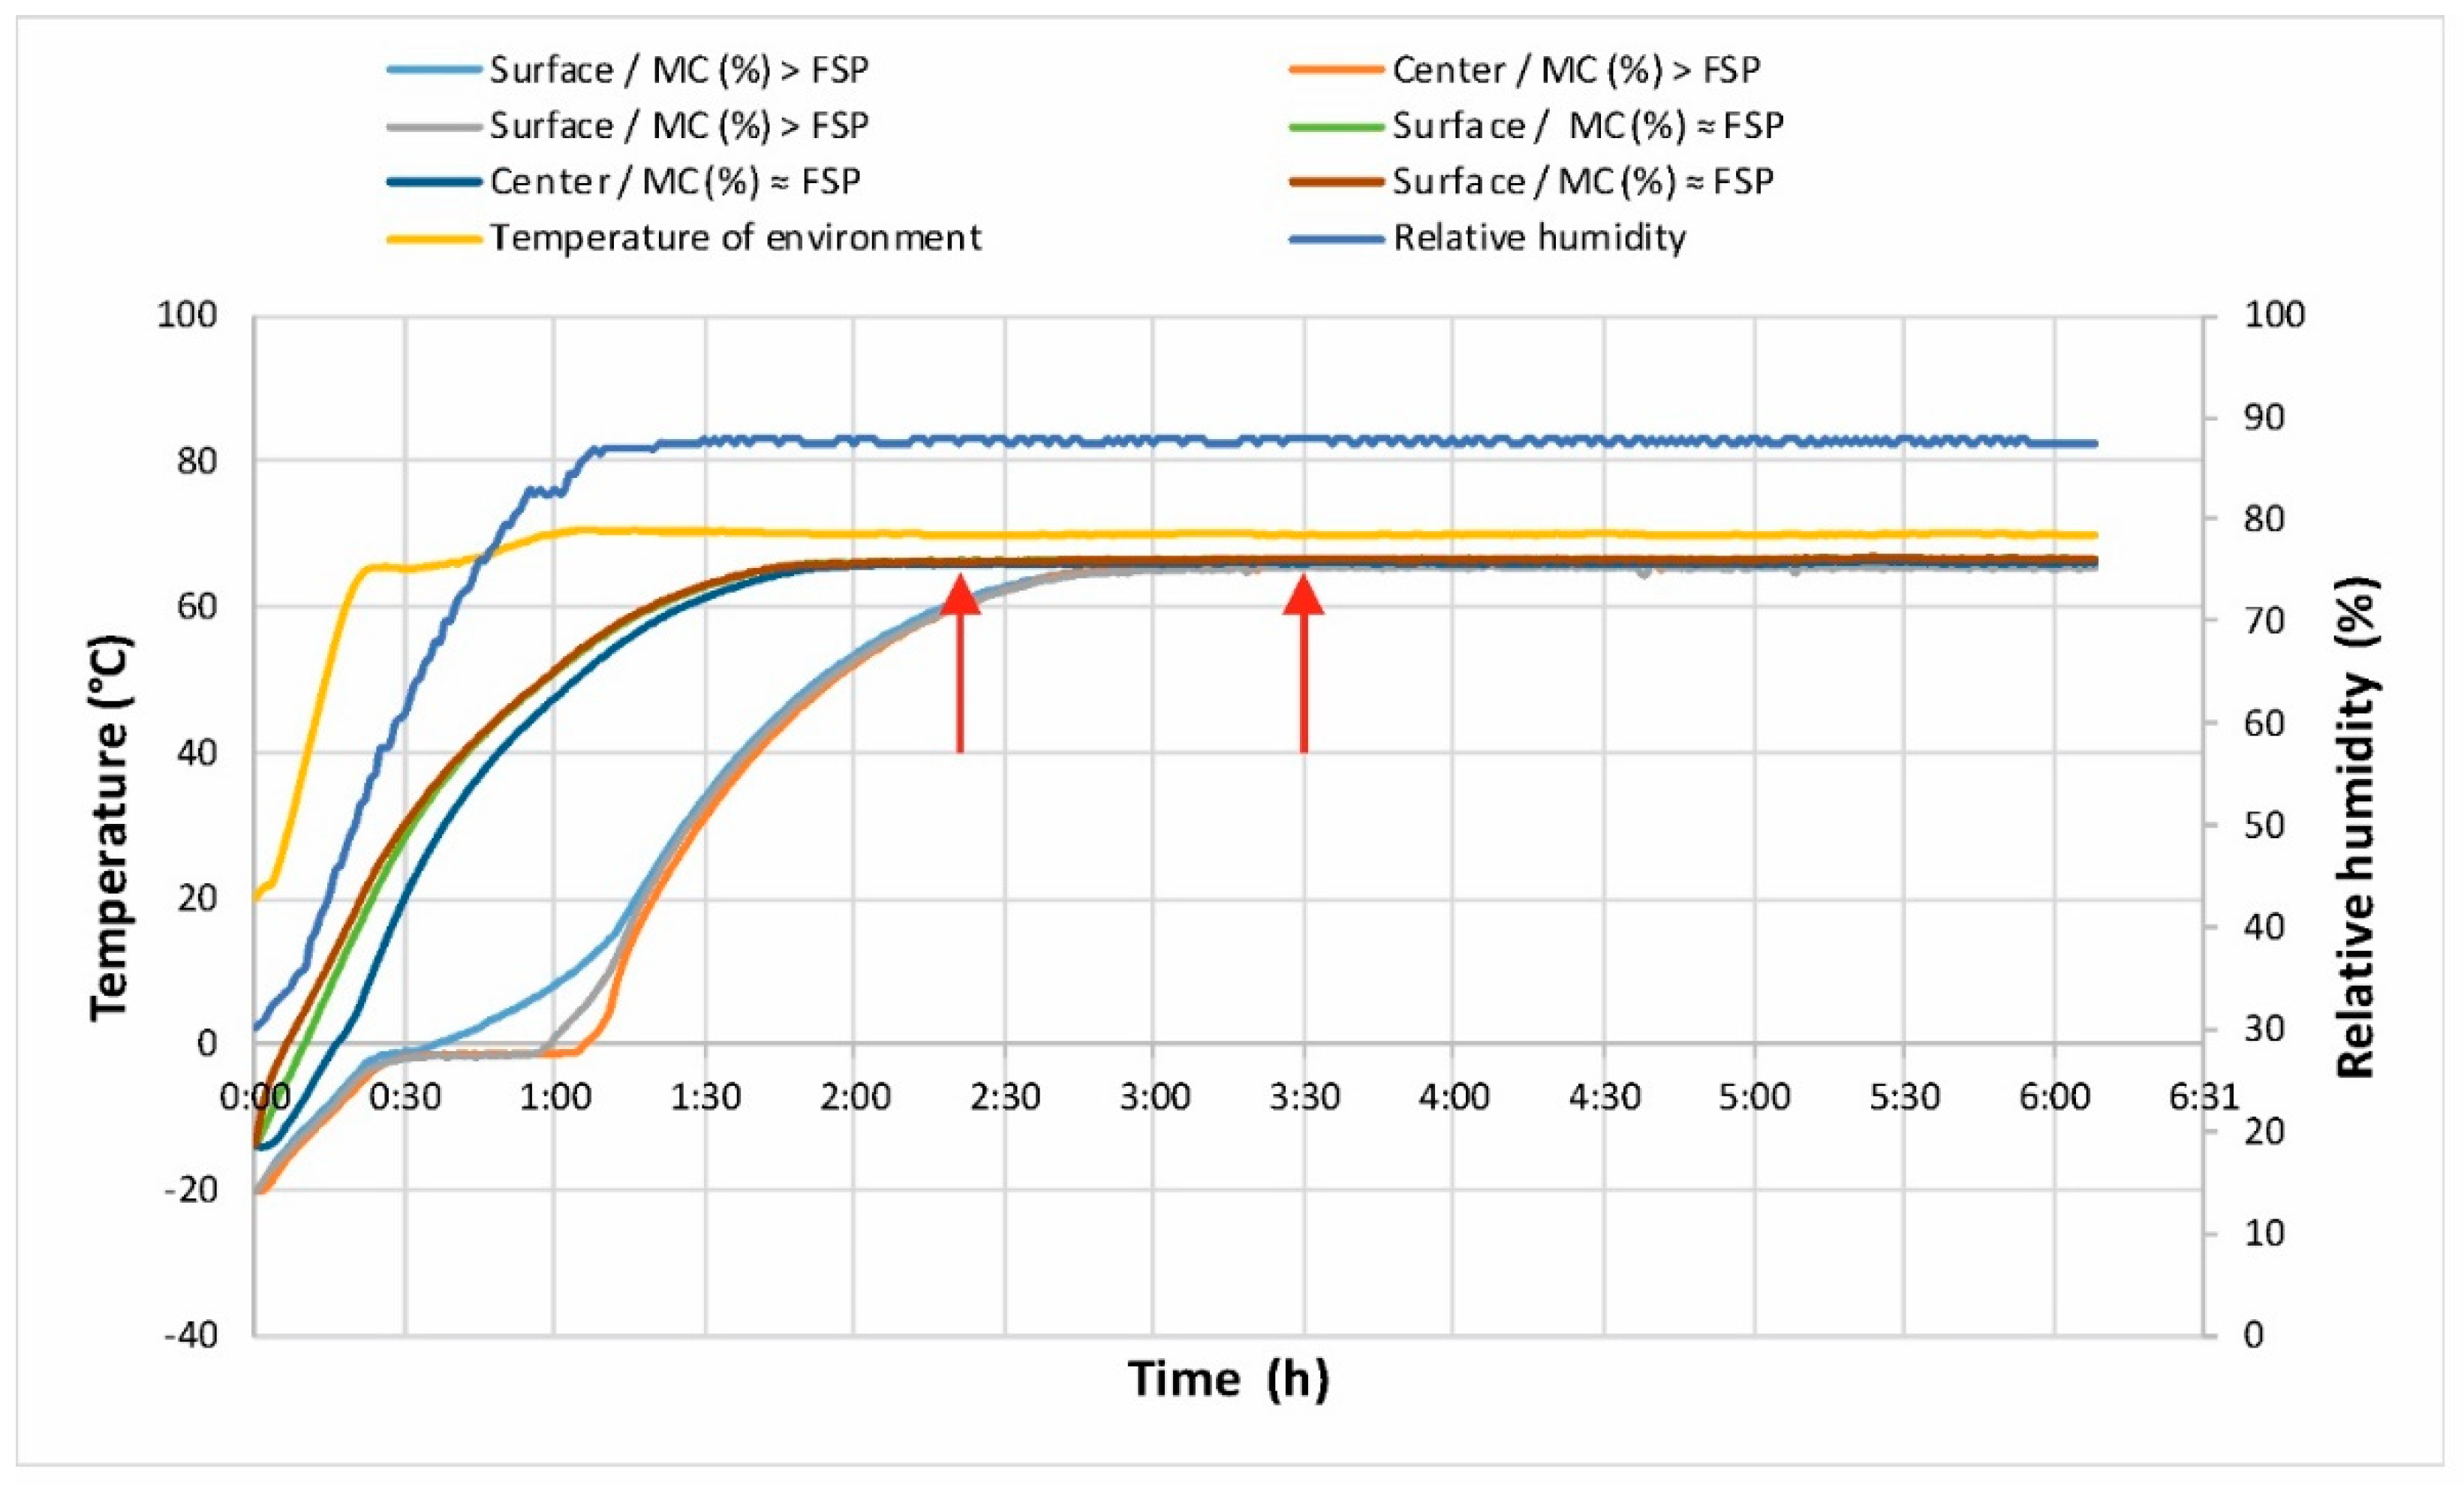
After heating of the frozen samples, the loss was significantly greater in the samples whose MC was above the FSP compared to the second group of samples. The values of moisture gradients decreased. The values of humidity gradients decreased, but for a given thickness of the samples, the values were high; this was due to a slow increase in the relative humidity of the environment in the first hour of heating (Figure 3).
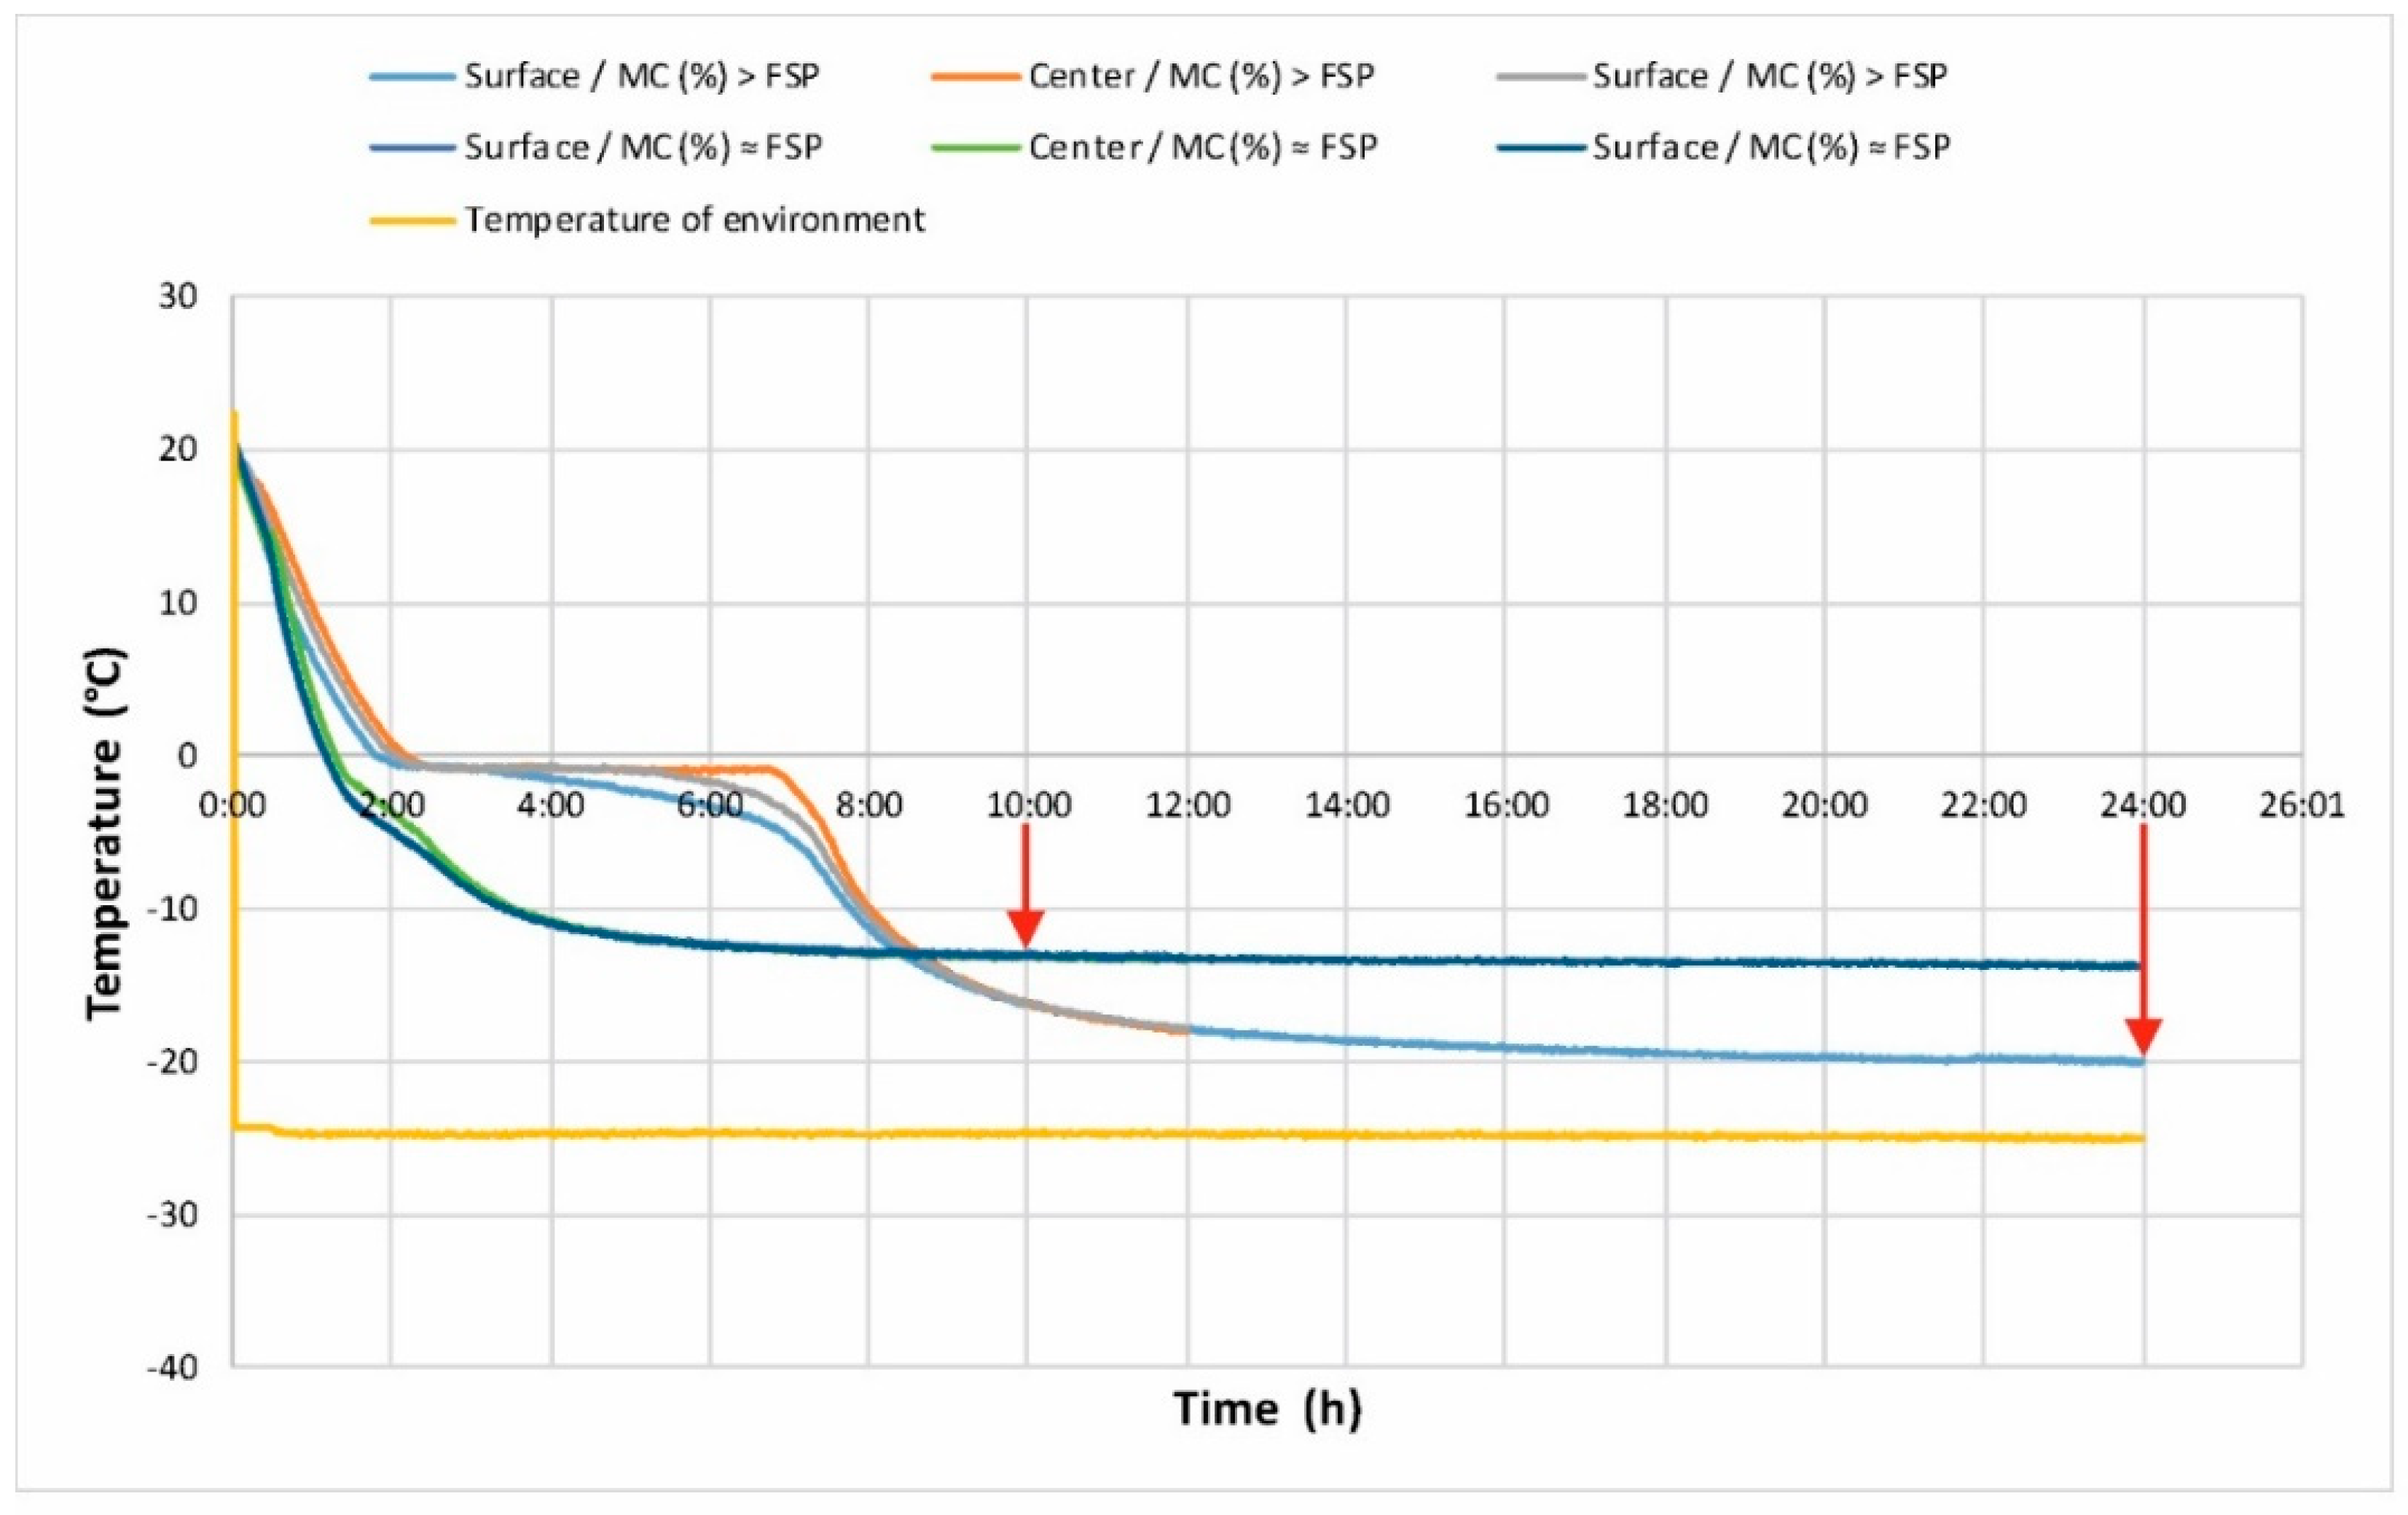
The
Figure 2 shows the course of temperatures on the cross section of wood in the freezing process.
Additionally, as in similar research studies [
5,
8,
9,
10,
11,
12], we discovered that freezing and the time of exposure to negative temperatures significantly reduced all mechanical wood properties and increased the dimensional instability inside the wood. Conversely, other researchers [
13,
14,
15] discovered that as temperature decreased, the efficiency of cutting processes for frozen wood decreased.
No differences were found in the freezing and heating processes due to the position of the samples in the laboratory equipment. The measured data showed a different course of temperatures in the samples, caused by the influence of wood moisture content. For samples with an average MC of 35.47%, the temperature drop was faster, with a negative temperature being reached in the middle of the sample after only 1 h and 20 min. The difference between the temperature in the middle and surface of the samples was max. 1.5 °C. Due to the small amount of free water in the samples, no stage of water state change (phase transition) was recorded. After 10 h, the temperatures on the entire cross-section of the samples reached the lowest value of −13.2 °C, which did not change further.
For samples with an average initial
MC of 81.38%, three stages of temperature reduction in the wood were observed. The first stage was from the initial temperature to 0 °C. In this stage, the temperature decreased more slowly compared to the samples with lower
MC. There was a significant difference between the surface and middle layers of the wood. In the middle of the samples, the temperature was higher by a maximum of 2.5 °C. The time to reach 0 °C in the center of the samples was approximately 2 h. In the second stage, the temperature in the cross-section of the wood was just below 0 °C and there was a phase transformation of water in the wood from liquid to solid state. The temperature in the middle of the samples stabilized at −0.8 °C and did not change until 7 h. Toward the end of the stage, the difference between the temperature in the middle and below the surface of the samples increased. The duration of this stage was approximately 5 h. In the third stage, the temperatures in the samples decreased and the difference between the temperature in the middle and below the surface of the samples gradually decreased. The temperature dropped and the lowest temperature of −20.11 °C was reached after 24 h. Following [
1], we discovered that −20 °C appears to be the most practicable for reduced shrinkage; the temperature of the samples did not change. Ref. [
12] observed phase transitions of water in pine and discovered that the melting temperature of free water depends on moisture content. After the temperature stabilized, the samples were placed in a Memmert humidity chamber where the heating process used in hot air drying was simulated.
Figure 3 shows the course of temperatures in the samples and the parameters of the ambient air in the heating process.
Again, the temperature difference due to the different
MCs of the samples is visible. The defrosting and heating processes of samples with lower
MC are significantly easier. The samples had a higher initial temperature (−13.2 °C) and the temperature increase was continuous (almost linear). At the end of the heating, the temperature increase in the samples slowed. The desired temperature of 65 °C in the middle of the samples was reached in 2 h and 20 min. Research [
6] established that the optimum temperature in the heating phase when drying frozen spruce is 30 °C instead of the usual 50 °C. This value leads to improved drying uniformity without significantly prolonging the drying time.
For the second group of samples (MC > FSP), the heating process was divided into three stages similar to those described in the sample freezing process. The initial temperature of the samples was lower (−20 °C), and the duration of the first stage, when the temperature rise in the middle of the samples stopped, was 30 min. Temperature differences in wood cross-sections were minimal. The second stage, when the water level in the wood changed from solid to liquid, was 40 min. The difference in temperature at the surface and n the middle of the samples was measured. In the third stage, the samples were heated with a small temperature drop in the cross-section. The time to reach the desired temperature of 65 °C in the middle of the samples was approximately 2 h 20 min. The total time to defrost and heat this group of samples was 3 h 30 min.
Table 2 shows the heating times theoretically calculated, experimentally measured, and the heating times set to the standard [
16] for heating of frozen wood (30 mm thick).
The theoretically calculated time required for defrosting and heating the wood is longer than the measured time. This difference may be because the measurements were recorded under laboratory conditions, where increases in the temperature of the environment are faster than under operating conditions. Thus, the theoretically calculated time is sufficient for heating of frozen pine lumber 30 mm thick. The heating time, according to [
18], is approximately one-third longer than necessary. For the mentioned wood, we propose using this equation to calculate the heating time for frozen lumber:
where
h is thickness (mm).


