Article

Research on the Influence of Production Technologies on the Positioning Accuracy of a Robotic Arm for Low-Handling Weights

1
Faculty of Manufacturing Technologies with a Seat in Prešov, Technical University of Košice, Bayerova 1, 080 01 Prešov, Slovakia
2
Faculty of Mining, Ecology, Process Control and Geotechnologies, Technical University of Košice, Letná 9, 042 00 Košice, Slovakia
*
Author to whom correspondence should be addressed.
Appl. Sci. 2021, 11(13), 6104; https://doi.org/10.3390/app11136104
Submission received: 3 June 2021 / Revised: 25 June 2021 / Accepted: 29 June 2021 / Published: 30 June 2021
(This article belongs to the Section Robotics and Automation)

Abstract

:
The subject of the paper is the research of production technologies’ influence on positioning accuracy of a robotic arm. The aim was to find out whether different production technologies (additive and conventional) and the related design differences of the robotic arm affect its operational functionality. In the research, positioning accuracy of a robotic arm formed by three partial arms was specifically investigated, while the first partial arm, Arm I, was manufactured by two different technologies. On the robotic arm, the research was carried out in such a way that the first partial arm, Arm I, was being continuously changed and was available for research purposes in two variants. Each of the Arm I variants was manufactured using a different technology (additive and conventional) while, at the same time, the individual variants also differed in construction. The design differences of both variants were related to the production technology used. The measurement of positioning accuracy was performed with the use of two methods. Specifically, a contact and a non-contact method were used. The contact method was implemented on a 3D-measuring machine, RAPID, and the second contactless method was performed using an inductive sensor.

1. Introduction

The use of robots for handling and positioning, welding, subtractive and additive production has been expanding in recent years in line with the Industry 4.0 concept [1]. A robotic arm can be a separate mechanism or part of a more complex robot. It is a type of mechanical hand that is usually programmable and has similar functions to a human hand [2].
At present, we encounter the use of various production technologies in the production of robotic arm components. CNC machining technologies are the most widespread [3]. Covaciu and Filip [4] designed and validated a robotic arm made with two CNC machines. Gordaninejad and Vaidyaraman are among the first researchers to compare the positioning accuracy of robotic arms made of conventional metallic materials and advanced composites [5].
Until recently, it was not possible to find a published use of an additive manufacturing component in an industrial robotic arm. However, the great expansion of 3D printing technology is creating increasingly suitable conditions for this [6]. A conventional 3D printer uses layering in a horizontal plane to produce a 3D printed part. Ishak and Larochelle [7] proposed the integration of existing additive manufacturing process technologies with the arm of an industrial robot to create a multilayer layered 3D printer. Their approach allows printing to be layered in multiple planes, while existing conventional 3D printers are limited to one plane of the toolpath. The integration of the robotic arm and the extruder allows the movement of several planes of the tool path to be used in the production of structural parts.
Hajash et al. [8] introduced a fast liquid printing device that can freely print in any direction, rather than layer by layer, depositing liquid material in a granular gel to create 3D structures. Recently, however, several scientific papers have appeared on the additive manufacturing of robotic arm components. Mick et al. [9] proposed a prototype of a robotic arm made using 3D printing, which is also economically more advantageous compared to the price of an industrial robot thanks to conventional drives. Junia Santillo Costa et al. [10] implemented and validated a 3D printed open source robotic arm with 6 degrees of freedom made of ABS (Acrylonitrile Butadiene Styrene) material, due to higher mechanical strength. Ismail et al. [11] designed and developed a robotic arm for lifting light parts with 4 degrees of freedom. They used a 3D printing method to make the robotic arm components, which provided more accurate dimensions and time and cost savings. Wang et al. [12] proposed a special holder for the InnoMotion robotic arm, where the main components of the holder were made by 3D printing using plastic material and are fully compatible with the MR and CT system and the robotic arm.
The positioning accuracy of the robotic arm can vary widely in the workspace, which is influenced by various factors. Therefore, researchers propose various methods and methodologies to improve reliability and repeatability of positioning accuracy [13]. One of the parameters influencing the accuracy of the robotic arm is vibration. Elvira-Ortiz et al. [14] proposed a methodology to improve the estimation of kinematic parameters on industrial robots by correctly suppressing the vibrational components present on the signals obtained from the two primary sensors: the accelerometer and the gyroscope. Their results prove that the sensor fusion technique, accompanied by correct vibration suppression, provides a better estimate of the kinematic parameters than other proposed techniques. The accuracy of the robotic arm is also affected by sensing the position of each joint with a high-resolution optical coding device that cannot detect certain mechanical deformations, thus reducing the accuracy of the robot’s positioning and orientation. Research in this area has been addressed by Rodriguez-Donate et al. [15], who developed an intelligent processor using Kalman filters to filter and fuse information from a network of sensors. They used two primary sensors: an optical encoder and a 3-axis accelerometer. Calibration of a robot arm is an important factor in the accuracy of robot positioning. A simple, low-cost calibration procedure that improves the surface positioning accuracy of a SCARA (Selective Compliance Assembly Robot Arm) double-arm robot was published by Joubair et al. [16]. One of the key problems in examining the positioning accuracy of robotic arms is the working temperature. Kluz et al. Analyzed the analysis of the influence of temperature on the positioning accuracy of the robot arm [17]. The results obtained were subjected to statistical analysis using the Shapiro–Wilk test, which confirmed that the three-sigma rule can be used to calculate the value of the total positioning error of the robot arm.
The use of cooperating robotic solutions is also supported by current trend of automation and data exchange in production technologies, the so-called Industry 4.0 [18]. The goal of Industry 4.0 is ultimately to achieve efficiency, reduce costs and increase productivity through integrated automation. In Industry 4.0, production systems are characterized by individualized products in conditions of highly flexible mass production. A literature review of current standards for human–robot collaboration shows they can be used in a wide range of different regimes [19]. The field of application of human robot collaborative systems includes handling, welding, assembly and automotive [20]. Nowadays human robot collaboration systems are widely used in manufacturing companies that operate according to the concept of Industry 4.0. Due to the necessity of meeting the needs of individual customers, interest in the application for knowledge transfer support is growing. Ballestar et al. [21] provided knowledge related to the interconnection of industrial robotics and productivity of work in small and medium enterprises (SMEs). Patalas-Maliszewska and Krebs [22] developed the knowledge transfer approach is to select the best characteristics of a knowledge worker in order to achieve an improvement of effective use of the application for knowledge transfer support among employees. This approach is based on survey and data obtained from Polish production plants.
The research so far has mostly focused on positioning accuracy control, research of control systems, control methods and positioning, but we have not been able to find publications aimed at examining the relationship between positioning accuracy of the robotic arm and manufacturing technologies with which it was manufactured. It is from this knowledge that the main research intention of the presented paper is based, the aim of which is to expand the field of knowledge concerning the accuracy of robotic arm positioning in relation to used production technologies.
The subject of the paper is the research of production technologies impact on positioning accuracy of a robotic arm. The aim was to find out whether different production technologies (additive and conventional) and the related design differences of the robotic arm affect its operational functionality. In the research, positioning accuracy of a robotic arm formed by three partial arms was specifically investigated, while the first partial arm Arm I was manufactured by two different technologies. On the robotic arm, the research was carried out in such a way that the first partial arm, Arm I, was being continuously changed and was available for research purposes in two variants. Each of the Arm I variants was manufactured using a different technology (additive and conventional) while, at the same time, the individual variants also differed in construction. The design differences of both variants were related to the production technology used. The measurement of positioning accuracy was performed with the use of two methods. Specifically, a contact and a non-contact method were used. The contact method was implemented on a 3D-measuring machine, RAPID, and the second contactless method was performed using an inductive sensor. The maximum working load of the robotic arm was 2 kg, therefore the positioning accuracy was examined at three degrees of operating load equal to 0, 50 and 100% of the maximum workload.
The research result proves that the technology of robotic arm production does not have a direct influence on its positioning. This result is based on results of mathematical–statistical analysis. However, production technology affects its design. This fact might be considered the secondary aspect, which, however, can already affect the positioning accuracy. However, the hypothesis, which emerged from the research, needs to be further investigated. Within the presented research results, inaccuracies in the positioning of the robotic arm were manifested that are to be attributed to various constructions due to the production technology used.

2. Materials and Methods

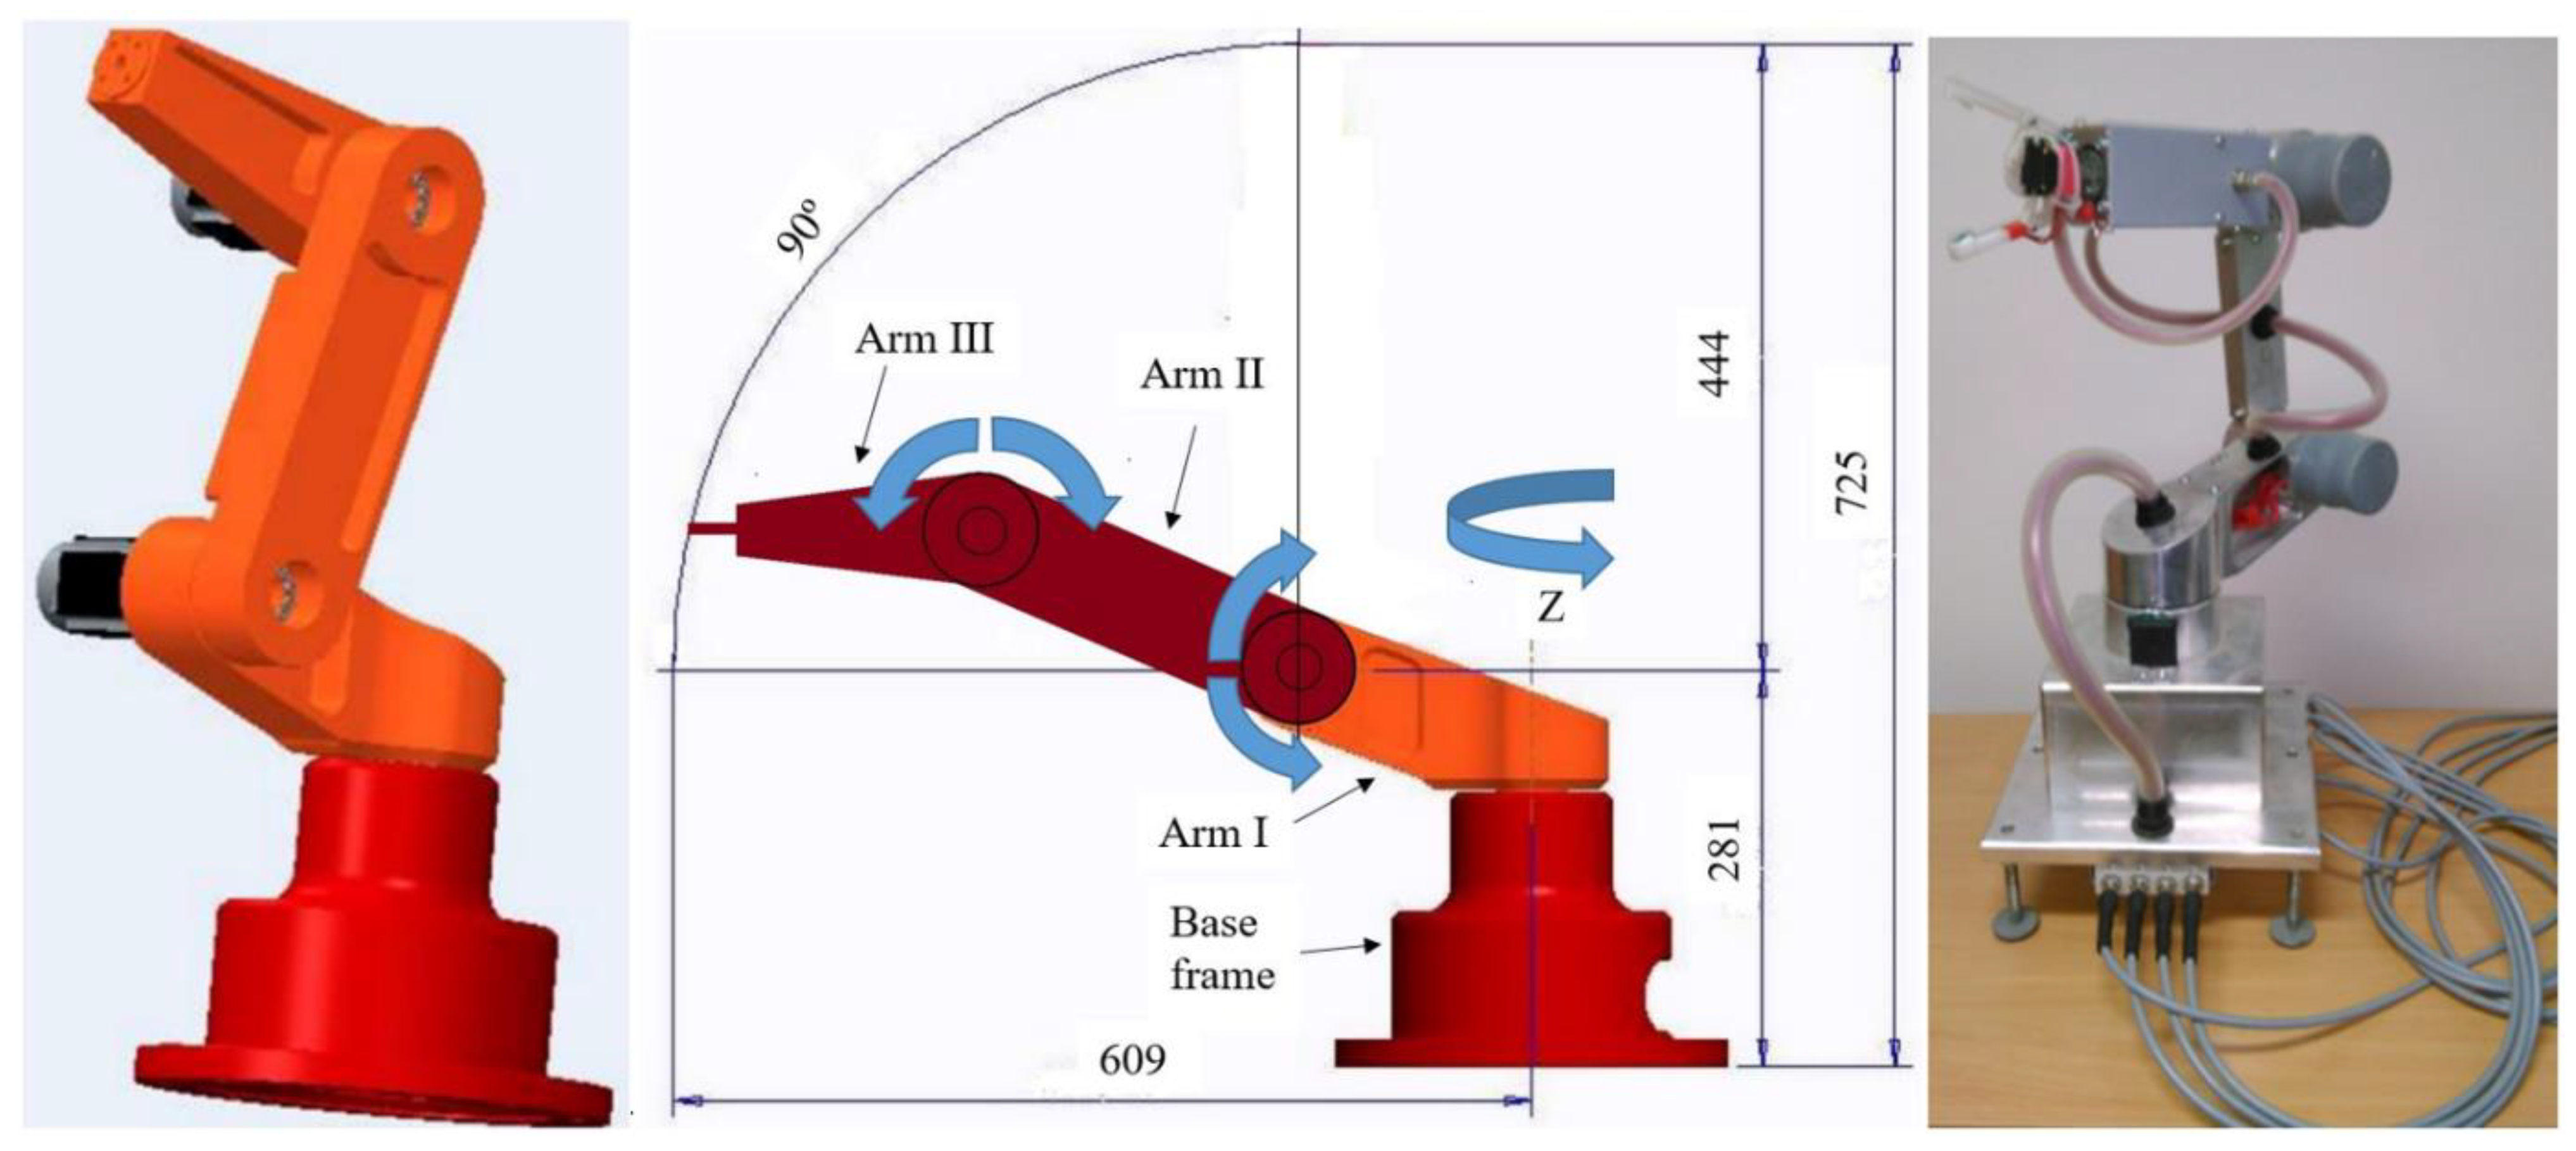
The robot developed with the most used angular structure with rotational movements in 3 axes, Figure 1, was used for the experiment.
The robot is in shape of a human arm with swivel joints. The working space consists of spherical areas. Such robots are suitable for a wide range of activities involving the use of three rotary motion axes. The robot itself consists of a robot base and three arms. The base of the robot is usually anchored horizontally, Arm I is mounted on it and rotates around the vertical axis Z. The remaining two axes of rotation are horizontal and parallel to each other. They consist of Arm II and Arm III. Arm III can work in proximity to the Z axis. The individual arms of the robot are connected to each other by gear mechanisms driven by servo drives. As the arms move, their elastic deformation occurs, which also affects positioning accuracy of the end robotic arm with the manipulation effector. Positioning accuracy research was carried out on two identical versions of Arm I, which differed in production technology used.

2.1. Arm I—Made by Additive Manufacturing (AdM)

Production of Arm I was realized by a 3D printer Xline 2000R [23], and the material used was AlSi10Mg (Figure 2).
Technical specification:
  • layer height 0.06 mm,
  • support structure layer height 0.12 mm,
  • total time of finishing and removing of support structure, finishing and sandblasting 32 h,
  • printing time equals 39 h and 35 min.
Y, Z, X in Figure 2 represent the Cartesian coordinate system, i.e., the orientation of Arm I for the individual measurement methods, which is identical with the manipulation of the robotic arm with the load in operation.

2.2. Arm I—Made by CNC (Computer Numerical Control) Milling (CvM)

Production of Arm I was realized by CNC (computer numerical control) machine Pinnacle VMC 650S, used material is AlMg4.5Mn, DIN 1732, with dimensions 150 mm × 150 mm − 450 mm (Figure 3). Its chemical composition is in Table 1 and physical-mechanical properties in Table 2.

2.3. Contact Measuring Method (CoM) of Robotic Arm’s Position

The contact measuring method (CoM) on a 3D-measuring machine can be implemented by a stylus with a ruby ball manually or by programming the stylus for repeated measurements. In our case, stylus programming by the learning method was used. Prior to measurement itself, the coordinate system of the 3D-measuring machine and the coordinate system of the measured-scanned body were identified. An NC (numeric control) scanning program was created in the control system of the 3D-measuring machine RAPID THOME Präzision [24], which ensured scanning of positions during repeated measurements. Stylus with a 4 mm diameter ruby ball was used for scanning as in Figure 4. The defined scanning sensitivity of the 3D-measuring machine 0.001 mm was achieved by observing the design and operating conditions. A holder was mounted on the robotic arm, which allowed mounting and weight exchange, and at the same time a part of it was machined so that reading of three perpendicular planes is possible, which after alignment with the reference coordinate system 3D-measuring machine were used to sense the position.
The measuring chain for CoM is shown in Figure 5. After setting the reference coordinate system of 3D-measuring machine (it consists in setting a fixed zero point on the base frame from which all measured values are read), the program for positioning the robotic arm is initialized and then adjusted to the position with maximum reach. The 3D measuring machine is then initialized. The stylus with ruby ball automatically senses the end position of the robotic arm [mm] and loads it into the PC application Metrolog XG. In this application, the end position of the robotic arm is evaluated.

2.4. Non-Contact Measuring Method (NcM) of Robotic Arm’s Position Deviation

In the second method of measuring position deviation, NcM was used using the proximity sensor MTN/EP080 Probe [25] in Figure 6. The defined sensing sensitivity of the 0.01 mm proximity sensor was achieved by adhering to the design and operating conditions.
A holder with a replaceable weight machined in three planes perpendicular to each other was reused on the robotic arm. A stable stand made of non-magnetic material with a non-conductive proximity sensor holder was mounted on the base frame of a 3D-measuring machine. The holder with a replaceable weight is used (after setting the switching position of the proximity sensor) to sense the incremental position deviation in the direction of the X, Y and Z axes in micrometers.
In the measuring chain (Figure 7), the power supply to the proximity sensor is initialized first. Subsequently, the program for positioning the robotic arm is activated. This is followed by positioning the robotic arm to the position with maximum reach. After reaching this position, a graphical recording of the maximum reach of robotic arm measurement will be performed. The incremental value of position deviation for the maximum reach of the robotic arm in µm is read from the graphic record in the LabVIEW software.
Robotic arm with Arm I—AdM and Arm I—CvM (Figure 8) are shown for NcM at maximum reach. For this method of measurement, the base frame of the 3D measuring machine was used only to fix the position of the robotic arm while maintaining a constant position of the base frame of the robotic arm. At the same time, the base frame of the 3D measuring machine was used to place and fix the proximity sensor holder.

2.5. Measurement Procedure and Evaluation of Deviations in the Position of the Robotic Arm

The robotic arm was at a maximum reach of 609 mm, according to Figure 1, programmed by the learning method for Arm I—AdM and Arm I—CvM. For CoM and NcM, the same program was used in the robotic arm control system. At the beginning of the measurement, the CoM of robotic arm’s position was selected, and n measurements were performed with Arm I—AdM in individual directions of the X; Y; Z coordinate system. NcM of robotic arm’s position deviation followed. After its completion, the disassembly of Arm I—AdM and assembly of Arm I—CvM followed. With this arm, n measurements were performed using NcM of robotic arm’s position deviation in each direction of the X; Y; Z coordinate system. Then the CoM of robotic arm’s position followed. The position of the proximity sensor was always adjusted to each scanned position of the robotic arm in the corresponding coordinate system. The data obtained were recorded and statistically processed for n measurements, for each axis of the coordinate system, for CoM, NcM, AdM and CvM, while the individual measurements were marked with the order index i. The proposed procedure for measuring and evaluation of the robotic arm’s position deviation is shown in Figure 9.

2.6. Ishikawa Diagram

The generated Ishikawa diagram (Figure 10) defines, investigates and detects the effects of several influences and causes, which result in the variability of the robotic arm position. The expected sources of variability in deviations of the robotic arm position that affect it are:
  • Arm I production technology,
  • weight size.
The source of variability, which is the subject of the experiment, is the accuracy of the position of the robotic arm with respect to the used production technology. However, in addition to expected resources, other factors also affect the accuracy of the robotic arm’s position. The causes are divided into categories and represent potential sources of variability for measured position deviations in the robotic arm.
Measuring apparatus is a factor influencing the complexity of measurement, the methodology design, requiring the experience of the implementer of measurements. It also affects the time aspect.
Robotic arm construction influences the production, operation, method of measurement, the possibility of using the apparatus, the choice of measuring members, the choice of the material of the robotic arm, while directly affecting its mechanical properties.
The human factor is the sum of characteristics of the person performing the measurement. In it, physical properties can be included, e.g., the promptness and measurement speed. Furthermore, experience that can be not only theoretical but also practical. Experience, within the researched issue, means practical experience in the field of measurement, metrology, creation of measurement methodology, planning of experiments with the aim of their harmonization for the measurement of required quantities.
Position is a factor reflecting the location of the robotic arm. It includes external influences that can be mechanical or physical. Their effect on the position of the robotic arm can be in terms of duration: temporary or permanent. In terms of severity, it can be minimal, neutral or serious.
Course of measurement is a factor that affects the method of measurement, the accuracy of results, their reliability, the equipment used and the complexity of the implementation.
Other sources of variability are undesirable in the experiment and require correction using the following methods:
  • elimination—the conditions of the experiment will ensure that this source of variability does not occur in the experiment at all;
  • minimization—targeted reduction of variability so that the rest will be part of the experimental error;
  • part of the experimental error—we know about this source, it is impossible to treat, thus will be reflected in a random error in the calculations.
As part of ensuring the conditions for carrying out the experiment, each known source of variability was corrected accordingly.
The measuring apparatus for measuring a robotic arm’s positioning accuracy by NcM, using a proximity sensor, consisted of a voltage source, connecting electrical cables, an A/D (an analog-to-digital) converter and a proximity sensor. The measuring apparatus for measuring of robotic arm’s positioning accuracy by CoM consisted of a 3D-measuring machine, RAPID, and a transducer with a complete connection of sensors.

2.7. Statistical Evaluation of Measurement Results

Statistical evaluation of measurement results was performed for both Arm I—AdM and Arm I—CvM with the use of CoM and NcM. In each case, 11 measurements described in chapter 2.5 were performed, while each group of 11 measurements formed one set. The results were processed according to Figure 9 as follows:
  • Verification that the selection of measured values comes from a population with a normal distribution.
    • Check outlier method of comparing the distance of the minimum and maximum from the first and third quartiles.
    • Implementation of the Grubbs test for outlier and removal of 1 to 3 extreme values to maintain the required 8 values, as in the following tests the required number of required values is >7.
    • Verified groups of measurements come from a population with a normal distribution performed by the Shapiro–Wilk normality test. If the hypothesis was rejected, the Kolmogorov–Smirnov normality test or the Pearson chi-square normality test was performed. If the hypothesis was rejected in all cases, then the measurements do not come from a population with a normal distribution. Otherwise, we do not reject the hypothesis of a normal distribution.
  • Descriptive statistics.
    • The following descriptive statistics are used to describe the measurement groups for each setting. Position statistics—average, median, minimum, maximum. The median is the mean value in the data sorted by size, and together with the minimum and maximum values, they give us a view of the data on how densely they are distributed.
    • Statistics on the variability of results—range, standard deviation. While range is the difference between the minimum and maximum value and only expresses the width of the data occurrence, standard deviation refers to the data density around the average.
    • Other statistics show the shape of the frequency curve, skewness about the location of the furthest sampling value from the arithmetic mean, and kurtosis about the density of data around the mean.
  • Comparison of measurement pairs.
    • For Arm I—AdM, Arm I—CvM, where the other mode settings were the same, the Two Sample t-test was used for the null hypothesis (difference in means is equal to 0) μ_1 = μ_2. To calculate the test statistic t, it was necessary to verify whether var.equal applies. This was preceded by an F test to compare two variances with the ratio of variances equal to 1.

2.8. Validation of Results by Computer Simulations

During the research implementation, verification of measured values was also carried out. FEM (finite element method) was used to verify them. The results were compared with the results of experimental calculations. As an example, we present the Z-axis deformation magnitudes in AdM_NcM determined by experimental measurements, the values of which are given in Table 3.
Then, the calculation of robotic arm load was performed using FEM, and the magnitude of the deformation was determined. An example of the result of the calculation is shown in Figure 11.
The comparison of experimentally measured value of deformation and with FEM calculation shows the difference of 8.5 %.
Verification was performed in the same way for the CvM_NcM arm. The magnitude of the measured deformations is given in Table 4.
Figure 12 presents the result of FEM calculation of the CvM_NcM robotic arm.
By comparing the experimentally measured value of deformation and FEM calculation, it is possible to state a difference of 1.4%.

3. Results and Discussion

3.1. Verification That the Selection of Measured Values Comes from a Population with a Normal Distribution

In this part, it was necessary to verify the hypothesis of a normal population distribution. The hypothesis of a normal population distribution (Table 5) was not rejected, i.e., the measurements were performed correctly, and the results of measurements can be further used for statistical evaluation using parametric tests.
Table 5 and Table 6 present the results for groups of measurements without outliers. This section may be divided by subheadings. It should provide a concise and precise description of the experimental results, their interpretation, as well as the experimental conclusions that can be drawn.
Since the comparison using non-parametric methods is not possible for the measurement results, a comparison for measurements in the direction of the Y axis was not performed for the aforementioned sets, they are pairs: CoM_0_Yy, CoM_1_Yy, CoM_2_Yy. Statistical conclusions show for practice that in the measurements in the Y-axis direction, there was a dimensional anomaly during the exchange of the arms, caused by non-compliance with assembly procedures and prescribed tightening torques of screws securing the arm.
The hypothesis of a normal population distribution for all NcM measurements in Table 6 was not rejected, so the measurements were performed correctly, and the measurement results can be further used for statistical evaluation using parametric tests. When replacing the arms and ensuring the correct assembly procedures and the prescribed tightening torques of the screws, measurements were achieved that also met the statistical requirements.

3.2. Descriptive Statistics

In Table 5 and Table 6, for every measurement the number of n values is determined which were left out after excluding the outliners. The descriptive statistics used for the robotic arm position –were: mean, median, minimum, maximum. Additional descriptive statistics of robotic arm position variability were used in the article: range, standard deviation, and descriptive statistics of shape: skewness and kurtosis. Descriptive statistics are calculated separately for CoM and NcM due to different measurement methodology.

3.2.1. CoM Descriptive Statistics

Descriptive one-dimensional statistics of position and variability CoM of Arm I—AdM and Arm I—CvM are in Table 7. As follows from the CoM principle (Section 2.3), the results in Table 7 are given in mm.
It is clear from Table 7 that the mean values of measurements do not have the same value. Maximum variability for expression is the standard deviation (sd) of 0.20 mm. Another indicator of variability is the range. The skewness indicator describes the skewing of selections. In cases of measurements in the direction of the Y axis, when the hypothesis of a normal distribution of sets was rejected, high values of this indicator can be observed. The kurtosis indicator should be approximately 0. Negative values less than –1 indicate that the frequency distribution curve is too flat. Positive values indicate that the point density is too high. The minimum, maximum and median are shown by the box graphs in Figure 13, Figure 14 and Figure 15.
For measurements in the direction of the X axis (Figure 13), for Arm I—AdM and Arm I—CvM, a significant decrease in the median position of the arm showed when changing the load from 0 kg to 1 kg and a slight decrease in median position is still visible when changing the load from 1 kg to 2 kg. The variability of measurements in the direction of the X axis evaluated by range and standard deviation sd is highest for the measurement AdM_CoM_1_Xx. With both types of arm, the robot arm decreases in the X-axis direction as the load increases.
For the measurement in the direction of the Y axis (Figure 14), for Arm I—AdM, there is a significant increase in the median position when changing the load from 0 kg to 1 kg and a slight decrease in the median position when changing the load from 1 kg to 2 kg. Arm I—CvM shows a significant decrease in the median position when changing the load from 0 kg to 1 kg, and a slight decrease in the median position when changing the load from 1 kg to 2 kg. The highest range is for measurements in the direction of the Y axis for CvM_CoM_2_Yy, namely range 0.44 mm and standard deviation sd of 0.14 mm.
For measurements in the direction of the Z axis (Figure 15), for Arm I—AdM, there is a significant increase in the median position when changing the load from 0 kg to 1 kg and slightly decreasing in the median position when changing the load from 1 kg to 2 kg. Arm I—CvM shows a slight decrease in the median position when changing the load from 0 kg to 1 kg and a slight decrease in the median position when changing the load from 1 kg to 2 kg. The range in the direction of the Z axis is the largest for measurement AdM_CoM_2_Zz, namely the range up to 0.71 mm and the standard deviation sd of 0.20 mm. Figure 13, Figure 14 and Figure 15 show that both Arm I—AdM and Arm I—CvM, without load, will reach a different position than when measuring with load. The resulting increase in the position of the robotic arm in the Z axis direction using Arm I—AdM with respect to Arm I—CvM, is caused by springing of the Arm I—AdM structure.

3.2.2. NcM Descriptive Statistics

Descriptive one-dimensional NcM position and variability statistics for Arm I—AdM and Arm I—CvM are in Table 8. As follows from the CoM principle (Section 2.3), the results in Table 5 are given in mm.
From Table 8 and Figure 16, for Arm I—AdM measurements in the direction of the X axis, it is possible to observe a higher value of mean and lower range and standard deviation sd when the load is increased to 1 kg; and range and standard deviation sd increased when the load was increased to 2 kg and the median shifted. For Arm I—CvM in the direction of the X axis, it is possible to observe a decrease in the median value as well as the mean when the load increases, and at the same time a decrease of range and standard deviation sd. This follows from the above behavior of the position of the robotic arm Arm I—AdM and Arm I—CvM and is due to the rigidity of the sensor holder.
From Table 8 and Figure 17, for Arm I—AdM, measurements in the Y axis direction, an increase in the median value can be observed as the load increases and the range and standard deviation sd change slightly. For Arm I—CvM in the direction of the Y axis, it is possible to observe an increase in the median and the mean with increasing load, while the range and standard deviation sd is higher at higher loads. Failure to meet the condition of normal distribution of measured values is also confirmed by anomalies in Figure 17, at the same time, the stress caused by the construction of Arm I—AdM needs to be considered.
From Table 8 and Figure 18, for Arm I—AdM measurements in the direction of the Z axis, it can be observed that the median value always decreased and the range changed slightly due to the increase in load. For Arm I—CvM in the direction of the Z axis, it is possible to observe that the median value and the mean oscillate with increasing load and the range is not always the same. The expected course, met by Arm I—AdM, is caused by the interruption of the Arm I—AdM suspension, and at the same time suspension of the sensor holder. The increase in Arm I—CvM at 2 kg load was again caused only by the springing of the sensor holder.
Presented results indicate a statistical significance of differences in positions of the robotic arm endpoint for Arm I—AdM and Arm I—CvM, in position and variability. Since values in the table and the graph are in micrometers, these differences are negligible from a practical point of view. For further investigation, it would be appropriate to plan experimental measurements to better examine whether the differences are random or caused by a factor that has not yet been considered. This was affected by: arm flexibility, loading time, movement time of the robotic arm, sensitivity of the proximity sensor and rigidity of the sensor holder.
Due to the fact that the production documentation of Arm I—AdM and Arm I—CvM contained dimensional tolerances in micrometers and was observed, the position shift could occur during the mutual exchange, disassembly and assembly of Arm I—AdM for Arm I—CvM.

3.2.3. Comparison of Arm I—AdM and Arm I—CvM Measurement Pairs

Table 9 shows the results of the F test and the t-test for CoM. It is clear from Table 9 that no match of the mean values is confirmed for any pair. In four cases, for the CoM_0_Zz, CoM_1_Zz, CoM_2_Xx and CoM_2_Yy modes, the agreement of the variances is confirmed.
Table 10 shows the results of the F test and the t-test for NcM.
It is clear from Table 10 that no agreement of the mean values is confirmed for any pair. In six cases, for NcM_0_Y, NcM_0_Z, NcM_1_Y, NcM_2_Y, NcM_2_Z, and NcM_2_X modes, the variance agreement is confirmed. The test results in Table 9 and Table 10 confirm that Arm I—AdM and Arm I—CvM are not interchangeable in this study.

4. Conclusions

The proposed methodology for measuring of robotic arm positioning accuracy was verified on its construction consisting of three arms Arms I, II, III, while Arm I was manufactured by two different technologies AdM and CvM. A series of repeated measurements was performed for each robotic arm configuration with two different measurement methods, CoM and NcM. The results of measurements were verified by statistical methods, based on which unsatisfactory values of measurements were excluded from the evaluation.
The use of proposed methodology is not only in the field of metrology and testing, but also to verify the interchangeability of components in construction of robotic systems. The methodology provides a detailed view of a dimensional chain quality of the robotic arm structure and determines conditions for maintaining accuracy during disassembly and reassembly of individual components of robotic system structures.
Statistical evaluation of the results verified that the data obtained were measured correctly and have a normal distribution.
For CoM with the same load of Arm I—AdM and Arm I—CvM:
  • homoscedasticity was confirmed for: CoM_0_Zz, CoM_1_Zz, CoM_2_Xx and CoM_2_Yy;
  • the conformity of the mean values has not been confirmed.
This means that for interchangeable Arm I it is necessary to modify the design of ArM I—AdM.
For NcM with the same load of Arm I—AdM and Arm I—CvM:
  • homoscedasticity was confirmed for: NcM_0_Y, NcM_1_Y, NcM_2_Y, NcM_0_Z, NcM_2_Z;
  • the conformity of the mean values for NcM_2_X has been confirmed.
This means that for mutually interchangeable Arm I—AdM, Arm I—CvM, to increase its rigidity, the structural design of the sensor holder must be modified.
Considering the results obtained, the paper follows up the work of Zhang and Wei [26]. The authors addressed the accuracy of robotic arm positioning in their work, too. However, they did it from the point of view of its control system. A similar issue is also covered in the work of Clitan and Ionut [27]. The authors also focus on accuracy of robotic arm positioning. Specifically, they dealt in detail with its payload. Another paper focusing on this issue is by Visan et al. [28]. Even in this case, the problem of robotic arm positioning accuracy was solved in detail. In this case, however, the research was focused on stepper motors that implement the positioning of the robotic arm. It follows from the above examples that the presented research brings a new area of research to the issue of positioning the robotic arm, which needs to be further addressed in order to further expand the knowledge that can be transferred to the application.
Joubair et al. [16] is another paper that dealt with positioning accuracy. The authors took a closer look at the calibration procedure, where a simple low-cost procedure improves the accuracy of surface positioning. This is the issue similar to one presented in the article. The difference is mainly that the authors used a two-arm robot, compared to our researched single-arm robotic arm.
The following contributions also deal with the calibration of the robotic arm. In our paper, the proximity sensor MTN/EP080 Probe was used for NcM. Aoyagi et al. [29] used a laser-tracking system to calibrate the kinematic parameters of the robotic arm, which achieves high positioning accuracy using a genetic algorithm.
Švaco et al. [30] used a contactless method to perform measurements of calibration points in space, using a stereovision system attached to the robot arm. This method is very similar to the NcM for which the MTN/EP080 Probe proximity sensor was used. Points (represented as spheres localized by a stereo system) are projected by the authors as circles in two planes of image capturing, regardless of the angle of view. The positioning error after calibration has been reduced to 1.29 mm.
Peng et al. [31] proposed their own method of geometric parameters‘ calibration of a kinematic model of a robotic arm, based on monocular vision. Similar to our paper, they used the contactless method, while in measuring accuracy of the robotic arm positioning in our paper, the CoM was also used, in which it was necessary to set the reference–calibration Cartesian coordinate system. Peng et al., to determine the kinematic parameters, first used the classical Denavit–Hartenberg (D–H) modeling method. Subsequently, they implemented nonlinear optimization and parameter compensation. Their method improved the absolute accuracy of positioning the end of the robotic arm while being universal and effective, similar to the CoM method in our paper.
Due to confirmed differences in positions for the same measured axis in different types of arm, we assume that Arm I—AdM, Arm I—CvM or an arm made by different technology may have dimensional deviations. From previous observations and calculations, for the research of other factors influencing the localization of the robotic arm position, these deviations in dimensions need to be eliminated.
Based on the results, we can conclude that production technology does not affect the positioning accuracy of the robotic arm, but the design of Arm I—AdM needs to be changed regardless of the operating load.
To further investigate, it will be appropriate to plan experimental measurements to better examine whether differences in a position of the robot arm are random or caused by loads or other factors that have not been taken into account (arm flexibility, load time, transport time, programmed trajectory of the robot arm etc.). The answer to the question will be known after analysis of accuracy of measured positions for Arm I—AdM and Arm I—CvM, depending on the measurement directions (X, Y, Z) and the load.
In the future, to increase the accuracy of measurement process, it will be necessary to use the proximity sensor MTN/EP080 Probe with higher sensitivity and to increase rigidity of the proximity sensor holder. Furthermore, we will need to ensure the same position of the sensor holder for Arm I—AdM, Arm I—CvM on the robotic arm.

Author Contributions

P.M. and P.T. conceived and designed the experiments. J.M. performed the experiments. B.S. analyzed the data. V.M. and G.F. wrote the paper. All authors have read and agreed to the published version of the manuscript.

Funding

This research was funded by The Ministry of Education, Science, Research and Sport of the Slovak Republic (Grant numbers VEGA 1/0045/18, VEGA 1/0403/18, VEGA 1/0600/20, VEGA 1/0264/21), Cultural and Educational Grant Agency of the Ministry of Education, Science, Research and Sport of the Slovak Republic (Grant numbers KEGA 012TUKE-4/2019, KEGA 013TUKE-4/2019) and The Slovak Research and Development Agency (Grant number APVV SK-SRB-18-0053).

Conflicts of Interest

The authors declare that they have no conflict of interest.

Nomenclature

AdMmade by additive manufacturing
CvMmade by CNC (computer numerical control) milling
CoMContact measuring Method
D test statisticstest statistics Kolmogorov–Smirnov test
maxmaximum
minminimum
NcMNon-contact measuring Method
p valueprobability that the null hypothesis is true
p teststatistics Pearson chi-square test
sdstandard deviation
W test statisticsShapiro–Wilk test
XxX_YyY_L_Ameasurement regime with marking:
XxXManufacturing technology, [AdM or CvM]
YyYMeasuring method, [CoM or NcM]
Lload [0 kg or 1kg or 2 kg]
Ameasuring axis [X or Y or Z]
Marking examples:
AdM_CoM_0_Xx“made by additive manufacturing, CoM measurement, load 0 kg, measuring axis X”
CvM_CoM_2_Zz“made by CNC milling, CoM measurement method, load 2 kg, measuring axis Z”
AdM_NcM_0_X“made by additive manufacturing, NoC measurement method, load 0 kg, measuring axis X”
CvM_NcM_2_Z“made by CNC milling, NoC measurement method, load 2 kg, measuring axis Z”

References

  1. Barbosa, W.S.; Gioia, M.M.; Natividade, V.G.; Wanderley, R.F.F.; Chaves, M.R.; Gouvea, F.C.; Gonçalves, F.M. Industry 4.0: Examples of the use of the robotic arm for digital manufacturing processes. Int. J. Interact. Des. Manuf. 2020, 14, 1569–1575. [Google Scholar] [CrossRef]
  2. Angeles, J. Fundamentals of Robotic Mechanical Systems: Theory, Methods, and Algorithms, 2nd ed.; Springer: New York, NY, USA, 2003; ISBN 978-0-387-22458-9. [Google Scholar]
  3. Reza, N. Theory of Applied Robotics: Kinematics, Dynamics, and Control, 2nd ed.; Springer: New York, NY, USA, 2010; ISBN 978-1-4419-1749-2. [Google Scholar]
  4. Covaciu, F.; Filip, D. Design and manufacturing of a 6 degree of freedom robotic arm. Acta Tech. Napoc. Ser. Math. Mech. Eng. 2019, 62, 107–114. [Google Scholar]
  5. Gordaninejad, F.; Vaidyaraman, S. Active and passive control of a revolute-prismatic flexible composite-material robot arm. Comput. Struct. 1994, 53, 867–875. [Google Scholar] [CrossRef]
  6. Gibson, I.; Rosen, D.W.; Stucker, B. Additive Manufacturing Technologies; Springer: Boston, MA, USA, 2010; ISBN 978-1-4419-1119-3. [Google Scholar]
  7. Ishak, I.; Larochelle, P. Robot Arm Platform for Additive Manufacturing: 3D Lattice Structures. In Proceedings of the 30th Florida Conference on Recent Advances in Robotics, Florida Atlantic University, Boca Raton, FL, USA, 11–12 May 2017; pp. 1–5. [Google Scholar]
  8. Hajash, K.; Sparrman, B.; Guberan, C.; Laucks, J.; Tibbits, S. Large-scale rapid liquid printing. 3D Print. Addit. Manuf. 2017, 4, 123–131. [Google Scholar] [CrossRef] [Green Version]
  9. Mick, S.; Lapeyre, M.; Rouanet, P.; Halgand, C.; Benois-Pineau, J.; Paclet, F.; Cattaert, D.; Oudeyer, P.Y.; De Rugy, A. Reachy, a 3D-printed human-like robotic arm as a testbed for human-robot control strategies. Front. Neurorobot. 2019, 13, 1–12. [Google Scholar] [CrossRef] [PubMed] [Green Version]
  10. Junia Santillo Costa, J.; Lajovic Carneiro, M.; Antonio Urzedo Machado, T. Implementation and Validation of Thor 3D Printed Open Source Robotic Arm. IEEE Lat. Am. Trans. 2020, 18, 907–913. [Google Scholar] [CrossRef]
  11. Ismail, M.H.; Qi, A.N.W.; Voon, K.L.; Ismail, M.A.; Mustaffa, N. Design and development of a mechanism of robotic arm for lifting Part5. In Proceedings of the 2nd Integrated Design Project Conference (IDPC), Universiti Malaysia Pahang, Gambang, Malaysia, 11 December 2015; pp. 1–15. [Google Scholar]
  12. Wang, J.; Xiao, X.; Huang, Z.; Melzer, A. 3D-printing based Transducer Holder for Robotic Assisted Ultrasound Guided HIFU. Procedia Manuf. 2019, 30, 3–10. [Google Scholar] [CrossRef]
  13. Kluz, R.; Trzepieciński, T. The repeatability positioning analysis of the industrial robot arm. Assem. Autom. 2014, 34, 285–295. [Google Scholar] [CrossRef]
  14. Elvira-Ortiz, D.A.; De Romero-Troncoso, R.J.; Jaen-Cuellar, A.Y.; Morales-Velazquez, L.; Osornio-Rios, R.A. Vibration Suppression for Improving the Estimation of Kinematic Parameters on Industrial Robots. Shock Vib. 2016, 2016. [Google Scholar] [CrossRef]
  15. Rodriguez-Donate, C.; Osornio-Rios, R.A.; Rivera-Guillen, J.R.; Romero-Troncoso, R.D.J. Fused smart sensor network for multi-axis forward kinematics estimation in industrial robots. Sensors 2011, 11, 4335–4357. [Google Scholar] [CrossRef] [PubMed] [Green Version]
  16. Joubair, A.; Slamani, M.; Bonev, I.A. Kinematic calibration of a five-bar planar parallel robot using all working modes. Robot. Comput. Integr. Manuf. 2013, 29, 15–25. [Google Scholar] [CrossRef]
  17. Kluz, R.; Kubit, A.; Trzepiecinski, T. Investigations of temperature-induced errors in positioning of an industrial robot arm. J. Mech. Sci. Technol. 2018, 32, 5421–5432. [Google Scholar] [CrossRef]
  18. Kagermann, H.; Wahlster, W.; Helbig, J. Securing the future of German manufacturing industry: Recommendations for implementing the strategic initiative INDUSTRIE 4.0. Final. Rep. Ind. 2013, 4, 1–84. [Google Scholar]
  19. Matheson, E.; Minto, R.; Zampieri, E.G.G.; Faccio, M.; Rosati, G. Human-robot collaboration in manufacturing applications: A review. Robotics 2019, 8, 100. [Google Scholar] [CrossRef] [Green Version]
  20. Villani, V.; Pini, F.; Leali, F.; Secchi, C. Survey on human–robot collaboration in industrial settings: Safety, intuitive interfaces and applications. Mechatronics 2018, 55, 248–266. [Google Scholar] [CrossRef]
  21. Ballestar, M.T.; Díaz-Chao, Á.; Sainz, J.; Torrent-Sellens, J. Knowledge, robots and productivity in SMEs: Explaining the second digital wave. J. Bus. Res. 2020, 108, 119–131. [Google Scholar] [CrossRef]
  22. Patalas-Maliszewska, J.; Krebs, I. Decision model for the use of the application for knowledge transfer support in manufacturing enterprises. In Lecture Notes in Business Information Processing; Springer International Publishing AG: Cham, Switzerland, 2015; Volume 228, pp. 48–55. ISBN 9783319267616. [Google Scholar]
  23. GE ADDITIVE MACHINES. Available online: https://www.ge.com/additive/additive-manufacturing/machines/dmlm-machines/x-line-2000r (accessed on 3 May 2021).
  24. Direct INDUSTRY. Available online: https://www.directindustry.com/prod/thome-praezision/product-24606-405507.html (accessed on 3 May 2021).
  25. AMC VIBRO. Available online: https://amcvibro.com/product/mtn-ep080-probe/ (accessed on 3 May 2021).
  26. Zhang, D.; Wei, B. Payload variation compensation for robotic arms through model reference control approach. Int. J. Robot. Autom. 2016, 31, 530–538. [Google Scholar] [CrossRef]
  27. Clitan, I.; Ionut, M. Internal model control for a hydraulically driven robotic arm. In Proceedings of the 2014 IEEE International Conference on Automation, Quality and Testing, Robotics, Cluj-Napoca, Romania, 22–24 May 2014; pp. 5–9. [Google Scholar] [CrossRef]
  28. Visan, D.A.; Lita, I.; Cioc, I.B. Wireless control system for angular positioning applications. In Proceedings of the 2013 IEEE 19th International Symposium for Design and Technology in Electronic Packaging (SIITME), Galati, Romania, 24–27 October 2013; pp. 103–106. [Google Scholar] [CrossRef]
  29. Aoyagi, S.; Suzuki, M.; Takahashi, T.; Fujioka, J.; Kamiya, Y. Calibration of kinematic parameters of robot arm using laser tracking system: Compensation for non-geometric errors by neural networks and selection of optimal measuring points by genetic algorithm. Int. J. Autom. Technol. 2012, 6, 29–37. [Google Scholar] [CrossRef]
  30. Švaco, M.; Šekoranja, B.; Šuligoj, F.; Jerbić, B. Calibration of an industrial robot using a stereo vision system. Procedia Eng. 2014, 69, 459–463. [Google Scholar] [CrossRef] [Green Version]
  31. Peng, G.; Wang, Z.; Yang, J.; Li, X. A visual kinematics calibration method for manipulator based on nonlinear optimization. arXiv 2020, arXiv:2005.08420. [Google Scholar]
Figure 1. Robot with angular workspace (dimensions in mm).
Applsci 11 06104 g001
Figure 2. Arm I—additive manufacturing (AdM) made on 3D printer Xline 2000R.
Applsci 11 06104 g002
Figure 3. Arm I—CNC milling (CvM) made on CNC machine Pinnacle VMC 650S.
Applsci 11 06104 g003
Figure 4. Contact measuring method (CoM) of robotic arm’s position using a 3D measuring machine.
Applsci 11 06104 g004
Figure 5. Measuring chain for CoM of robotic arm’s position.
Applsci 11 06104 g005
Figure 6. Non-contact measuring method (NcM) of robotic arm’s position deviation using a proximity sensor in the direction of the X, Y, Z axis.
Applsci 11 06104 g006
Figure 7. Measuring chain for NcM of robotic arm’s position deviation.
Applsci 11 06104 g007
Figure 8. NcM of robotic arm’s position deviation with Arm I—AdM and Arm I—CvM.
Applsci 11 06104 g008
Figure 9. Procedure for measuring and evaluation of a robotic arm’s position deviation.
Applsci 11 06104 g009
Figure 10. Causes and effects diagram.
Applsci 11 06104 g010
Figure 11. Size of deformation in the direction of axis Z for AdM_NcM, determined by the experimental measurement with the load of 1 kg.
Applsci 11 06104 g011
Figure 12. Size of deformation in the direction of axis Z for CvM_NcM, determined by FEM calculation, under self-weight loading.
Applsci 11 06104 g012
Figure 13. Measurements of CoM axis X.
Applsci 11 06104 g013
Figure 14. Measurements of CoM axis Y.
Applsci 11 06104 g014
Figure 15. Measurements of CoM axis Z.
Applsci 11 06104 g015
Figure 16. Measurements of NcM axis X.
Applsci 11 06104 g016
Figure 17. Measurements of NcM axis Y.
Applsci 11 06104 g017
Figure 18. Measurements NcM axis Z.
Applsci 11 06104 g018
Table 1. Chemical composition according to EN573-3.
SchemeFe [%]Cu [%]Mn [%]Mg [%]Cr [%]Zn [%]Ti [%]Others [%]
max.max.max. max.max.max.max.
0.400.400.100.40 ÷ 1.00.40 ÷ 4.90.05 ÷ 0.250.250.150.050.15
Table 2. Physical-mechanical properties according to EN573-3.
Fm [N]Rp0.2 [MPa]Rm [MPa]Fmax [N]a [mm]b [mm]E [GPa]
884119824288402.96012.353.738
Table 3. Size of deformation in the direction of axis Z for AdM_NcM, determined by the experimental measurement.
Working Load [kg]Deformation [mm]
00.175
10.155
20.075
Table 4. Size of deformation in the direction of axis Z for CvM_NcM, determined by experimental measurement.
Working Load [kg]Deformation [mm]
00.153
10.041
20.120
Table 5. CoM normality test.
MeasurementShapiro-Wilk StatisticsNormal Distribution Result
AdM_CoM_0_XxW = 0.8942, p-value = 0.1568not reject
AdM_CoM_0_YyW = 0.92155, p-value = 0.3317not reject
AdM_CoM_0_ZzW = 0.94601, p-value = 0.5935not reject
AdM_CoM_1_XxW = 0.9363, p-value = 0.478not reject
AdM_CoM_1_YyW = 0.95938, p-value = 0.7639not reject
AdM_CoM_1_ZzW = 0.88907, p-value = 0.1354not reject
AdM_CoM_2_XxW = 0.86257, p-value = 0.06217not reject
AdM_CoM_2_YyW = 0.90804, p-value = 0.2312not reject
AdM_CoM_2_ZzW = 0.91918, p-value = 0.3119not reject
CvM_CoM_0_XxW = 0.87682, p-value = 0.0948not reject
CvM_CoM_0_YyW = 0.96168, p-value = 0.7925not reject
CvM_CoM_0_ZzW = 0.92054, p-value = 0.3232not reject
CvM_CoM_1_XxW = 0.87293, p-value = 0.08454not reject
CvM_CoM_1_YyW = 0.93015, p-value = 0.4123not reject
CvM_CoM_1_ZzW = 0.92542, p-value = 0.3664not reject
CvM_CoM_2_XxW = 0.95298, p-value = 0.6823not reject
CvM_CoM_2_YyW = 0.96823, p-value = 0.8682not reject
CvM_CoM_2_ZzW = 0.9256, p-value = 0.3681not reject
Table 6. NcM normality test.
MeasurementStatistics
Shapiro-WilkKolmogorov-Smirnov/
Pearson Chi-Square
Normal Distribution
AdM_NcM_0_XW = 0.85477, p-value = 0.04924D = 0.21081, p-value = 0.1872not reject
AdM_NcM_0_YW = 0.93381, p-value = 0.4506 not reject
AdM_NcM_0_ZW = 0.93928, p-value = 0.5121 not reject
AdM_NcM_1_XW = 0.95168, p-value = 0.6655 not reject
AdM_NcM_1_YW = 0.93625, p-value = 0.4775 not reject
AdM_NcM_1_ZW = 0.92879, p-value = 0.3988 not reject
AdM_NcM_2_XW = 0.85927, p-value = 0.05633 not reject
AdM_NcM_2_YW = 0.90404, p-value = 0.2069 not reject
AdM_NcM_2_ZW = 0.9122, p-value = 0.2589 not reject
CvM_NcM_0_XW = 0.9326, p-value = 0.4377 not reject
CvM_NcM_0_YW = 0.88651, p-value = 0.1257 not reject
CvM_NcM_0_ZW = 0.86383, p-value = 0.06454 not reject
CvM_NcM_1_XW = 0.97466, p-value = 0.9293 not reject
CvM_NcM_1_YW = 0.72731, p-value = 0.001054D = 0.26732, p-value = 0.06298not reject
CvM_NcM_1_ZW = 0.92219, p-value = 0.3373 not reject
CvM_NcM_2_XW = 0.8197, p-value = 0.02513D = 0.24475, p-value = 0.09133not reject
CvM_NcM_2_YW = 0.98184, p-value = 0.9755 not reject
CvM_NcM_2_ZW = 0.85555, p-value = 0.05041 not reject
Table 7. CoM descriptive statistics for Arm I—AdM and Arm I—CvM.
MeasurementnMeanSdMedianMinMaxRangeSkewKurt
AdM_CoM_0_Xx11105.650.08105.67105.53105.750.22−0.29−1.70
AdM_CoM_1_Xx1198.780.2098.7998.4899.060.58−0.15−1.60
AdM_CoM_2_Xx1198.340.1498.3398.2098.640.440.87−0.49
AdM_CoM_0_Yy11256.670.05256.68256.60256.740.13−0.06−1.76
AdM_CoM_1_Yy11310.560.00310.56310.55310.560.010.03−1.41
AdM_CoM_2_Yy11310.240.10310.26310.05310.390.34−0.28−0.74
AdM_CoM_0_Zz11214.530.15214.52214.30214.810.520.36−0.69
AdM_CoM_1_Zz11238.990.09238.98238.88239.220.340.990.21
AdM_CoM_2_Zz11237.950.20237.93237.70238.400.710.71−0.08
CvM_CoM_0_Xx11112.840.00112.84112.84112.840.000.17−1.60
CvM_CoM_1_Xx11109.630.09109.69109.47109.740.27−0.36−1.58
CvM_CoM_2_Xx11109.510.18109.52109.28109.800.520.14−1.48
CvM_CoM_0_Yy11317.080.00317.08317.07317.080.010.51−0.69
CvM_CoM_1_Yy9310.540.11310.57310.26310.600.34−1.932.25
CvM_CoM_2_Yy10310.250.14310.31309.93310.360.44−1.350.34
CvM_CoM_0_Zz11265.820.16265.80265.60266.120.520.69−0.73
CvM_CoM_1_Zz11263.930.09263.96263.77264.040.26−0.34−1.40
CvM_CoM_2_Zz11262.460.07262.46262.31262.560.25−0.43−0.95
Table 8. Descriptive statistics NcM for Arm I—AdM and Arm I—CvM.
MeasurementsnMean [µm]Sd [µm]Median [µm]Min [µm]Max [µm]Range [µm]SkewnessKurtosis
AdM_NcM_0_X11212.6416.76208196240440.51−1.55
AdM_NcM_1_X11267.6410.00267251283320.16−1.21
AdM_NcM_2_X11295.2768.402622183901720.22−1.86
AdM_NcM_0_Y11342.3613.3234732136241−0.17−1.59
AdM_NcM_1_Y11424.4512.7542940144039−0.40−1.27
AdM_NcM_2_Y11468.0920.5947043849355−0.13−1.78
AdM_NcM_0_Z11332.5558.753502504251750.10−1.42
AdM_NcM_1_Z11253.2737.84250175330155−0.020.25
AdM_NcM_2_Z11150.7326.6015511018575−0.17−1.76
CvM_NcM_0_X11425.005.8142541643317−0.23−1.58
CvM_NcM_1_X11276.363.01276272282100.32−1.08
CvM_NcM_2_X10260.800.7926126026220.29−1.50
CvM_NcM_0_Y11207.917.57207200225250.86−0.30
CvM_NcM_1_Y9619.2220.5862956863264−1.631.33
CvM_NcM_2_Y11593.2729.1860054263896−0.17−1.27
CvM_NcM_0_Z11443.1844.35462339492153−1.070.07
CvM_NcM_1_Z11135.7313.3813211215341−0.07−1.36
CvM_NcM_2_Z11346.0048.34350289409120−0.10−1.86
Table 9. CoM F test and t-test.
MeasurementsF Test Statisticsp-ValueResultt Test Statisticsp ValueResult
CoM_0_Xx0.000506918.399 × 10−15reject290.89<2.2 × 10⁻¹⁶reject
CoM_0_Yy0.00442774.133 × 10−10reject4281<2.2 × 10⁻¹⁶reject
CoM_0_Zz1.13310.8472not reject793.81<2.2 × 10⁻¹⁶reject
CoM_1_Xx0.215010.02322reject163.92<2.2 × 10⁻¹⁶reject
CoM_1_Yy0.00993392.245 × 10−8reject164.76<2.2 × 10⁻¹⁶reject
CoM_1_Zz0.905690.8786not reject633.53<2.2 × 10⁻¹⁶reject
CoM_2_Xx1.60250.4691not reject163.31<2.2 × 10⁻¹⁶reject
CoM_2_Yy0.497940.2869not reject625.65<2.2 × 10⁻¹⁶reject
CoM_2_Zz0.137120.004215reject382.36<2.2 × 10⁻¹⁶reject
Table 10. NcM F test and t-test.
MeasurementsF Test Statisticsp-ValueResultt Test Statisticsp ValueResult
NcM_0_X0.120350.002481reject39.7062.012 × 10−14reject
NcM_0_Y0.322850.08889not reject−29.105<2.2 × 10⁻¹⁶reject
NcM_0_Z0.570040.3891not reject4.98487.117 × 10−5reject
NcM_1_X0.0904960.0007453reject2.77110.01717reject
NcM_1_Y2.6030.1582not reject25.9631.022 × 10−15reject
NcM_1_Z0.125030.002901reject−9.71353.587 × 10−7reject
NcM_2_X0.000132994.261 × 10−16reject−1.67140.1256not reject
NcM_2_Y2.00910.2866not reject11.6252.377 × 10−10reject
NcM_2_Z3.080.0731not reject11.7382.006 × 10−10reject
Publisher’s Note: MDPI stays neutral with regard to jurisdictional claims in published maps and institutional affiliations.

