3.1. Results of PLA-SEBS Blends
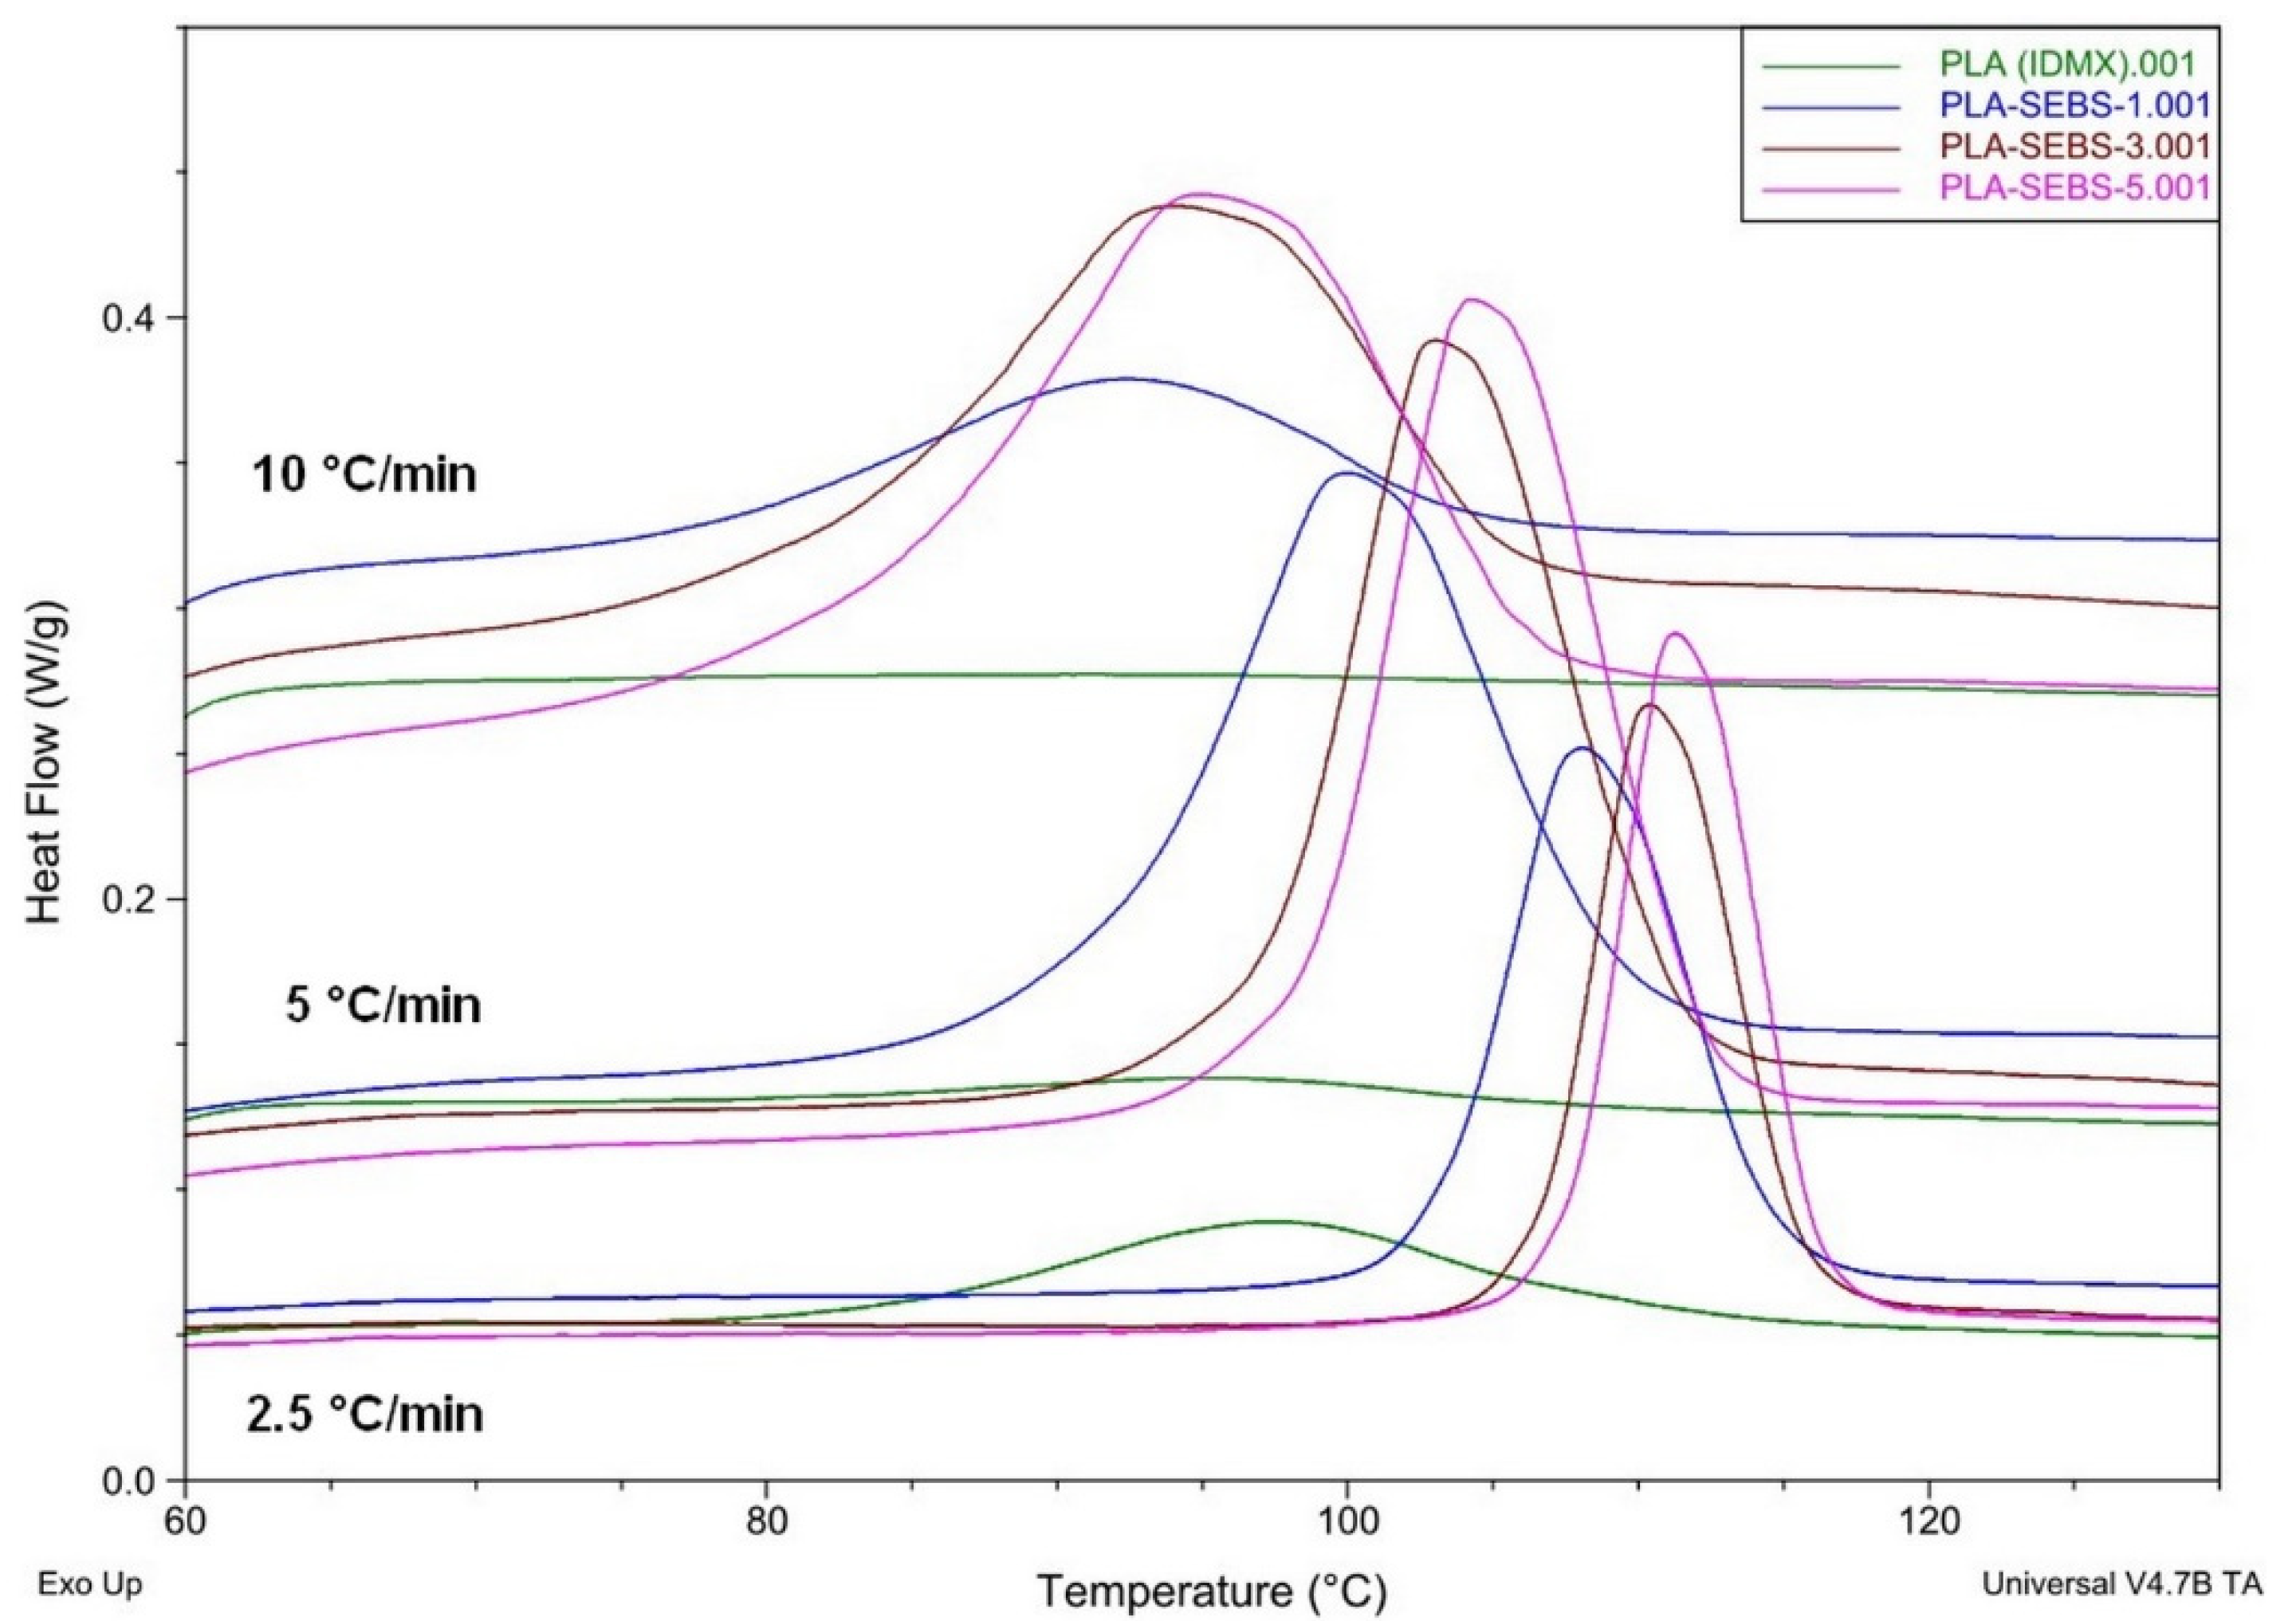
Figure 1 shows the results of the non-isothermal analysis, the effect of cooling rates on crystallization DSC curves at 0, 1, 3 and 5% SEBS contents. The samples are depicted in different colors.
The results of the anisothermal DSC analysis performed on the extruded fibers depict that as the cooling rates increased, the crystallization shifted to a lower temperature and the crystallization interval also widened. In PLA, the crystallization peak appeared clearly only at the slowest cooling rate, but its size was not significant compared to the others. As a result of SEBS, the crystallization peaks became clearly visible at each cooling rate, and as the SEBS content increased, the shape of the curves also changed, suggesting an alteration in the crystal structure. To demonstrate the nucleating effect of SEBS, the increase in the initial temperature of crystallization and in the heat of crystallization must be investigated.
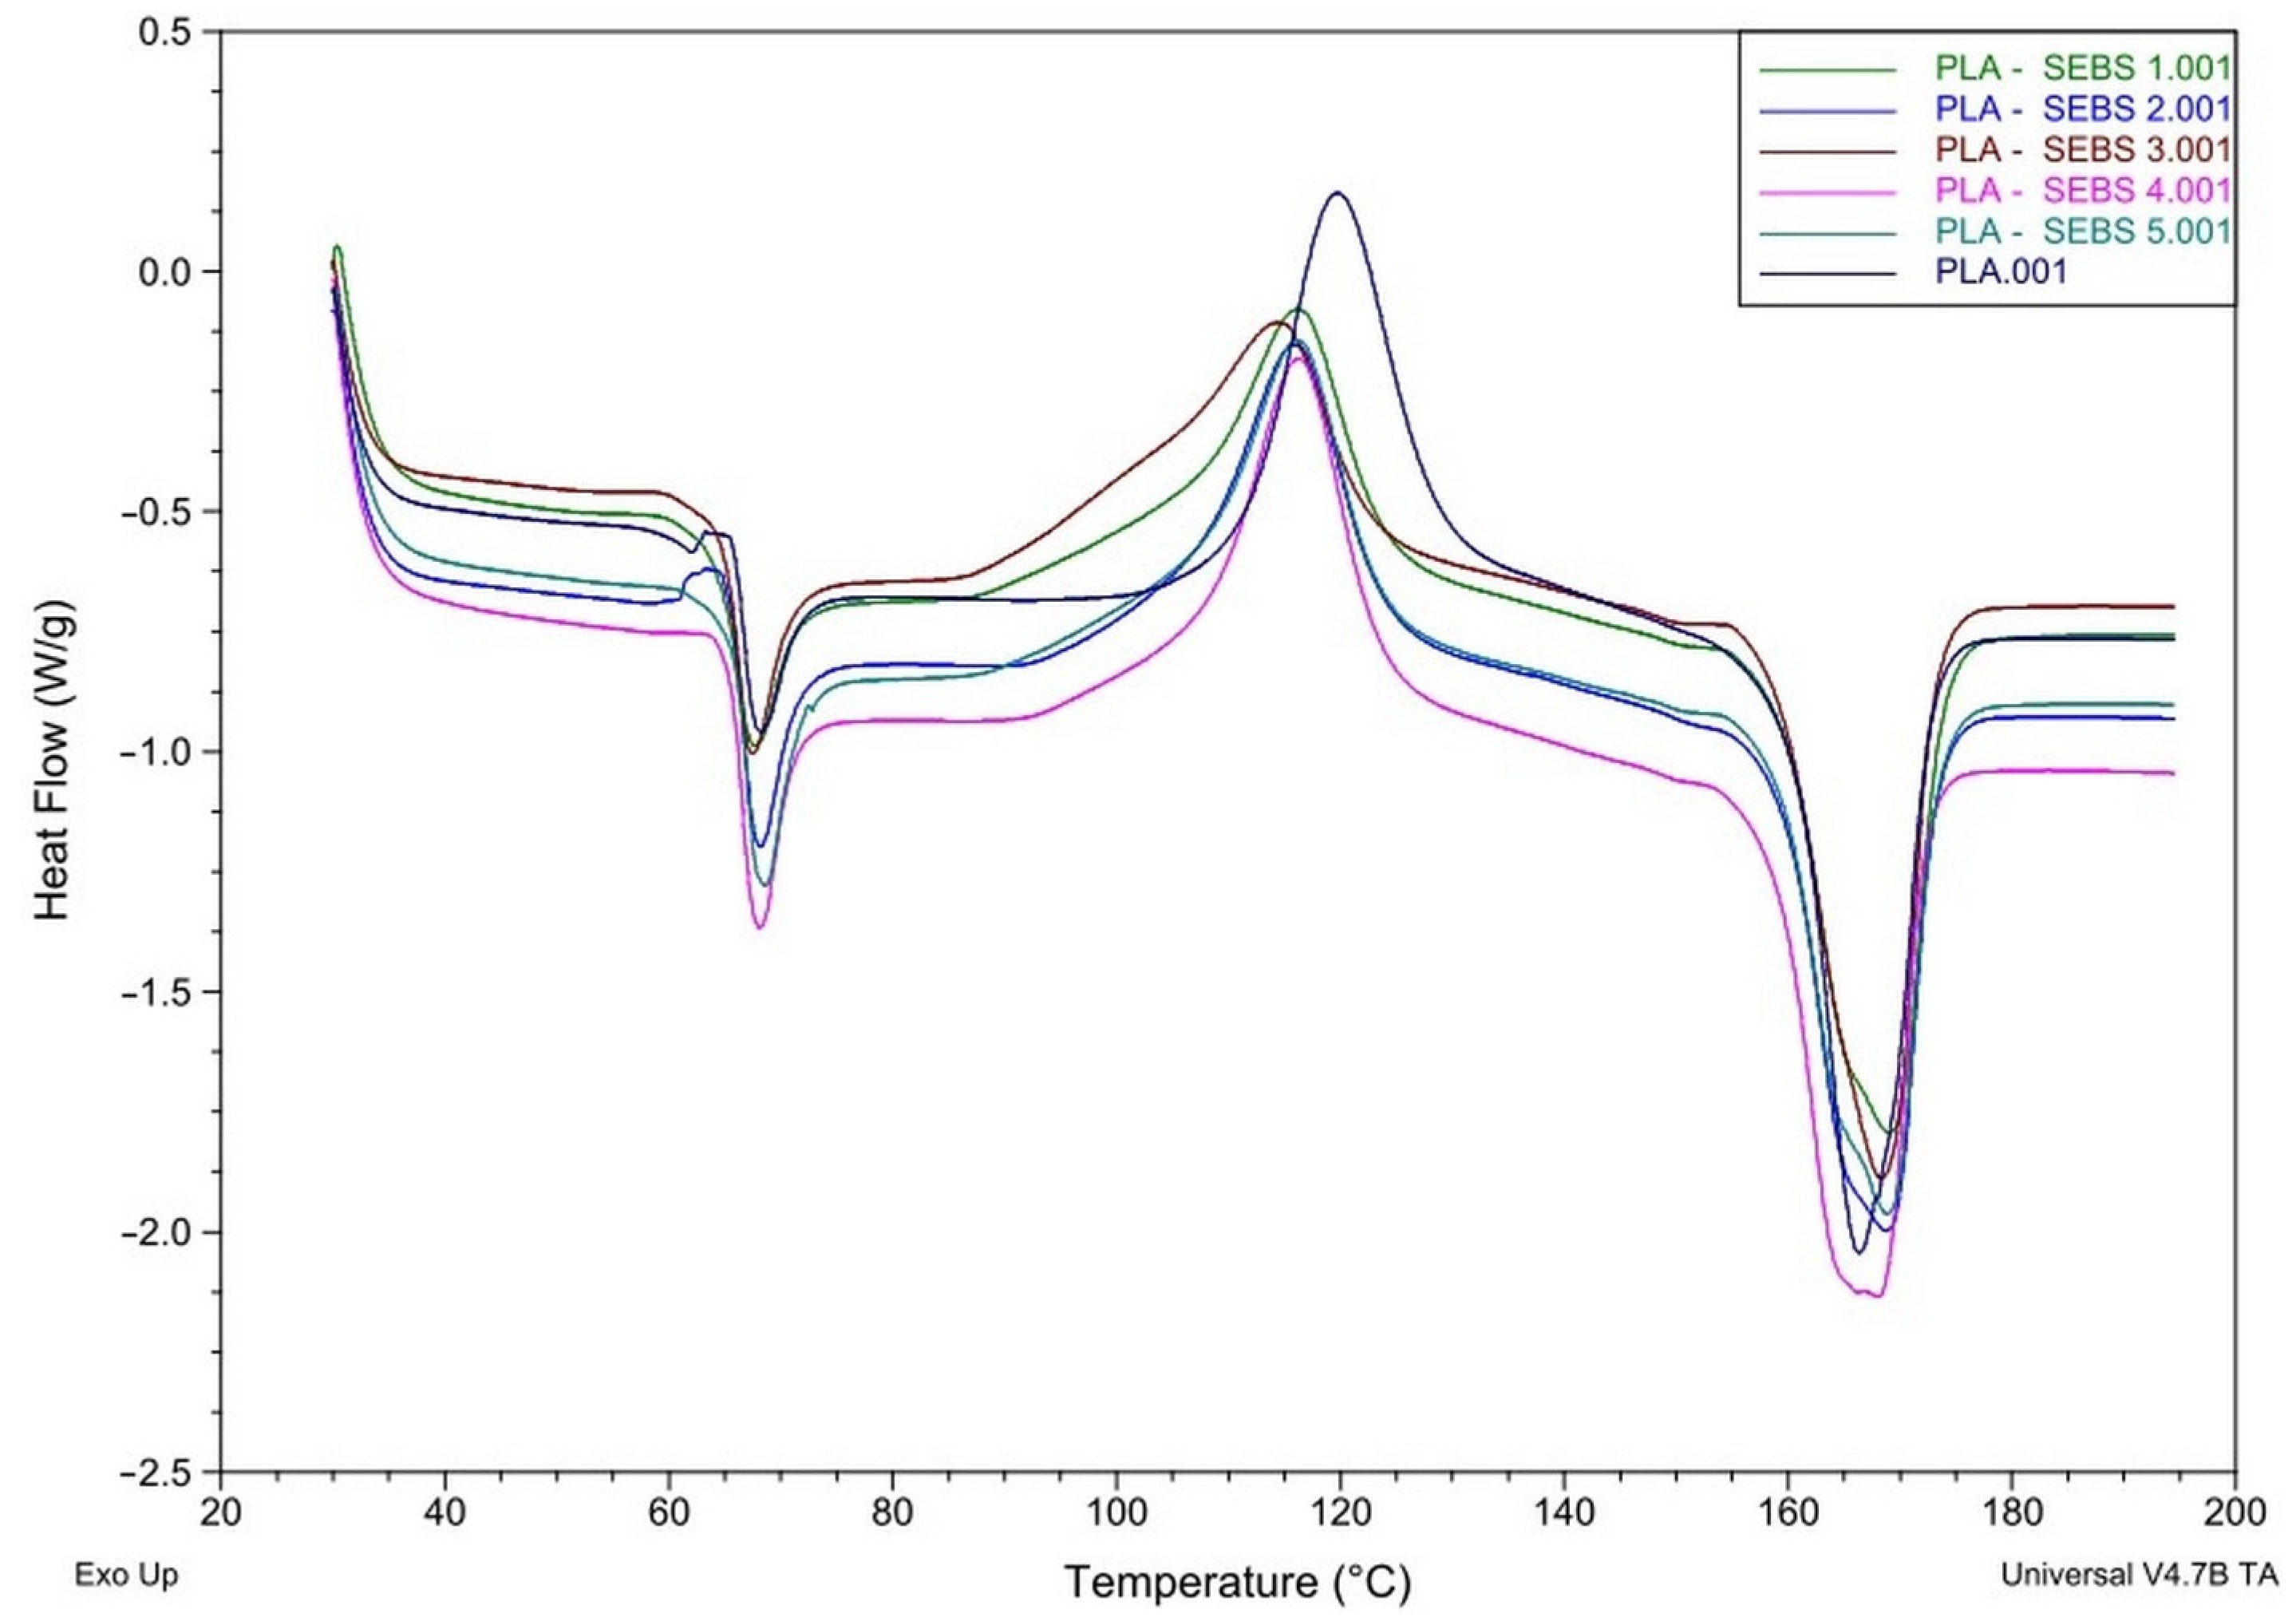
DSC analysis on the printed specimens shows that the cooling during printing was so fast for the PLA that it was able to generate only a few crystalline phases (
Figure 2). On the other hand, when it absorbed the heat from the heating, and passed through the glass transition temperature, the phenomenon of so-called cold crystallization started, i.e., the molecules began to rearrange, forming the missing crystalline phases. However, on further heating, melting occurred, where both the crystals originally formed and those formed during the heating melted. The analytical program subtracted the heat of cold crystallization from the heat of melting to obtain the number of crystals that the printed specimens had. The amount of crystalline phases has a serious effect on the mechanical properties of the finished product. The more crystals are formed, the higher the mechanical strength can be achieved, but the impact resistance decreases. In contrast, a decrease in the number of crystallites results in lower mechanical strength but better impact resistance. In the DSC curves obtained during melting, the peak represents the melting temperature of most crystals. During crystallization, the peak means reaching the maximum of the crystallization rate. In
Figure 2, the heating rate was 20 °C/min.
Figure 2 shows another peak around 60–70 °C, too. This area is the glass transition temperature of PLA; the peak here means the disappearance of the internal stress.
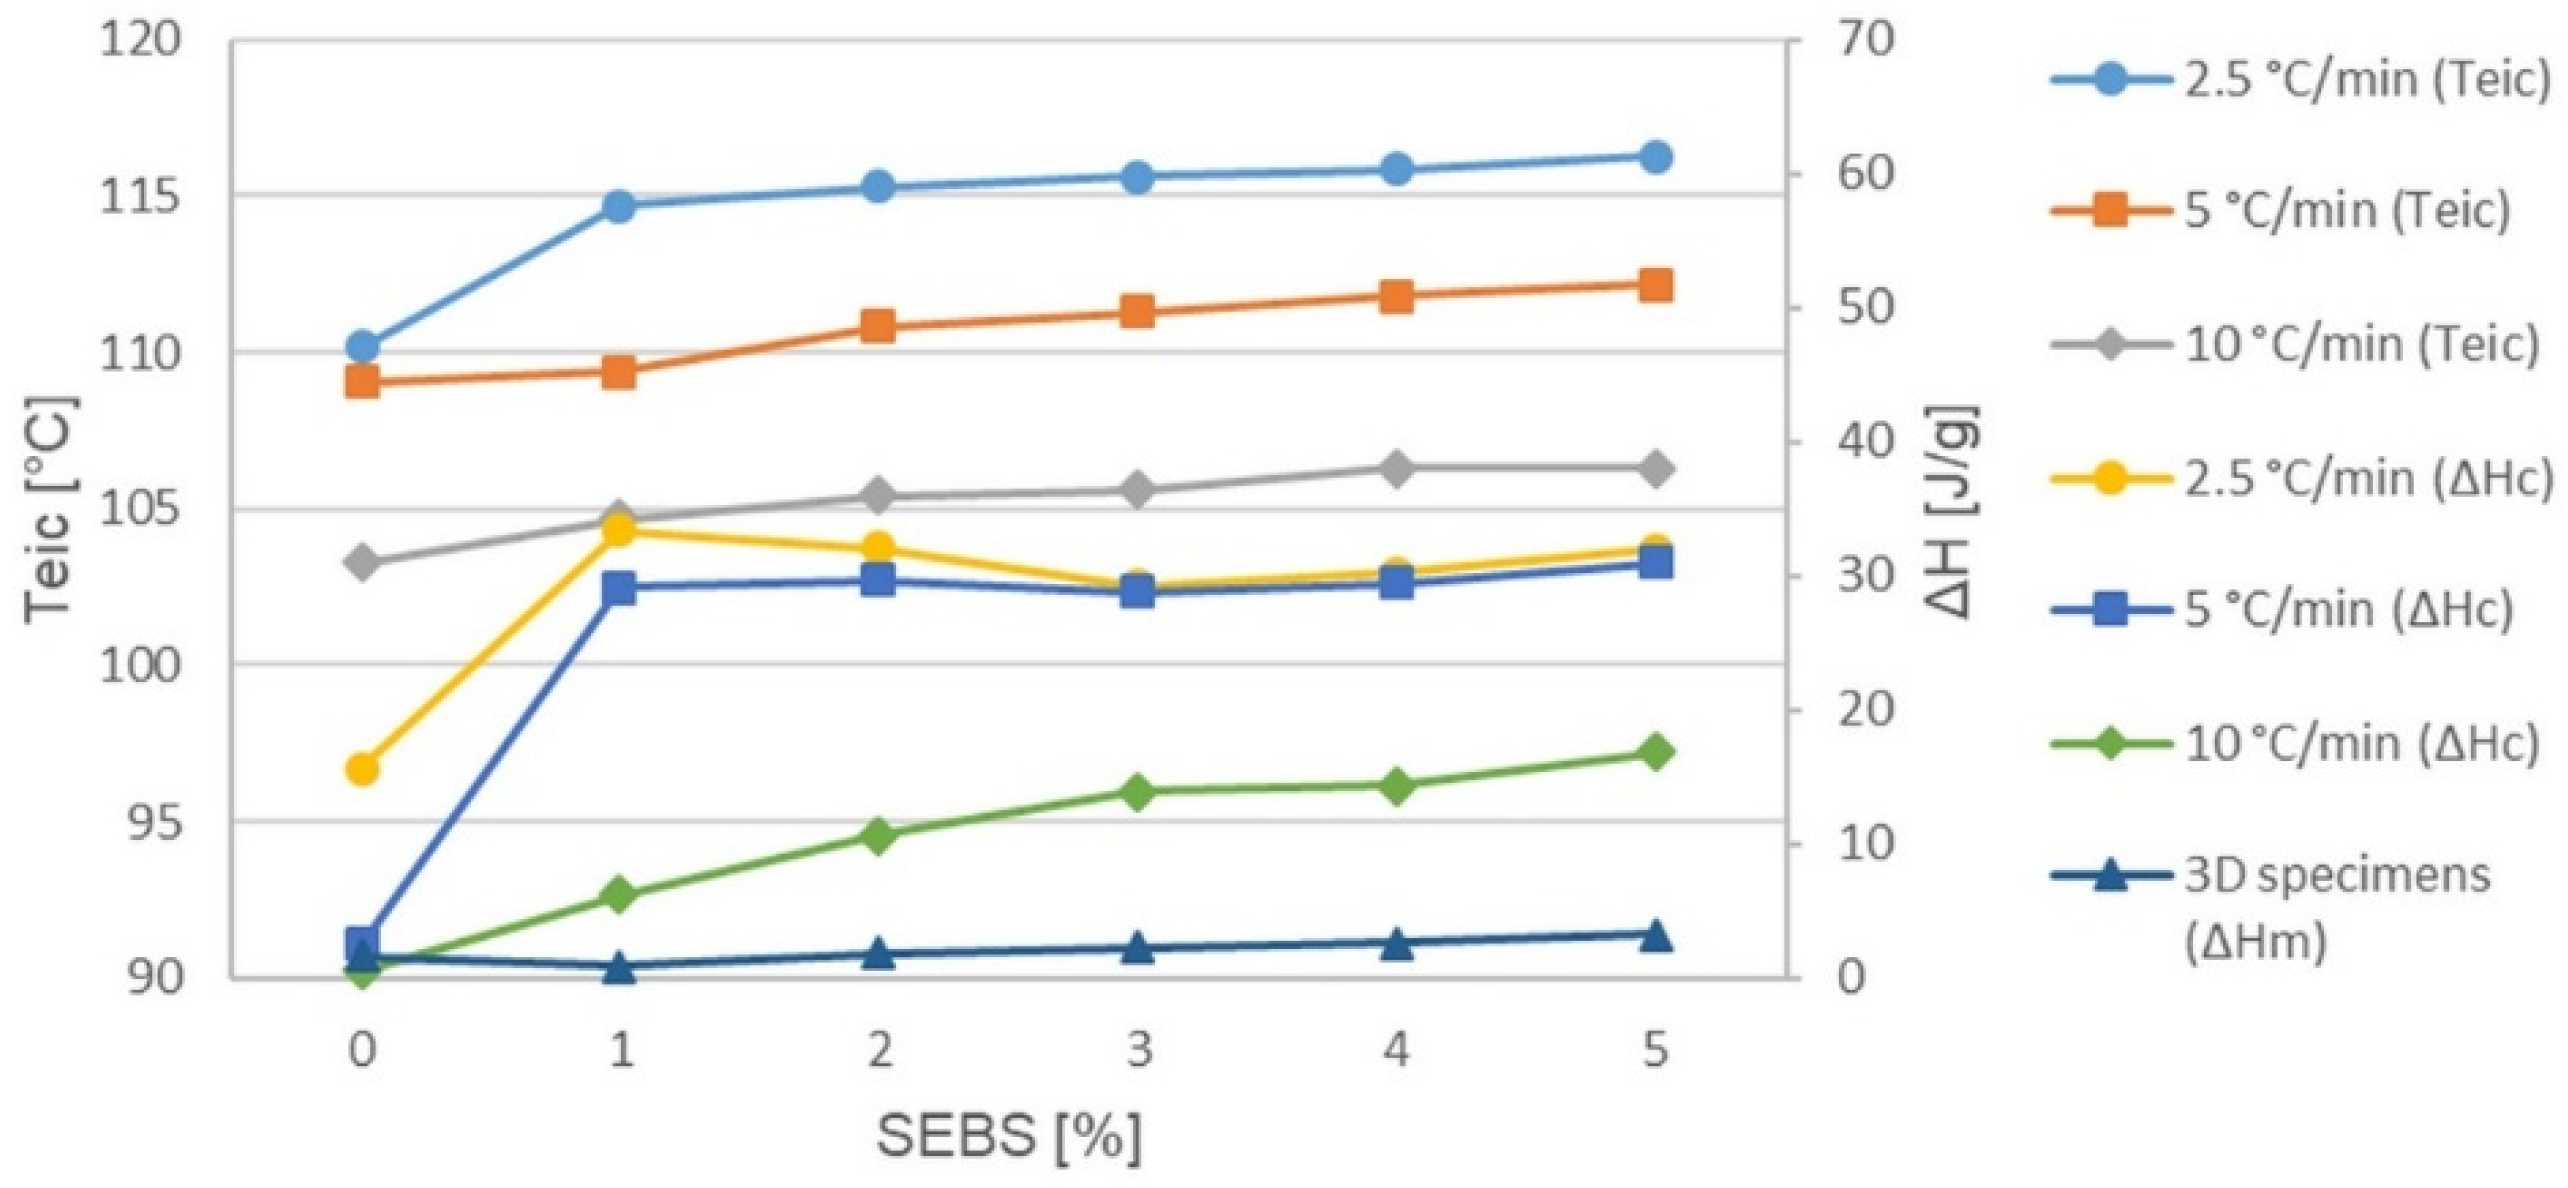
Figure 3 depicts the change in the initial extrapolated temperature of crystallization and the enthalpy changing as a function of SEBS content. According to ISO 11357-1, ‘eic’ is the extrapolated initial temperature of crystallization, which is the intersection of the extrapolated linear section of the rising peak with the apparent baseline below the peak. The enthalpy changing shows the heat of crystallization on the fibers, and the corrected heat of melting on the printed specimens. The samples are depicted in different colors.
The change in the initial extrapolated temperature of crystallization occur on all cooling rates, which precludes the influence of cooling rate. It can be seen that increasing the SEBS content increases the initial crystallization temperature, and crystallization begins sooner at higher temperatures, which is one of the accepted proofs of nucleation [
19,
20,
21,
22,
23,
24,
25,
26,
27,
28].
As a result of the appearance of SEBS, the heat of crystallization increased at all cooling rates relative to PLA. A higher heat of crystallization means more crystalline phases. At the two slower cooling rates, although the SEBS content increases, the value of the heat of crystallization does not alter, but the shape of the curve changes (
Figure 1). That is, as the initial temperature increases, the shape of the curve alters but the heat of crystallization does not, so it can be concluded that it is likely that crystallites of similar sizes but different shapes, increasingly perfect, will form. At a cooling rate of 10 °C/min, the cooling intensity is already so high that it inhibits the amount of crystals that can be formed, so it does not reach the values measured at slower rates. However, in this case, increasing SEBS content can somewhat compensate the effect of the rapid cooling and increase the number of crystallites formed.
The heat of melting of the sample containing 1% SEBS is lower than that measured at PLA, and the value of 2% is practically the same. The growth of crystalline phases starts from 3%, but the differences are not too large. The sample of 5% reaches twice the heat of melting of PLA. However, the measured heat of melting of 1–3 J/g is quite low compared to 30–35 J/g measured in the non-isothermal test, so it can be said that although SEBS behaves as a nucleating agent, the mixtures are practically amorphous due to the cooling conditions of the printing.
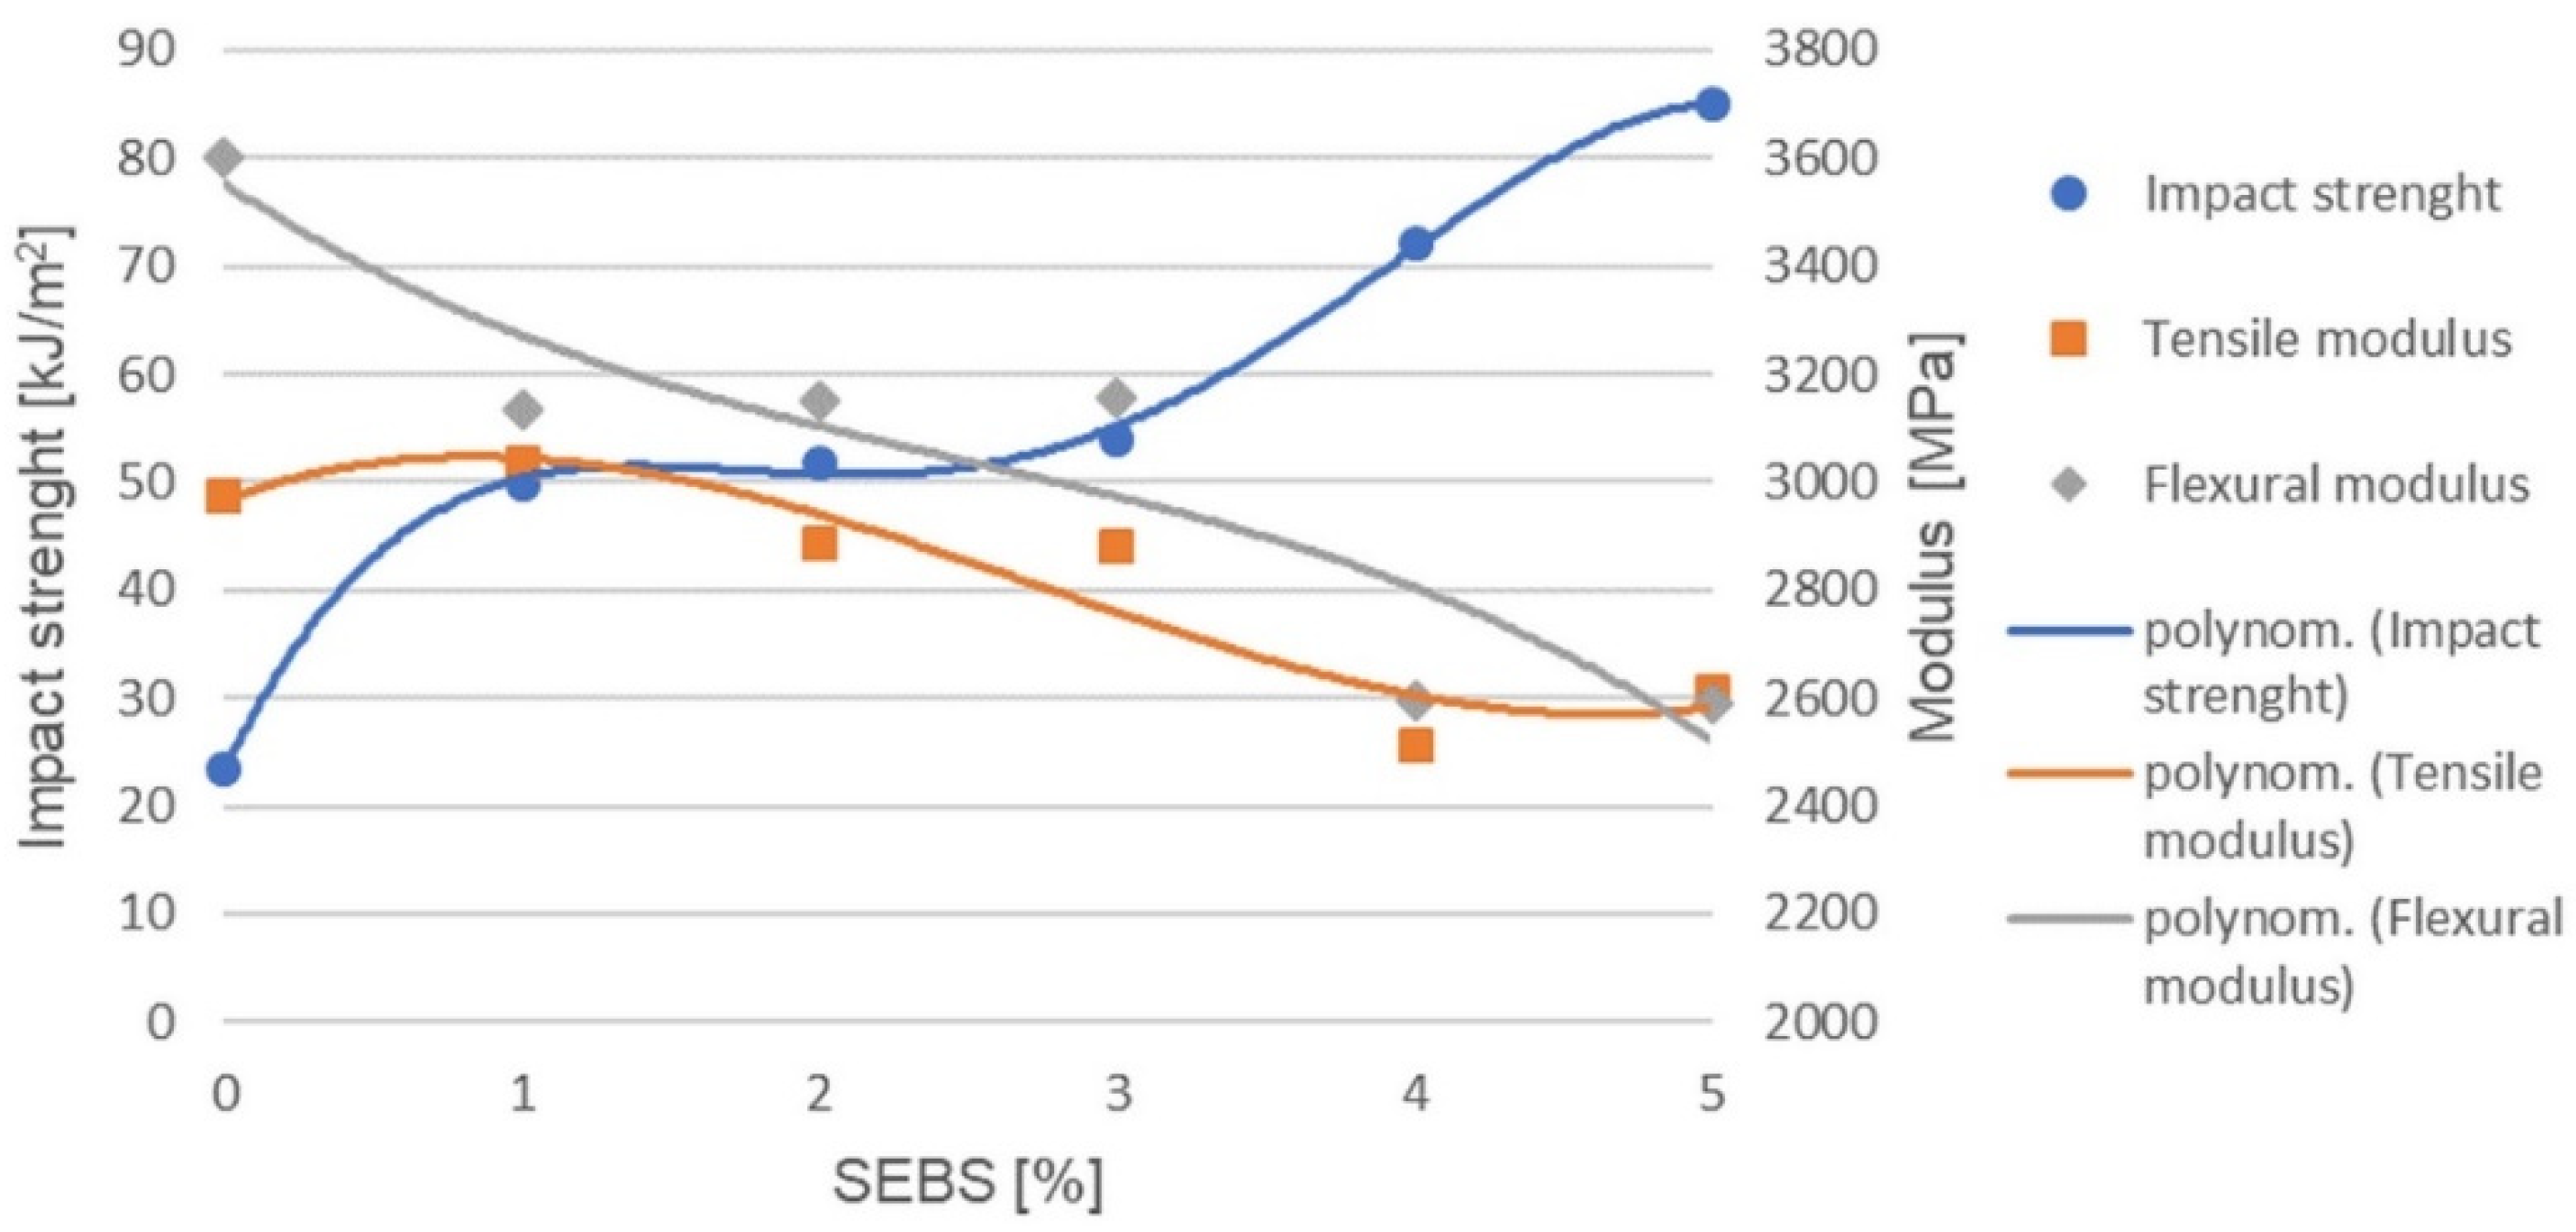
Figure 4 shows the change in impact strength, the tensile modulus and the flexural modulus as a function of SEBS content.
Already, with the addition of 1% SEBS, the impact strength doubles. The growth is minimal between 1 and 3%, practically unchanged; for 4%, it starts to increase further, where it reaches three times the impact strength of the original PLA, and at 5% it is an even higher value. Thanks to the flexibility of SEBS, it absorbs impact energy, thus improving its impact resistance of the originally brittle PLA. Until 3%, the amount is so small that the SEBS particles are at a great distance from each other so that each can locally relieve an internal tension of a small area. The amount may be 4% when the mixture already contains enough SEBS that the spreading impact energy collides into another energy-absorbing SEBS particle. From 4%, the regions of action of SEBS particles can be linked to PLA chains that act as binding molecules, similar to amorphous molecules that bind crystals. Thanks to these overlaps, the energy absorbing effect is amplified and extended.
The tensile modulus is practically unchanged until 3% SEBS is added if the standard deviations are taken into account. The 4 and 5% are also nearly the same, but their values are already lower than the values of the original PLA or the 1–3% samples. Adding a small amount of SEBS improves the impact strength but does not reduce the tensile modulus. During the impact test, the specimen receives the full load immediately, while during the tensile test, the software calculates the tensile modulus according to the standard, from the initial stage of the pull (0.05–0.25%), when the load only begins to build up. At this stage, the amount of SEBS has not yet reached the level to influence the original tensile modulus of the PLA. The change occurs only for a SEBS content of 4% or more.
The flexural modulus decreases slightly with the addition of 1% SEBS but does not change up to 3%, remaining broadly constant. The values of 4 and 5% are also about the same, but even lower. The bending modulus also applies to the initial phase of the load, but here the stress is different; here, tensile and compressive stresses occur simultaneously at the two edges of the specimen. Additionally, while the original modulus value of PLA has been retained in the tensile test, a smaller value is obtained at bending. However, the differences are similar, with 1–3 and 4–5% separated.
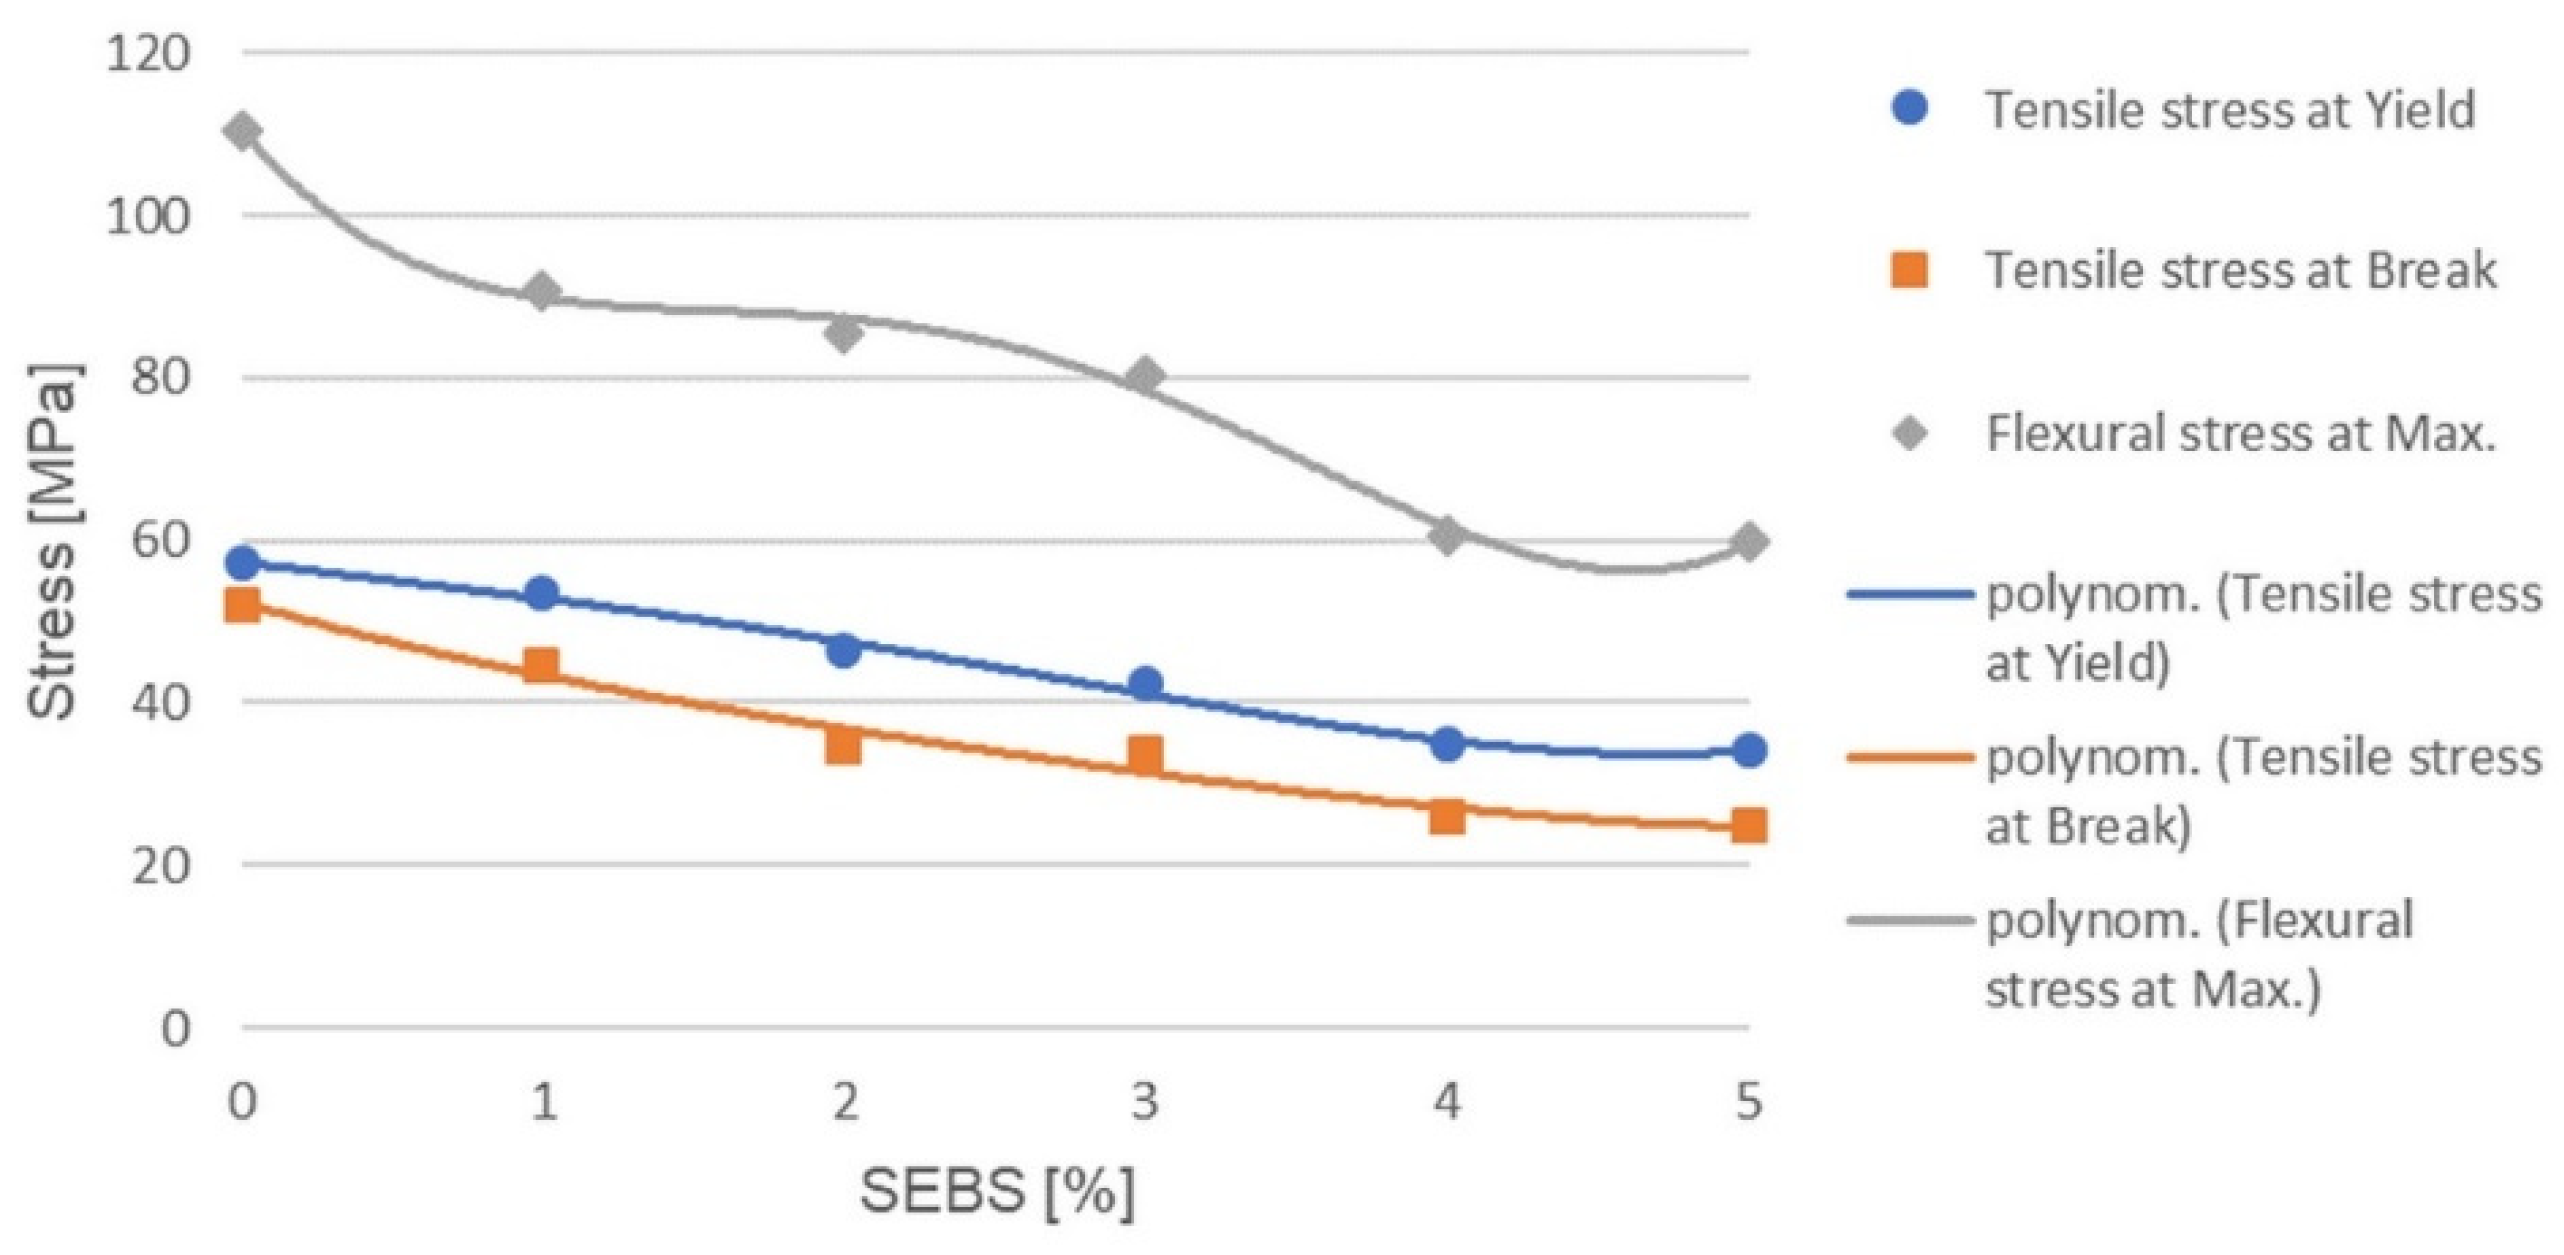
During the tensile test, the PLA behaves in a brittle manner, and even 1% of the SEBS can change this because the neck appears and begins to extend (
Figure 5). The elasticity and low strength of SEBS also affect the strength of the mixture. The amount of the thermoplastic elastomer increases, and the tensile stress at Yield decreases. The decline lasts until 4%, then the 4 and 5% samples are similar. For PLA, the tensile strength was plotted.
In the case of the tensile stress at break, a similar statement can be made as in the case of tensile stress at Yield, with the difference that three separate parts can be observed here. The tensile stress at break of PLA decreases slightly with the addition of 1% SEBS. The values of 2 and 3% are smaller but very similar. The tensile strength of the 4 and 5% samples is even lower, but they also show approximately the same values.
The addition of 1% SEBS to PLA increases the impact strength, does not reduce the tensile modulus, and only slightly reduces the tensile stress at break. However, 2 or 3% SEBS further increases the impact strength and does not reduce the tensile modulus but already reduces the tensile stress at break to a greater extent. In the case of 4 or 5% SEBS, even if the impact strength increases even more, the tensile modulus decreases and the tensile stress at break decreases by about half.
In the case of the bending test, one of the changes was also that while the brittle PLA was broken, the samples containing SEBS no longer broke or only partial fracture occurred. The flexural strength is thus the maximum flexural stress for mixtures. The blended SEBS grains can elongate on the drawn side and compress on the compressed side due to their flexibility, thus reducing the strength values. As the amount of SEBS increases, the flexural strength gradually decreases until 4%, and then 5% is practically the same as the 4% sample.
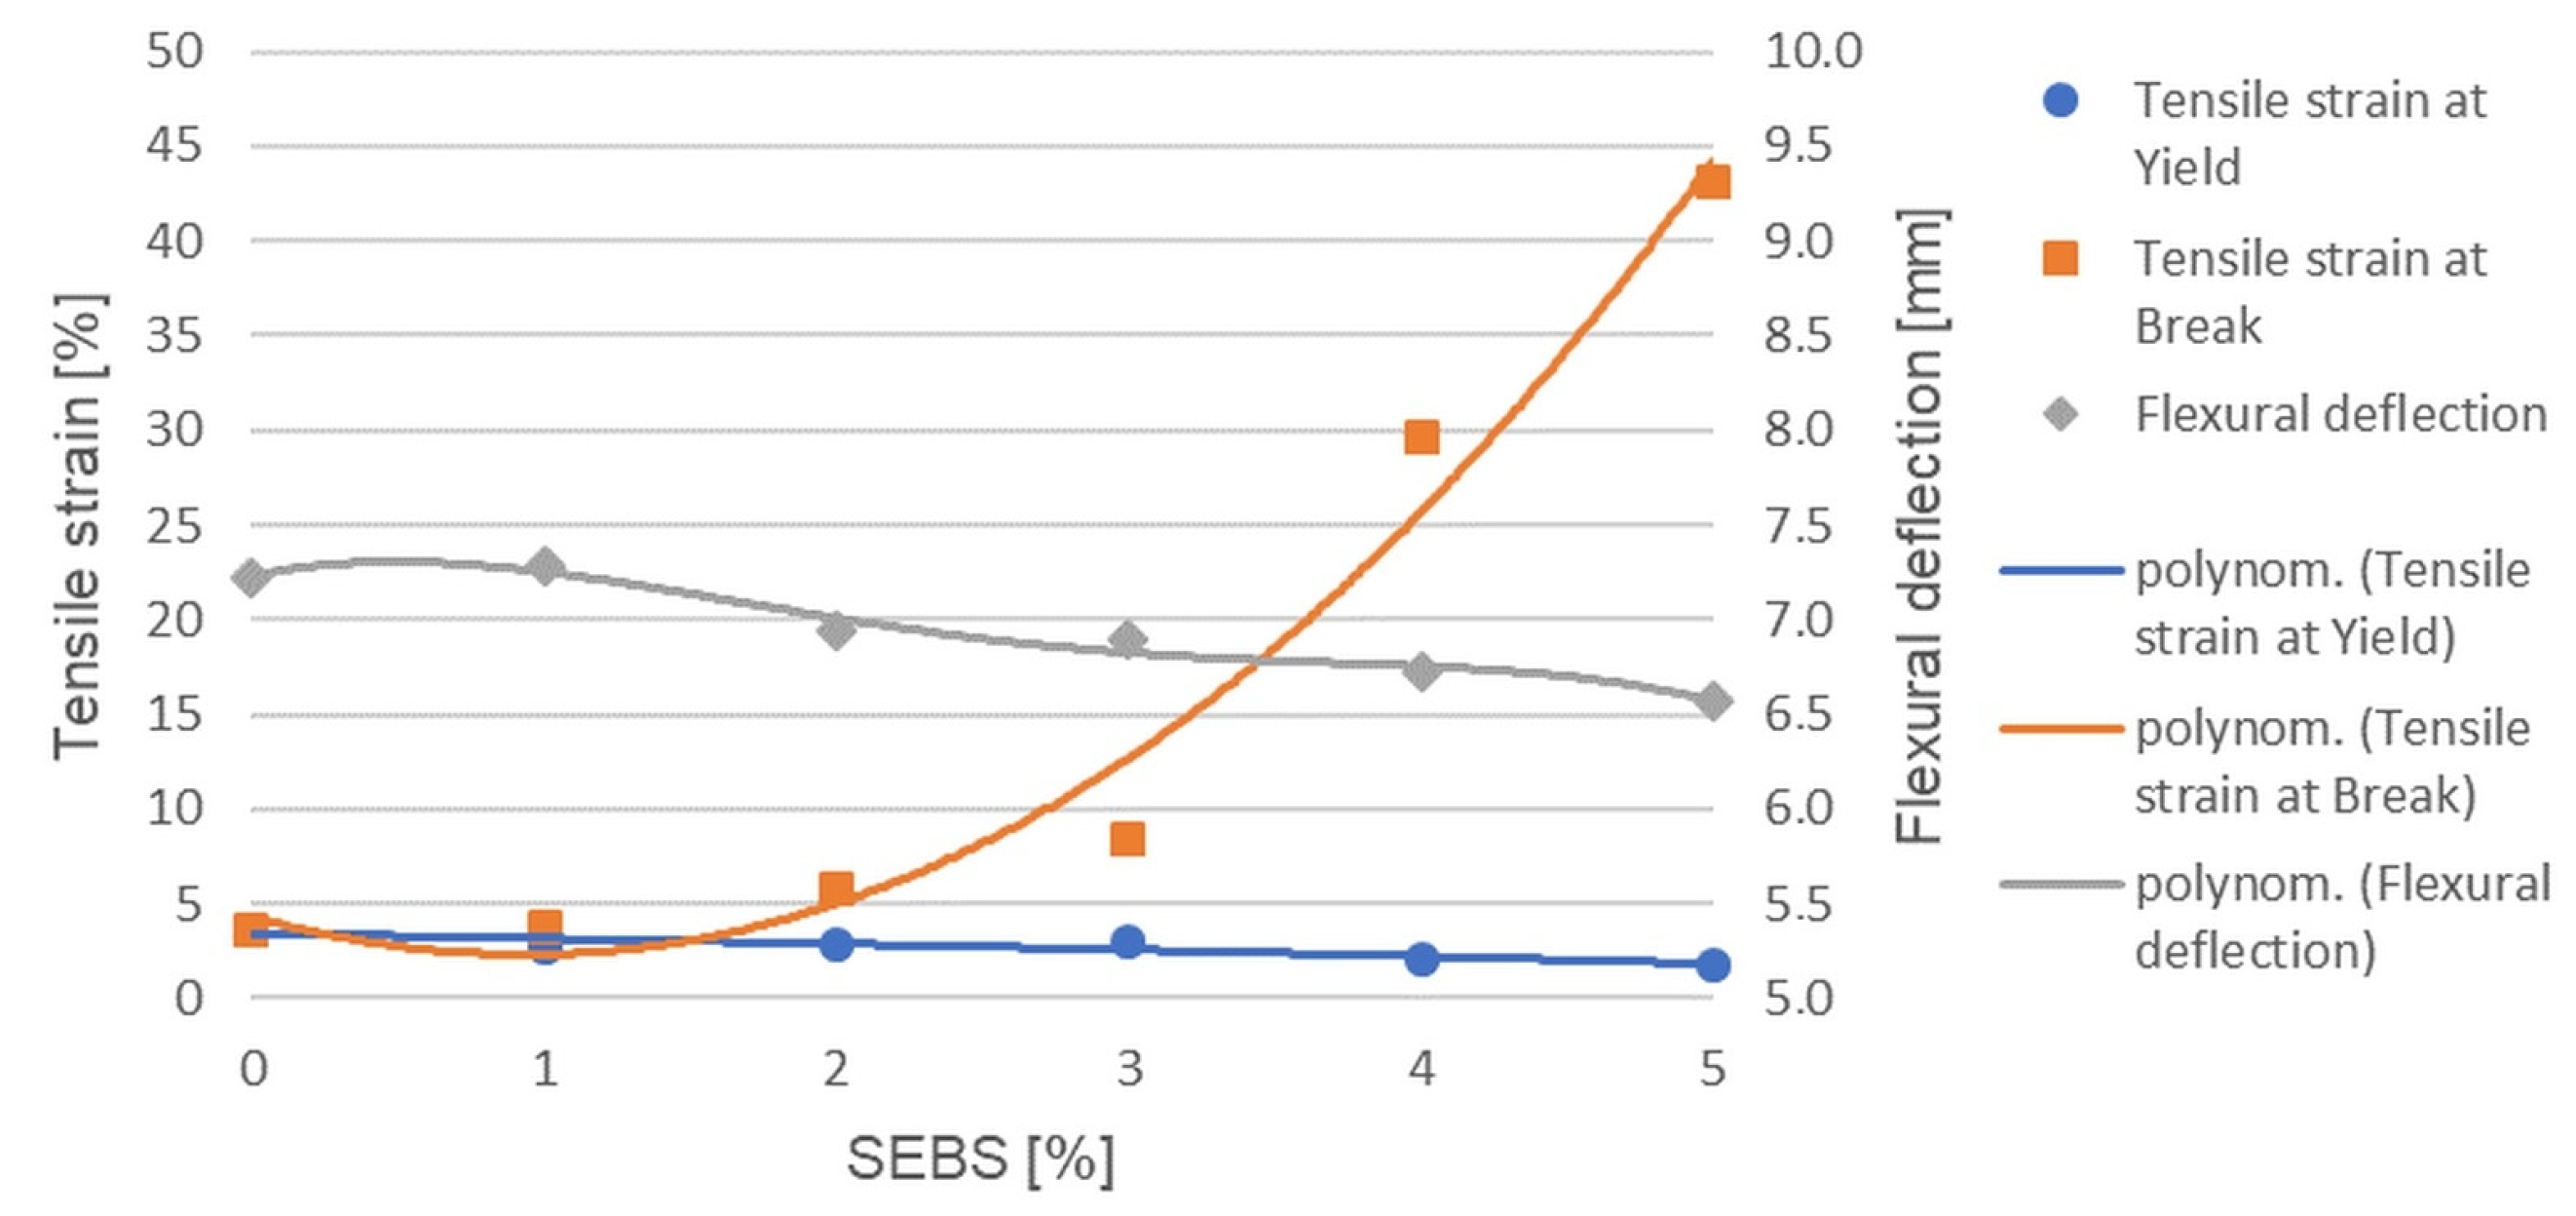
In the case of the tensile strain at Yield, it can be seen that 1–3% and 4–5% are separated from each other (
Figure 6). Although the tensile stress at Yield continuously decreased until 3%, the tensile strain at Yield did not change, remaining at nearly the same value. At 4 and 5%, when the lower strength was associated with less elongation, the forming of the neck started earlier. In the case of PLA, the tensile strain at break was also shown here, due to its brittle behavior.
In the case of the tensile strain at break or elongation at break, the value of the 1% sample is practically the same as the PLA, but the rupture of the 2 and 3% samples also occurs, only with a slightly higher elongation. The larger change occurs from 4%, where the elongation at break increases severalfold. From 5%, we can measure even higher values. Until 3%, the amount of SEBS mixed is not large enough to form continuous areas; it can be too scattered, and thus only locally, around itself, can it initiate the rearrangement of PLA molecules in the direction of pull—no large elongations are possible. From 4%, the regions of action of SEBS particles can be linked with PLA binding molecules, which can lead to much higher elongations.
The flexural deflection measured when the maximum stress is reached practically changes only tenths of a millimeter, and if the standard deviation is taken into account, the change cannot be said to be significant. However, in the case of the mean values, it can be noted that the 1% sample is the same as the PLA, followed by a continuous decrease.
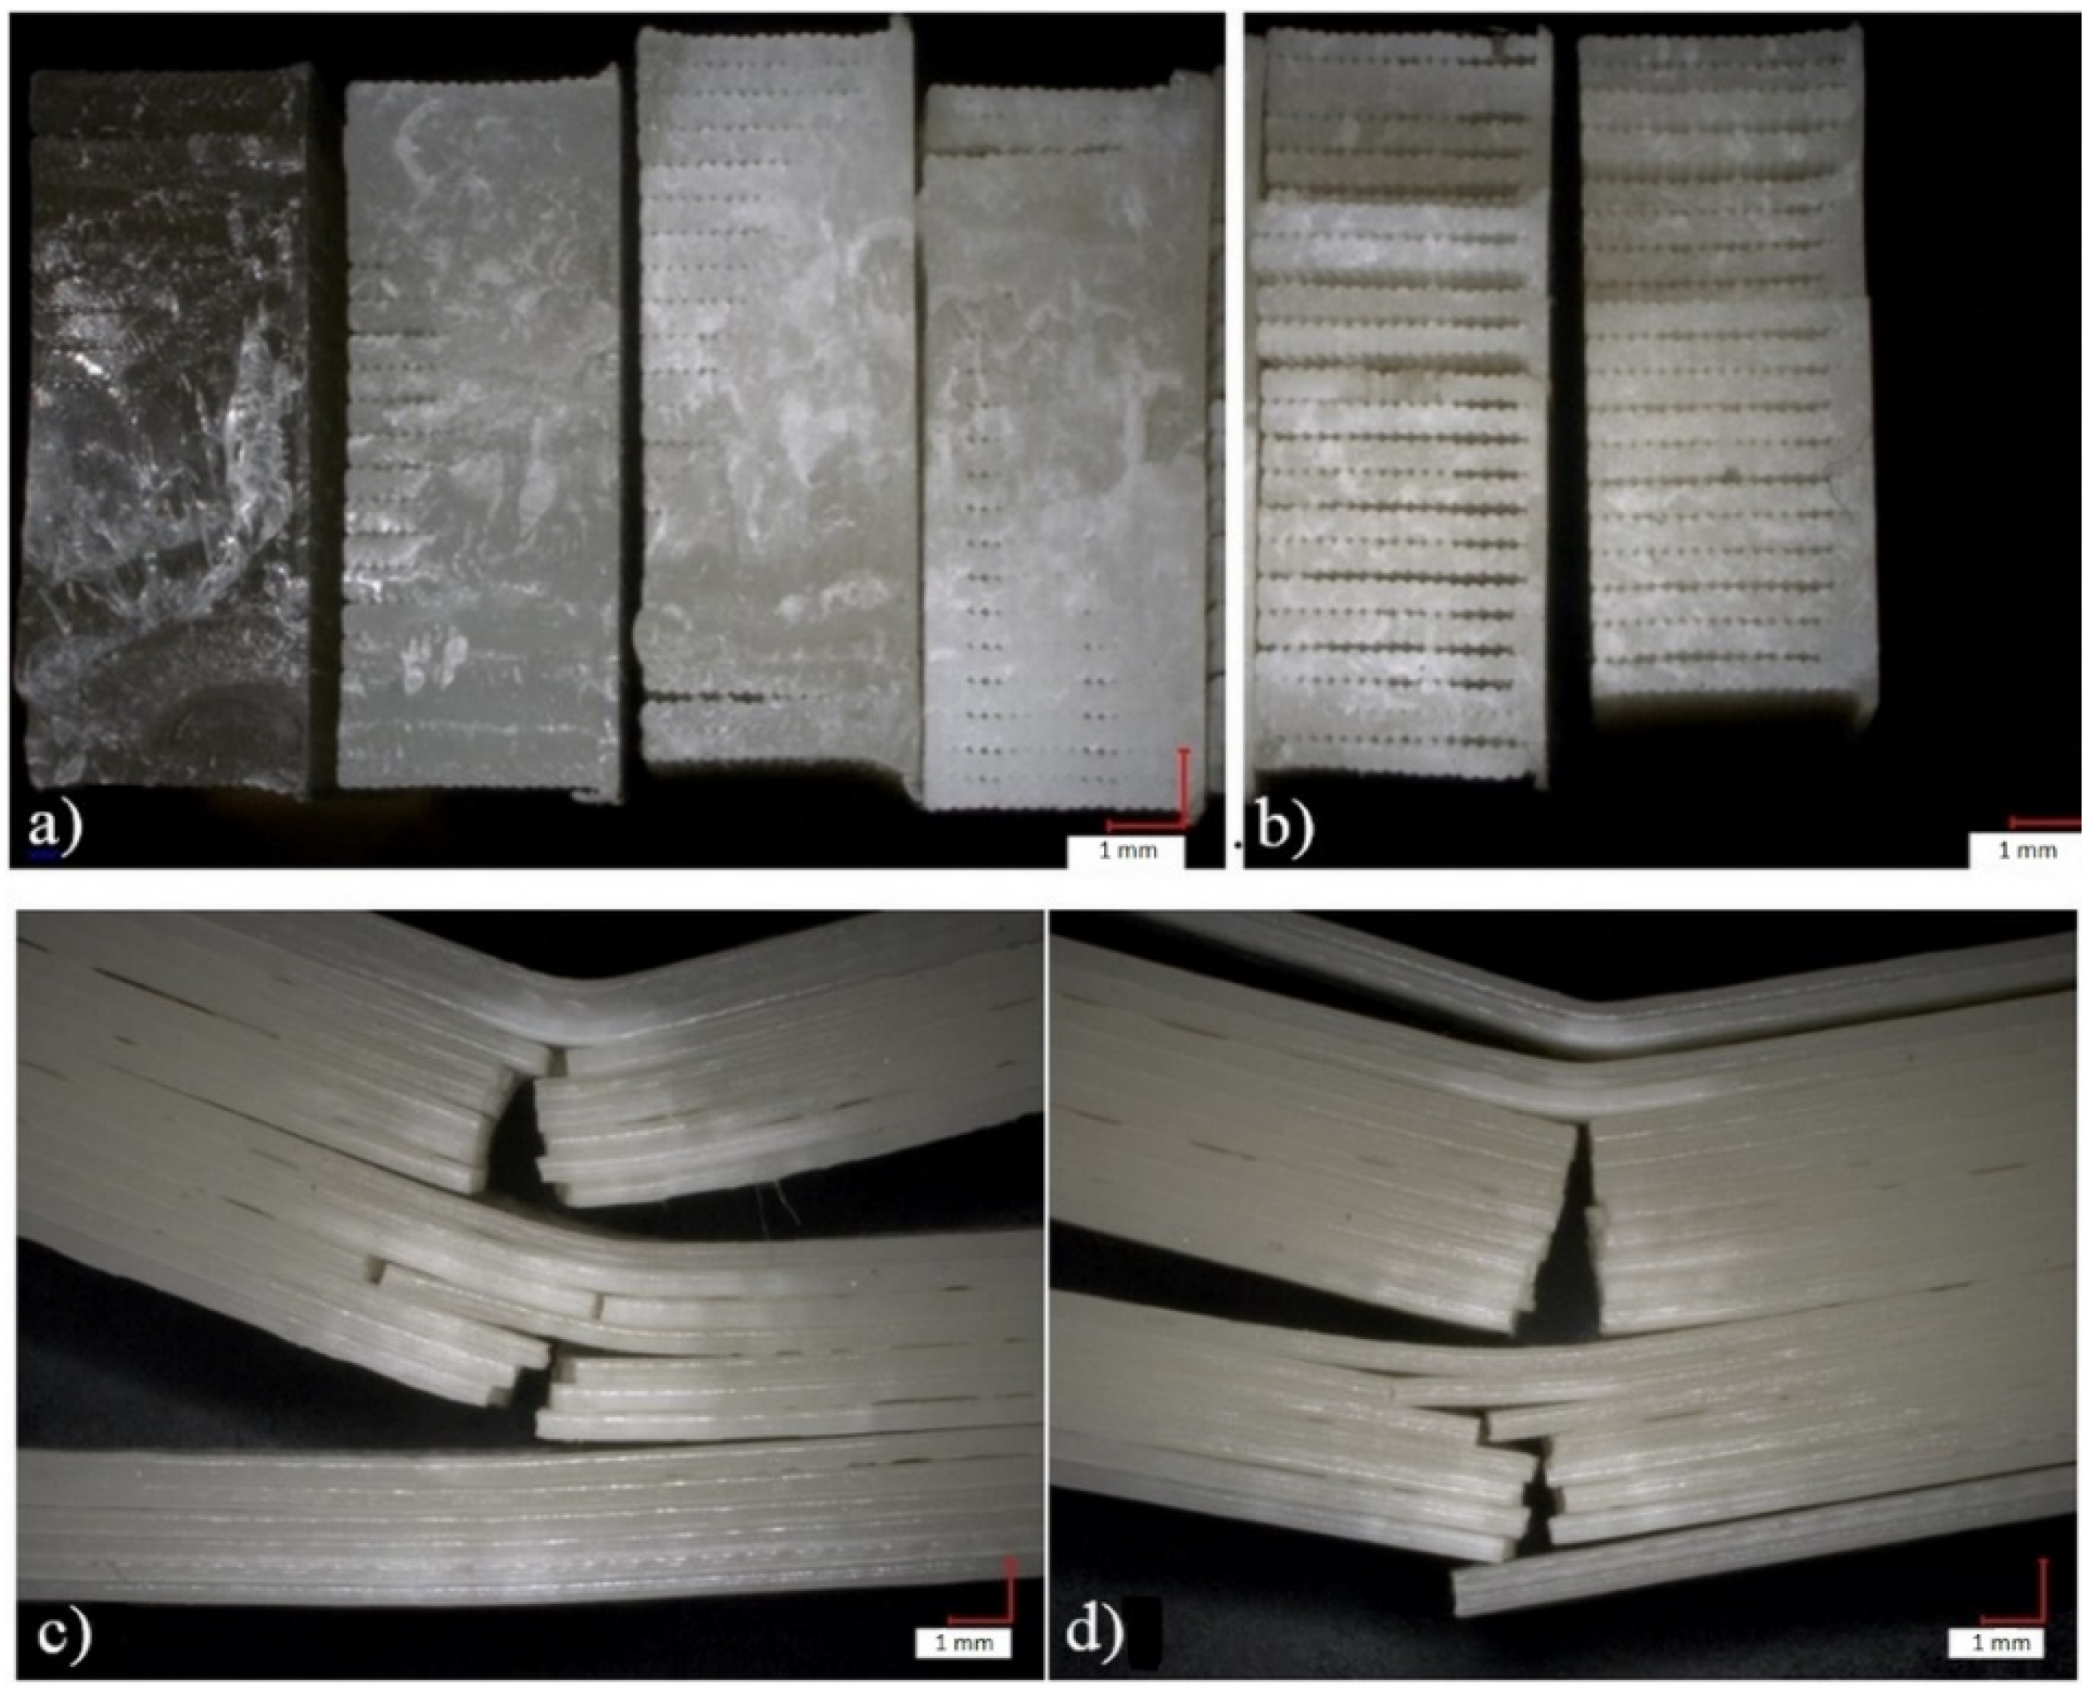
Figure 7 depicts optical microscopic images of the impacted specimens at 20× magnification.
Figure 7a,b show the fractured surfaces and
Figure 7c,d show the side views of the partial fractures of the unbroken specimens.
The microscopic images show that the fracture surfaces of the printed specimens are quite similar up to 3% SEBS content, and at 4 and 5%, the separation of the fibers can be observed (
Figure 7). From PLA until 3%, the entire cross-section of all specimens was broken, while at 4 and 5%, some partial fractures (shown in
Figure 7c,d) also occurred. These partial fractures can occur due to the separation of the fibers. The larger parts that remain together break, while the independent, thin fibers become flexible and no longer break due to the higher SEBS content.
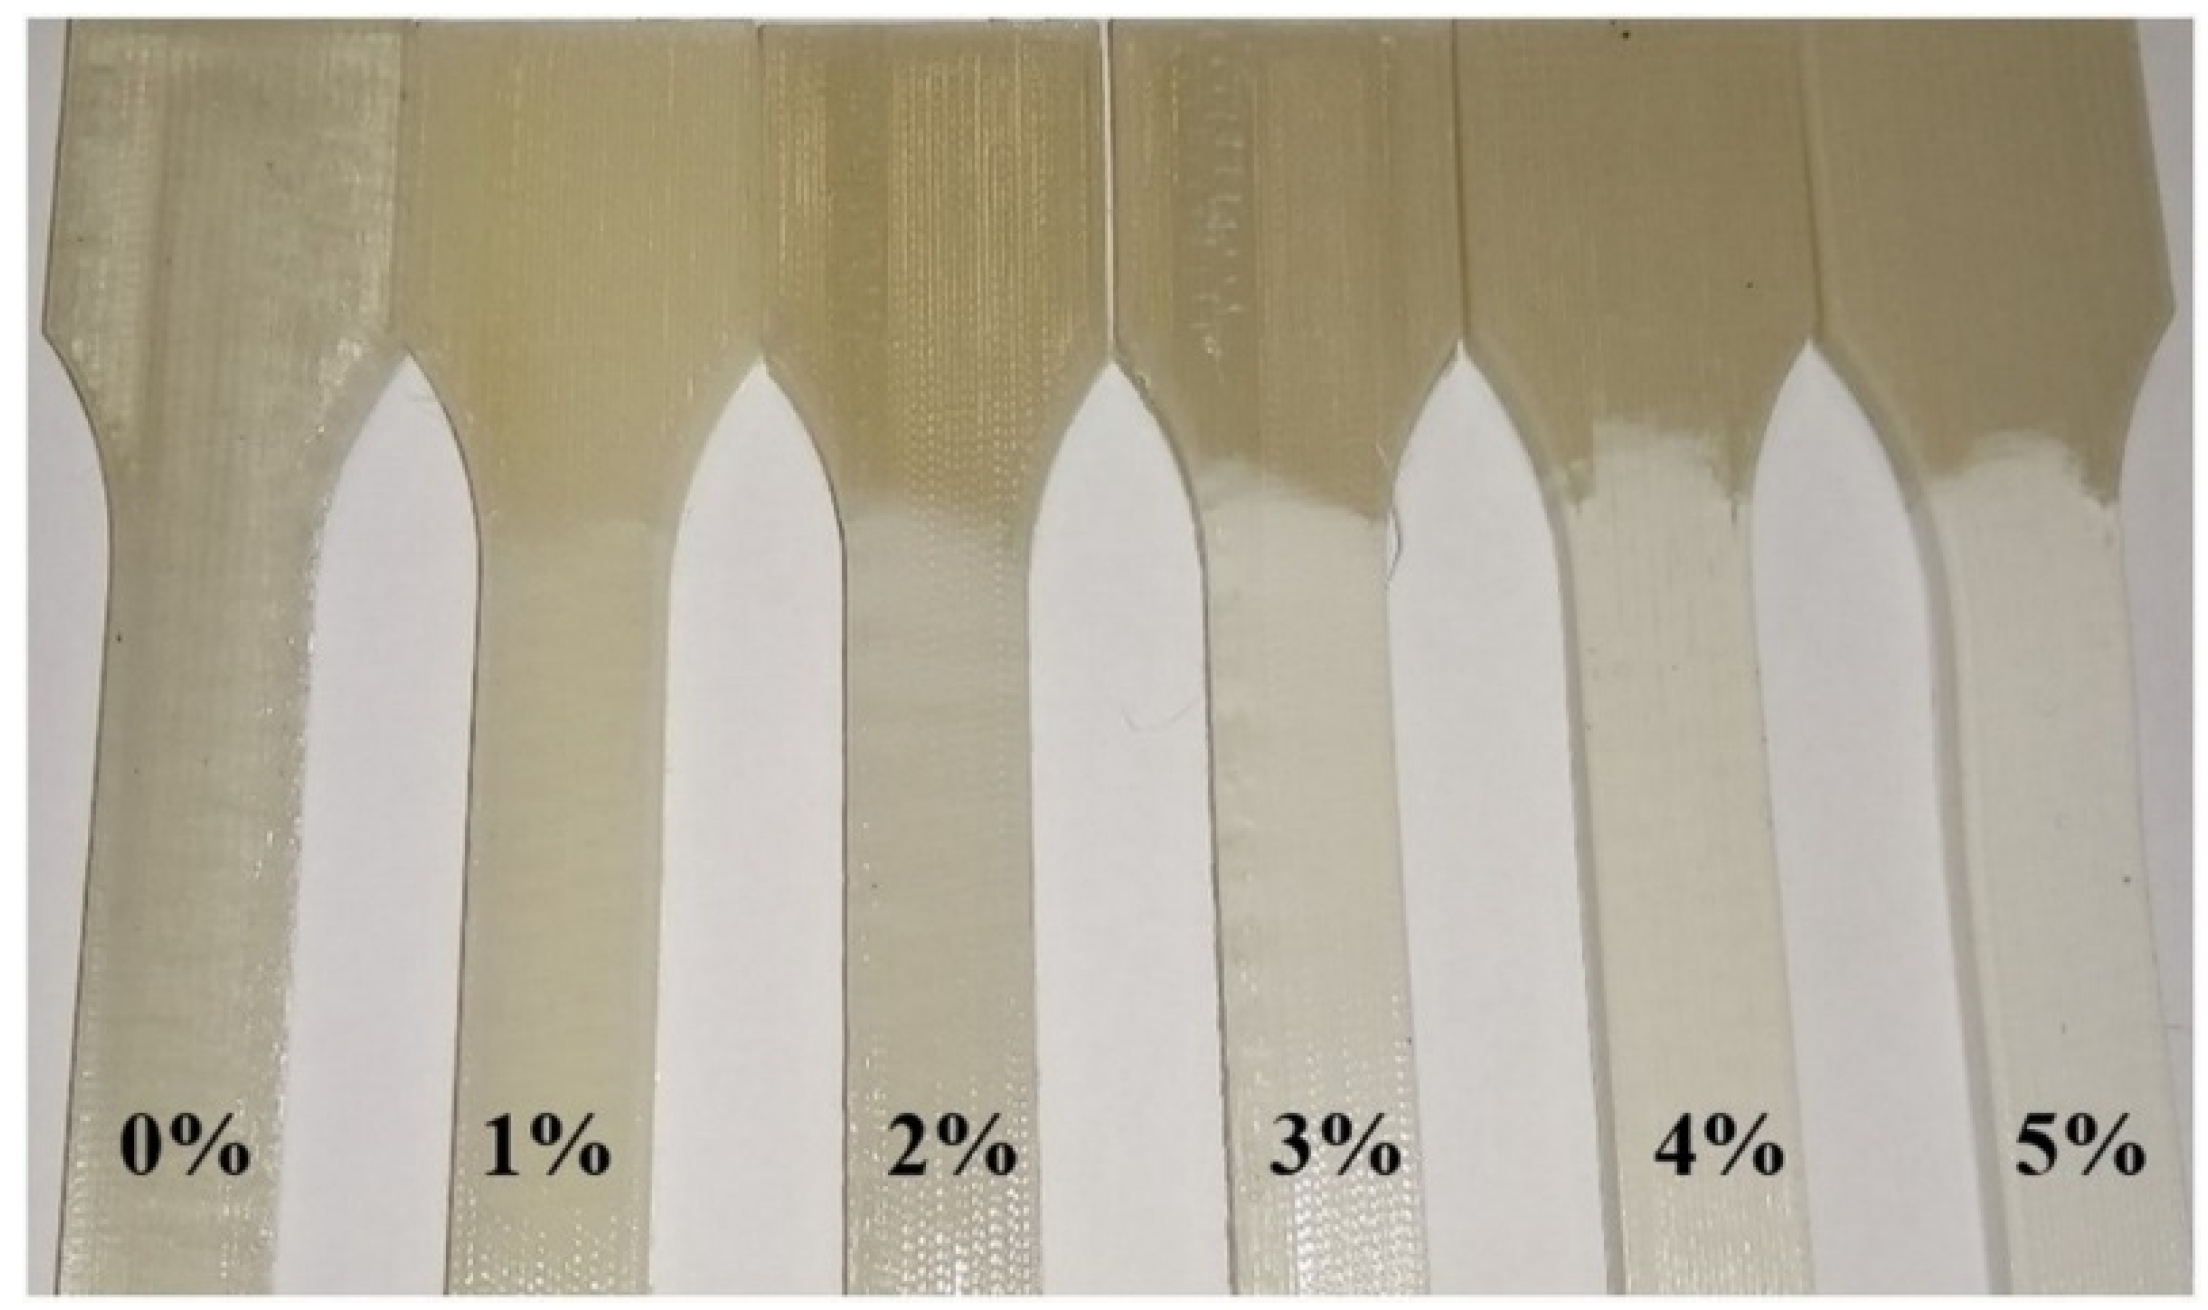
On the broken specimens, bleaching can be observed, which is characteristic of the tensile test of polymers, and it means that micro-cracks are formed under the effect of tensile stress (
Figure 8). Now, these micro-cracks travel along the entire length of the specimens, up to the clamping, even at 1% SEBS content. As the concentration of SEBS increases, the specimen appears to become increasingly whiter, i.e., the amount of micro-cracks in the samples increases.
Figure 9 shows that in the case of 1 and 2% SEBS, the samples suffer from a partial fracture. At 1%, most of the cross-section breaks, at 2%, the fracture surface is already visibly reduced, and from 3%, fracture of the sample no longer occurs.
3.2. Results of PLA-SEBS-CNT Nanocomposites
From the study of PLA-SEBS blends, it can be concluded that the greatest potential is the blend containing 1% SEBS, because it does not or only slightly reduces the strength values of PLA, while doubling its impact resistance and mixing as little foreign matter as possible to PLA. For this reason, the sample containing 1% SEBS was chosen to mix carbon nanotubes in 0.06 and 0.1%. The conditions for blending, fiber production and printing are the same as those used for PLA-SEBS blends. DSC measurements were performed on the fiber and mechanical tests were performed on the printed specimens (
Figure 10).
The labeling of the samples has been simplified, always containing only the name of the last additive, so that in the following, the names of the four samples examined are PLA, 1% SEBS, 0.06% CNT and 0.1% CNT.
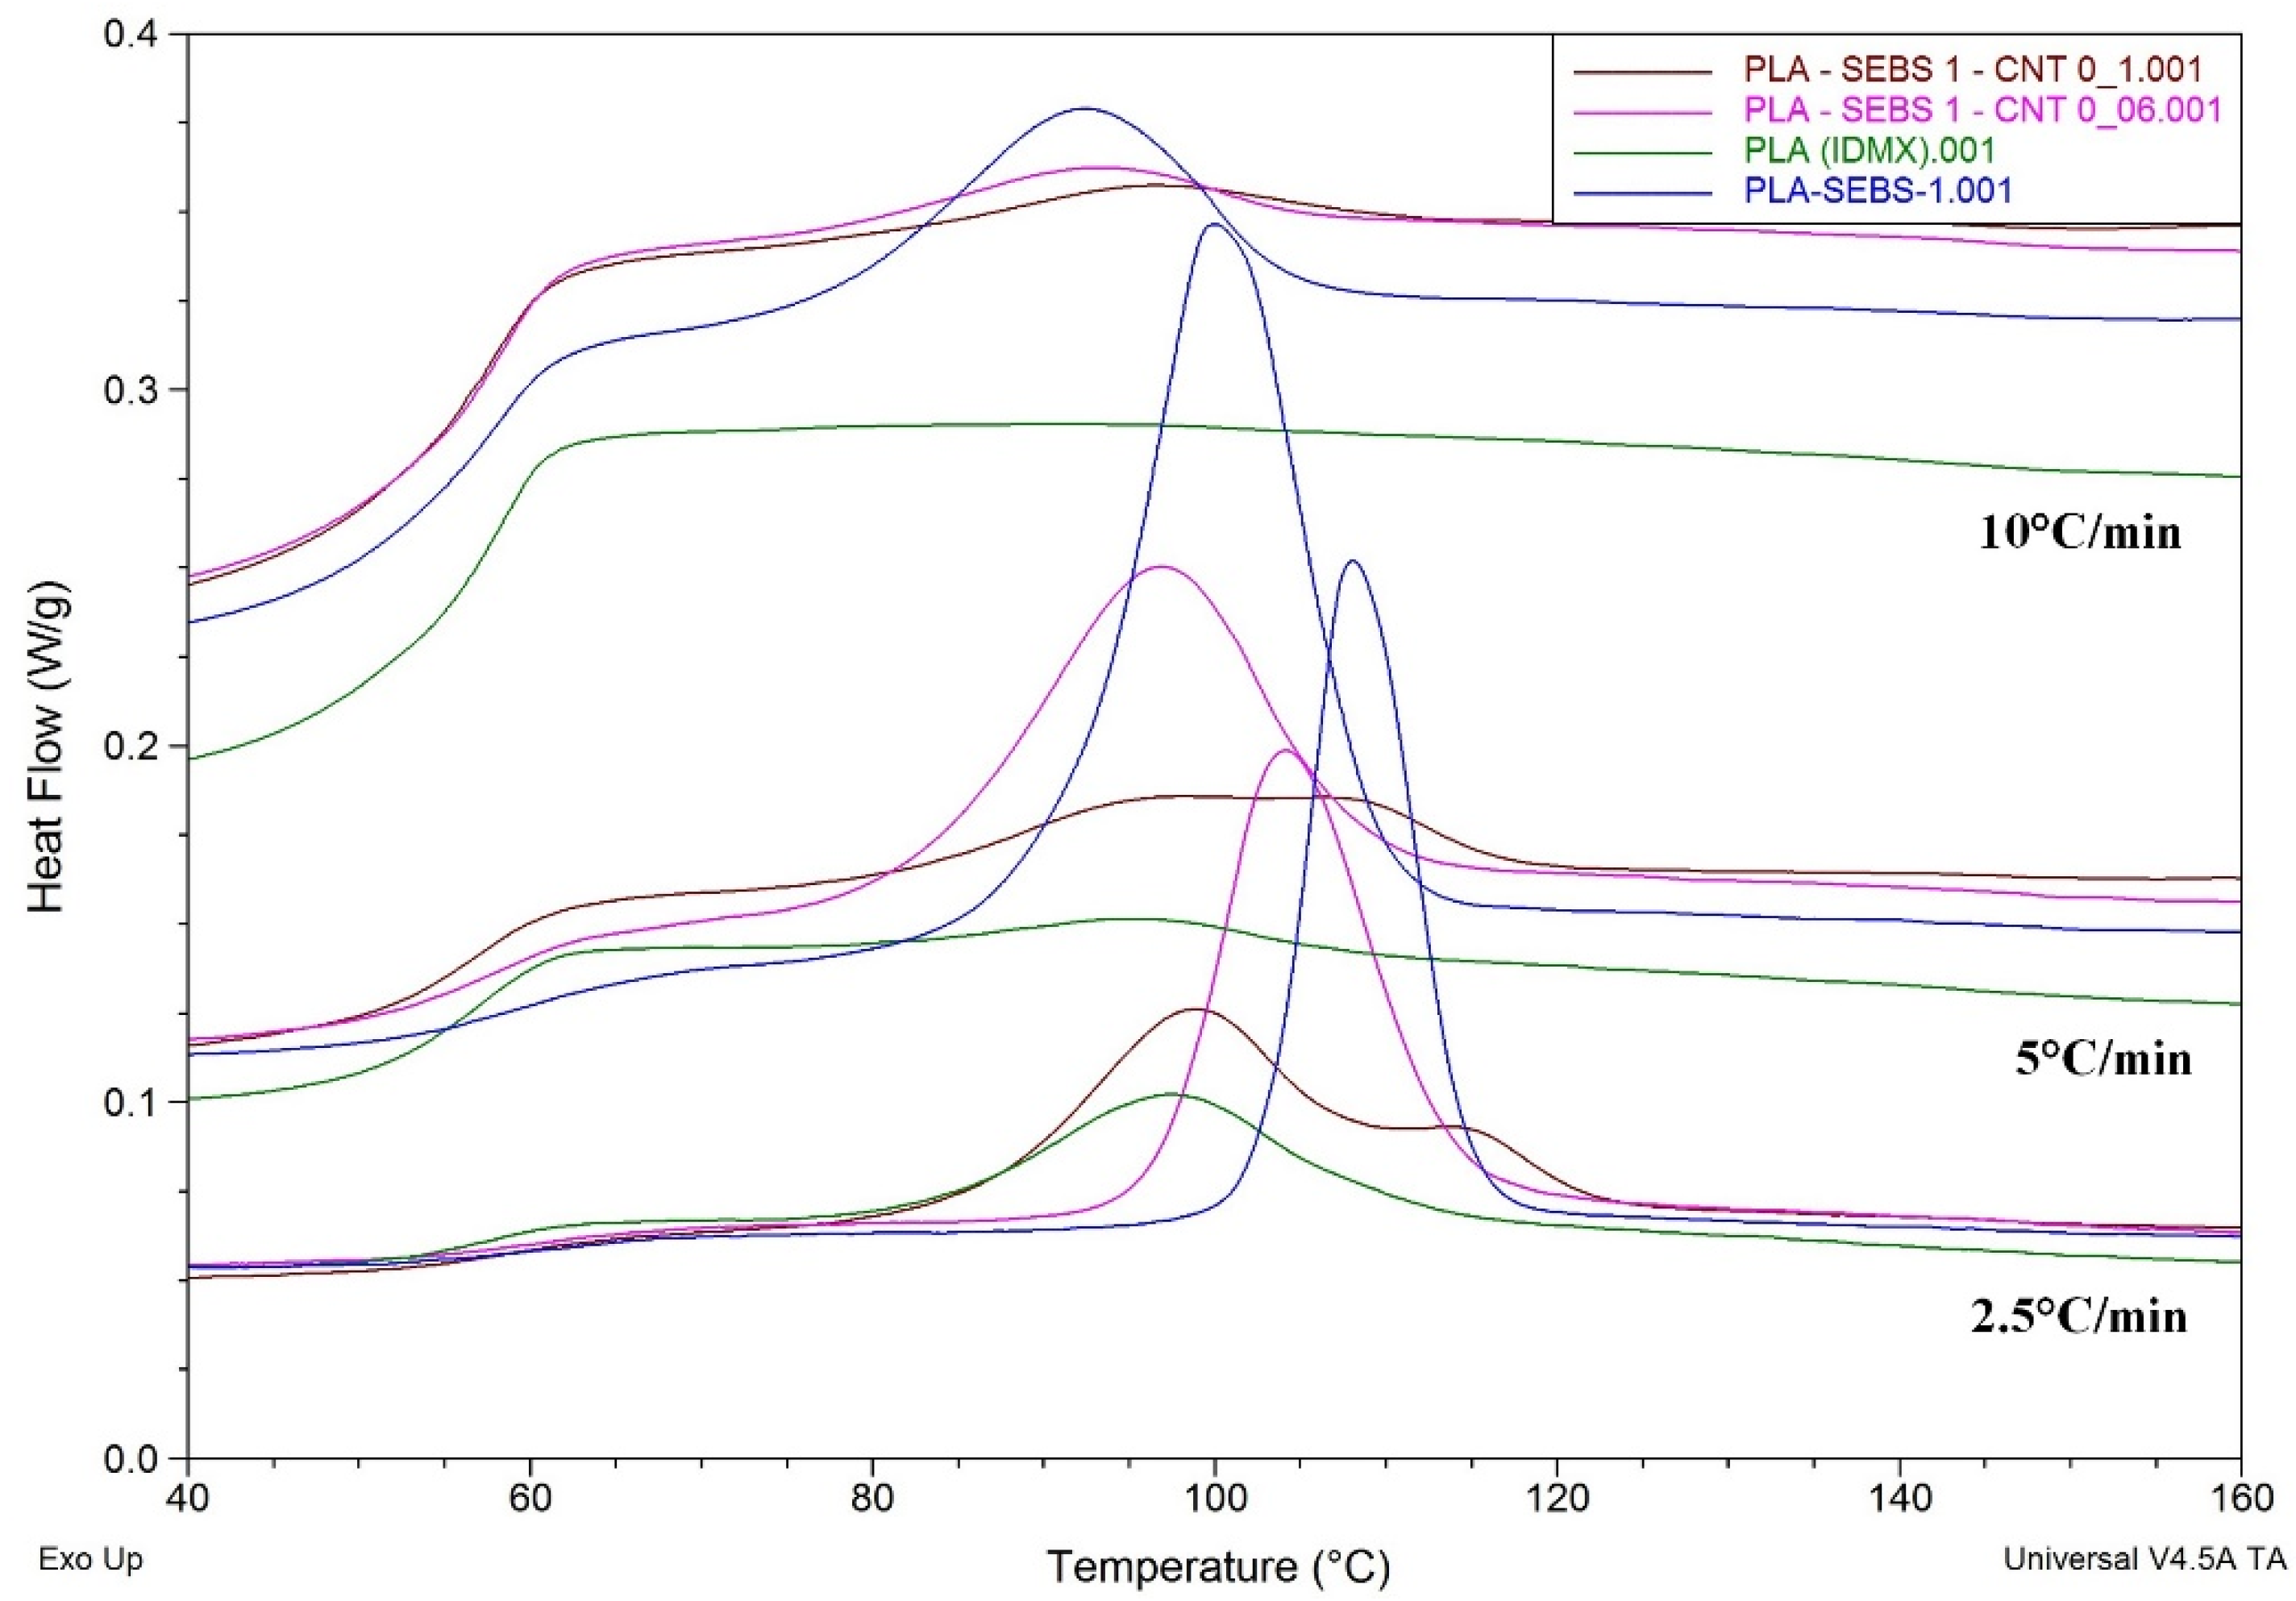
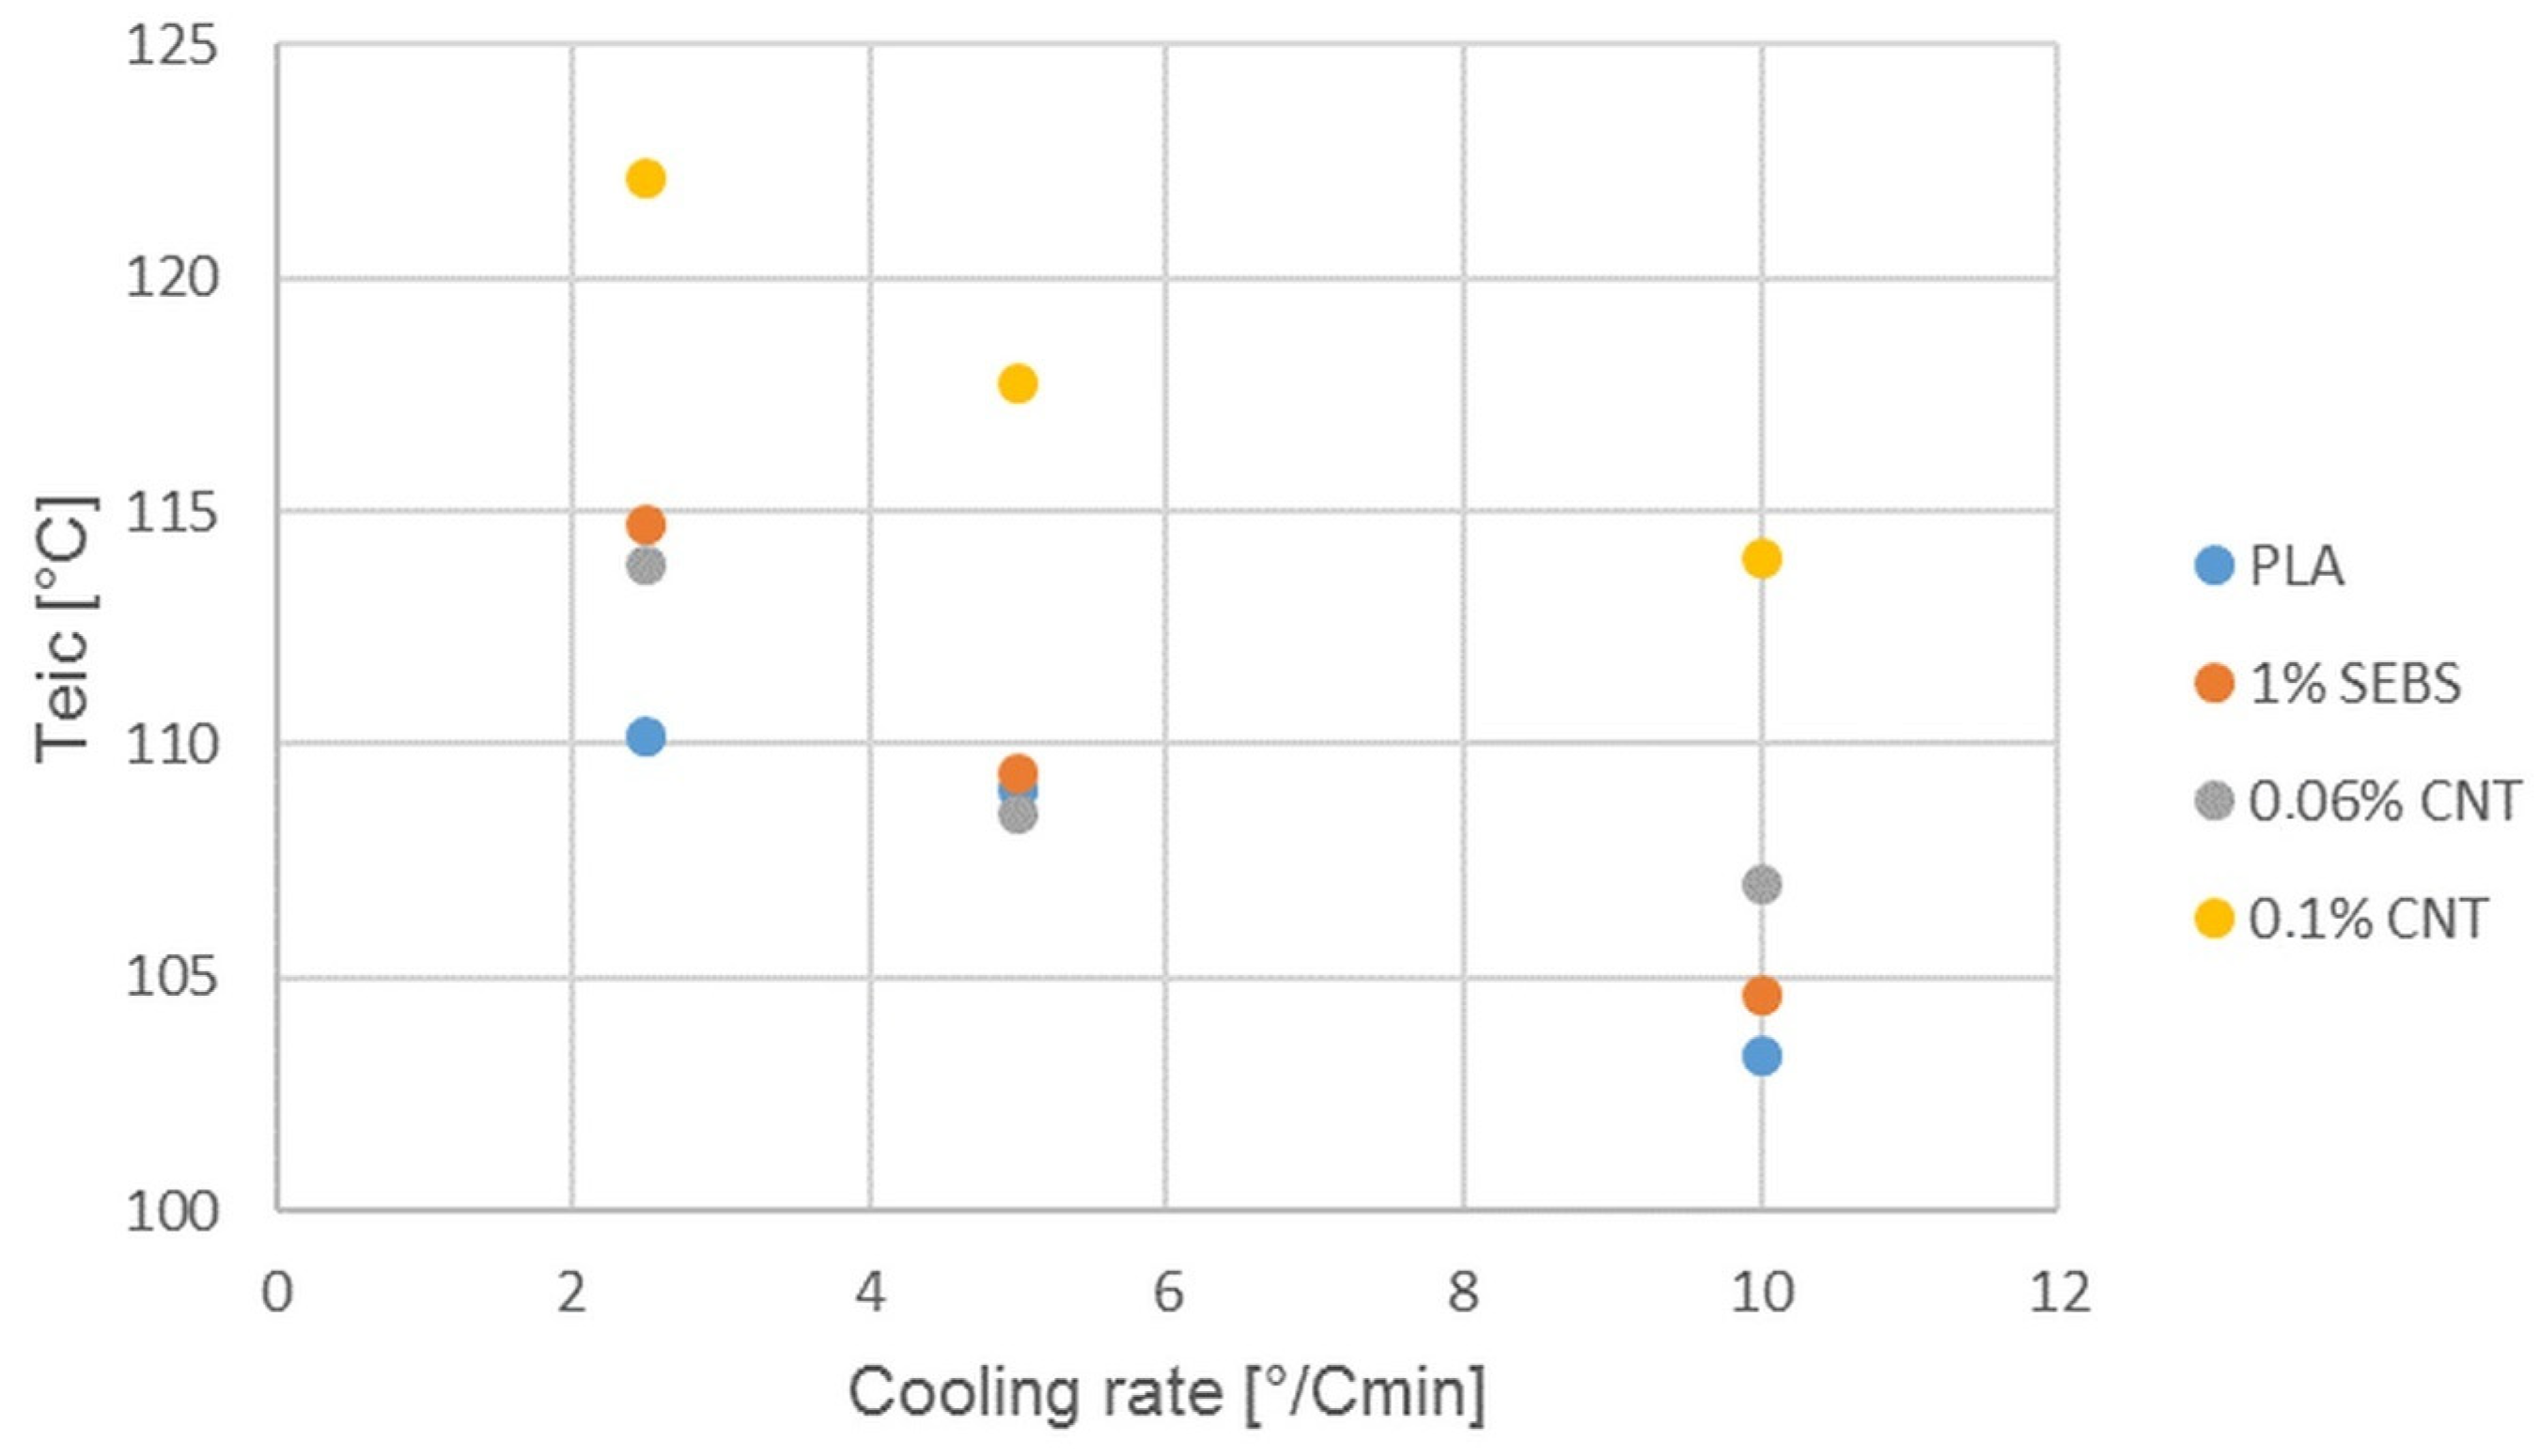
Examining the DSC curves of the nanocomposites, it can be said that the initial temperatures of crystallization (
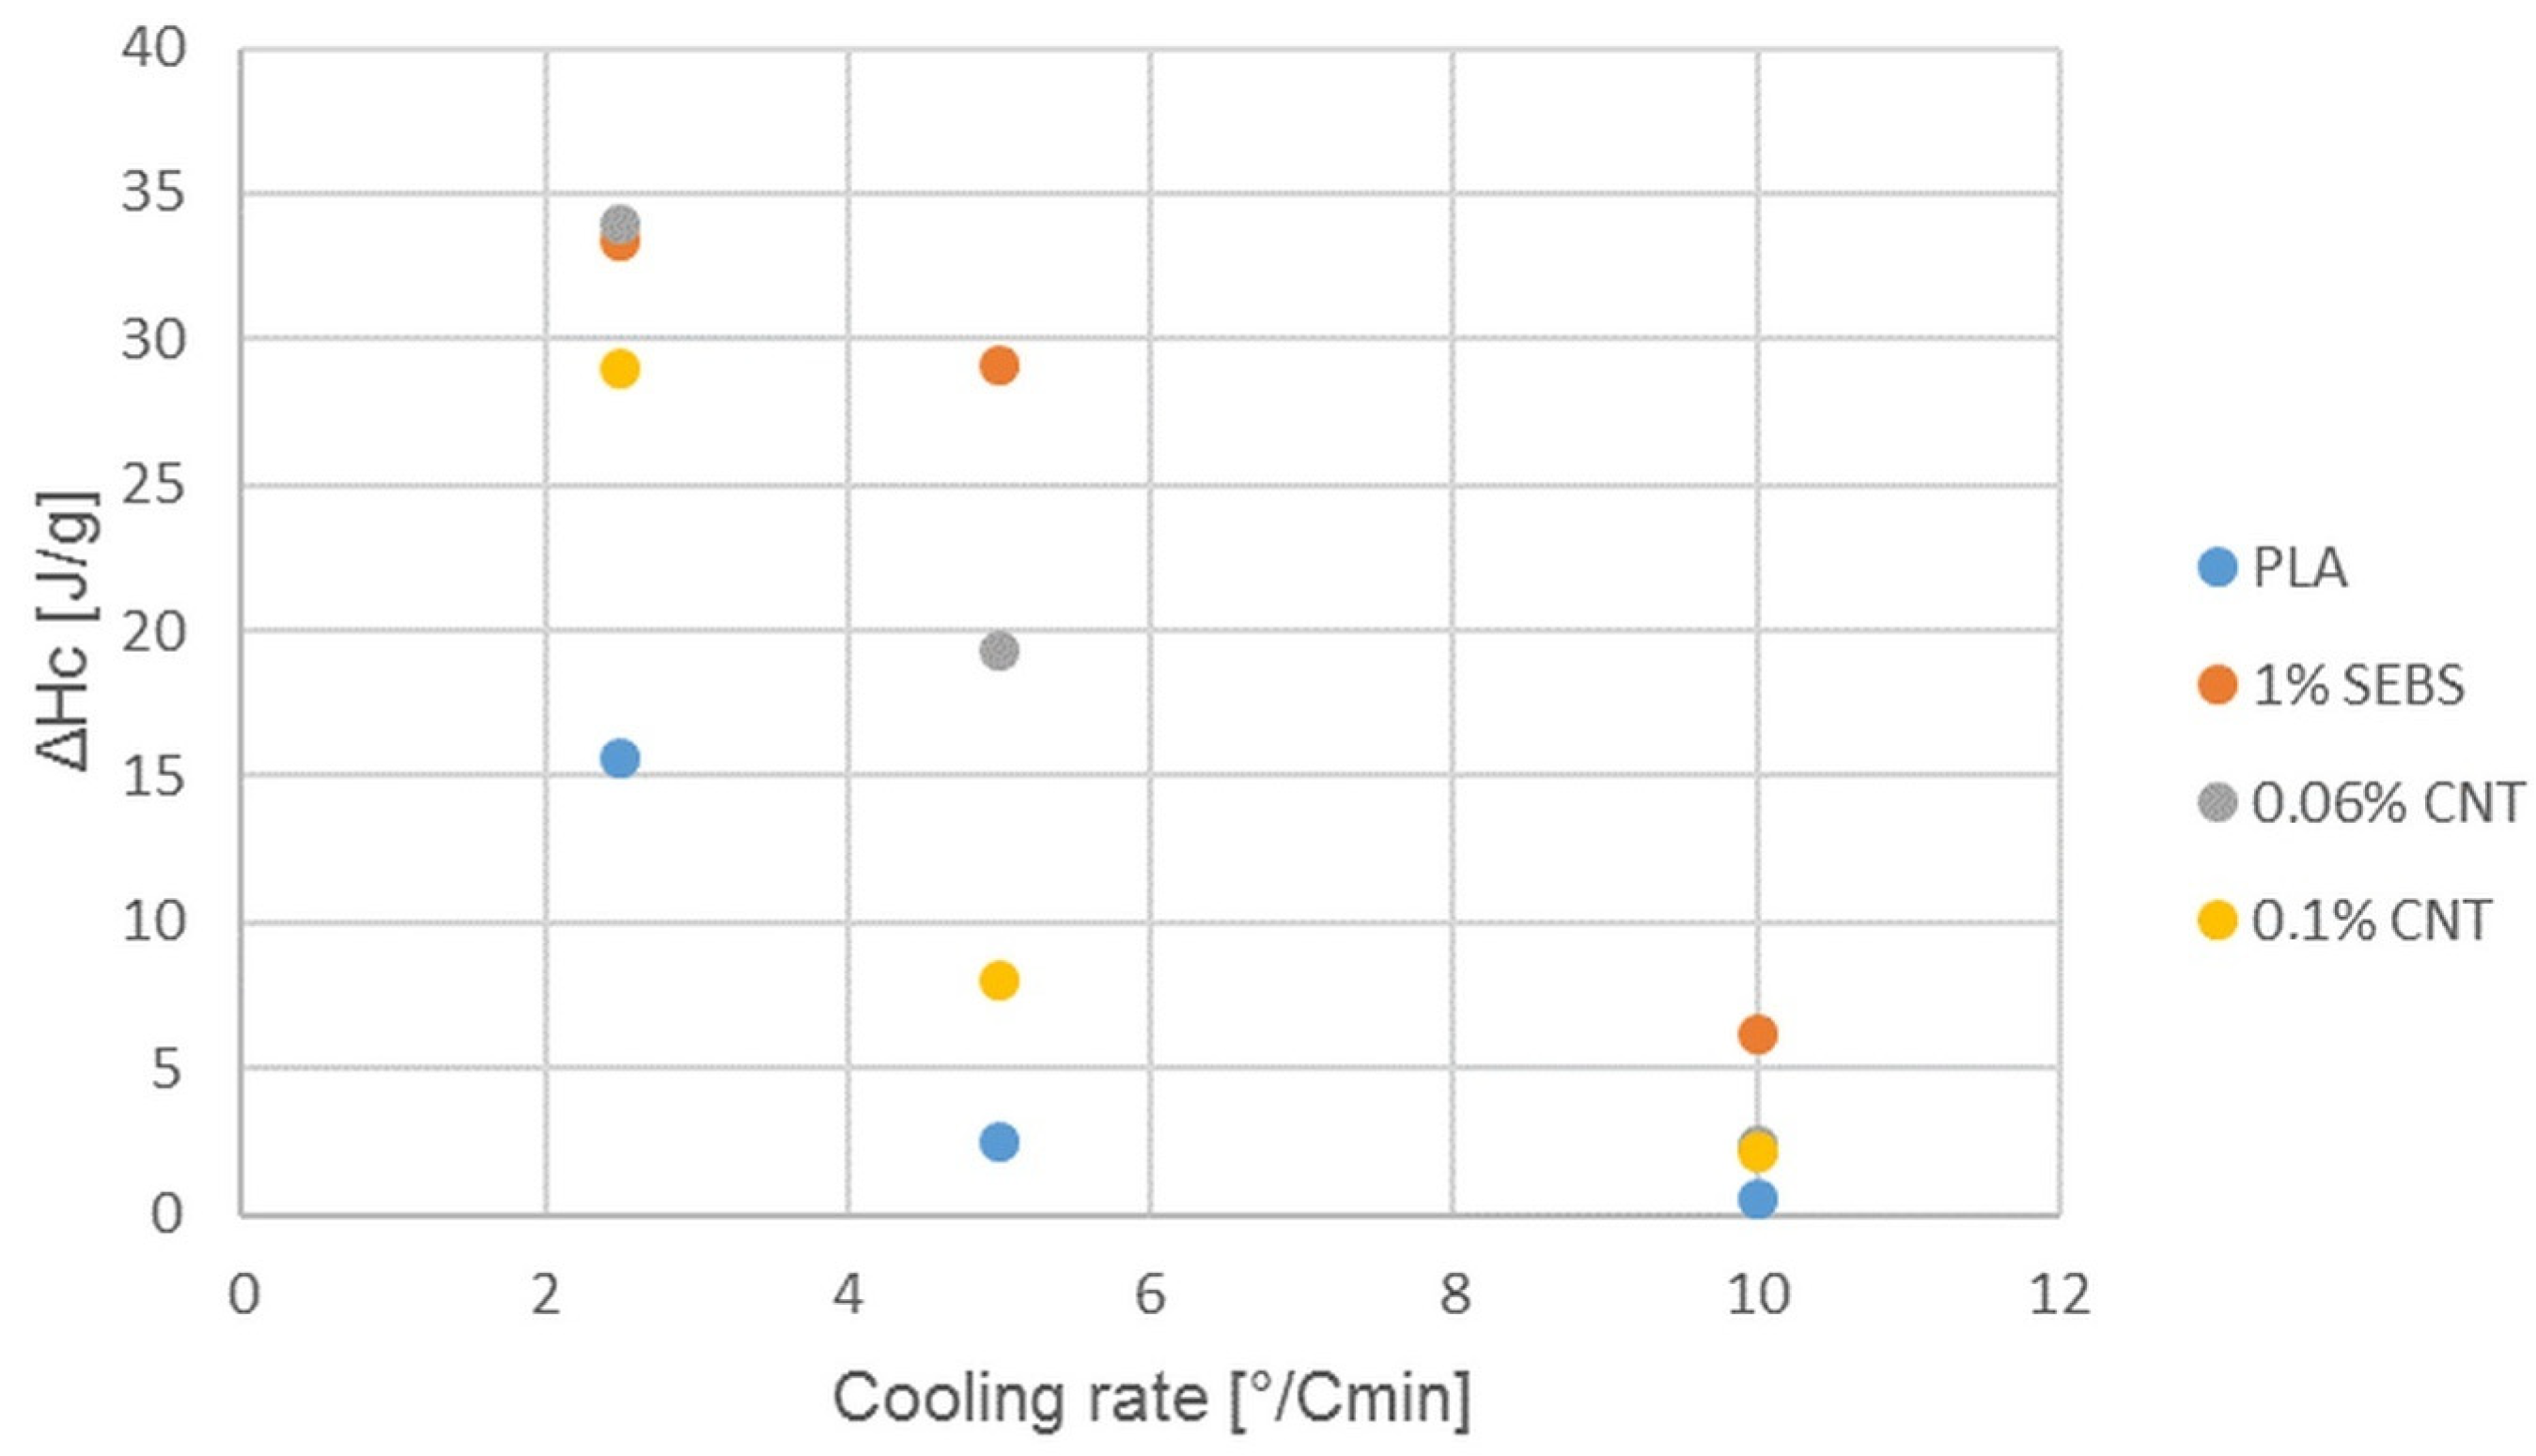
Figure 11) increase with increasing CNT content, which is evidence of nucleation. Thus, crystallization begins earlier, but the heat of crystallization (
Figure 12) does not increase, which is likely to mean a modification of the crystal structure. The two peaks in the 0.1% CNT crystallization curve refer this. The first peak, as it precedes SEBS nucleation, is clearly the crystal structure formed by CNT.
The heat of crystallization may also have been reduced because SEBS has been shown to be a good nucleating agent, so that at higher cooling rates, the addition of CNT rather inhibits the nucleation of SEBS. There is too much nucleating agent while less time is available for crystallization, so too much growing crystallite inhibits each other. In the case of slow cooling, however, it is possible to prevail the positive effect of carbon nanotubes.
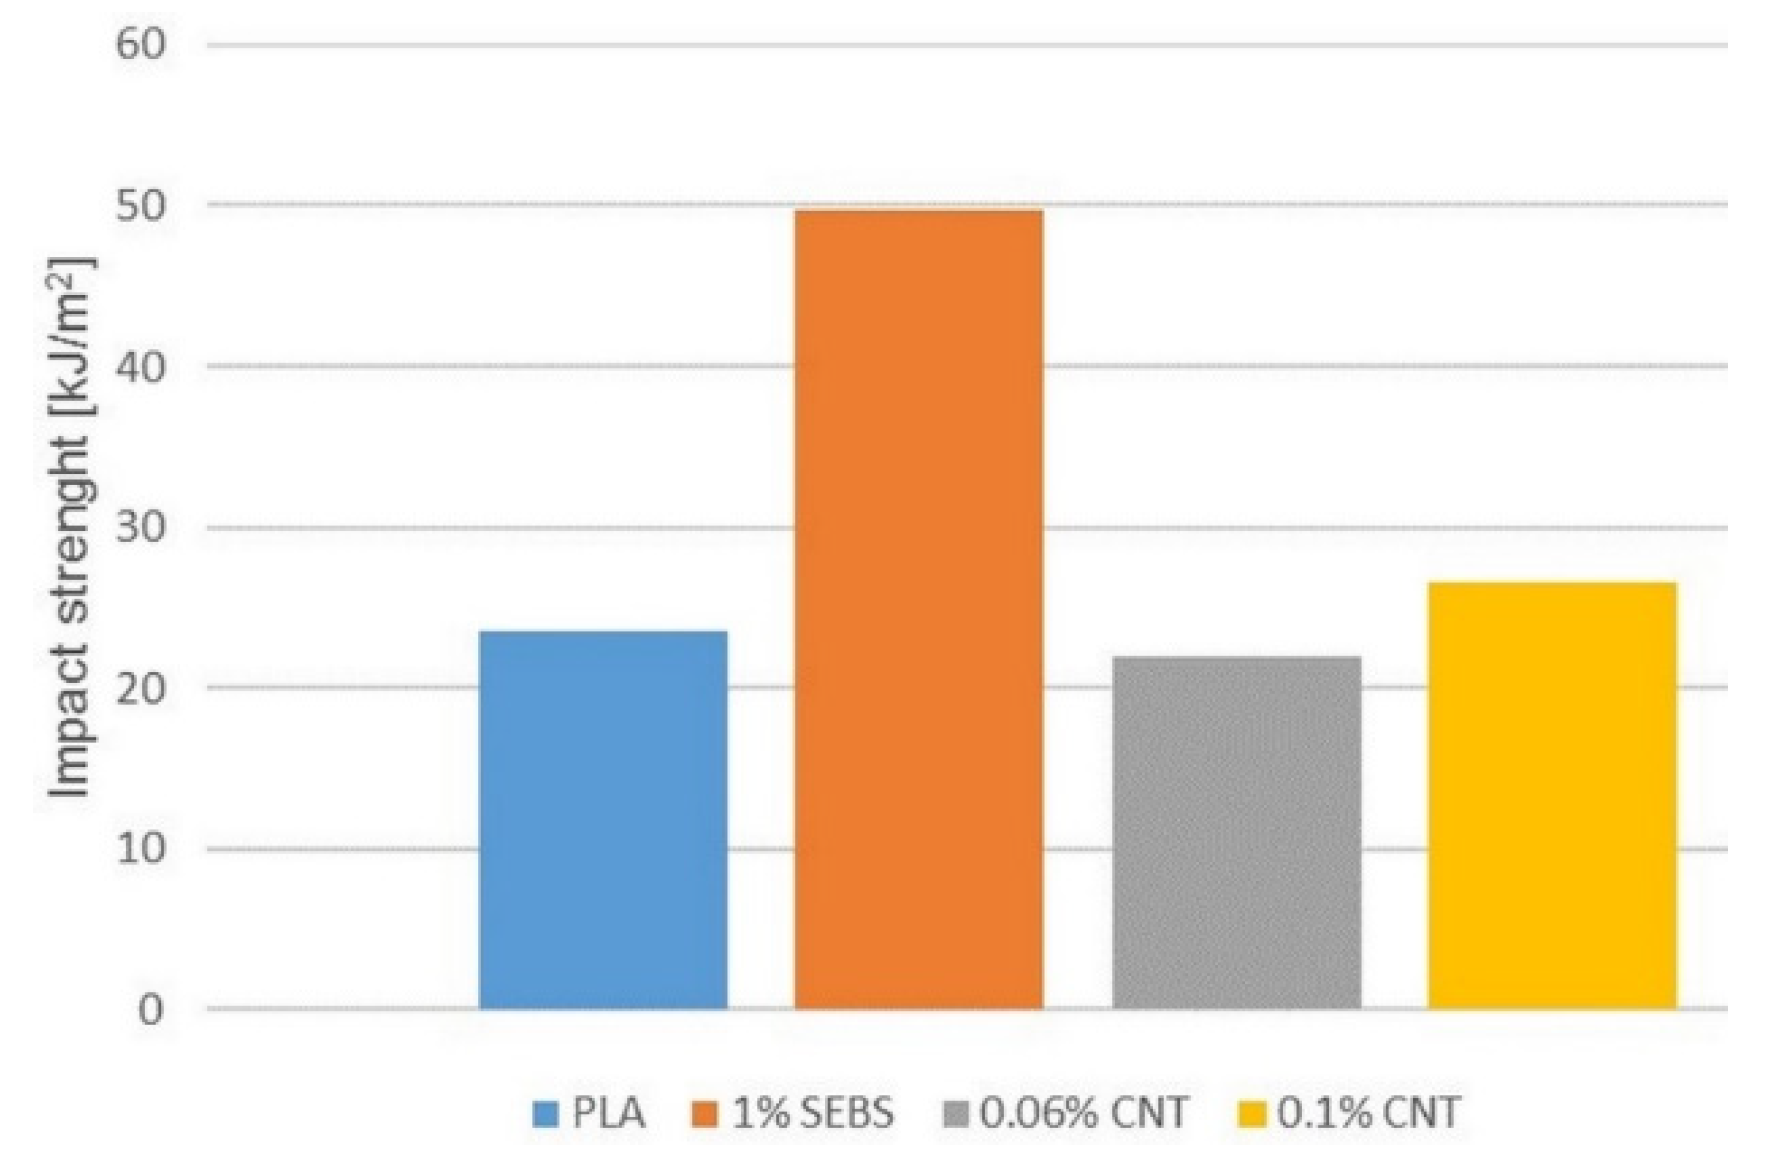
Figure 13 depicts the results of the Charpy impact testing of nanocomposites compared to the original PLA and 1% SEBS sample. Comparing the results of the nanocomposites with the original PLA and the samples containing 1% SEBS, it can be seen that the impact strength of the PLA doubled under the influence of SEBS and then decreased back to its original value when CNTs were added. Increasing the content of CNTs slightly increased the impact strength (
Figure 13). However, looking at
Figure 14, it is important to note that both PLA and 1% SEBS samples were broken in their full cross-section during the study. The direction of fracture was perpendicular to the longitudinal axis of the specimen. In contrast, for samples containing CNTs, only partial fiber separation occurred, or the fracture traveled longitudinally along the specimen and not perpendicularly. The magnitude of the force acting on the specimens did not reach the energy required for complete fracture but was large enough to cause a slight permanent deformation, and the 0.06% CNT specimens remained in a slightly bent state at the end of the test. For 0.1% CNT samples, the impact energy could cause fiber separation, but the specimens almost regained their original shape. Numerical values show a decrease, while in reality, the carbon nanotube changes the impact resistance. It is likely that this effect is caused by an improvement in the adhesion of the layer in the impact behavior of the material.
Figure 15,
Figure 16 and
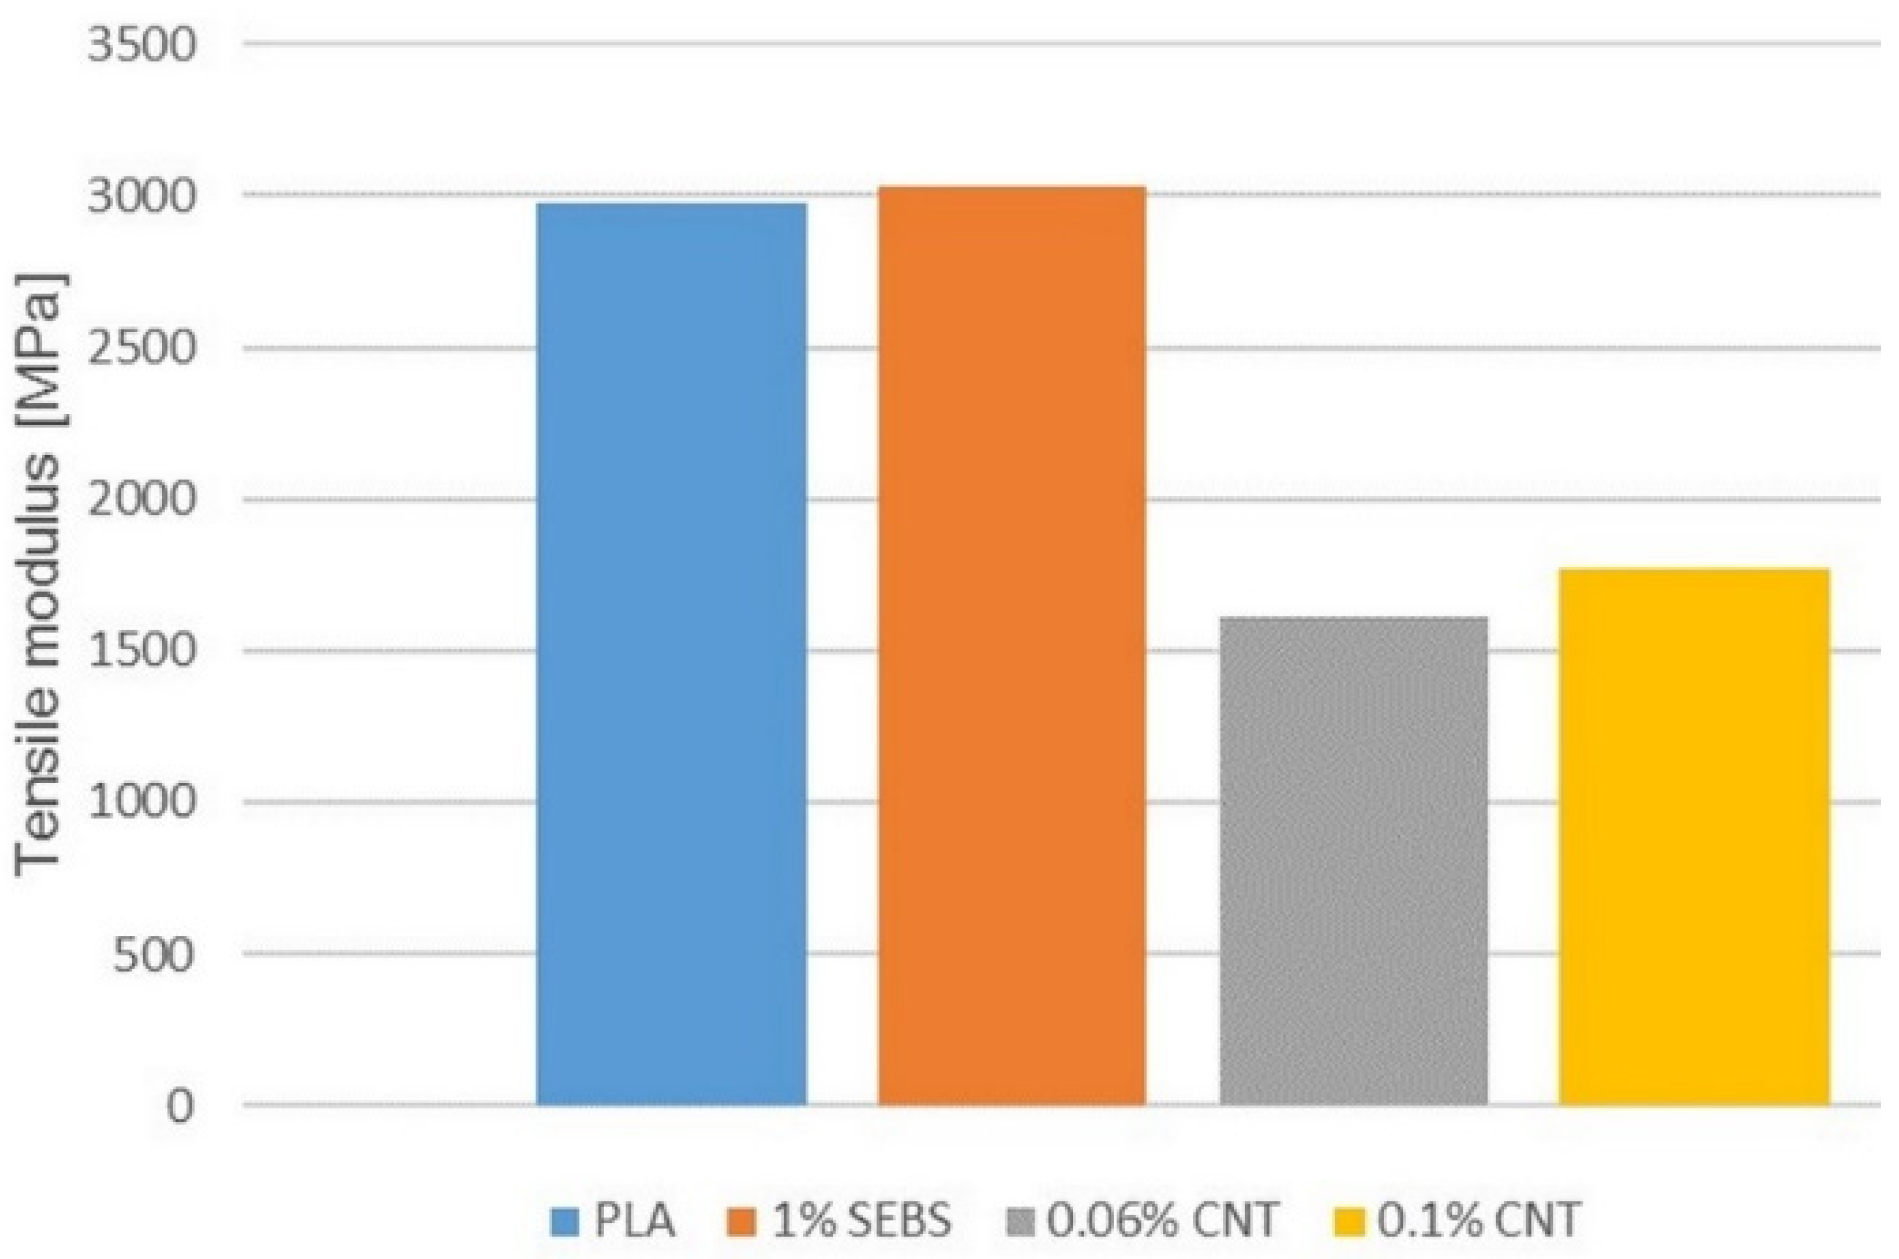
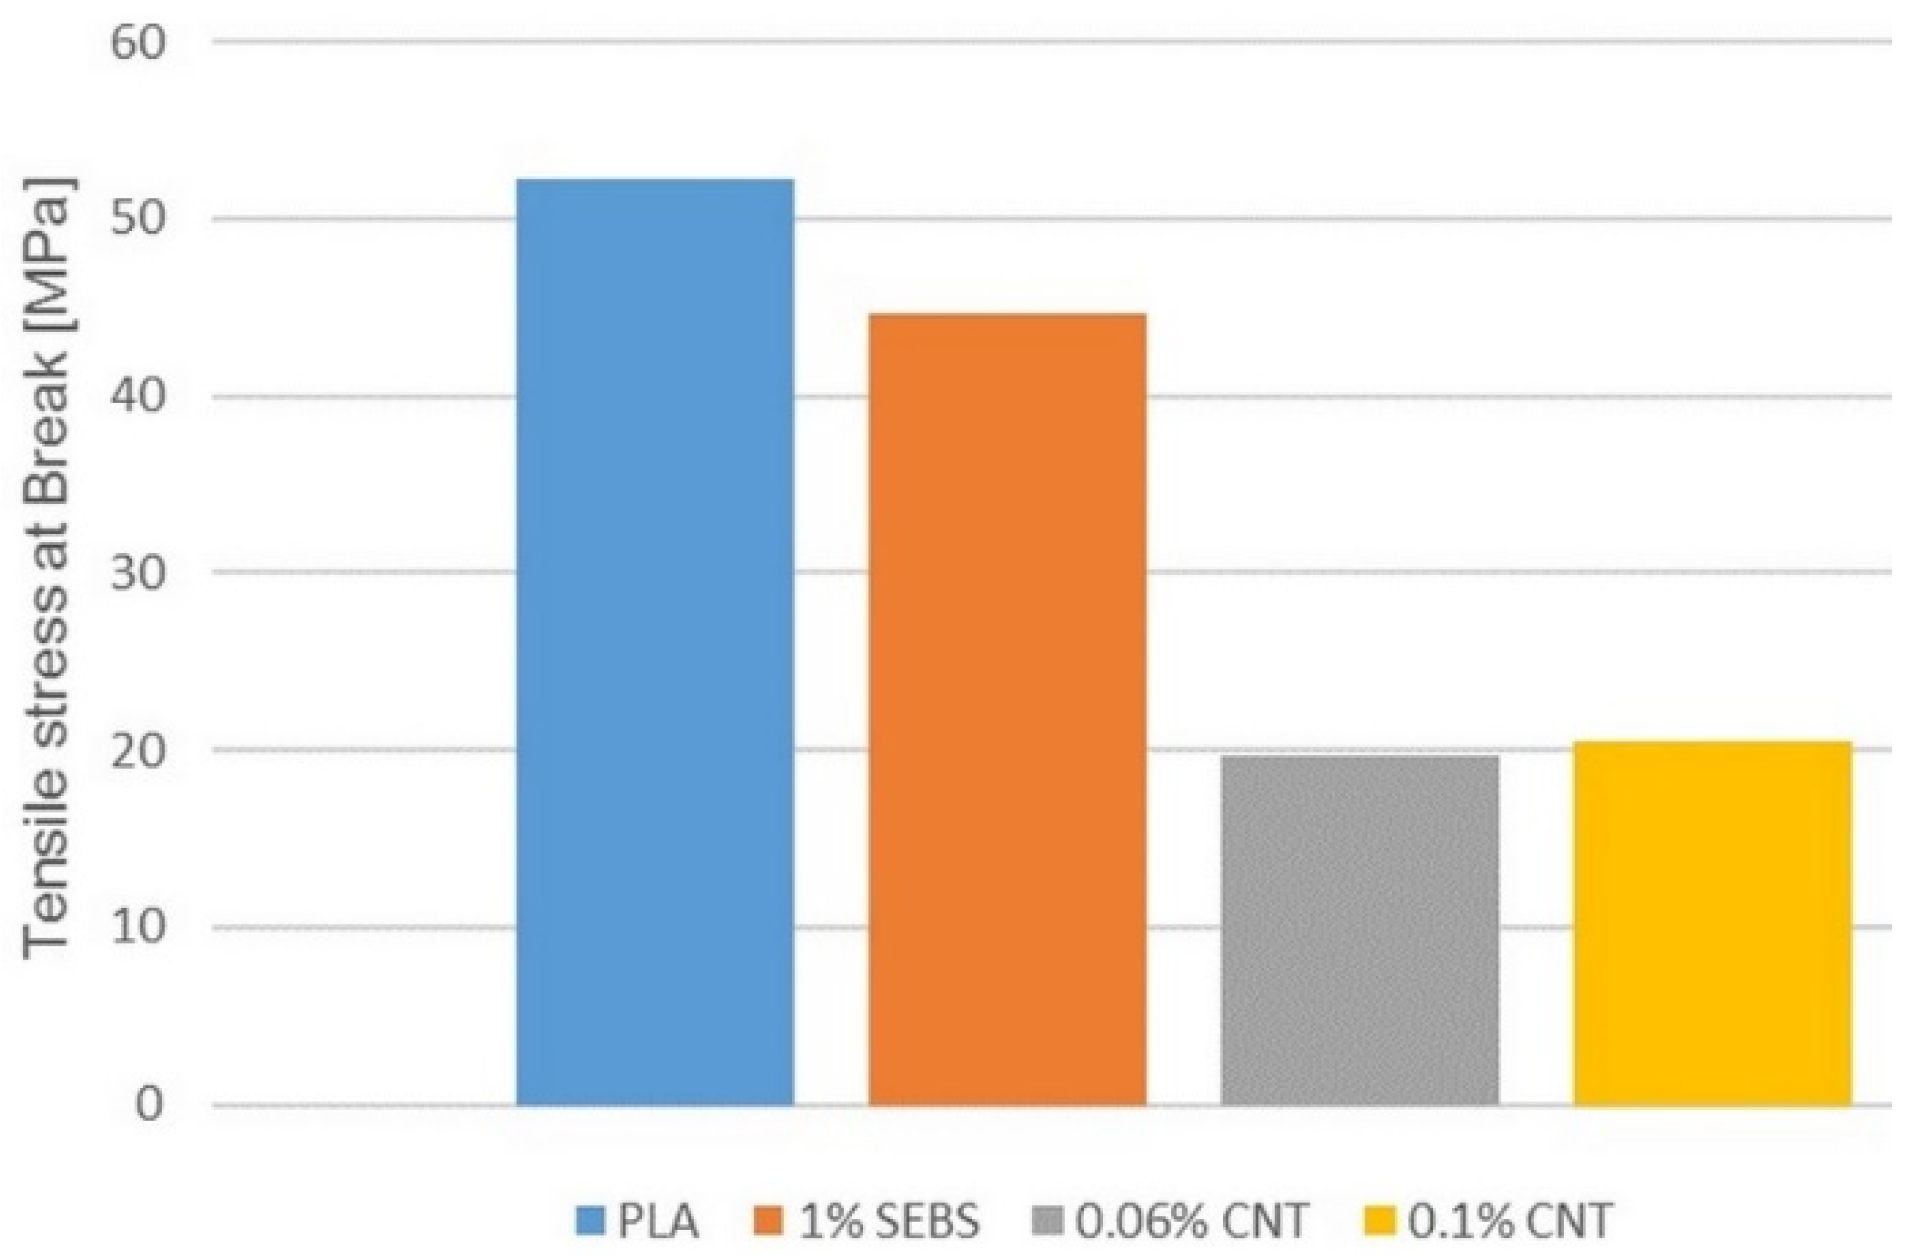
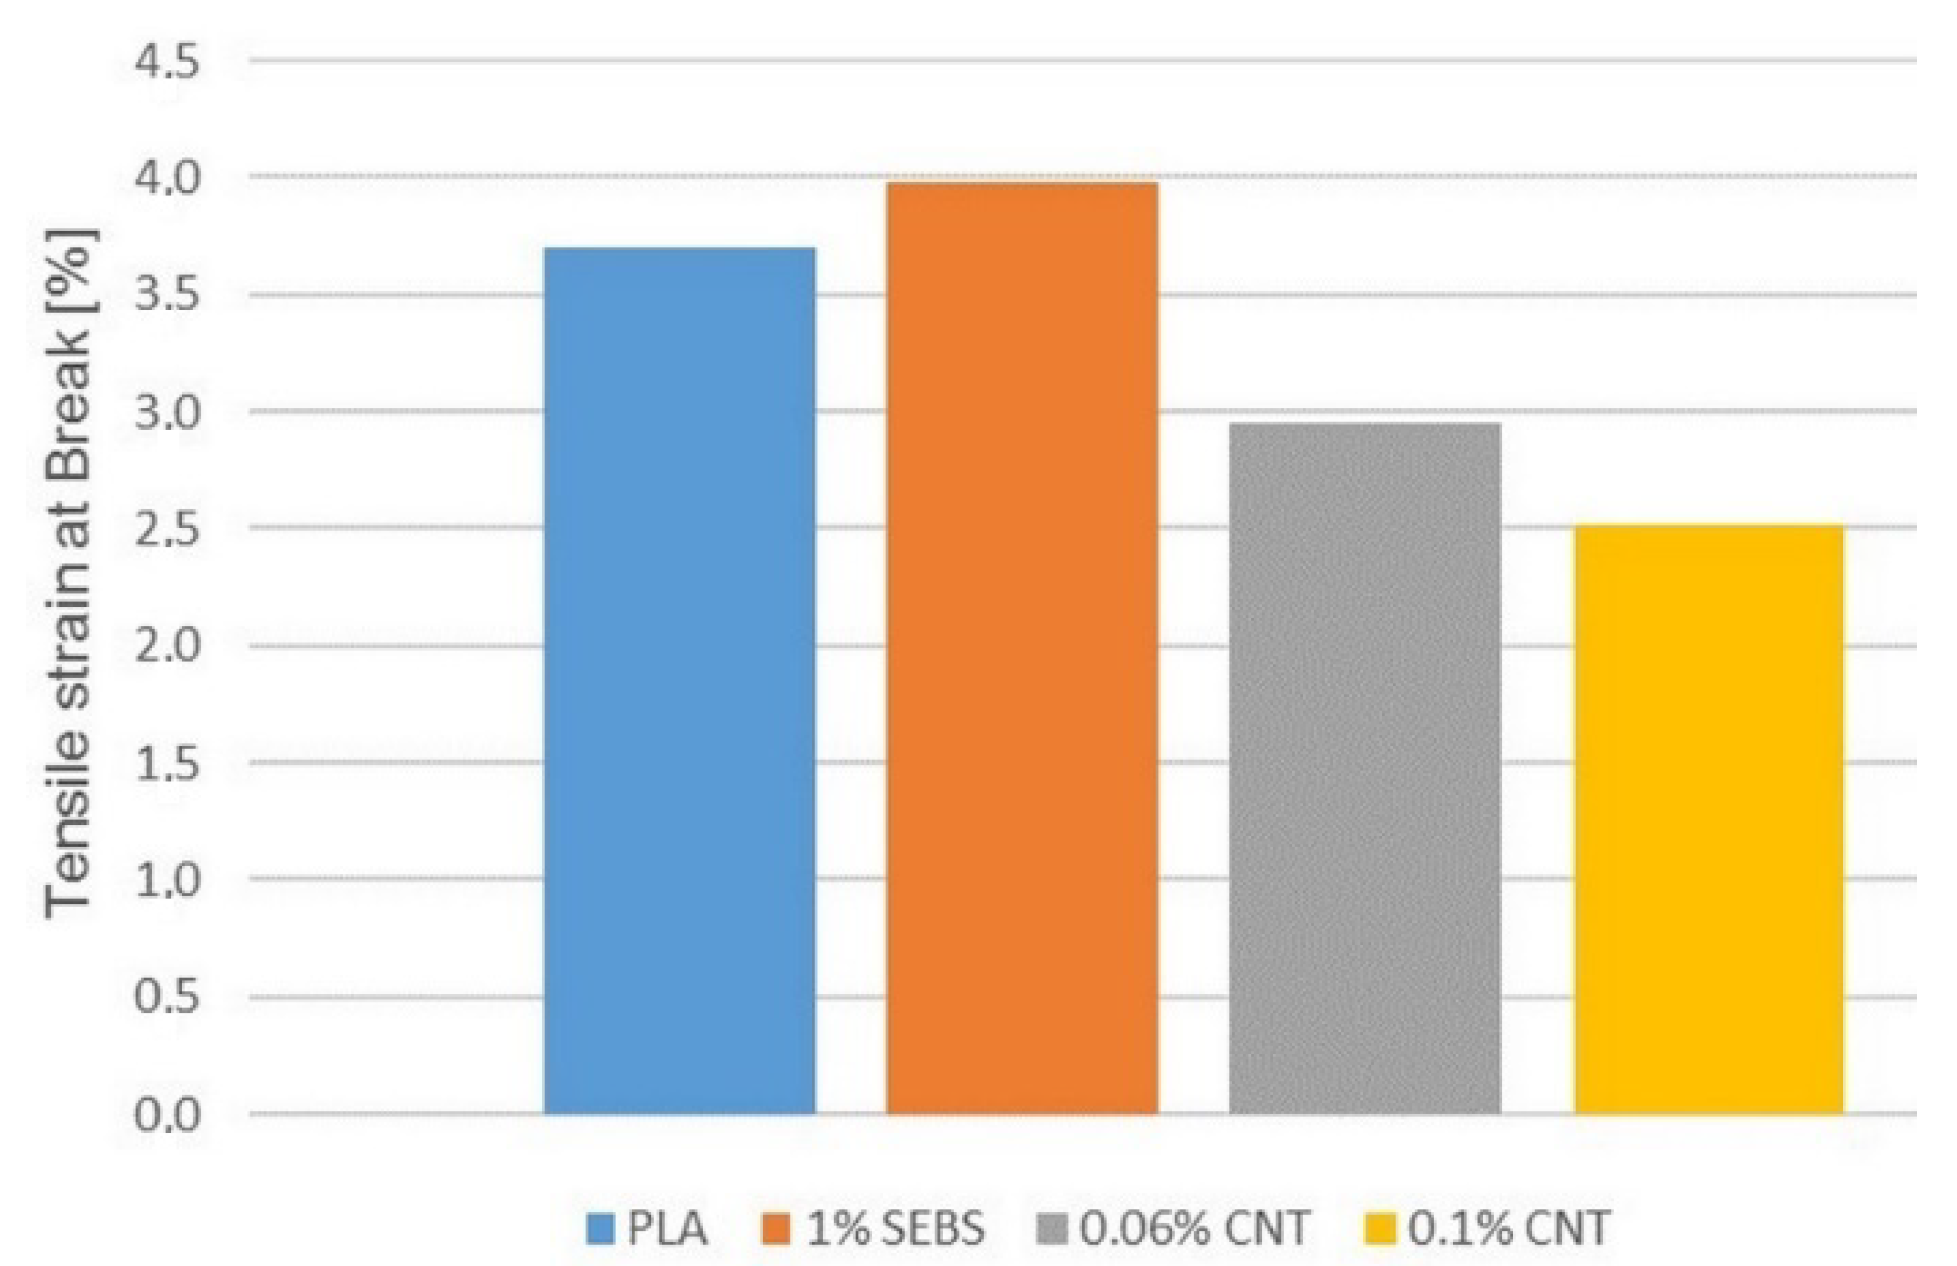
Figure 17 show the results of tensile test, the tensile modulus and the tensile strength and the elongation at break.
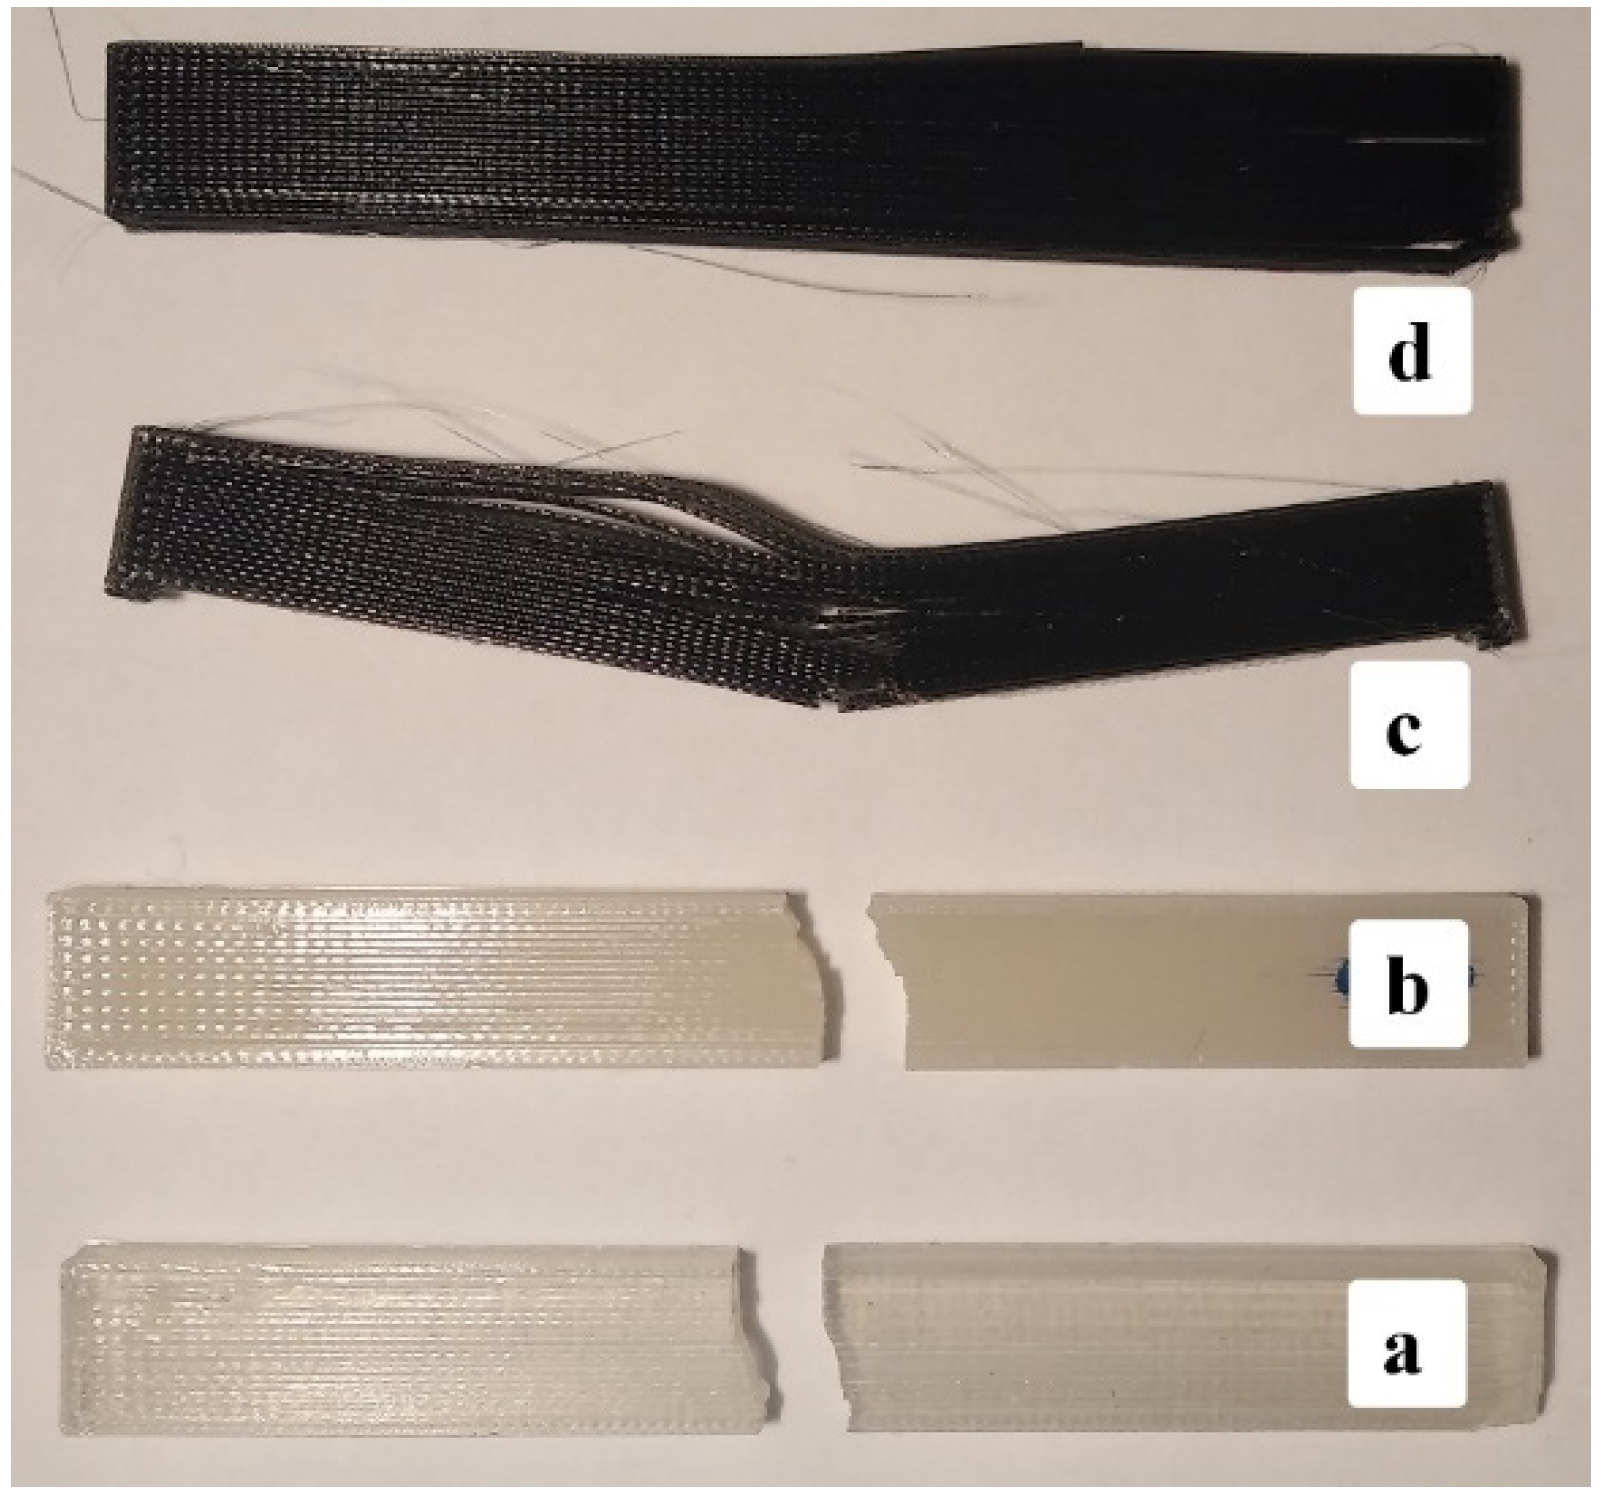
The results of the tensile test show that with the addition of carbon nanotubes, the results decrease. The tensile modulus and the tensile strength are halved, and the elongation at break is slightly reduced. However, visual inspection of the torn specimens shows (
Figure 18) that the PLA and 1% SEBS specimens broken along a line in the full cross-section, perpendicular to the longitudinal axis, while the CNT-containing specimens again show fiber separation and there is no well-defined fracture line. The reason for the decrease in values may be the separation of the fibers, which can be prevented or reduced by changing the printing parameters; for example, by raising the printing temperature. These are the subject of further investigation.
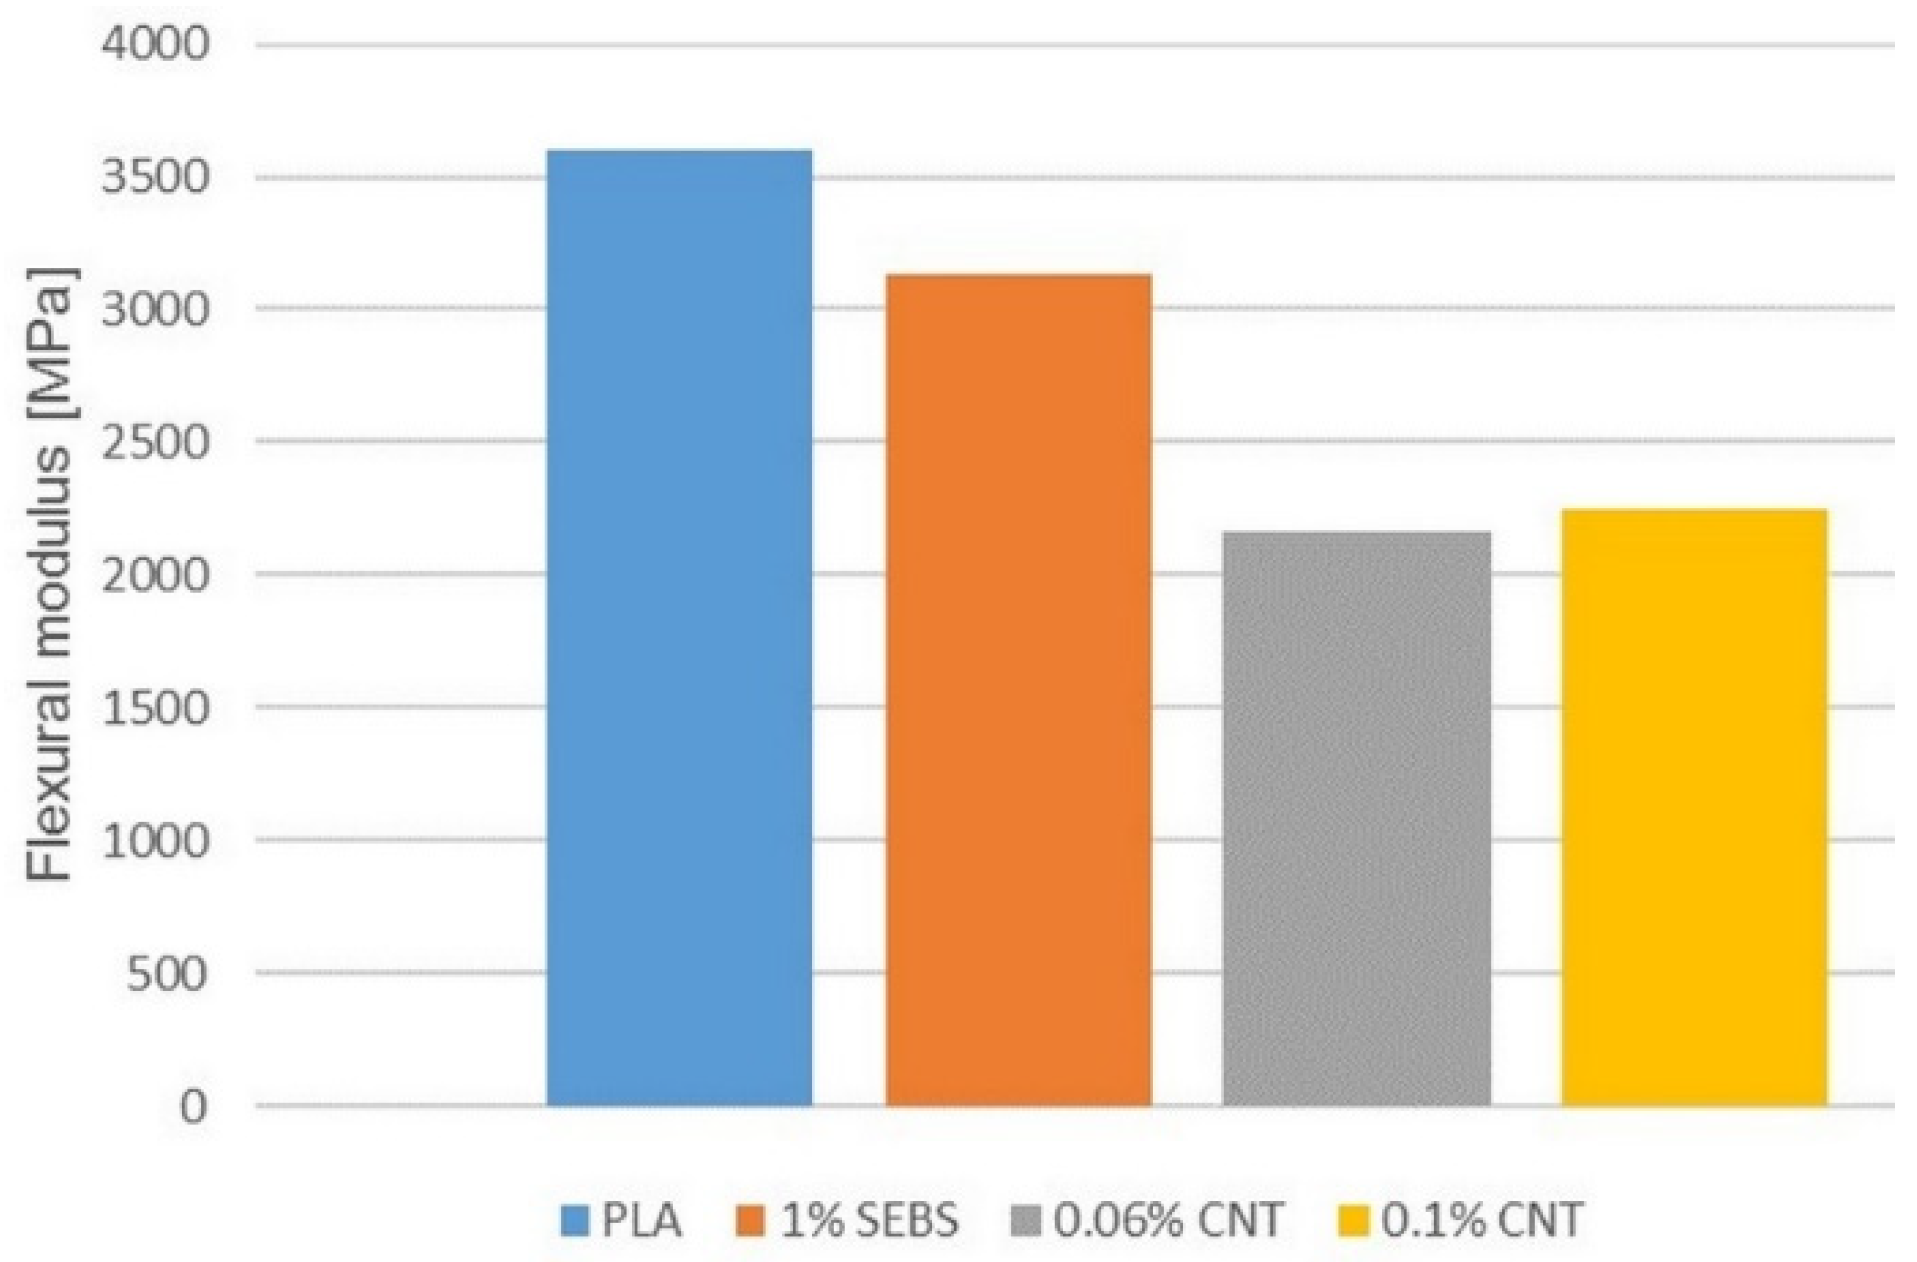
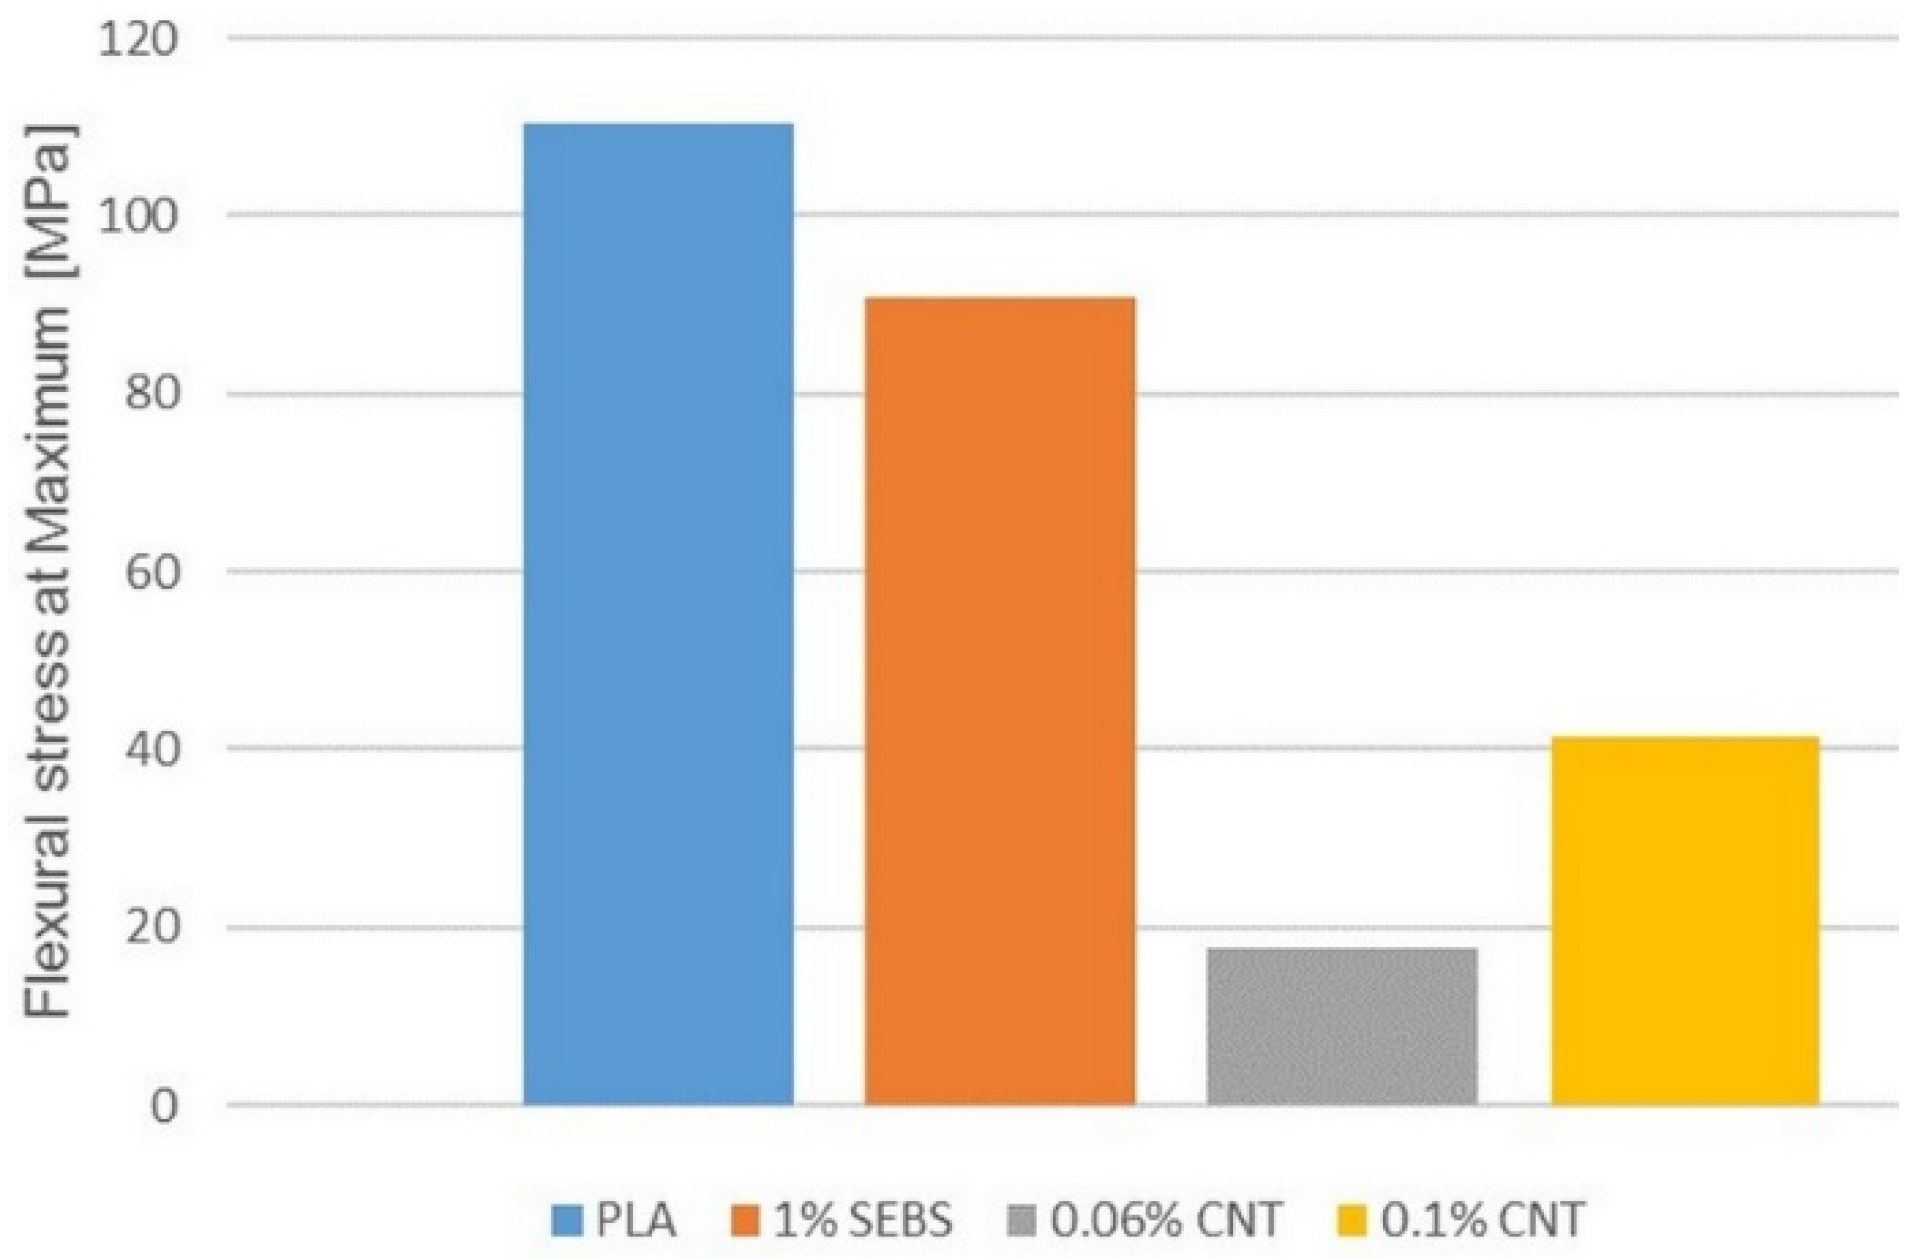
Figure 19,
Figure 20 and
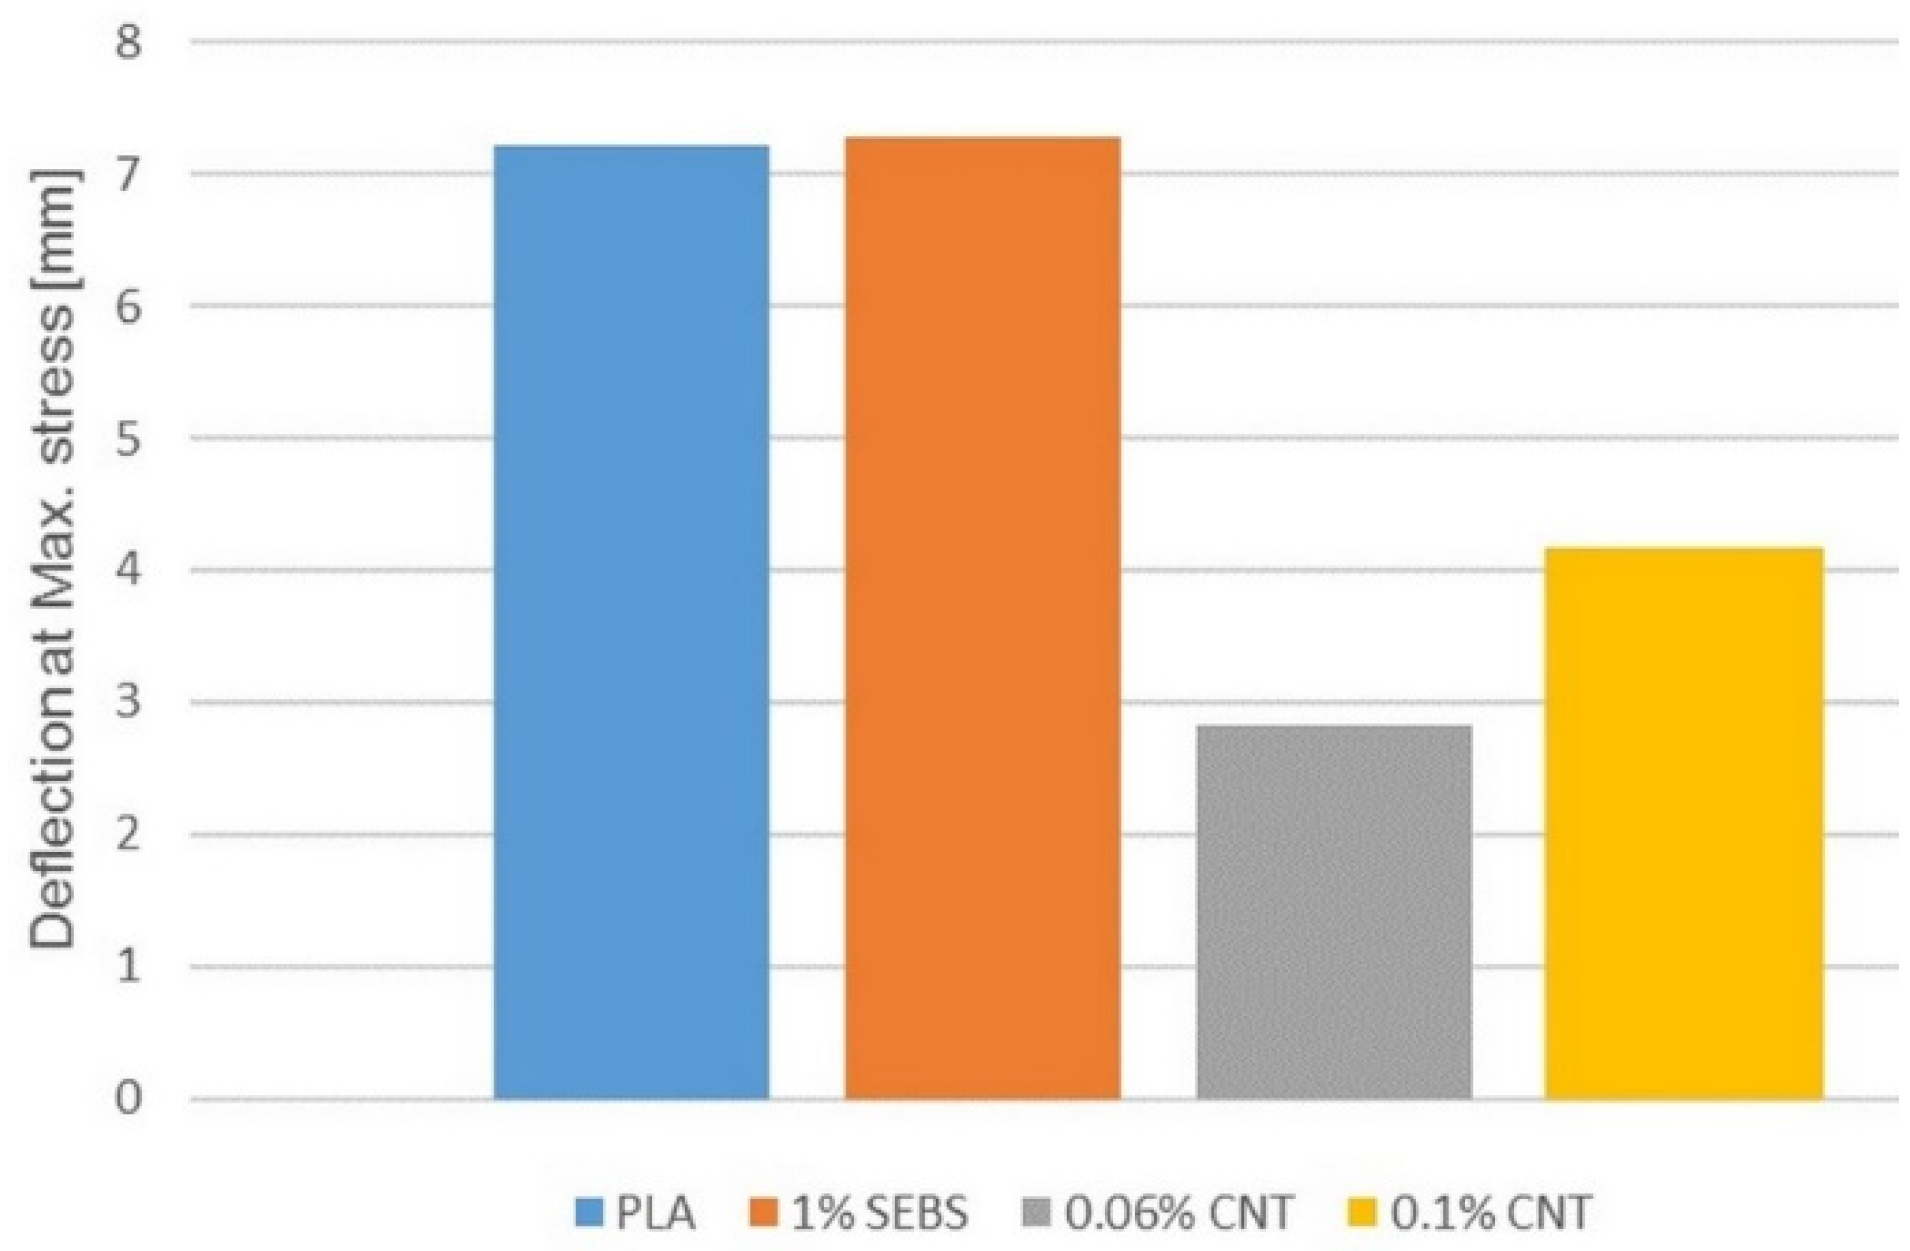
Figure 21 show the results of bending test, the flexural modulus, the flexural stress at maximum and the deflection at maximum stress.
The change in the results of the bending test is similar to that observed in the tensile test. The values decrease in all cases of the flexural modulus, the maximum flexural stress and the deflection at the maximum stress. The 1% SEBS sample shows lower values compared to the original PLA and the values further decrease if the CNTs are also mixed into it. Increasing the carbon nanotube content slightly increases the values but is still lower compared to samples with pure PLA or 1% SEBS.
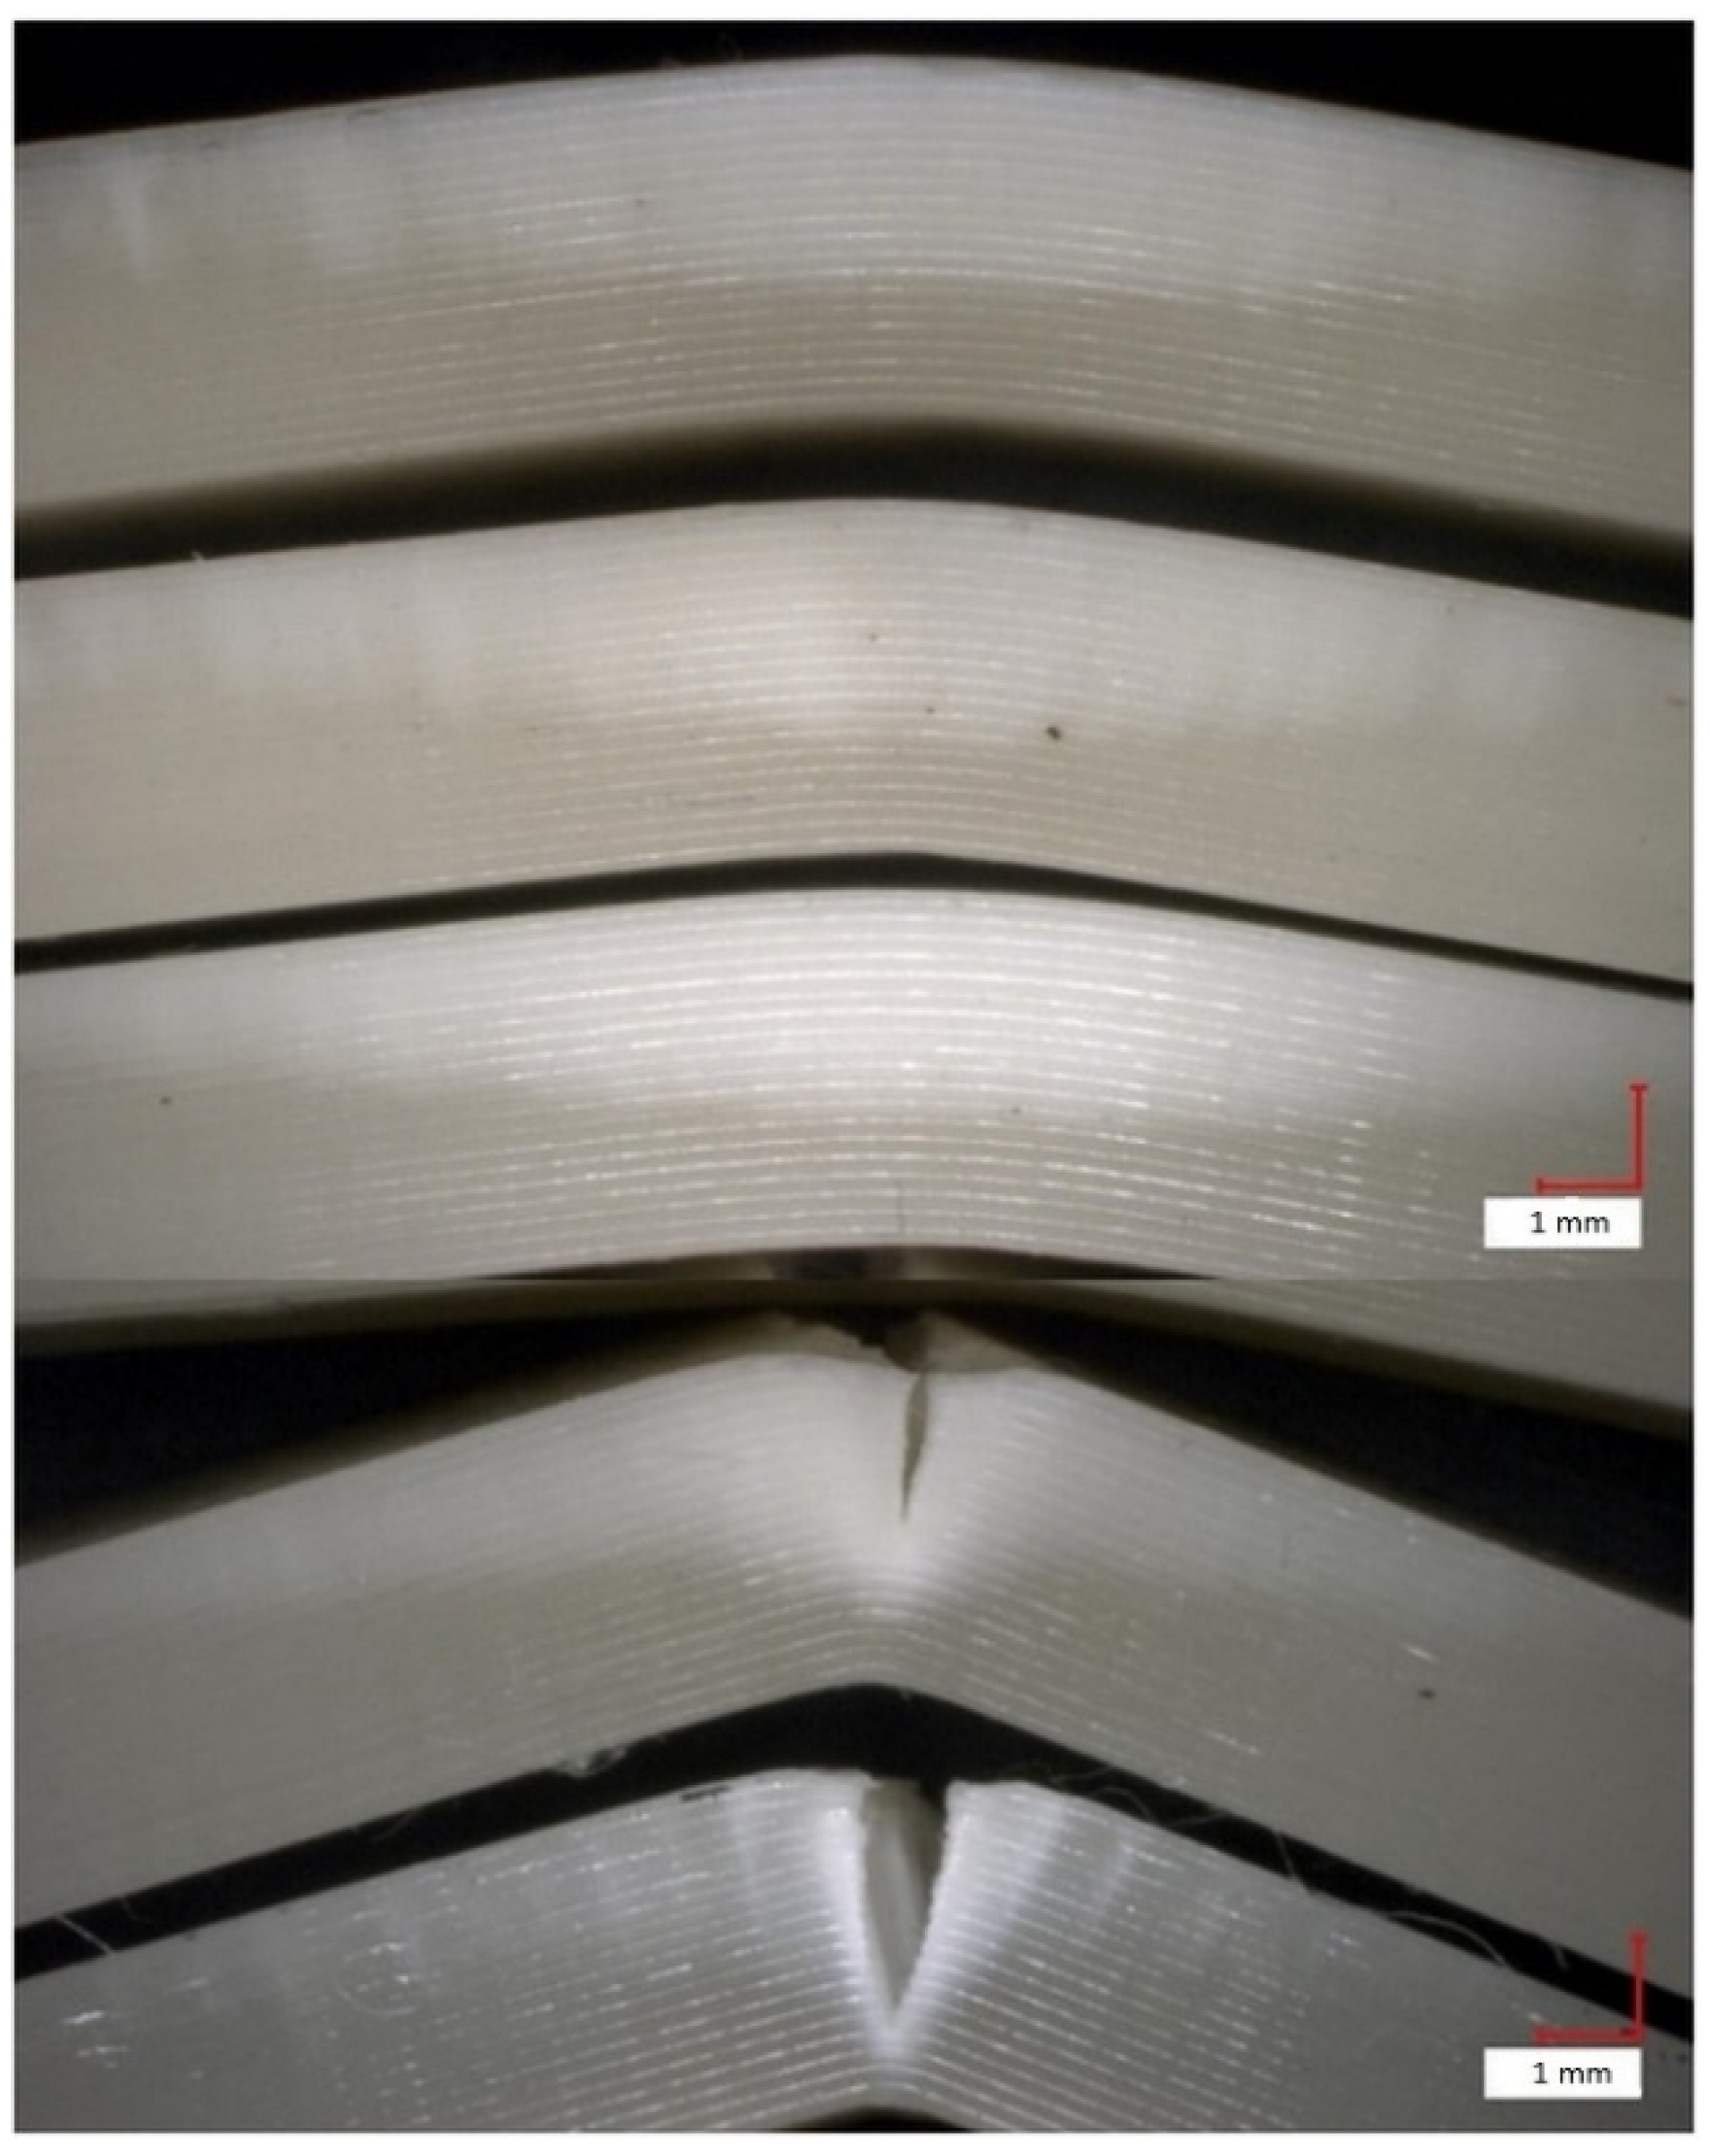
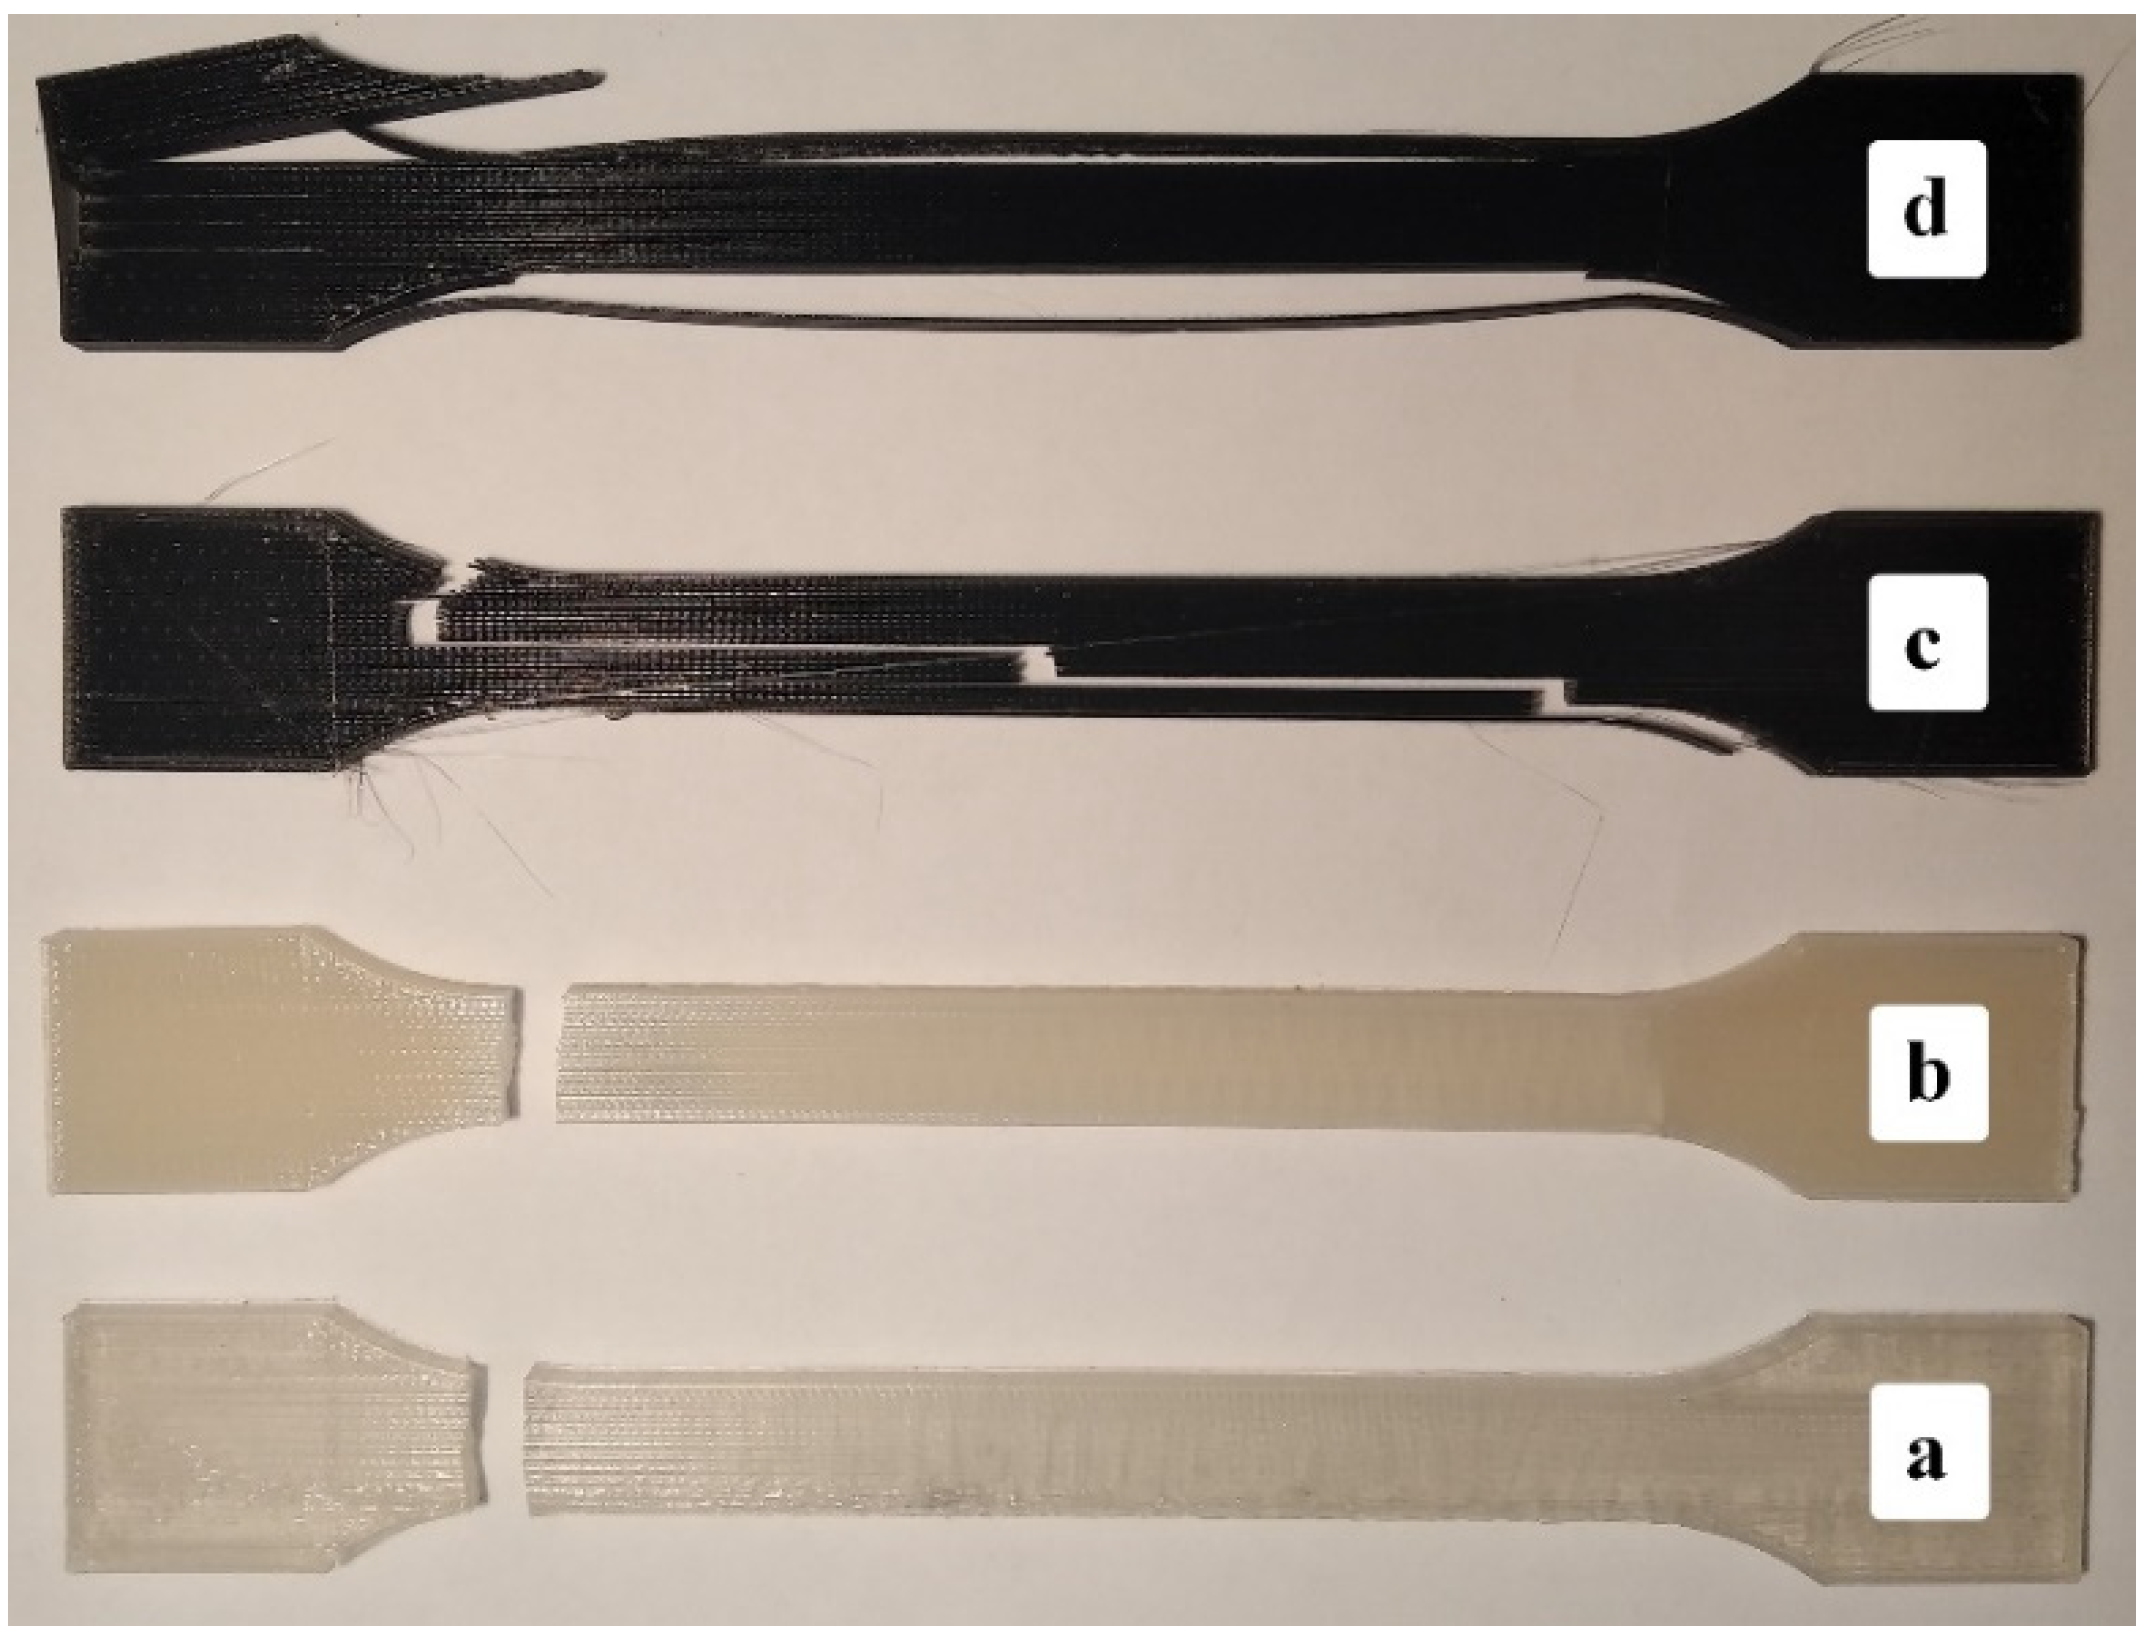
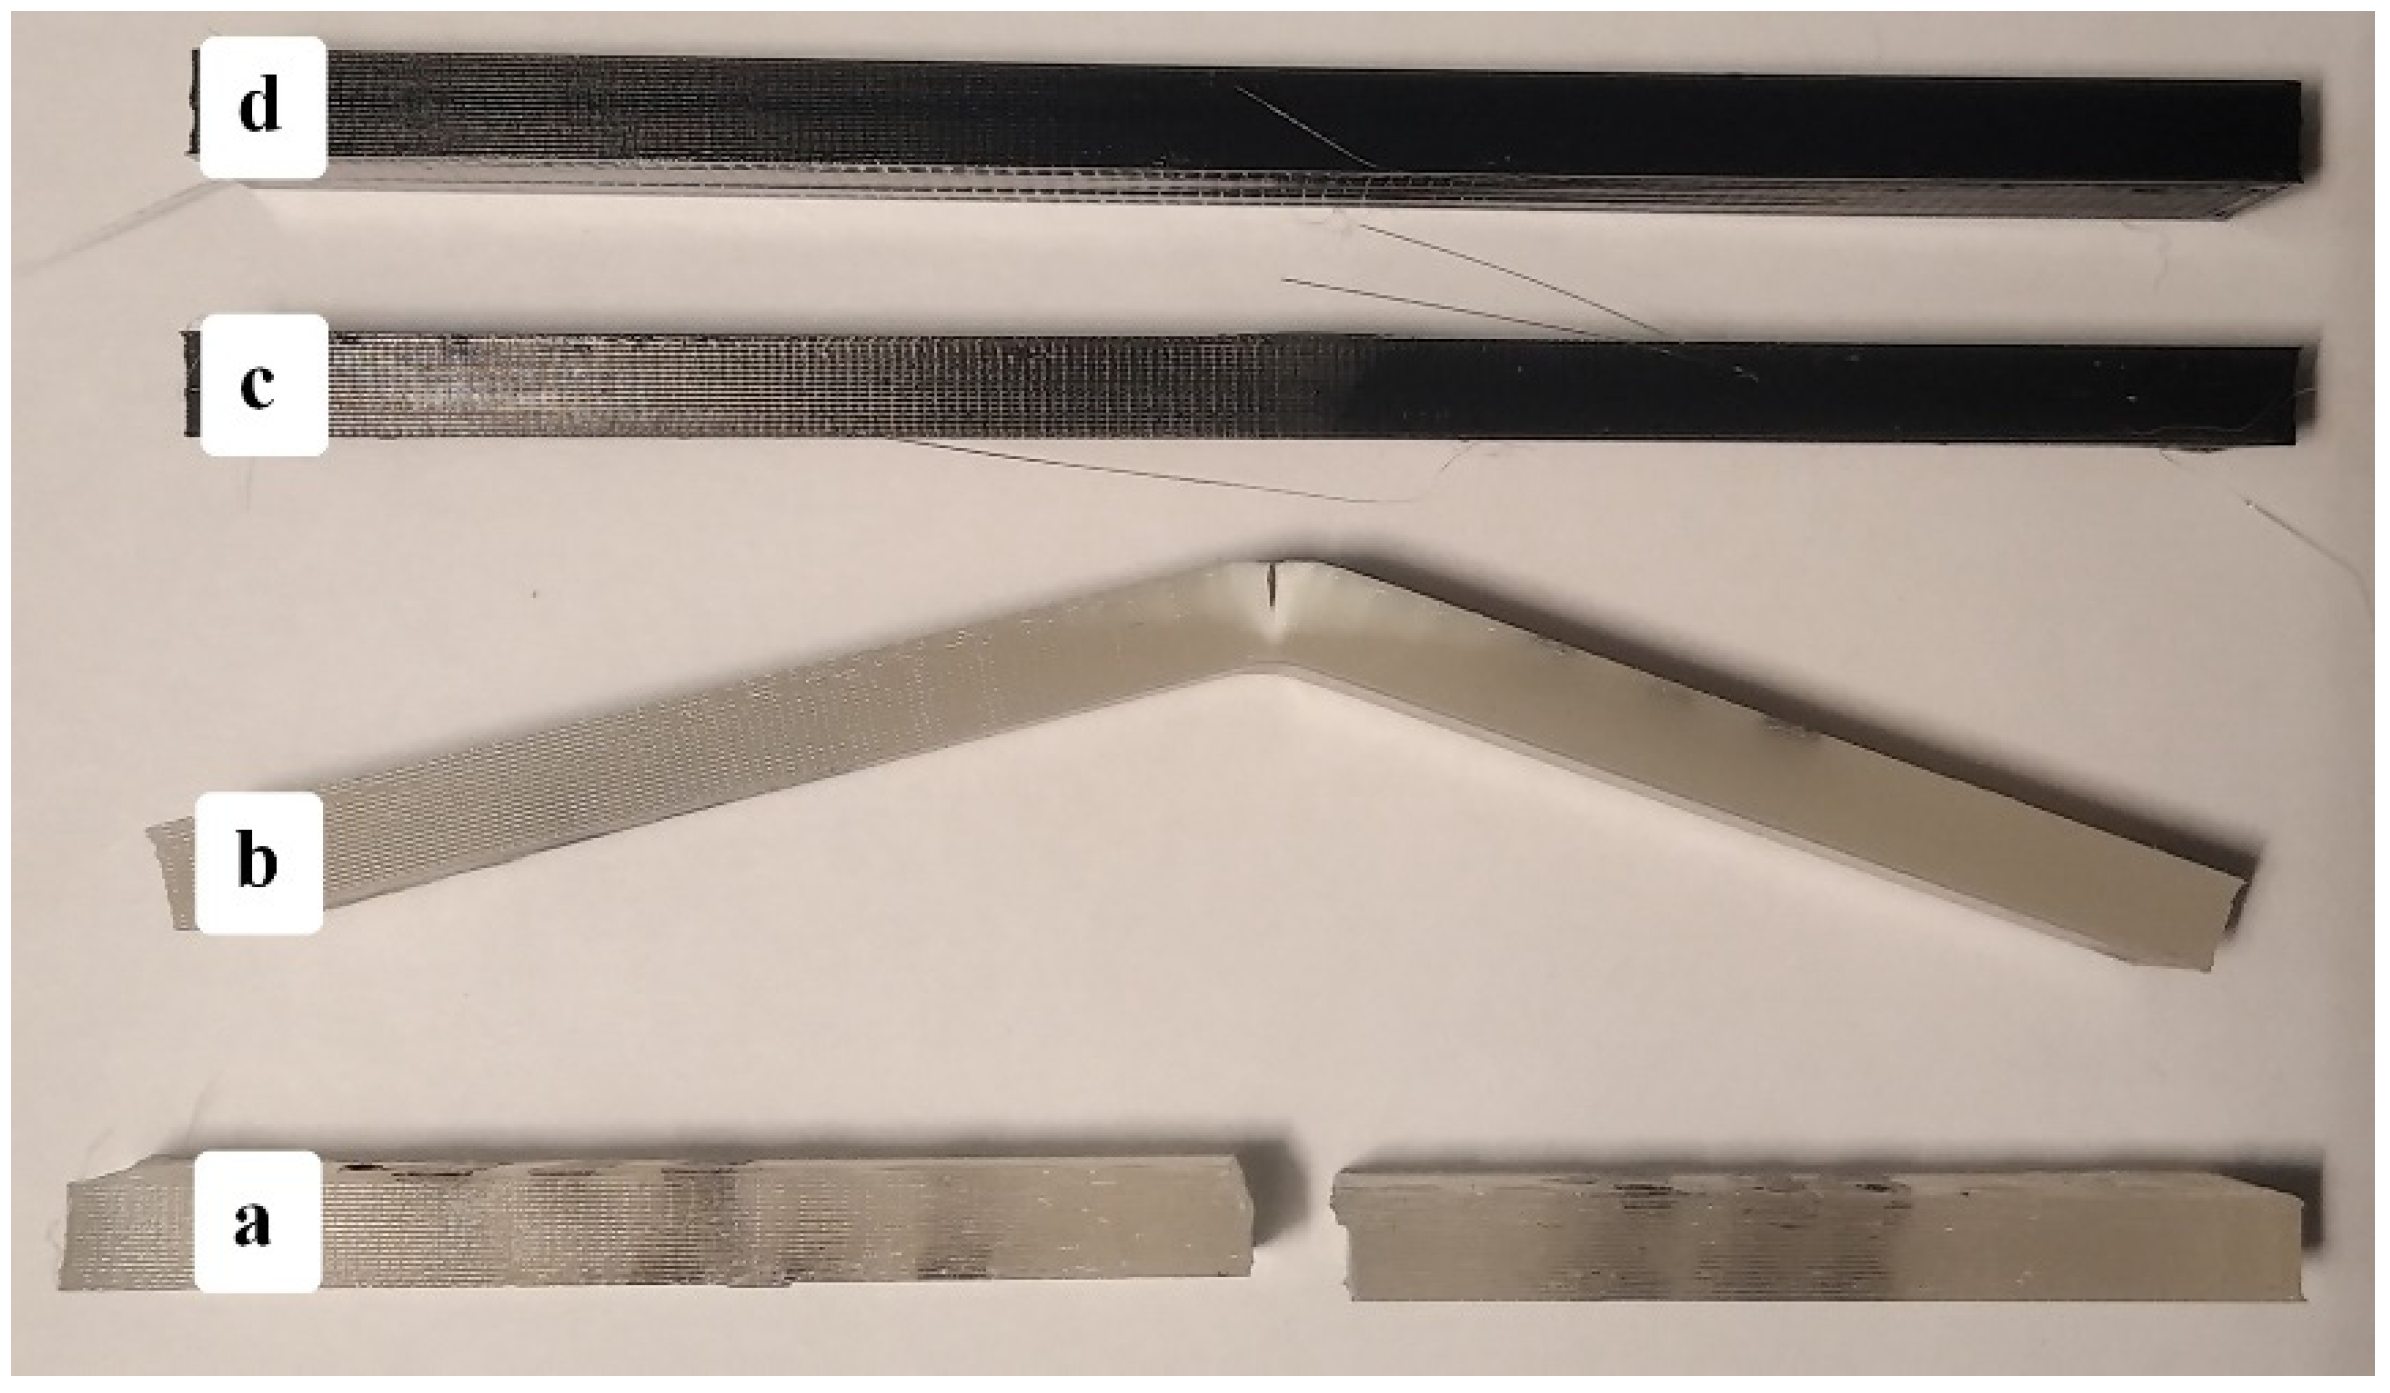
However, if we look at the specimens after the test (
Figure 22), we can see that the pure PLA was broken in the full cross-section, the 1% SEBS sample suffered partial fracture, but the samples containing different amount of CNTs did not fracture. In addition, not only did they not break, but they also did not suffer a partial fracture, and they almost completely regained their straight shape after the test. The same cannot be said for the 1% SEBS sample, as it suffered from permanent deformation and remained in its bent state.
The type of test is three-point bending, which means that the specimens are not fixed anywhere and can move freely. The free movement of the specimens made it possible to show that the carbon nanotube increases the degree of elastic deformation, pushing out the occurrence of residual deformation. In the case of a tensile test, the fixed grip and the test method lasting until complete failure prevented its detection.
However, this also indicates that the resulting flexural stress value is not a strength value but only a limit stress, and this limit stress is still less than the stress required for the residual deformation.
This means that PLA samples reinforced with 0.06 and 0.1% carbon nanotubes and containing 1% SEBS are not only able to withstand a high degree of bending stress but can also be said to be raw materials suitable for shape memory prototypes or product printing.


