Article

Automatic Diagnosis of Coronary Artery Disease in SPECT Myocardial Perfusion Imaging Employing Deep Learning

by
Nikolaos Papandrianos
* and
Elpiniki Papageorgiou
Department of Energy Systems, Faculty of Technology, University of Thessaly, Geopolis Campus, Larissa-Trikala Ring Road, 41500 Larissa, Greece
*
Author to whom correspondence should be addressed.
Appl. Sci. 2021, 11(14), 6362; https://doi.org/10.3390/app11146362
Submission received: 20 May 2021 / Revised: 6 July 2021 / Accepted: 7 July 2021 / Published: 9 July 2021
(This article belongs to the Special Issue Machine Learning/Deep Learning in Medical Image Processing)

Abstract

:
Focusing on coronary artery disease (CAD) patients, this research paper addresses the problem of automatic diagnosis of ischemia or infarction using single-photon emission computed tomography (SPECT) (Siemens Symbia S Series) myocardial perfusion imaging (MPI) scans and investigates the capabilities of deep learning and convolutional neural networks. Considering the wide applicability of deep learning in medical image classification, a robust CNN model whose architecture was previously determined in nuclear image analysis is introduced to recognize myocardial perfusion images by extracting the insightful features of an image and use them to classify it correctly. In addition, a deep learning classification approach using transfer learning is implemented to classify cardiovascular images as normal or abnormal (ischemia or infarction) from SPECT MPI scans. The present work is differentiated from other studies in nuclear cardiology as it utilizes SPECT MPI images. To address the two-class classification problem of CAD diagnosis, achieving adequate accuracy, simple, fast and efficient CNN architectures were built based on a CNN exploration process. They were then employed to identify the category of CAD diagnosis, presenting its generalization capabilities. The results revealed that the applied methods are sufficiently accurate and able to differentiate the infarction or ischemia from healthy patients (overall classification accuracy = 93.47% ± 2.81%, AUC score = 0.936). To strengthen the findings of this study, the proposed deep learning approaches were compared with other popular state-of-the-art CNN architectures for the specific dataset. The prediction results show the efficacy of new deep learning architecture applied for CAD diagnosis using SPECT MPI scans over the existing ones in nuclear medicine.

1. Introduction

Coronary artery disease (CAD) is one of the most frequent pathological conditions and the primary cause of death worldwide [1]. Described by its inflammatory nature [2], CAD is an atherosclerotic disease usually developed by the interaction of genetic and environmental factors [3] and leads to cardiovascular events including stable angina, unstable angina, myocardial infarction (MI), or sudden cardiac death [4]. Coronary heart disease (CHD) has a significant impact on mortality and morbidity in Europe, whereas its management requires a large proportion of national healthcare budgets. Thus, an accurate CAD (ischemia, infarction, etc.) diagnosis is crucial on a socioeconomic level. CAD diagnosis usually requires the implementation of suitable diagnostic imaging [5,6]. In this direction, non-invasive imaging techniques are the most preferred methods for diagnosing CAD, prognostication, selection for revascularization and assessing acute coronary syndromes [7]. Even though they have raised the direct expenditure regarding investigation, they are likely to reduce overall costs, leading to greater cost-effectiveness [7].
To achieve a reliable and cost-effective CAD diagnosis, a variety of modern imaging techniques such as single-photon emission computed tomography (SPECT) myocardial perfusion imaging (MPI), positron emission tomography (PET), and cardiovascular computed tomography (CT) have been utilized in clinical practice [8,9,10,11,12]. According to the EANM guidelines [13], radionuclide MPI with the contribution of SPECT imaging is a remarkably efficient technique regarding the CAD diagnosis [14,15].
Myocardial perfusion scintigraphy (MPS) is a well-established, non-invasive imaging technique proven effective in diagnosing angina and myocardial infarction. Specifically, SPECT MPI depicts the information regarding the spreading of a radioactive compound within the heart in three dimensions and is considered the most frequently performed procedure in nuclear cardiology [16]. Among others, it is used for predicting future CAD events and identifying coronary artery disease severity. Regarding the detection of myocardial ischemia, MPS outperforms ECG in terms of accuracy [7,17]. Furthermore, applying the MPS imaging method reduces the number of angiographies, offering proper treatment planning [18].
In the discipline of cardiovascular imaging using nuclear cardiology techniques, Slart et al. explored the notion regarding the deployment of artificial intelligence (AI) based on modern machine learning, focusing on methods and computational models currently used [19]. The goal is to enhance diagnostic performance through complex image analysis and interpretation [20]. However, image interpretation is a demanding yet time-consuming task which relies mainly on physicians’ experience [21]. On this basis, interpretation can be standardized with the contribution of CAD tools providing enhanced overall objectivity. The diagnostic accuracy is also improved, whereas the diagnostic time and healthcare costs are significantly reduced. Since there is an extensive existing and standardized imaging database in the realm of nuclear cardiac imaging, AI becomes the right candidate to be utilized in this domain [22]. More specifically, AI is currently spreading throughout three main areas related to cardiac SPECT/CT and PET/CT imaging. These involve the processes of automation of image detection and segmentation, spotting patients suffering from obstructive coronary artery disease (CAD), and risk assessment of coronary syndromes [23]. Overall, computer-aided diagnosis can serve as a supportive tool that can assist not only in the realization of unusual and difficult medical cases but to train inexperienced clinical staff too [23].
Computer-aided diagnosis is well attained through the deployment of machine learning, including deep learning algorithms, which are characterized by an extraordinary capability for medical image interpretation in the realm of medical image analysis [24,25,26,27]. Acknowledging that deep learning has shown remarkable efficacy in visual object detection and classification, researchers are highly intrigued by the capabilities that deep learning tools possess for improving the accuracy of CAD classification, helping nuclear physicians in this direction [28,29,30].

1.1. Deep Learning in Image Analysis

In the domain of medical imaging, deep learning is mainly implemented by convolutional neural networks (CNNs) [25,31,32,33], which are considered an efficient and dynamic approach for extracting features concerning image classification and segmentation tasks. Before CNN development, this process had to be accomplished using insufficient machine learning models or by hand. However, after their entrance into medical imaging, CNNs could use these features that had been learned directly from the data. Among the marked characteristics of CNNs is their capability of analyzing and classifying images, making them powerful deep learning models for image analysis [24,25,32,34]. CNN resembles a standard artificial neural network (ANN) in its characteristics, utilizing backpropagation and gradient descent for training. However, more pooling layers and layers of convolutions are present concerning its structure.
Among the most common CNNs methods in medical image analysis, there are:
AlexNet (2012): Developed by Yann LeCun et al. [35], this network has a similar architecture to LeNet [36] but consists of more filters per layer, including stacked convolutional layers. Its specifications include 11 × 11, 5 × 5, 3 × 3 convolutions, max pooling, dropout, data augmentation, rectified linear unit (ReLU) activations and stochastic gradient descent (SGD) with momentum [37]. It attaches ReLU activations after each layer, either convolutional or fully connected. The deep learning boom was attributed to AlexNet, when this architecture won the 2012 ILSVRC competition by a considerable margin. Some features worth mentioning are the computational split among many GPUs, dropout regularization, data augmentation, and the ReLU activation function.
ZFNet (2013): This network constitutes a minor adaptation of AlexNet and won the 2013 ILSVRC competition [38].
VGGNet16 (2014): This network incorporates 16 convolutional layers and is popular due to its consistent structure [39]. Being similar to AlexNet, this model presents only 3 × 3 convolutions but comprises many filters. Currently, VGGNet16 is the most preferred choice in the community for feature extraction from images. At the same time, it gave great popularity to the notion of creating deeper networks by using smaller filter kernels [40].
GoogleNet: It involves a standard piled convolutional layer and one or more fully connected layers [41]. Inception modules were also introduced, applying different-sized filters to the input and concatenated in the end. This way, the module can extract different levels of features simultaneously. Another notion introduced by GoogleNet, which won the 2014 ILSVRC competition, was that there is a global average pooling instead of fully connected layers in the network’s ending, reducing the model parameters.
ResNet (2015): This type of CNN architecture introduced the “identity shortcut connection” to handle the well-known “vanishing gradients” issue that characterizes deep networks. This technique revealed that extremely deep networks could use standard SGD along with residual modules for their training [42].
DenseNet (2017): Being another important CNN architecture, DenseNet outweighs other networks as it sorted out the gradient vanishment problem by directly connecting all its layers. Meanwhile, feature delivery is optimized; therefore, it can make more efficient use of it. It is a widespread technique for disease diagnosis, and more recently, it efficiently addressed the task of cardiac disease classification, as reported in [43].

1.2. Machine Learning and Deep Learning in SPECT Nuclear Cardiology Imaging

Currently, regarding SPECT MPI, which is one of the established methods for imaging in nuclear cardiology, researchers face the challenge of developing an algorithm that can automatically characterize the status of the patients with known or suspected coronary artery disease. The accuracy of this algorithm needs to be extreme due to the importance of people’s lives. Since deep learning algorithms have the capacity to improve the accuracy of CAD screening, they have been broadly explored in the domain of nuclear cardiovascular imaging analysis.
ML and DL methods have both been explored to assess the likelihood of obstructive CAD. In the context of ML algorithms for CAD diagnosis, ANN, SVM and boosted ensemble methods have been investigated. In a single-center study for the detection of obstructive CAD, ML was utilized with SPECT myocardial perfusion imaging (MPI) combining clinical data of 1181 patients and provided AUC values (0.94 ± 0.01), which were significantly better than total perfusion deficit (0.88 ± 0.01) or visual readout [44].
ML was also explored in the multi-center REFINE SPECT (REgistry of Fast Myocardial Perfusion Imaging with NExt generation SPECT) registry [45]. In this study, 1980 patients of possible CAD went through a stress/rest 99mTc-sestamibi/tetrofosmin MPI. The ML algorithm embedding 18 clinical, 9 stress test, and 28 imaging variables from 1980 patients produced an AUC of 0.79 [0.77, 0.80], which is higher than that regarding (TPD) 0.71 [0.70, 0.73] or ischemic TPD 0.72 [0.71, 0.74] in the prediction of early coronary revascularization.
In [46], ANN was applied for interpreting MPS with suspected myocardial ischemia and infarction on 418 patients who underwent ECG-gated MPS at a single hospital. The ANN-based method was compared against a conventional automated quantification software package. The results showed that the model based on neural networks presents interpretations more similar to experienced clinicians than the other method examined. Using clinical and other quantification data, the authors of [47] deployed the boosted ensemble machine learning algorithm and the ANN, achieving classification accuracy of up to 90%. SVMs have been exploited in [48] and have been trained considering a group of 957 patients with either correlating invasive coronary angiography or a low possibility of CAD. The AUC value produced for SVM classifier combining quantitative perfusion (TPD and ISCH) and functional data was as high as 86%.
Moreover, several recent research studies explore ML and DL methods for diagnosing CAD in nuclear cardiology using polar maps instead of SPECT MPI scans. The studies devoted to polar maps are set out as follows: in [49], Perfex and an ANN are used with polar maps, while in [50,51,52], polar maps were utilized along with DL methods. In [49], polar maps of stress and rest examinations of 243 patients who underwent SPECT and coronary angiography within three months were used as input images to train ANN models. The produced AUC results of receiver operating characteristics (ROC) analysis for neural networks was 0.74, surpassing the corresponding AUC for other physicians.
Regarding the application of DL for CAD prediction, the authors in [50] employed deep learning, which was trained using polar maps, for predicting obstructive disease from myocardial perfusion imaging (MPI). The outcome is an improved automatic interpretation of MPI comparing to the total perfusion deficit (TPD). As a result, a pseudo-probability of CAD was deployed per vessel region and per individual patient. An AUC value of 0.80 was calculated concerning the detection of 70% stenosis or higher, still outperforming TPD. The DL procedure automatically predicted CAD from 2-view (upright and supine) polar maps data obtained from dedicated cardiac scanners in 1160 patients, improving current perfusion analysis in the prediction of obstructive CAD [50].
The same team of authors presented another interesting application of DL in the prediction of CAD. A three-fold feature extraction convolutional layer joined with three fully connected layers was deployed to analyze SPECT myocardial perfusion clinical data and polar maps from 1638 patients [51]. These scientific works have investigated the integration of clinical and imaging data and show how to formulate new autonomous systems for the automatic interpretation of SPECT and PET images. The authors in [52] proposed a graph-based convolutional neural network (GCNN) which used Chebyshev polynomials, achieving the highest accuracy (91%) compared with other neural-network-based methods.
Recently, authors in [53] were the first to study CAD diagnosis using solely SPECT MPI scans in deep learning. They developed two different classification models. The first one is based on deep learning (DL), while the second is based on knowledge to classify MPI scans into two types automatically, ischemia or healthy, exclusively employing the SPECT MPI scans at the input level. Performing exploitation of the well-known DL methods in medical image analysis (such as AlexNet, GoogleNet, ResNet, DenseNet, VGG16, VGG19), the best DL model was determined to be VGG16 with support vector machine (SVM) deep features shallow, concerning classification accuracy. The first model to be developed exploits different pre-trained deep neural networks (DNNs) along with the traditional classifier SVM with the deep and shallow features extracted from various pre-trained DNNs for the classification task. The knowledge-based model, in its turn, is focused on converting the knowledge extracted from experts in the domain into proper image processing methods such as color thresholding, segmentation, feature extraction and some heuristics to classify SPECT images. First, the images were divided into six segments (A, B, C, D, E, F), and the features were extracted from each segment to measure the shapes. Next, a classification rule set assigned by experts was applied. The parameters were empirically identified and fine-tuned on the training and validation images. The produced overall 2-class classification accuracy was 93% for both methods.
As has emerged from the related literature regarding SPECT MPI, PET and PET-CT [54], a system based on deep learning provides similar performance to a nuclear physician in standalone mode. However, the overall performance is notably improved when it is used as a supportive tool for the physician [33,55,56,57,58]. Although SPECT MPI scans are of high importance for diagnosing CAD in nuclear cardiology, only one study was reported in the literature to apply CNNs in these types of MPI images. Thus, there is plenty of space for further research over the investigation on the advantageous and outstanding capabilities of CNNs in the field of nuclear cardiology.

1.3. Contribution of This Research Work

According to the previous work of the authors, new, fast and powerful CNN architectures were proposed to classify bone scintigraphy images for prostate and breast cancer patients in nuclear medicine [33,56,57,59]. More specifically, an RGB-based CNN model has been proposed to automatically identify whether a patient has bone metastasis or not by viewing whole-body scans. The results showed the superior performance of the RGB-CNN model against other state-of-the-art CNN models in this field [56,57]. Based on the advantageous features of the model, such as robustness, efficacy, low time cost, simple architecture, and training with a relatively small dataset [57], along with the promising results, authors were driven to study further and test the generalization capabilities of this methodology. This research work investigates the performance of the new models, applying them in nuclear cardiology, making the necessary parameterization and regularization to address the recognition of myocardial perfusion imaging from SPECT scans of patients with ischemia or infarction. Hence, the objectives are: (i) to diagnose cardiovascular disease by exploring efficient and robust CNN-based methods and (ii) to evaluate their performance, in line with SPECT MPI scans. A straightforward comparative analysis between the proposed RGB-based CNN methods with state-of-the-art deep learning methods, such as VGG16, Densenet, Mobilenet, etc., found in the literature was also conducted to show their classification performance. The produced results reveal that the proposed deep learning models achieve high classification accuracy with small datasets in SPECT MPI analysis and could show the path to future research directions with a view to a further investigation of the classification method application to other malignant medical states.
Overall, the innovation of this paper which highlights its contribution is two-fold: (a) the application of a predefined CNN-based structure, namely RGB-CNN [56,57], which was recently proposed in bone scintigraphy after a meticulous exploration analysis on its architecture and (b) the implementation of a deep learning classification model utilizing transfer learning for improving CAD diagnosis. The produced fast, robust and highly efficient model, in terms of accuracy and AUC score, can be applied to automatically identify patients with known or suspected coronary artery disease by looking at SPECT MPI scans.
This work is structured as follows: Section 2 includes the methods and materials used in this study. Section 3 provides the proposed deep learning architectures for SPECT MPI classification. In Section 4, a rigorous analysis is conducted, including the exploration of different configurations to determine the most accurate of the proposed classification models. Finally, the discussion of results and the conclusions follow in Section 5.

2. Materials and Methods

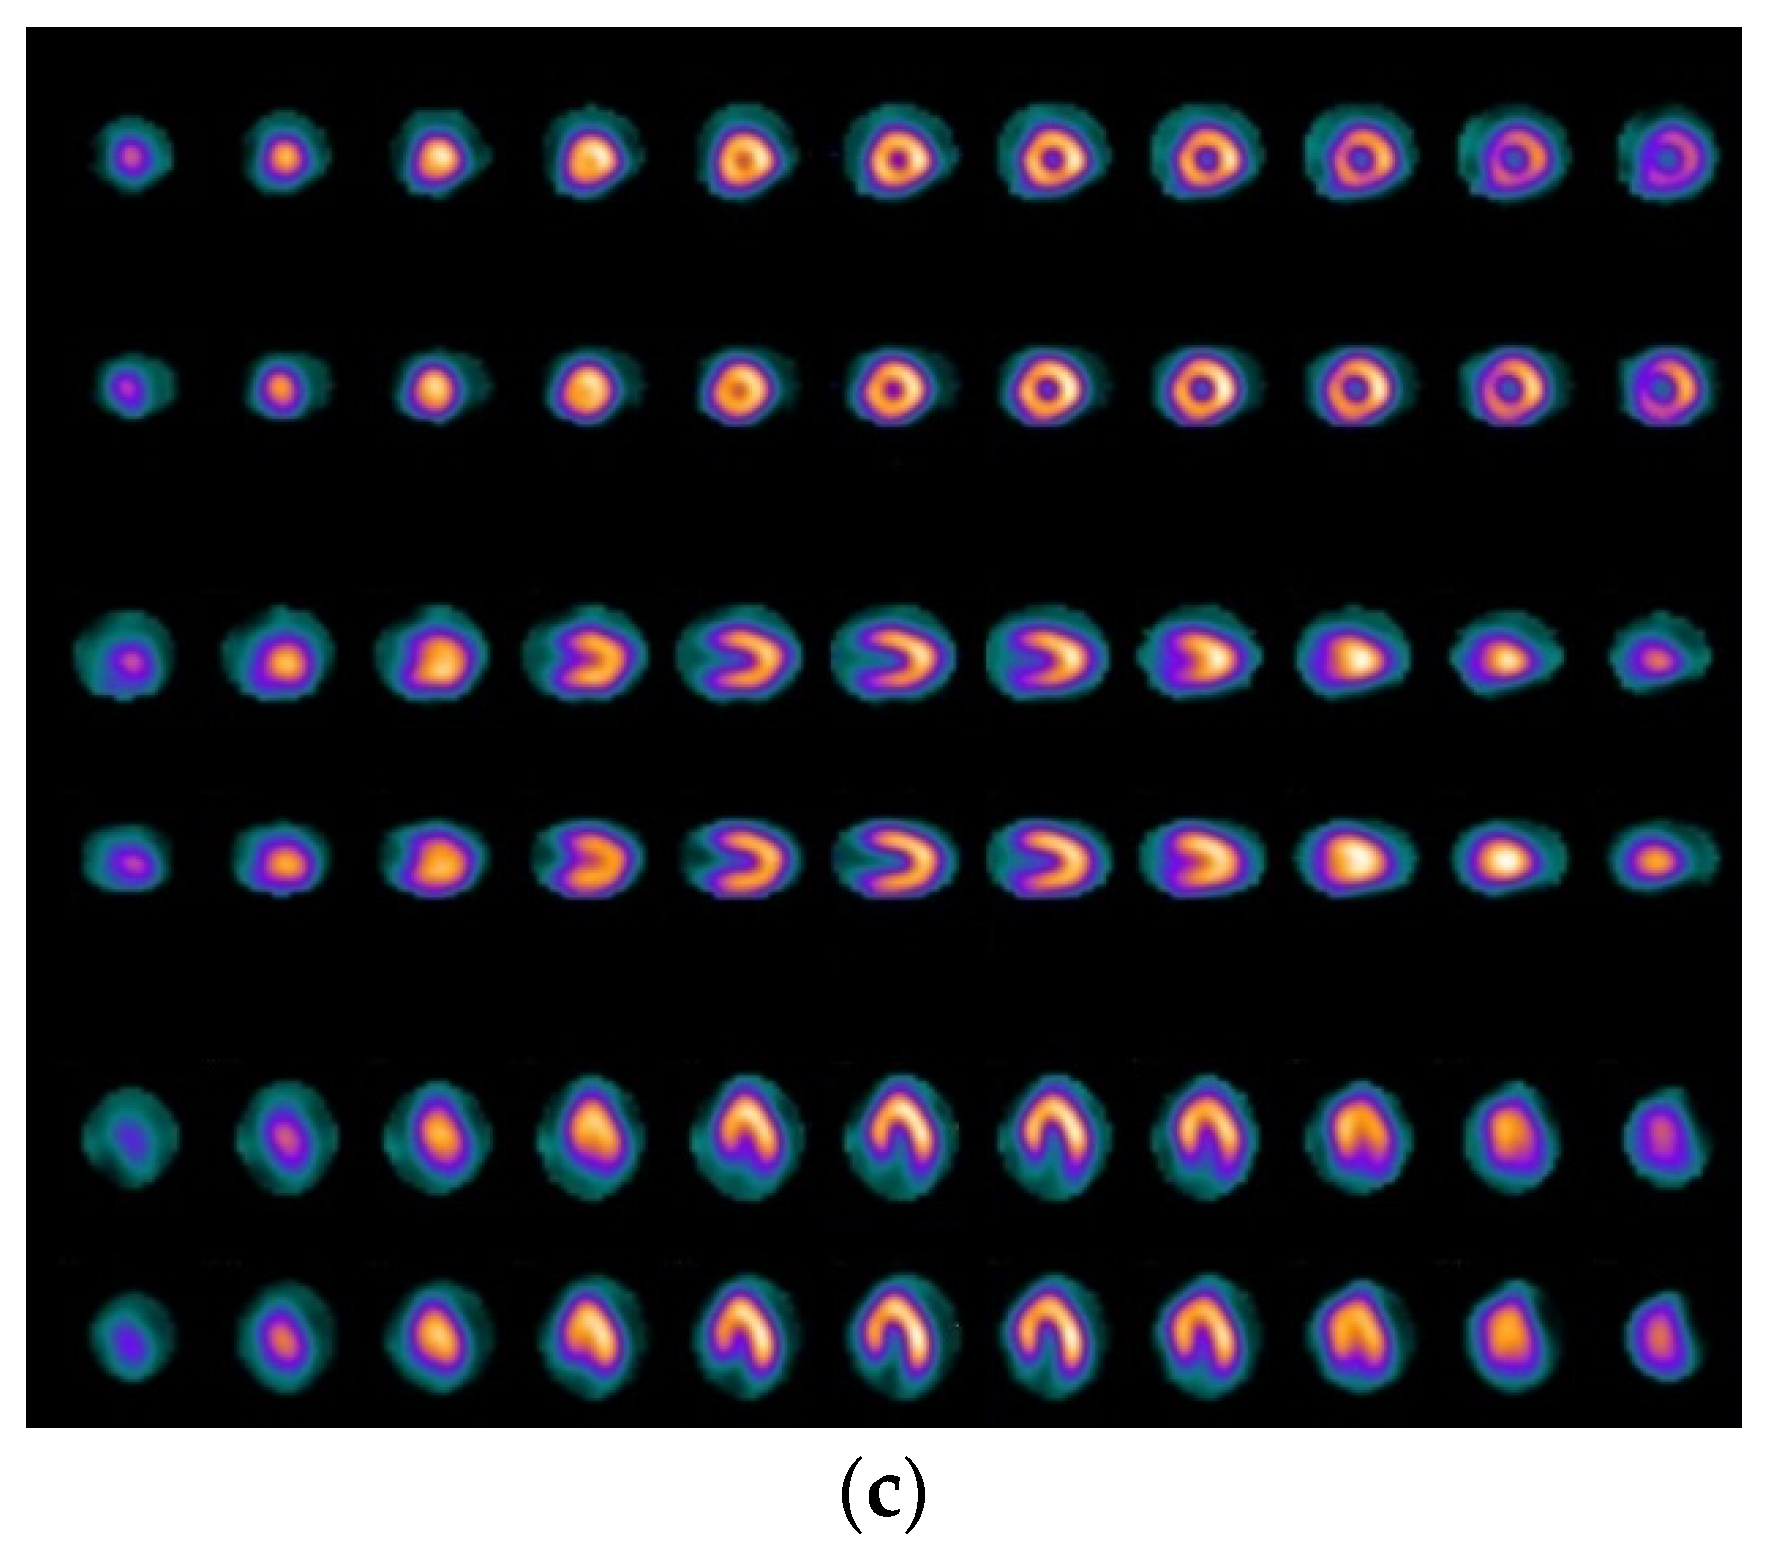
2.1. Patients and Imaging Protocol

The dataset used in this study corresponds to a retrospective review that includes 224 patients (age 32–85, average age 64.5, 65% men and 55% CAD), whose SPECT MPI scans were issued by the Nuclear Medicine Department of the Diagnostic Medical Center “Diagnostiko-Iatriki A.E.”, Larisa, Greece. The dataset consists of images from patients who had undergone stress and rest SPECT MPI on suspicion of ischemia or infarction concerning the prediction of CAD between June 2013 and June 2017. The participant patients went through invasive coronary angiography (ICA) 40 days after MPI.
The set of stress and rest images collected from the records of 224 patients constitute the dataset used in this retrospective study. The dataset includes eight patients with infarction, 142 patients with ischemia, and eight patients with both infarction and ischemia, while the remaining (61 patients) were normal. Indicative image samples are illustrated in Figure 1. This dataset is available only under request to the nuclear medicine physician and only for research purposes.
A 1-day stress–rest injection protocol was used for Tc-99m tetrofosmin SPECT imaging. Patients underwent either symptom-limited Bruce protocol treadmill exercise testing (n = 154 [69%]) or pharmacologic stress (n = 69 [31%]) with radiotracer injection at peak exercise or during maximal hyperemia, respectively.
Within 20 min after an injection of 7 to 9 mCi 99mTc-tetrofosmin, stress SPECT images were collected due to either an effort test or pharmacological stress with dipyridamole. In the case of the effort test, a treadmill test was performed. The Bruce protocol was employed, and when at least 85% of the age-predicted maximum heart rate was achieved, a 99mTc-tetrofosmin injection was provided to the patient, whereas the exercise stopped 1 min later. Rest imaging followed 40 min after a dose of 21–27 mCi 99mTc-tetrofosmin had been injected. The data collected from SPECT system came from 32 projections regarding a period of 30 s for the stress and 30 s for the rest SPECT MPI. The rest of the configurations regarded a 140 keV photopeak, a 180-degree arc and a 64 × 64 matrix.

2.2. Visual Assessment

The assignment of patients’ scanning was delivered by a Siemens gamma camera Symbia S series SPECT System (by dedicated workstation and software Syngo VE32B, Siemens Healthcare GmbH, Enlargen, Germany) comprising two heads that include low energy high-resolution (LEHR) collimators. The Syngo software was utilized for the Standard SPECT MPI processing allowing the nuclear medicine specialist to automatically produce SA (short axis), HLA (long horizontal axis), and VLA (long vertical axis) slices from raw data [55]. Afterwards, two expert readers with considerable clinical expertise in nuclear cardiology (N. Papandrianos, who is the first author of this work and N. Papathanasiou, who is Ass. Professor in Nuclear Medicine, University Hospital of Patras), provided visual assessments solely for the series of stress and rest perfusion images in color scale, though not including functional and clinical data [18]. The case is labeled as normal when there is a homogeneous involvement of 99mTc-tetrofosmin in the left ventricular walls.
On the contrary, a defect is defined when radiopharmaceuticals are less involved in any part of the myocardium. A comparative visual analysis is conducted, including the images collected after the stress SPECT MPI and those after the rest SPECT MPI, respectively. Potential defects are identified as a result of the injected radiopharmaceutical agent or even exercise. In this context, the condition is described as ischemia when a perfusion defect was detected in the SPECT images obtained after exercise but not in the rest images. Instead, infarction is the condition in which both stress and rest images include evidence of the defect. The classification process of all SPECT MPI images carried out by expert readers utilizes a two-class label (1 denotes normal and 2 abnormal) to administer additional tasks [53].

2.3. Overview of Convolutional Neural Networks

Convolutional neural networks are among the most dominant deep learning methodologies since they are designated as techniques with a remarkable capacity for image analysis and classification. Their architecture is originated from the perceptron model in which a series of fully connected layers is established, and all neurons from consecutive layers are individually interconnected. A detailed description of all different types of layers follows.
Concerning the first layer in the architecture, the “convolutional” layer is named after the type of neural network. Its role is substantial for CNNs since this layer is responsible for the formation of activation maps. In particular, specific patterns of an image are extracted, helping the algorithm detect various characteristics essential for image classification [34,60]. Then, a pooling layer follows, whose duty is image downsampling, whereas any unwanted noise that might fuzzy the algorithm is appropriately discarded. This layer retains the set of pixel values that exceed a threshold optimally defined, rejecting all the remaining. For this process, the elements within a matrix that are in line with specific requirements concerning the maximum or average value are correctly selected.
The last part of a CNN architecture comprises one or more fully connected layers assigned for the “flattening” of the previous layer’s output every time. This is considered as the final output layer, which takes the form of a vector. According to the values of the outcome vector, a specific label is assigned by the algorithm to every image. On the whole, the set of the fully connected layers are classified into distinct subcategories emanated from their role. For instance, the vectorization is attained by the first layer, whereas the category of each class given is defined by the final layer [61,62].
Concerning the activation function in the CNN models, the rectified linear unit (ReLU) is deployed in all convolutional and fully connected layers, while the sigmoid function serves as the final most common activation function in the output nodes [62]. It is worth mentioning that selecting the most suitable activation function is crucial and dependent on the desired outcome. The Softmax function can be efficiently utilized for the multiclass classification task. It has the ability to target class probabilities through a normalization process conducted on the actual output values derived from the last fully connected layer [62].

2.4. Methodology

This work discusses the recently proposed RGB-CNN model as a new efficient method in scintigraphy/ nuclear medical image analysis, regarding its application on the classification of SPECT MPI scans in coronary artery disease patients. This two-class classification task involves the cases of ischemia or infarction presence as well as those being labeled as normal in a sample of 224 patients. It particularly involves three distinctive processes, which are pre-processing, network design and testing/evaluation. These stages have been previously presented in common publications (see [30,50,53]). The pre-processing step consists of data normalization, data shuffle, data augmentation and data split into training, validation and testing. Data augmentation involves specific image processes such as range, enlargement, rotation and flip. The augmentation process is conducted before its entrance into the exploration and training of CNN. Concerning data split, the training dataset regards 85% of the provided dataset of 275 MPI images, whereas the remaining 15% is used for testing purposes. Next, the network design stage deals with the construction of a proper architecture through an exploration process. Then, the testing phase follows, utilizing the best CNN model derived. In the final stage, the produced CNN model is tested using unknown to the model data.
Likewise, the respective classification approach is deployed for the tasks of image pre-processing, network training and testing, and is applied to the new dataset. The process for the examined dataset of SPECT MPI scans is visually represented in Figure 2.

3. Methodology

3.1. RGB-Based CNN Architecture for Classification in Nuclear Medical Imaging

In this research study, we apply an efficient and robust CNN model, the RGB-CNN (proposed in a recent study in the domain of bone scintigraphy), to precisely categorize MPI images as normal or abnormal suffering from CAD. The developed CNN will demonstrate its capacity for high accuracy utilizing a fast yet straightforward architecture regarding MPI classification. A number of experiments were performed for different values of parameters, like pixels, epochs, drop rate, batch size, number of nodes and layers as described in [56,57,58]. Then, appropriate features are extracted and selected manually, following the most common classic feature extraction techniques. On the other hand, CNNs that resemble ANNs, achieve automatic feature extraction by applying multiple filters on the input images. Next, they proceed in selecting the most suitable for image classification through an advanced learning process.
A deep-layer network is constructed within this framework, embodying five convolutional-pooling layers, two dense layers, a dropout layer, followed by a final two-node output layer (see Figure 3).
The dimensions of the input images vary from 250 × 250 pixels to 400 × 400 pixels. According to the structure of the proposed CNN, the initial convolutional layer includes 3 × 3 filters (kernels) followed by a 2 × 2-sized max-pooling layer and a dropout layer entailing a dropout rate of 0.2. The first convolutional layer is formed by 16 filters, whereas each layer that follows includes a double number of filters compared with the previous one. The same form is followed by the max-pooling layers that come next. A flattening operation is then utilized to transform the 2-dimension matrices to 1-dimension arrays so that they are inserted into the hidden dense layer of 64 nodes. The role of the dropout layer that follows is to randomly drop the learned weights by 20% to avoid overfitting. The output two-node layer comes as last in the proposed CNN model architecture.
The most common function utilized by CNNs is ReLU, which is applied to all convolutional and fully connected (dense) layers. In the output nodes, the categorical cross-entropy function is applied. The algorithm is tested through multiple runs by trying a different number of epochs varying from 200 to 700 to fully exploit the most valid number of epochs for CNN training. In this context, the ImageDataGenerator class from Keras is used, providing specific augmentation tasks over images, such as rotation, shifting, flipping and zoom. Finally, the categorical cross-entropy function is considered as a performance metric applied for the calculation of loss. It employs the ADAM optimizer, an adaptive learning rate optimization algorithm [36].

3.2. Deep Learning Models, Including Transfer Learning for CAD Classification in Medical Imaging

In this subsection, we introduce the process followed in this study on applying deep learning architectures, including transfer learning for benchmark CNN models in CAD diagnosis.
In deep learning model development, the traditional pipeline is the neural network training from scratch, which depends highly on the size of the data provided. Transfer learning is an alternative, most preferred and used process in developing deep learning architectures [63]. This process offers the capability to sufficiently employ the existing knowledge of a pre-trained CNN through the use of ImageNet dataset so as to result in competent predictions.
For an accurate classification process, an improved model training process is required, which derives from the incorporation of transfer learning during the training phase of the proposed CNN architectures. More specifically, the ImageNet [63,64] dataset needs to be utilized for network pre-training, thus resulting in accurate classification of medical SPECT myocardial perfusion imaging scans into two categories, namely normal and abnormal (patient with ischemia or infarction). According to the relevant literature, the ImageNet dataset is employed by the popular CNN methods for model pre-training and includes 1.4 million images with 1000 classes. Based on this pre-training process, VGG16 and DenseNet models are trained to extract particular features from images through the assignment of constant weights on them. The number of the weight layers affects the depth of the model, along with the steps needed for feature extraction.
The training dataset, representing 85% of the provided dataset of 224 SPECT MPI images, is loaded into the pre-trained models after undergoing a proper augmentation process. Hence, an improved CNN model is produced, which is inserted into the next testing phase. The remaining 15% of the provided dataset is accordingly incorporated into the evaluation process. The proposed transfer learning methodology of the state-of-the-art CNN models is graphically presented in Figure 4, regarding the examined dataset of 224 patients.
Following the process in which the benchmark CNN model is selected for the classification task, the exploration and identification of suitable, robust and efficient architectures of these CNN models come next for the specific problem solving, which concerns the identification of the correct category of CAD diagnosis. On this basis, the fine-tuning of the model parameters and the configuration of several other hyperparameters were successfully attained through a thorough investigation regarding the appropriate deep learning architecture. For comparison purposes, various common deep learning architectures such as Densenet, VGG16, Mobilienet and InceptionV3 were investigated.

4. Results

This study attempts to address this image classification problem considering the classification of images into 2 categories: normal and abnormal (ischemic or infarction patient cases). The classification processes were individually repeated 10 times to produce the overall classification accuracy.
All the simulations were performed in Google Colab [65], a cloud-based environment that supports free GPU acceleration. The Keras 2.0.2 and TensorFlow 2.0.0 frameworks were utilized to develop the employed deep learning architectures. Image augmentations (like rotations, shifting, zoom, flips and more) took place only during the training process of the deep networks and were accomplished using the ImageDataGenerator class from Keras. The investigated deep learning architectures were coded in the Python programming language. Sci-Kit Learn was used for data normalization, data splitting, calculation of confusion matrices and classification reports. It should be noted that all images produced by the scanning device and used as the dataset in this research were in RGB format, providing 3-channel color information.

4.1. Results from RGB-CNN

In this study, a meticulous CNN exploration process regarding the deep learning architectures of RGB-CNN was accomplished. In particular, an experimental analysis was conducted, where various drop rates (between 0.1–0.9), epochs (200 to 700), number of dense nodes (like 16–16, 32–32, 64–64, 128–128, 256–256, 512–512 and 1024–1024), pixel sizes (from 200 × 200 × 3 up to 450 × 450 × 3) and batch sizes (8, 16, 32 and 64) were tested. To prevent overfitting [62] in the proposed deep learning architectures, the authors conducted an exploratory analysis for different dropouts and numbers of epochs. According to the conducted analysis results, a dropout value of 0.2 and the set of 500 epochs were adequate to produce satisfactory results for the investigated RGB-CNN architecture.
Moreover, an exploration analysis involving the testing of various pixel sizes was conducted. The best pixel size of the input images was determined as regards the classification accuracy and loss. Figure 5 and Figure 6 illustrate the produced results in terms of accuracy for the examined pixel sizes, for both CNN-based architectures. These figures foster the successful selection of the appropriate pixel size for each architecture which is 250 × 250 × 3 for RGB-CNN.
Following this exploration process, several configurations, including dropout = 0.2 and three batch sizes (8, 16 and 32), various pixel sizes and dense nodes in RGB-CNN model consisting of 5 layers (16–32–64–128–256) were investigated. Table 1, Table 2 and Table 3 illustrate the results produced for the relevant pixel sizes for the well-performed batch sizes of 8, 16 and 32. These results helped in the selection of the most appropriate pixel size, which is 250 × 250 × 3.
As regards the two dense blocks that are the last ones in both architectures, a rigorous exploration process was performed to determine the best configuration in terms of accuracy (validation and testing) and loss. The results are depicted in Figure 3 and Figure 4 regarding 4 and 5 convolutional layers, respectively. Looking at the specific figures, it emerges that 64–64 is the optimum combination for the CNN model.
Next, for the selected pixel size (250 × 250 × 3), different batch sizes (8, 16 and 32) with various configurations in dense nodes were investigated, also utilizing the two previously best-performed architectures concerning the number of convolutional layers (which are 16–32–64–128 and 16–32–64–128–256), as presented in recent research studies [56,57,58]. The outcomes of this exploration are presented in Figure 5 and Figure 6. These figures show that the best CNN configuration corresponds to batch size 8, five convolutional layers (16–32–64–128–256) and dense nodes 32–32. It emerges that dense 32–32 is the most suitable configuration concerning the dense nodes.
Figure 7 shows the accuracy, loss and AUC values for various dense nodes regarding the best batch size (8) and the number of convolutional layers (16–32–64–128–256).
Additionally, further exploration analysis was performed for various numbers of convolutional layers. Some indicative results are presented in Figure 8. It is observed that the model was able to increase its classification accuracy for 5 convolutional layers significantly.
To sum-up, the best RGB-CNN architecture with this problem is: pixel size (250 × 250 × 3), batch size = 8, dropout = 0.2, conv 16–32–64–128–256, dense nodes 32.32, epochs = 500 (average run time = 1125 s).
In addition, Table 4 depicts the confusion matrix of the best VGG16 architecture. Figure 9 illustrates the classification accuracies (validation and testing) with their respective loss curves for the proposed RGB-CNN architecture. Figure 10 depicts the diagnostic performance of RGB-CNN model in SPECT MPI interpretation assessed by ROC analysis for CAD patients.
In the proposed method, the early stopping condition for RGB-CNN was investigated considering 100 epochs, thus providing adequate accuracy, higher than that of the other CNNs. In particular, the produced accuracy for early stopping was approximately 89% in most of the examined runs. However, using the minimum error stopping condition, the capacity of the algorithm was explored, increasing the accuracy of the RGB-CNN model up to 94% approximately. Figure 9a illustrates the precision curves presenting a smooth change in accuracy for the proposed model.

4.2. Results from Deep Learning Architectures Applying Transfer Learning and Comparative Analysis

In this subsection, the second deep learning classification approach of CAD patients using transfer learning was implemented, followed by a comparative analysis. Following the process discussed in Section 2.4, transfer learning was utilized employing several pre-trained CNN models, avoiding training a new network with randomly initialized weights. In this way, the classification process of SPECT MPI scans is faster and more efficient due to the limited number of training images.
This approach includes efficient state-of-the-art CNNs in the medical image analysis domain, which were mainly reported in previous studies in similar classification tasks. In particular, for the purpose of this research work, certain SoA CNN architectures such as: (i) VGG16 [39], (ii) DenseNet in [43], (iii) MobileNet [59], and (iv) Inception V3 [60] were used.
Concerning the training characteristics of this approach, the stochastic gradient descent with momentum algorithm was used, and the initial learning rate was set to 0.0001. It is worth mentioning that an exploratory analysis for the SoA CNNs [25,33] was previously conducted in the reported literature, paying particular attention to overfitting avoidance [62]. Overfitting is a common issue in most state-of-the-art CNNs that work with small datasets; thus, a meticulous exploration with various dropout, dense layers and batch sizes was applied to avoid it. Overall, the CNN selection and optimization of the hyperparameters was performed following an exploration process considering a combination of values for batch-size (8, 16, 32, 64, and 128), dropout (0.2, 0.5, 0.7 and 0.9), flatten layer, number of trainable layers and various pixel sizes (200 × 200 × 3 up to 350 × 350 × 3). Moreover, a divergent number of dense nodes, like 16, 32, 64, 128, 256 and 512 was explored. The number of epochs ranged from 200 up to 500. The best-performing CNN models in terms of accuracy and loss function in the validation phase were selected as the optimum for classifying the test dataset [24,56].
After the extensive exploration of all the provided architectures of popular CNNs, the authors defined the optimum values for the respective models’ parameters, as follows:
  • VGG16: pixel size (300 × 300 × 3), batch size = 32, dropout = 0.2, Global Average Poolong2D, dense nodes 64 × 64, epochs = 400, (average run time = 1853 s),
  • DenseNet: pixel size (250 × 250 × 3), batch size = 8, dropout = 0.2, Global Average Poolong2D, dense nodes 16 × 16, epochs = 400, (average run time = 2074 s),
  • MobileNet: pixel size (250 × 250 × 3), batch size = 8, dropout = 0.2, Global Average Poolong2D, dense nodes 32 × 32, epochs = 400, (average run time = 3070 s),
  • InceptionV3: pixel size (300 × 300 × 3), batch size = 8, dropout = 0.2, Global Average Poolong2D, dense nodes 256 × 256, epochs = 400, (average run time = 1538 s).
Concerning the dropout value, 0.2 was selected as the best-performed for the investigated CNN configurations, according to the exploration process. The testing image dataset was used to evaluate the network’s performance; however it is not involved in the training phase.
The results of the explored SoA CNN architectures proposed in the second approach are compared to the best-performed RGB-CNN model. They are gathered in the following three figures. More specifically, Figure 11 depicts the classification accuracy in validation and testing phases for the best-performed deep learning architectures. Figure 12 illustrates the respective loss for all SoA CNNs. Finally, Figure 13 presents the AUC score values for all performed CNNs.

5. Discussion of Results and Conclusions

Due to their ability to track complex visual patterns, powerful and widely used CNN algorithms are employed in the medical image analysis domain to address the problem of CAD diagnosis in nuclear cardiology. In this research study, two different deep learning classification approaches, namely, the RGB-based CNN model and the transfer learning-based CNN models (the benchmark CNN models pre-trained by ImageNet dataset), were adopted to identify perfusion defects through the use of SPECT MPI scans. The first classification approach is based on RGB-CNN algorithms, previously proposed for image classification in nuclear medicine regarding bone scintigraphy. The second approach utilizes transfer learning incorporated in well-known deep learning architectures. The provided dataset, comprising stress and rest images from 224 subjects, is employed to assess the proposed models with respect to their performance. The problem was formulated as a two-class classification problem.
For an in-depth assessment of the results, a comparative analysis regarding the classification performance of the proposed model against that of other CNNs reported in the literature is performed (even indirectly) in the examined field of CAD diagnosis in nuclear medicine, using solely SPECT-MPI images. A decent amount of relevant research studies in this scientific field was gathered in Introduction and presented in Table 5, followed by the classification accuracies and evaluation metrics of the respective models. As regards the previous works of [50,51,52], where polar map images were used for CAD classification, deep CNNs and graph-based CNNs were employed for normal/abnormal classification. These are not related to this research study and provide classification accuracies up to 91%.
It is worth mentioning that only one previous work is highly related to the current research study and regards the presence of coronary artery stenosis (normal or abnormal) as a two-class classification problem. This work employed well-known CNNs to classify normal/abnormal patient cases [53], utilizing transfer learning. The authors employ deep neural networks that underwent a pre-training phase as well as an SVM classifier characterized by deep and shallow features derived from the respective networks. Most of the applied DL-based methods (AlexNet, GoogleNet, DenseNet, Resnet, VGG-16) in this dataset provided accuracies less than 87%, and only the VGG-19 utilizing SVM with shallow features increased the accuracy slightly. The knowledge-based classification model, which uses extracted features based on shapes and empirically verified parameters, fine-tuned on the training and validation images, provided the highest classification accuracy of up to 93%. Through the conducted comparative analysis of the proposed RGB-CNN method with the related ML and deep learning techniques as listed in Table 5, it is concluded that the proposed RGB-CNN model outperforms all the previous techniques in MPI imaging. It provides slightly better performance in classification accuracy (94%) and AUC score (93%), making it a competitive solution to this diagnosis task.
Following the process of rigorously exploring possible hyperparameters and regularization methods of the proposed RGB-CNN architecture, the best overall classification accuracy for the deep network model (best RGB-CNN) was established (see Figure 11, Figure 12 and Figure 13). Authors selected the RGB-CNN model with 5 convolutional layers, batch size = 16, dropout = 0.2 and 64–64 dense nodes as the simplest and most optimum performed CNN, concerning testing accuracy and loss. Moreover, from the results above, it appears that the best RGB-CNN model is characterized by an overall classification accuracy of 93.47% ± 2.81% when the produced overall test loss is approximately 0.18 (see Figure 12). To lay emphasis on the classification performance of the CNN approaches presented in this study, the authors followed a comparative analysis between the proposed RGB-CNN model and other SoA CNNs, commonly used for image classification problems, with reference to accuracy and other metrics such as the AUC score. Regarding the produced AUC value for the RGB-CNN models and the other SoA CNNs, as depicted in Figure 13, RGB-CNN seems to have the highest AUC score, making it possibly the best classifier in terms of performance for the given problem. The average run time of the best architecture for the proposed model is 1125 s which is considered fast for such types of networks. Similar to the other CNN-based methods, this method presents faster run time as shown in the previous works of the same team of authors [33,56] in the case of bone scintigraphy.
The results indicate that the proposed RGB-CNN is an efficient, robust and straightforward deep neural network able to detect perfusion abnormalities related to myocardial ischemia and infarction on SPECT images in nuclear medicine image analysis. It was also demonstrated that this is a model of low complexity and generalization capabilities compared to the state-of-the-art deep neural networks. Moreover, it exhibits better performance than the SoA CNN architectures applied in the specific problem regarding accuracy and AUC values. The proposed CNN-based classification approach can be employed in the case of SPECT-MPI scans in nuclear cardiology and can support CAD diagnosis. It can as well contribute as a clinical decision support system in nuclear medicine imaging.
To sum up, among the major differences of RGB-CNN compared to other conventional CNNs are (i) their ability to efficiently train a model considering a small dataset without the need to undergo network pre-training with ImageNet dataset, (ii) their ability to be optimized through an exploratory analysis which helps to avoid overfitting and generalize well to unknown input images, and (iii) their less complex architecture which enhances their performance in an efficient run time [33,57].
Regarding the limitations presented in previous studies, the models proposed in this work do not depend on specific characteristics like gender and camera specifications that can elevate the number of inputs [34]. In addition, they can perform sufficiently, even when not many training images are available. Among the privileges the proposed models enjoy is their ability to use SPECT images as input without the need for any additional data. This feature is rather distinguishing between this work and other studies. Finally, less experienced physicians can improve their diagnostic accuracy by supporting their opinion with the results of such systems. However, there are some limitations that need to be considered in future work. These are (i) the limited number of normal cases in the dataset, making it unbalanced, and (ii) the disregard of clinical and other functional data in the classification process, which would improve the diagnosis.
According to the overall results of this study, the proposed deep learning structures of RGB-CNN are accredited for being extremely efficient in classifying SPECT MPI scans in nuclear medicine. Even though these effective CNN-based approaches use a relatively limited number of patients, this study further considers a deep learning classification methodology, incorporating transfer learning, and in collaboration with the well-known CNN models, as a technique that can have a considerable impact on myocardial perfusion detection.
As a typical black box AI-based method, deep learning lacks clarity and reasoning for the decision, which is highly important in medical diagnosis. Since DL models are often criticized because of their internal unclear decision-making process, explainable AI systems should come with causal models of the world supporting explanation and understanding. Recent research efforts are directed towards developing more interpretable models, focusing on the understandability of the DL-based methods.
Future work is also oriented toward the acquisition of more scan images of patients suffering from CAD, with a view to expand the current research and validate the efficacy of the proposed architecture. But, overall, the findings of this work seem highly reassuring, particularly when the computer-aided diagnosis is involved, establishing the proposed CNN-based models as a suitable tool in everyday clinical work.

Author Contributions

Conceptualization, N.P.; methodology, E.P. and N.P.; software, E.P.; validation, N.P., E.P.; formal analysis, N.P. and E.P.; investigation, E.P. and N.P.; resources, N.P.; data curation, N.P.; writing—original draft preparation, N.P.; writing—review and editing, E.P., N.P.; visualization, E.P.; supervision, N.P. and E.P. All authors have read and agreed to the published version of the manuscript.

Funding

This research received no external funding.

Institutional Review Board Statement

This research work does not report human experimentation; not involve human participants following an experimentation in subjects. All procedures in this study were in accordance with the Declaration of Helsinki.

Informed Consent Statement

This study was approved by the Board Committee Director of the Diagnostic Medical Center “Diagnostiko-Iatriki A.E.” Vasilios Parafestas and the requirement to obtain informed consent was waived by the Director of the Diagnostic Center due to its retrospective nature.

Data Availability Statement

The datasets analyzed during the current study are available from the nuclear medicine physician on reasonable request.

Conflicts of Interest

The authors declare no conflict of interest.

References

  1. Cassar, A.; Holmes, D.R.; Rihal, C.S.; Gersh, B.J. Chronic Coronary Artery Disease: Diagnosis and Management. Mayo Clin. Proc. 2009, 84, 1130–1146. [Google Scholar] [CrossRef] [Green Version]
  2. Ross, R. Atherosclerosis—An Inflammatory Disease. N. Engl. J. Med. 1999, 340, 115–126. [Google Scholar] [CrossRef]
  3. Girelli, M.; Martinelli, N.; Peyvandi, F.; Olivieri, O. Genetic Architecture of Coronary Artery Disease in the Genome-Wide Era: Implications for the Emerging “Golden Dozen” Loci. Semin. Thromb. Hemost. 2009, 35, 671–682. [Google Scholar] [CrossRef]
  4. Álvarez-Álvarez, M.M.; Zanetti, D.; Carreras-Torres, R.; Moral, P.; Athanasiadis, G. A survey of sub-Saharan gene flow into the Mediterranean at risk loci for coronary artery disease. Eur. J. Hum. Genet. 2017, 25, 472–476. [Google Scholar] [CrossRef] [PubMed] [Green Version]
  5. Łukaszewski, B.; Nazar, J.; Goch, M.; Łukaszewska, M.; Stępiński, A.; Jurczyk, M. Diagnostic methods for detection of bone metastases. Współczesna Onkol. 2017, 21, 98–103. [Google Scholar] [CrossRef] [PubMed] [Green Version]
  6. Sartor, O. Radium and targeted alpha therapy in prostate cancer: New data and concepts. Ann. Oncol. 2020, 31, 165–166. [Google Scholar] [CrossRef] [PubMed]
  7. Underwood, S.R.; Anagnostopoulos, C.; Cerqueira, M.; Ell, P.J.; Flint, E.J.; Harbinson, M.; Kelion, A.D.; Al-Mohammad, A.; Prvulovich, E.M.; Shaw, L.J.; et al. Myocardial perfusion scintigraphy: The evidence. Eur. J. Nucl. Med. Mol. Imaging 2004, 31, 261–291. [Google Scholar] [CrossRef] [PubMed] [Green Version]
  8. Schuijf, J.D.; Poldermans, D.; Shaw, L.J.; Jukema, J.W.; Lamb, H.J.; De Roos, A.; Wijns, W.; Van Der Wall, E.E.; Bax, J.J. Diagnostic and prognostic value of non-invasive imaging in known or suspected coronary artery disease. Eur. J. Nucl. Med. Mol. Imaging 2005, 33, 93–104. [Google Scholar] [CrossRef]
  9. Talbot, J.N.; Paycha, F.; Balogova, S. Diagnosis of bone metastasis: Recent comparative studies of imaging modalities. Q. J. Nucl. Med. Mol. Imaging 2011, 55, 374–410. [Google Scholar] [PubMed]
  10. Doi, K. Computer-Aided Diagnosis in Medical Imaging: Historical Review, Current Status and Future Poten-tial. Computerized medical imaging and graphics. Off. J. Comput. Med. Imaging Soc. 2007, 31, 198–211. [Google Scholar] [CrossRef] [PubMed] [Green Version]
  11. O’Sullivan, G.J.; Carty, F.L.; Cronin, C.G. Imaging of Bone Metastasis: An Update. World J. Radiol. 2015, 7, 202–211. [Google Scholar] [CrossRef]
  12. Chang, C.Y.; Gill, C.M.; Simeone, F.J.; Taneja, A.K.; Huang, A.J.; Torriani, M.; A Bredella, M. Comparison of the diagnostic accuracy of 99 m-Tc-MDP bone scintigraphy and 18 F-FDG PET/CT for the detection of skeletal metastases. Acta Radiol. 2016, 57, 58–65. [Google Scholar] [CrossRef]
  13. Wyngaert, T.V.D.; On behalf of the EANM Bone & Joint Committee and the Oncology Committee; Strobel, K.; Kampen, W.U.; Kuwert, T.; Van Der Bruggen, W.; Mohan, H.K.; Gnanasegaran, G.; Bolton, R.D.; Weber, W.A.; et al. The EANM practice guidelines for bone scintigraphy. Eur. J. Nucl. Med. Mol. Imaging 2016, 43, 1723–1738. [Google Scholar] [CrossRef] [Green Version]
  14. Coleman, R. Metastatic bone disease: Clinical features, pathophysiology and treatment strategies. Cancer Treat. Rev. 2001, 27, 165–176. [Google Scholar] [CrossRef]
  15. Savvopoulos, C.A.; Spyridonidis, T.; Papandrianos, N.; Vassilakos, P.J.; Alexopoulos, D.; Apostolopoulos, D.J. CT-based attenuation correction in Tl-201 myocardial perfusion scintigraphy is less effective than non-corrected SPECT for risk stratification. J. Nucl. Cardiol. 2014, 21, 519–531. [Google Scholar] [CrossRef]
  16. Malek, H. Nuclear Cardiology. In Practical Cardiology; Elsevier BV: Amsterdam, The Netherlands, 2018; pp. 167–172. [Google Scholar]
  17. American Heart Association Editorial Staff. Myocardial Perfusion Imaging (MPI) Test. Available online: https://www.heart.org/en/health-topics/heart-attack/diagnosing-a-heart-attack/myocardial-perfusion-imaging-mpi-test (accessed on 15 March 2021).
  18. Alexanderson, E.; Better, N.; Bouyoucef, S.-E.; Dondi, M.; Dorbala, S.; Einstein, A.J.; El-Haj, N.; Giubbini, R.; Keng, F.; Kumar, A.; et al. Nuclear Cardiology: Guidance on the Implementation of SPECT Myocardial Perfusion Imaging; Human Health Series; International Atomic Energy Agency: Vienna, Australia, 2016. [Google Scholar]
  19. Slart, R.H.J.A.; Williams, M.C.; Juarez-Orozco, L.E.; Rischpler, C.; Dweck, M.R.; Glaudemans, A.W.J.M.; Gimelli, A.; Georgoulias, P.; Gheysens, O.; Gaemperli, O.; et al. Position paper of the EACVI and EANM on artificial intelligence applications in multimodality cardiovascular imaging using SPECT/CT, PET/CT, and cardiac CT. Eur. J. Nucl. Med. Mol. Imaging 2021, 48, 1399–1413. [Google Scholar] [CrossRef] [PubMed]
  20. Sartor, A.O.; DiBiase, S.J. Bone Metastases in Advanced Prostate Cancer: Management. 2018. Available online: https://www.uptodate.com/contents/bone-metastases-in-advanced-prostate-cancer-management (accessed on 7 July 2021).
  21. Johansson, L.; Edenbrandt, L.; Nakajima, K.; Lomsky, M.; Svensson, S.-E.; Trägårdh, E. Computer-aided diagnosis system outperforms scoring analysis in myocardial perfusion imaging. J. Nucl. Cardiol. 2014, 21, 416–423. [Google Scholar] [CrossRef] [PubMed]
  22. Slomka, P.J.; Betancur, J.; Liang, J.X.; Otaki, Y.; Hu, L.-H.; Sharir, T.; Dorbala, S.; Di Carli, M.; Fish, M.B.; Ruddy, T.D.; et al. Rationale and design of the REgistry of Fast Myocardial Perfusion Imaging with NExt generation SPECT (REFINE SPECT). J. Nucl. Cardiol. 2018, 27, 1010–1021. [Google Scholar] [CrossRef] [PubMed]
  23. Juarez-Orozco, L.E.; Martinez-Manzanera, O.; Storti, A.E.; Knuuti, J. Machine Learning in the Evaluation of Myocardial Ischemia Through Nuclear Cardiology. Curr. Cardiovasc. Imaging Rep. 2019, 12, 5. [Google Scholar] [CrossRef] [Green Version]
  24. Litjens, G.; Kooi, T.; Bejnordi, B.E.; Setio, A.A.A.; Ciompi, F.; Ghafoorian, M.; van der Laak, J.A.; van Ginneken, B.; Sánchez, C.I. A survey on deep learning in medical image analysis. Med. Image Anal. 2017, 42, 60–88. [Google Scholar] [CrossRef] [Green Version]
  25. Suri, J.S. State-of-the-art review on deep learning in medical imaging. Front. Biosci. 2019, 24, 392–426. [Google Scholar] [CrossRef]
  26. Lundervold, A.; Lundervold, A. An overview of deep learning in medical imaging focusing on MRI. Z. Med. Phys. 2019, 29, 102–127. [Google Scholar] [CrossRef] [PubMed]
  27. Abdelhafiz, D.; Yang, C.; Ammar, R.; Nabavi, S. Deep convolutional neural networks for mammography: Advances, challenges and applications. BMC Bioinform. 2019, 20, 281. [Google Scholar] [CrossRef] [Green Version]
  28. Sadik, M.; Hamadeh, I.; Nordblom, P.; Suurkula, M.; Höglund, P.; Ohlsson, M.; Edenbrandt, L. Computer-Assisted Interpretation of Planar Whole-Body Bone Scans. J. Nucl. Med. 2008, 49, 1958–1965. [Google Scholar] [CrossRef] [Green Version]
  29. Horikoshi, H.; Kikuchi, A.; Onoguchi, M.; Sjöstrand, K.; Edenbrandt, L. Computer-aided diagnosis system for bone scintigrams from Japanese patients: Importance of training database. Ann. Nucl. Med. 2012, 26, 622–626. [Google Scholar] [CrossRef] [PubMed] [Green Version]
  30. Koizumi, M.; Miyaji, N.; Murata, T.; Motegi, K.; Miwa, K.; Koyama, M.; Terauchi, T.; Wagatsuma, K.; Kawakami, K.; Richter, J. Evaluation of a revised version of computer-assisted diagnosis system, BONENAVI version 2.1.7, for bone scintigraphy in cancer patients. Ann. Nucl. Med. 2015, 29, 659–665. [Google Scholar] [CrossRef]
  31. Komeda, Y.; Handa, H.; Watanabe, T.; Nomura, T.; Kitahashi, M.; Sakurai, T.; Okamoto, A.; Minami, T.; Kono, M.; Arizumi, T.; et al. Computer-Aided Diagnosis Based on Convolutional Neural Network System for Colorectal Polyp Classification: Preliminary Experience. Oncology 2017, 93, 30–34. [Google Scholar] [CrossRef]
  32. Shen, D.; Wu, G.; Suk, H.-I. Deep Learning in Medical Image Analysis. Annu. Rev. Biomed. Eng. 2017, 19, 221–248. [Google Scholar] [CrossRef] [Green Version]
  33. Papandrianos, N.; Papageorgiou, E.; Anagnostis, A.; Feleki, A. A Deep-Learning Approach for Diagnosis of Metastatic Breast Cancer in Bones from Whole-Body Scans. Appl. Sci. 2020, 10, 997. [Google Scholar] [CrossRef] [Green Version]
  34. Xue, Y.; Chen, S.; Qin, J.; Liu, Y.; Huang, B.; Chen, H. Application of Deep Learning in Automated Analysis of Molecular Images in Cancer: A Survey. Contrast Media Mol. Imaging 2017, 2017, 1–10. [Google Scholar] [CrossRef] [PubMed]
  35. LeCun, Y.; Bottou, L.; Bengio, Y.; Haffner, P. Gradient-based learning applied to document recognition. Proc. IEEE 1998, 86, 2278–2324. [Google Scholar] [CrossRef] [Green Version]
  36. LeCun, Y.; Jackel, L.; Bottou, L.; Cortes, C.; Denker, J.; Drucker, H.; Guyon, I.; Muller, U.; Sackinger, E.; Simard, P.; et al. Learning Algorithms for Classification: A Comparison on Handwritten Digit Recognition. 1995. Available online: http://yann.lecun.com/exdb/publis/pdf/lecun-95a.pdf (accessed on 7 July 2021).
  37. Qian, N. On the momentum term in gradient descent learning algorithms. Neural Netw. 1999, 12, 145–151. [Google Scholar] [CrossRef]
  38. Zeiler, M.D.; Fergus, R. Visualizing and Understanding Convolutional Networks BT—Computer Vision–ECCV 2014. In Proceedings of the European Conference on Computer Vision (ECCV); Springer: Berlin/Heidelberg, Germany, 2014; pp. 818–833. [Google Scholar]
  39. Simonyan, K.; Zisserman, A. Very deep convolutional networks for large-scale image recognition. arXiv 2014, arXiv:1409.1556. [Google Scholar]
  40. Guerra, E.; de Lara, J.; Malizia, A.; Díaz, P. Supporting user-oriented analysis for multi-view domain-specific visual languages. Inf. Softw. Technol. 2009, 51, 769–784. [Google Scholar] [CrossRef] [Green Version]
  41. Szegedy, C.; Liu, W.; Jia, Y.; Sermanet, P.; Reed, S.; Anguelov, D.; Erhan, D.; Vanhoucke, V.; Rabinovich, A. Going Deeper with Convolutions. In Proceedings of the IEEE Conference on Computer Vision and Pattern Recognition (CVPR), Boston, MA, USA, 7–12 June 2015; pp. 1–9. [Google Scholar]
  42. He, K.; Zhang, X.; Ren, S.; Sun, J. Deep residual learning for image recognition. In Proceedings of the 2016 IEEE Conference on Computer Vision and Pattern Recognition, Las Vegas, NV, USA, 27–30 June 2016; pp. 770–778. [Google Scholar]
  43. Huang, G.; Liu, Z.; Van Der Maaten, L.; Weinberger, K.Q. Densely Connected Convolutional Networks. In Proceedings of the 2017 IEEE Conference on Computer Vision and Pattern Recognition (CVPR), Honolulu, HI, USA, 21–26 July 2017; pp. 2261–2269. [Google Scholar]
  44. Arsanjani, R.; Xu, Y.; Dey, D.; Vahistha, V.; Shalev, A.; Nakanishi, R.; Hayes, S.; Fish, M.; Berman, D.; Germano, G.; et al. Improved accuracy of myocardial perfusion SPECT for detection of coronary artery disease by machine learning in a large population. J. Nucl. Cardiol. 2013, 20, 553–562. [Google Scholar] [CrossRef] [PubMed] [Green Version]
  45. Hu, L.-H.; Betancur, J.; Sharir, T.; Einstein, A.J.; Bokhari, S.; Fish, M.B.; Ruddy, T.D.; A Kaufmann, P.; Sinusas, A.J.; Miller, E.J.; et al. Machine learning predicts per-vessel early coronary revascularization after fast myocardial perfusion SPECT: Results from multicentre REFINE SPECT registry. Eur. Hear. J. Cardiovasc. Imaging 2020, 21, 549–559. [Google Scholar] [CrossRef]
  46. Lomsky, M.; Gjertsson, P.; Johansson, L.; Richter, J.; Ohlsson, M.; Tout, D.; Van Aswegen, A.; Underwood, S.R.; Edenbrandt, L. Evaluation of a decision support system for interpretation of myocardial perfusion gated SPECT. Eur. J. Nucl. Med. Mol. Imaging 2008, 35, 1523–1529. [Google Scholar] [CrossRef]
  47. Rahmani, R.; Niazi, P.; Naseri, M.; Neishabouri, M.; Farzanefar, S.; Eftekhari, M.; Derakhshan, F.; Mollazadeh, R.; Meysami, A.; Abbasi, M. Precisión diagnóstica mejorada para la imagen de perfusión miocárdica usando redes neuronales artificiales en diferentes variables de entrada incluyendo datos clínicos y de cuantificación. Rev. Española Med. Nucl. Imagen Mol. 2019, 38, 275–279. [Google Scholar] [CrossRef] [PubMed]
  48. Arsanjani, R.; Xu, Y.; Dey, D.; Fish, M.; Dorbala, S.; Hayes, S.; Berman, D.; Germano, G.; Slomka, P. Improved Accuracy of Myocardial Perfusion SPECT for the Detection of Coronary Artery Disease Using a Support Vector Machine Algorithm. J. Nucl. Med. 2013, 54, 549–555. [Google Scholar] [CrossRef] [PubMed] [Green Version]
  49. Güner, L.A.; Karabacak, N.I.; Akdemir, O.U.; Karagoz, P.S.; Kocaman, S.A.; Cengel, A.; Ünlü, M. An open-source framework of neural networks for diagnosis of coronary artery disease from myocardial perfusion SPECT. J. Nucl. Cardiol. 2010, 17, 405–413. [Google Scholar] [CrossRef]
  50. Betancur, J.; Hu, L.-H.; Commandeur, F.; Sharir, T.; Einstein, A.J.; Fish, M.B.; Ruddy, T.D.; Kaufmann, P.A.; Sinusas, A.J.; Miller, E.J.; et al. Deep Learning Analysis of Upright-Supine High-Efficiency SPECT Myocardial Perfusion Imaging for Prediction of Obstructive Coronary Artery Disease: A Multicenter Study. J. Nucl. Med. 2018, 60, 664–670. [Google Scholar] [CrossRef] [PubMed]
  51. Betancur, J.; Commandeur, F.; Motlagh, M.; Sharir, T.; Einstein, A.J.; Bokhari, S.; Fish, M.B.; Ruddy, T.D.; Kaufmann, P.; Sinusas, A.J.; et al. Deep Learning for Prediction of Obstructive Disease From Fast Myocardial Perfusion SPECT. JACC: Cardiovasc. Imaging 2018, 11, 1654–1663. [Google Scholar] [CrossRef] [PubMed]
  52. Spier, N.; Nekolla, S.G.; Rupprecht, C.; Mustafa, M.; Navab, N.; Baust, M. Classification of Polar Maps from Cardiac Perfusion Imaging with Graph-Convolutional Neural Networks. Sci. Rep. 2019, 9, 1–8. [Google Scholar] [CrossRef] [PubMed] [Green Version]
  53. Berkaya, S.K.; Sivrikoz, I.A.; Gunal, S. Classification models for SPECT myocardial perfusion imaging. Comput. Biol. Med. 2020, 123, 103893. [Google Scholar] [CrossRef]
  54. Verberne, H.J.; Acampa, W.; Anagnostopoulos, C.D.; Ballinger, J.R.; Bengel, F.; De Bondt, P.; Buechel, R.R.; Cuocolo, A.; Van Eck-Smit, B.L.F.; Flotats, A.; et al. EANM procedural guidelines for radionuclide myocardial perfusion imaging with SPECT and SPECT/CT: 2015 revision. Eur. J. Nucl. Med. Mol. Imaging 2015, 42, 1929–1940. [Google Scholar] [CrossRef] [Green Version]
  55. Arsanjani, R.; Dey, D.; Khachatryan, T.; Shalev, A.; Hayes, S.W.; Fish, M.; Nakanishi, R.; Germano, G.; Berman, D.S.; Slomka, P. Prediction of revascularization after myocardial perfusion SPECT by machine learning in a large population. J. Nucl. Cardiol. 2014, 22, 877–884. [Google Scholar] [CrossRef]
  56. Papandrianos, N.; Papageorgiou, E.; Anagnostis, A.; Papageorgiou, K. Bone metastasis classification using whole body images from prostate cancer patients based on convolutional neural networks application. PLoS ONE 2020, 15, e0237213. [Google Scholar] [CrossRef]
  57. Papandrianos, N.; Papageorgiou, E.I.; Anagnostis, A. Development of Convolutional Neural Networks to identify bone metastasis for prostate cancer patients in bone scintigraphy. Ann. Nucl. Med. 2020, 34, 824–832. [Google Scholar] [CrossRef]
  58. Papandrianos, N.; Papageorgiou, E.; Anagnostis, A.; Papageorgiou, K. Efficient Bone Metastasis Diagnosis in Bone Scintigraphy Using a Fast Convolutional Neural Network Architecture. Diagnostics 2020, 10, 532. [Google Scholar] [CrossRef]
  59. Papandrianos, N.; Alexiou, S.; Xouria, X.; Apostolopoulos, D.J. Atypical Bilateral Stress Fractures of the Femoral Shaft Diagnosed by Bone Scintigraphy in a Woman With Osteoporosis. Clin. Nucl. Med. 2013, 38, 910–912. [Google Scholar] [CrossRef]
  60. O’Shea, K.T.; Nash, R. An Introduction to Convolutional Neural Networks. arXiv 2015, arXiv:1511.08458. [Google Scholar]
  61. Springenberg, J.T.; Dosovitskiy, A.; Brox, T.; Riedmiller, M. Striving for simplicity: The all convolutional net. arXiv 2014, arXiv:1412.6806. [Google Scholar]
  62. Yamashita, R.; Nishio, M.; Do, R.K.G.; Togashi, K. Convolutional neural networks: An overview and application in radiology. Insights Imaging 2018, 9, 611–629. [Google Scholar] [CrossRef] [PubMed] [Green Version]
  63. Russakovsky, O.; Deng, J.; Su, H.; Krause, J.; Satheesh, S.; Ma, S.; Huang, Z.; Karpathy, A.; Khosla, A.; Bernstein, M.; et al. ImageNet Large Scale Visual Recognition Challenge. Int. J. Comput. Vis. 2015, 115, 211–252. [Google Scholar] [CrossRef] [Green Version]
  64. Deng, J.; Dong, W.; Socher, R.; Li, L.-J.; Li, K.; Li, F.-F. ImageNet: A large-scale hierarchical image database. In Proceedings of the 2009 IEEE Computer Society Conference on Computer Vision and Pattern Recognition Workshops, Miami, FL, USA, 20–25 June 2009; pp. 248–255. [Google Scholar]
  65. Colaboratory Cloud Environment Supported by Google. Available online: https://colab.research.google.com/ (accessed on 7 July 2021).
Figure 1. Image samples of SPECT MPI (from our dataset) (Labels: (a) ischemia, (b) infarction, (c) healthy).
Applsci 11 06362 g001aApplsci 11 06362 g001b
Figure 2. The proposed methodology for SPECT MPI classification including RGB-CNN architectures.
Applsci 11 06362 g002
Figure 3. RGB-CNN architecture for CAD classification using SPECT MPI scans.
Applsci 11 06362 g003
Figure 4. The proposed methodology for SPECT MPI classification including RGB-CNN architectures.
Applsci 11 06362 g004
Figure 5. RGB-CNN architecture with 4 layers, various dense nodes and batch sizes for CAD classification problem.
Applsci 11 06362 g005
Figure 6. RGB-CNN architecture with 5 layers, various dense nodes and batch sizes for CAD classification problem.
Applsci 11 06362 g006
Figure 7. Results for the best RGB-CNN configuration concerning (a) accuracy and AUC score and (b) loss.
Applsci 11 06362 g007
Figure 8. CNN results for different numbers of convolutional layers concerning (a) validation and testing accuracies and (b) AUC values.
Applsci 11 06362 g008
Figure 9. Precision curves for best RGB-CNN model showing (a) accuracy and (b) loss.
Applsci 11 06362 g009
Figure 10. Diagnostic performance of RGB-CNN model in SPECT MPI interpretation assessed by ROC analysis for CAD patients. ROC = receiver operating characteristic, AUC = area under the curve, PPV = positive predictive value, NPV = negative predictive value.
Applsci 11 06362 g010
Figure 11. Comparison of the classification accuracies for all performed CNNs.
Applsci 11 06362 g011
Figure 12. Comparison of loss (validation and testing) for all performed CNNs.
Applsci 11 06362 g012
Figure 13. AUC score values for all performed CNNs.
Applsci 11 06362 g013
Table 1. Results for various pixel sizes and dense nodes in RGB-CNN with 5 layers (16–32–64–128–256), dropout = 0.2 and batch size = 8.
PixelsDense NodesVal. Acc.Val. LossTest Acc.Test LossAUCTime (s)
200 × 200 × 332–3290.120.2589.70.310.916890
64–6493.410.292.640.210.935831
128–12889.050.3689.210.330.871860
250 × 250 × 332–3294.720.1693.620.120.9261125
64–6492.530.2593.470.130.9211116
128–12882.890.4480.870.180.8451043
300 × 300 × 332–3290.780.1788.230.280.90251736
64–6485.30.3686.470.290.8931641
128–12886.840.4573.520.690.7161469
350 × 350 × 332–3278.940.5170.580.610.782200
64–6480.520.4768.350.620.7652221
128–12874.210.5765.430.710.7112185
Table 2. Results for various pixel sizes and dense nodes in RGB-CNN with 5 layers (16–32–64–128–256). dropout = 0.2 and batch size = 16.
PixelsDense NodesVal. Acc.Val. LossTest Acc.Test LossAUCTime (s)
200 × 200 × 332–3292.730.18392.150.240.885748
64–6492.530.2493.130.2650.948679
128–12891.720.2389.910.220.885674
250 × 250 × 332–3294.730.1291.170.220.769990
64–6491.210.23590.360.260.873971
128–12892.10.19590.30.210.8981089
300 × 300 × 332–3294.730.158 91.660.210.9201547
64–6491.420.2491.9050.1830.931387
128–12892.030.1992.010.2180.9151409
350 × 350 × 332–32 88.460.31 87.740.290.871 1854
64–6489.470.32591.170.1980.8871856
128–12892.10.18592.010.2050.9141910
Table 3. Results for various pixel sizes and dense nodes in RGB-CNN with 5 layers (16–32–64–128–256). dropout = 0.2 and batch size = 32.
PixelsDense NodesVal. Acc.Val. LossTest Acc.Test LossAUCTime (s)
200 × 200 × 332–3287.710.32392.150.310.935630
64–6490.340.3391.90.30.931790
128–12893.820.1892.040.2450.923707
250 × 250 × 332–3290.780.291.170.210.8551110
64–6489.910.25393.120.1870.9211065
128–12889.470.26389.690.3050.9091039
300 × 300 × 332–3288.590.2990.190.2760.9171440
64–6489.460.22491.150.240.9071569
128–12892.10.2191.370.20.9141573
350 × 350 × 332–3287.280.2688.570.23 0.8981650
64–6490.780.3886.770.420.8542077
128–12889.470.29591.170.2450.8981980
Table 4. Best confusion matrix for the proposed RGB-CNN.
2-ClassesAbnormalNormal
Abnormal260
Normal17
Table 5. Related works in coronary artery disease classification using ML and DL techniques.
ReferenceInput DataML/DL MethodsClassification ProblemReference StandardResults
Quantitative Data and Clinical Data from Polar Maps
Arsanjani et al. [48]Quantitative dataBoosted ensemble learningNormal/AbnormalCoronary AngiographyStress TPD: Accuracy 0.88, AUC 0.94, Specificity 093, Sensitivity 0.81
Hu et al. [45], 2020Clinical and quantitative dataEnsemble LogitBoost algorithm (ML)Normal/AbnormalCoronary AngiographyAccuracy 0.72, AUC 0.79.
Rahmani et al. [47], 2019Clinical and Quantitative dataFeed-forward ANN (multi-layer perceptron)Absence/Presence of coronary
artery stenosis >50%
in at least a vessel
Coronary AngiographyAccuracy 0.86, Specificity 1.00, Sensitivity 0.82
Feed-forward ANN (2 classes)
Normal/Abnormal
angiography result
Coronary AngiographyAccuracy 0.93, Specificity 1.00, Sensitivity 0.92
Arsanjani et al. [55]Quantitative and functional dataSVMAbsence/Presence of coronary
artery stenosis ≥70%
Coronary AngiographyStress TPD: Accuracy 0.86, AUC 0.92, Specificity 0.88, Sensitivity 0.84
Guner et al. [49], 2010Quantitative polar mapsANN: multilayer perceptron (WEKA), input layer of 50 nodes, one hidden layer of 5 nodes and one output node.Absence/Presence of coronary
artery stenosis
Coronary AngiographyAUC 0.74, Specificity 0.68, Sensitivity 0.71
Polar Maps (Images)
Betancur et al. [50], 2019Upright and supine
polar maps
DL:
3 × (Conv.Layers, Relu, Max-Pooling filter) and 3 fully connected layers.
Presence of coronary
artery stenosis ≥70%
and >50% in left
main coronary artery
(Normal/Abnormal)
Coronary AngiographyThe AUC score, specificity and sensitivity were 81%, 83%, and 66%
Betancur et al. [51], 2018Raw and quantitative polar mapsDeep CNN:
3 × (Conv.Layers, Relu, Max-Pooling filter), 3 fully connected layers, followed by 3 parallel outputs—1 per coronary territory
Presence of coronary
artery stenosis ≥70%
(Normal/Abnormal)
Coronary AngiographyThe AUC score, specificity and sensitivity were 80%, 58%, and 82%
Spier et al. [52], 2019Polar mapsGraph-based CNN, ChebyshevPresence of coronary
artery stenosis
(Normal/Abnormal)
Expert ReaderThe accuracy, specificity and sensitivity were 91%, 96%, and 86%
2D SPECT MPI images
Berkaya et al. [53], 2020SPECT MPI imagesSVM with deep
features, VGG-19
(2 classes)
Normal, Abnormal
Expert ReaderThe accuracy, specificity and sensitivity were 79%, 57%, and 100%
SVM with shallow
features, VGG-19
(2 classes)
Normal, Abnormal
Expert ReaderThe accuracy, specificity and sensitivity were 94%, 100%, and 88%
Transfer learning,
VGG-16
(2 classes)
Normal, Abnormal
Expert ReaderThe accuracy, AUC, specificity and sensitivity were 86%, 92%, 71%, and 100%
Knowledge-based(2 classes)
Normal, Abnormal
Expert ReaderThe accuracy, specificity and sensitivity were 93%, 86%, and 100%
Proposed workSPECT MPI imagesRGB-CNN
batch size = 8, dropout = 0.2, conv 16–32–64–128–256, dense nodes 32.32
(2 classes)
Normal, Abnormal
Coronary AngiographyThe accuracy, AUC, specificity and sensitivity were 94%, 93%, 78%, and 94%
Publisher’s Note: MDPI stays neutral with regard to jurisdictional claims in published maps and institutional affiliations.

