Article

Analysis of the Influence of CO2 Concentration on a Spark Ignition Engine Fueled with Biogas

by
Donatas Kriaučiūnas
1,
Saugirdas Pukalskas
1,*,
Alfredas Rimkus
1 and
Dalibor Barta
2,*
1
Department of Automobile Engineering, Faculty of Transport Engineering, Vilnius Gediminas Technical University, J. Basanavičius Str. 28, LT-03224 Vilnius, Lithuania
2
Department of Transport and Handling Machines, Faculty of Mechanical Engineering, University of Žilina, Univerzitna 8215/1, 010 26 Žilina, Slovakia
*
Authors to whom correspondence should be addressed.
Appl. Sci. 2021, 11(14), 6379; https://doi.org/10.3390/app11146379
Submission received: 7 June 2021 / Revised: 2 July 2021 / Accepted: 7 July 2021 / Published: 9 July 2021
(This article belongs to the Special Issue Advanced Engine Technologies and Innovative Vehicle Driving Systems)

Abstract

:

Featured Application

The results of this paper describe the effect of carbon dioxide (CO2) concentration on a petrol engine running on biogas (BG), specifically its ecological and energy parameters. The data can be applied in further analysis of biogas combustion, engine spark timing control or exhaust gas emission analysis. They can also be useful in practice when converting compress natural gas engines to work on biogas or to optimize the engine parameters and increase the efficiency.

Abstract

Biogas is one of the alternative solutions that could reduce the usage of fossil fuels and production of greenhouse gas emissions, as biogas is considered as an alternative fuel with a short carbon cycle. During biogas production, organic matter is decomposed during an anaerobic digestion process. Biogas mainly consists of methane and carbon dioxide, of which the ratio varies depending on the raw material and parameters of the production process. Therefore, engine parameters should be adjusted in relationship with biogas composition. In this research, a spark ignition engine was tested for mixtures of biogas with 0 vol%, 20 vol%, 40 vol% and 50 vol% of CO2. In all experiments, two cases of spark timing (ST) were used; the first one is a constant spark timing (26 crank angle degrees (CAD) before top dead center (BTDC)) and the second one is an advanced spark timing (optimal for biogas mixture). Results show that increasing the CO2 concentration and using constant spark timing increases the mass burned fraction combustion duration by 90%, reduces the in-cylinder pressure and leads to a reduction in the brake thermal efficiency and nitrogen oxides emissions at all measurement points. However, the choice of optimal spark timing increases the brake thermal efficiency as well as hydrocarbon and CO2 emission.

1. Introduction

The electricity and transport sectors are responsible for most of the world’s CO2 emissions from fossil fuels [1]. Despite greenhouse gas (GHG) emission policies, the transport sector is the only major European economic segment in which GHG emissions have grown since 1990, with all other sectors achieving emission reductions over the same period [2]. European emission mitigation goals include a 60% reduction in greenhouse gas emissions by 2050 compared to 1990 and a 20% reduction in emissions by 2030 compared to 2008 [3]. To achieve these goals, it is necessary to replace fossil fuels with more sustainable and low-emission fuels. Alternative fuels which could reduce greenhouse gas emissions could be compressed natural gas (CNG) [4], biogas (BG) [5], biodiesel [6], alcohols [7], their blends [8] or hydrogen [9], which are considered to be cleaner and more environmentally friendly compared to conventional fuels.
Gaseous fuels mix easily with air and forms homogeneous, highly flammable mixtures. Therefore, harmful exhaust emissions are reduced [10]. Biogas, consisting mainly of methane, has a high ratio of hydrogen/carbon (H/C) atoms. Less carbon atoms in biogas ensures lower emissions of CO2 after the same energy input [11]. Biogas is one of the most promising alternative fuels for reducing GHG emission [12]. Properly cleaned biogas could be used as a renewable fuel for vehicles [13]. Biogas could be used in high compression ratio engines. An increased compression ratio leads to a higher thermal efficiency of the engine, but at the same time, emissions of NOx and HC increase [14].
The British Petroleum Company’s Energy Outlook predicts that by 2035, usage of renewable energy sources will grow the most in OECD (Organization for Economic Co-operation and Development) countries [15]. Of all renewable fuels, biofuels (including biogas) have been recognized as an excellent source of energy, which is equally suitable for developed countries as a means of reducing CO2 emissions and for developing countries by providing electricity to rural areas, where local people have easy access to biomass [16]. Additionally, biogas production provides greater benefits for the manufacturer, because it is usually spread through a variety of industries, such as energy, transport and waste management, as biogas could be produced from decomposing organic waste from landfills, agricultural or industrial waste, food waste or other biodegradable materials, reducing the negative impact on the environment and methane emissions [17].
The number of biogas plants has increased over the last 10 years, leading to increased usage and production of biogas. In Europe, 6227 biogas plants were registered in 2009 and the number of biogas plants doubled to 13,812 in 2012. Within five years, the number of BG plants increased by 30% as 17,783 biogas plants were registered [18]. The distribution of biogas plants in top 15 countries of Europe is shown in Figure 1, which based on data from [18,19]. The rising number of biogas plants indicates an increased demand of biogas. In the EU-28, production doubled from 93 to 187 TWh between 2008 and 2016 [19]; further doubling could be expected before 2030, and even greater changes could be recorded in individual countries [20]. In view of the growing production of biogas and its potential to reduce GHG emissions, biogas can be an alternative to fossil fuels in the energy, heat and transport sectors [21].
At the same time, biogas production would increase the disposal of waste, as biogas could be produced from different feedstock, such as the domestic sewage, citrus pulp, manure, whey, silage and algae [22,23,24,25], and increase the usage of biofuels. Depending on feedstock, biogas could be produced as a first-, second-, third- or fourth-generation alternative fuel [26]. Mainly biogas composition consists of methane (CH4) and carbon dioxide [27]. However, it may contain traces of hydrogen sulfide (H2S), hydrogen (H2), ammonia (NH3), oxygen (O2), carbon monoxide (CO), nitrogen (N2) and water vapor (H2O) [28]. Before biogas can be used as alternative fuel [29], harmful and toxic compounds must be segregated. Purification technologies, such as physical and chemical absorption, biological desulfurization or membrane separation, are widely used to separate impurities from biogas. The methane volumetric percentage of ready-to-use biogas varies from 50 to 80 vol%. The characteristics of different biogas compositions are given in Table 1, based on data from [14,30].
Changing SI engine fuel to gaseous fuels (liquefied petroleum gas (LPG), natural gas or biogas) increases ignition delay, which can lead to overheating of the exhaust valves. Without an adjustment of the engine spark timing, the temperature of exhaust gasses increases due to the subsequent combustion phase. However, this could be avoided if the engine ST is adjusted accordingly for each specific biogas composition [31].
CO2, contained in biogas, decreases biogas LHV or the calorific value of the fuel, resulting in a reduction in the total amount of heat released from the complete combustion of biogas [32]; however, at the same time, it increases the BG methane number. The methane number (MN) of biogas indicates a resistance to knocking. For example, methane has an MN of 100, while hydrogen has an MN of 0 and a mixture of 70% CH4 and 30% hydrogen has an MN of 70. Hydrogen is a carbon-free fuel; therefore, using it as an additive reduces CO2 and HC emissions, and increases flame speed, rate of heat release (ROHR) and engine brake thermal efficiency [12], but at the same time, it reduces the critical compression ratio and knocking resistance [33]. Adding CO2 to methane increases the MN of the mixture. The MN is defined as 100 plus the percentage of CO2 added to the blend [34]; for example, a biogas of 60% methane and 40% carbon dioxide has an MN of 140 [35]. The CO2 concentration increases the resistance to knocking; therefore, biogas could be used in an engine with a higher compression ratio. Biogas with 40% of CO2 could be used in engines with a compression ratio up to 17.6:1, while biogas with 40% of methane could be used in engines with a compression ratio up to 14.4:1 [36].
Carbon dioxide reduces the energy density and combustion speed of biogas. Biogas containing 41 vol% of CO2 has a combustion speed of 0.25 m/s when LPG–0.38 m/s and CNG ~0.34 m/s [11]. As the CO2 concentration in BG increases, not only does the combustion speed decrease, but also the calorific value and flammability range, compared to natural gas or LPG. However, the CO2 raises the self-ignition temperature and MN of BG, which allows the use of biogas in engines with a higher compression ratio spark ignition (SI) without detonation [37]. Using biogas with a lower CO2 concentration increases the peak in-cylinder pressure and reduces the brake-specific fuel consumption, because of the increased LHV of biogas [14]. Experimental studies have shown that decreasing the CO2 concentration in biogas, at all equivalence ratios, increases the engine power and brake thermal efficiency and decreases the HC emissions. In addition, reducing the CO2 concentration widens the lean misfire limit of the mixture and reduces the NOx emission [11]. Carbon dioxide could be removed from biogas to increase fuel LHV, but methods such as water scrubbing has high methane losses and low energy efficiency [38].
Okayama University researchers have indicated that the increase in CO2 concentration reduces the combustion pressure and ROHR, and also prolongs the flame development period. In addition, increasing the CO2 concentration reduced NOx emissions in all engine operating cycles [39]. However, when changing the composition of biogas, it is in any case very important to set up the engine correctly and adapt it to a certain mixture. Failure to do so may increase fuel consumption, emissions and cycle-to-cycle variations [40] and reduce thermal efficiency [13]. Therefore, the purpose of this paper is to investigate the influence of spark timing and CO2 concentration on the energy and environmental performance of an SI biogas engine. In this study, spark ignition engine working on biogas with 0 vol%, 20 vol%, 40 vol% and 50 vol% of CO2 was tested at a selected fuel-optimal ST (generating maximum torque) and at a constant ST of 26 CAD BTDC (optimal for methane at test conditions).

2. Materials and Methods

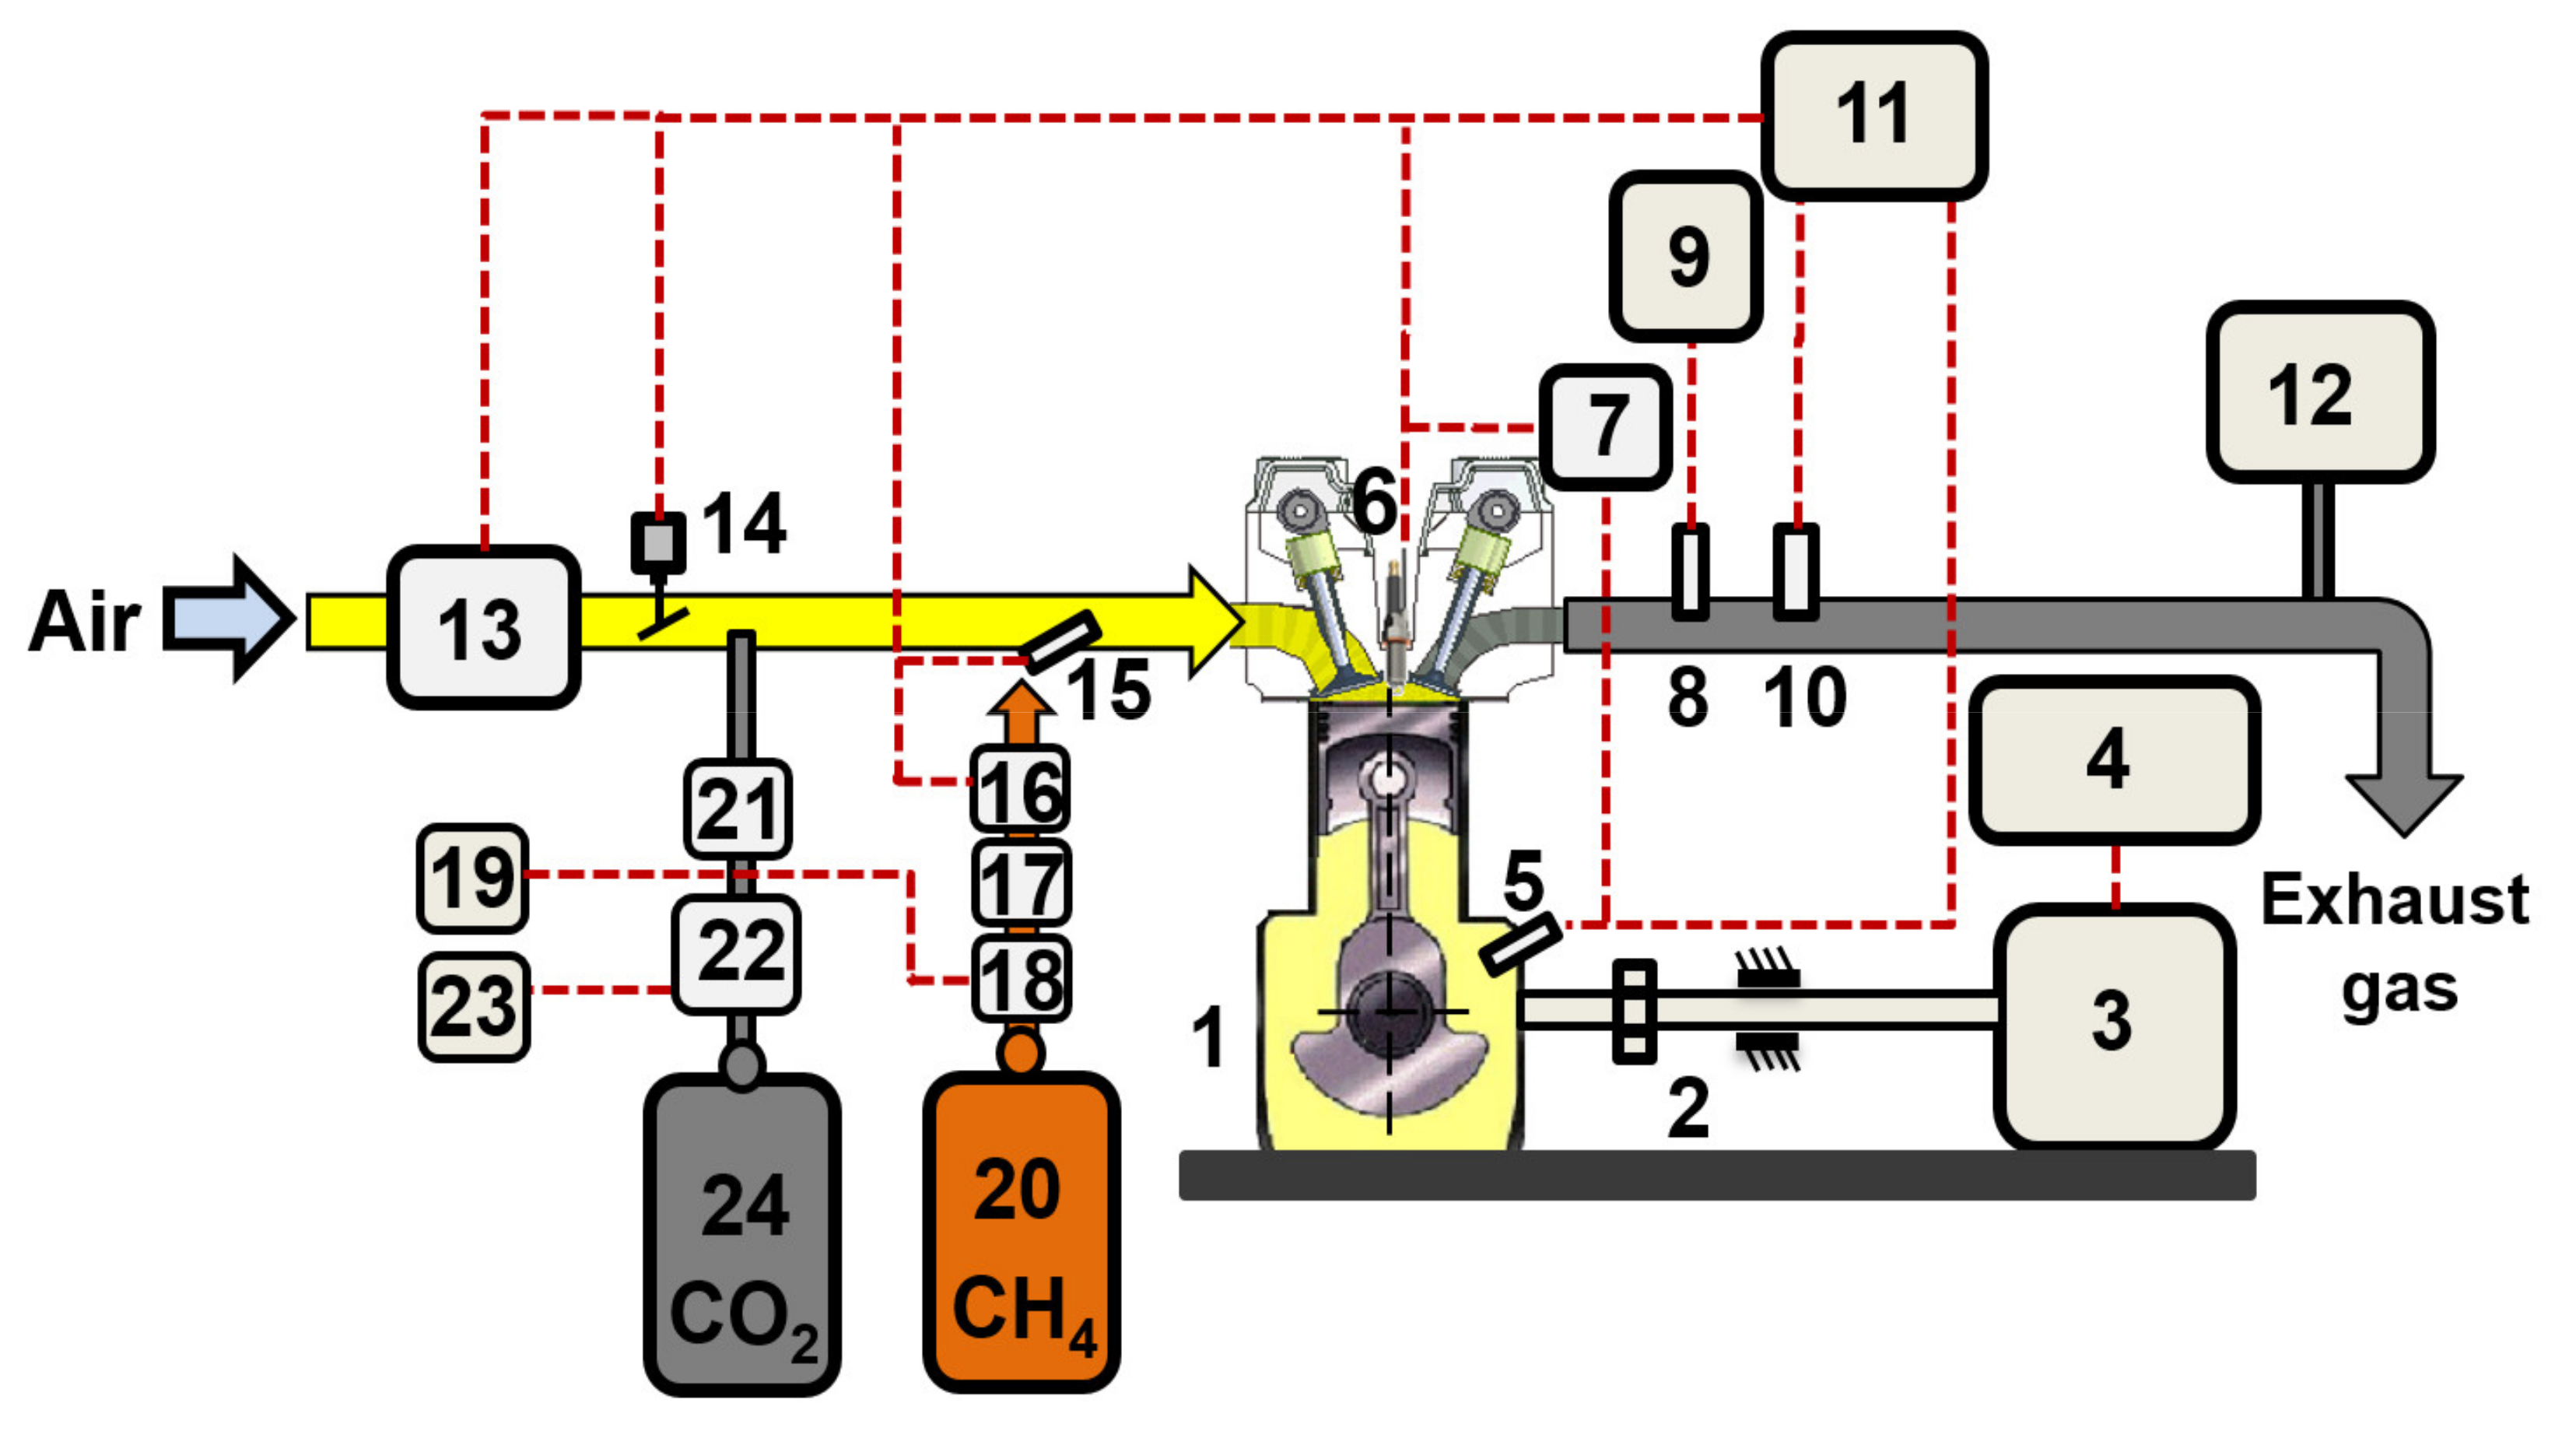
All experiments were performed in Vilnius Gediminas Technical University, Laboratory of Internal Combustion Engines (J. Basanavičiaus str. 28, Vilnius, Lithuania). NISSAN’s HR16DE in-line four-cylinder spark ignition engine combined with engine load stand AMX200/100 (0.9 Nm precision) was used for the experiments. Engine displacement was 1.598 dm3 (cylinder bore–78.0 mm, piston stroke 86.6 mm), engine power was 84 kW at 6000 rpm and torque was 156 Nm at 4400 rpm. The engine compression ratio was 10.7. A plate heat exchanger was added to maintain a stable engine operating temperature during all measurements. A standard oxygen sensor was replaced with a wideband oxygen sensor BOSCH LSU 4.9 for air fuel (A/F) ratio monitoring. The intake air mass was measured with a BOSCH hot film air mass meter, type HFM 5 (accuracy 2%). Additional injectors for CH4 were added to the engine’s intake manifold. The engine’s spark timing (ST) and fuel injection quantities were adjusted via a reprogrammable MOTEC M800 electronic control unit (ECU), which has the ability to control additional injectors; in this case, the injectors for CH4 were controled. Figure 2 shows a schematic diagram of an engine with load stand and measurement equipment.
The in-cylinder pressure was measured for every selected biogas composition and analyzed using the AVL BOOST software utility tool BURN. The in-cylinder pressure data were obtained using a spark plug with integrated pressure sensor AVL ZI31_Y7S and signal amplifier AVL DiTEST DPM 800; detailed information is given in Table 2. The signal of the sensor was processed and recorded using the LABVIEW REAL TIME module. During data collection, two samples were collected, each containing 100 combustion engine cycles.
The exhaust gas temperature was measured in the exhaust manifold, while the exhaust gas composition was measured from offshoot pipe (for reducing the exhaust gas flow and temperature) connected to the exhaust pipe before the catalytic converter. Exhaust gas analyzer AVL DICOM 4000 was calibrated for the biogas engine. The exhaust gas analyzer parameters are listed in Table 3.
For the experiment, biogas was reprocessed as pure biogas containing only methane and carbon dioxide [41]. Two separated gas tanks of CO2 and CNG (as substitutes for methane) were used for imitating biogas. Recreated were four different biogas compositions containing 50%, 40%, 20% and 0% of CO2 by volume. Properties and marking of the used fuel mixtures are presented in Table 4. A mixture with 0 vol% CO2 was selected as a reference point for biomethane (biogas purified from all impurities including CO2) [42]. Because the biogas was mixed from separate tanks, two separate RHEONIK RHM 015 mass flow meters calibrated for CNG and CO2 (measuring range 0.24–36 kg/h, accuracy 0.1%) were used to determine the gas consumption.
All types of biogases were tested at a constant engine speed of 2000 rpm, with a 15% opened throttle and a stoichiometric A/F ratio (measured mass of intake air and used biogas). Two different spark timing cases were used for each biogas. First, all biogas mixtures were tested at a constant ST of 26 CAD BTDC. This ST is optimal for BG0. Experiments with a constant ST also allow a more accurate assessment of carbon dioxide impact on combustion parameters. Second, all types of biogases were tested with optimal ST for each composition (for generating maximum torque). ST values are presented in Table 4. The effect on the wear of the engine parts was not evaluated, because we performed short-time experiments, and the recreated biogas contains methane and carbon dioxide; additionally, the use of biogas reduces the load on the engine parts due to the reduced in-cylinder pressure [34].

3. Results and Discussion

During the experiments, the HR16DE engine was operated at a constant speed of 2000 rpm with a 15% opened throttle. For all tested fuel mixtures, the air fuel ratio was set to be stoichiometric. In order to use the biogas as a fuel in CNG engines, two different spark timing sets were used. The first one, constant ST, used the original ECU maps for CNG also for biogas. The second one, ST optimal for mixture, used optimal timing for the selected biogas composition. In this case, ST was selected at maximum torque output of the engine.

3.1. Energy Indicators

Compressed natural gas (marked as BG0) was selected as a baseline for comparison of the experiment results. A change of the brake-specific energy consumption (BSEC) and brake thermal efficiency (BTE), depending on the changing biogas composition, is presented in Figure 3. As can be seen, the low concentration of CO2 in biogas increased the BSEC by just 0.81% with constant ST and by 0.60% with an ST optimal for the mixture. Increasing the CO2 concentration in biogas (40 and 50 vol%) increased the BSEC by 9.78 and 21.8% with a constant ST. Using biogas increased the BSEC, because of the low calorific value of the fuel mixtures with CO2 [43]. The value of the biogas lower heat value decreased in the mixture with 40 vol% CO2 by 64.8% and in 50 vol% CO2 by 73.6%. However, at the same biogas concentrations (40% and 50% CO2 by volume) and spark timing optimization, the BSEC increased by only 3.39% and 5.27% (which is 6.39% and 16.6% less than when using a constant ST) compared to the values for BG0. The optimized ST provides sufficient time for biogas to be burned, as biogas has a low combustion [44] and flame propagation speed [45]. ST also ensures higher engine efficiency and an increase in the engine power (by 5.5% for BG40 and by 11.2% for BG50 compared with the same measurement points at 26 CAD BTDC) [46].
Engine brake thermal efficiency (BTE) decreased while adding CO2. Comparing BG20 and BG0, BTE decreased by 0.8% and 0.6% in cases of constant ST and optimal ST, respectively. A further increasing CO2 concentration in biogas lowered the BTE by 8.9% and 17.9% at 40 vol% and 50 vol% of CO2, respectively, in case of 26 CAD BTDC ST. BTE decreased due to the increased combustion duration (CD) of biogas [47], and shifted maximal in-cylinder pressure further from top dead center (TDC). The end of combustion also shifts further from the TDC, leading to higher exhaust losses. Optimization of ST and shifting maximum in-cylinder pressure closer to TDC ensured a lower drop of BTE (comparing to BG0), by 3.27% and 5.00% (5.63% and 12.9% lower, respectively, as compared to the constant ST) at 40 vol% and 50 vol% of CO2, respectively. At optimized ST, a decrease of BTE occurred due to the increased fuel flow (BG40–165%, BG50–246%) and deteriorated volumetric efficiency of the engine [48].
The changes in the energy distribution of the SI engine working on biogas are presented the Figure 4. While engine working on BG0, the largest energy part is used to generate power (35.5%), adding CO2 prolonged the combustion duration and increased the exhaust losses [49]. A total of 20 vol% of CO2 increased the exhaust losses by 0.7% and 1.6% in case of optimal ST and constant ST, respectively. Further increasing the CO2 concentration in biogas and keeping the ST constant (26 CAD BTDC) increased the exhaust losses by 3.7% and 8.7% at 40 vol% and 50 vol% of CO2, respectively. In this ST case, the heat losses rose by 5.9% and 10.9% at 40 vol% and 50 vol% of CO2, respectively; because more carbon dioxide needed to be heated, combustion occurred in larger cylinder volume and heat of the combustion was transferred to a greater surface area of the cylinder [50]. Adjusting the ST reduced the head and exhaust energy losses. In case of BG40 and optimal ST, the heat losses were reduced by 3.7%, because of the increased combustion speed and shortened combustion duration. The exhaust losses were reduced by 2.4%, because less fuel was burned inside the exhaust. The same tendency is visible for BG50. Optimal ST reduced heat losses by 8.6% and exhaust losses by 5.4%.

3.2. Environmental Indicators

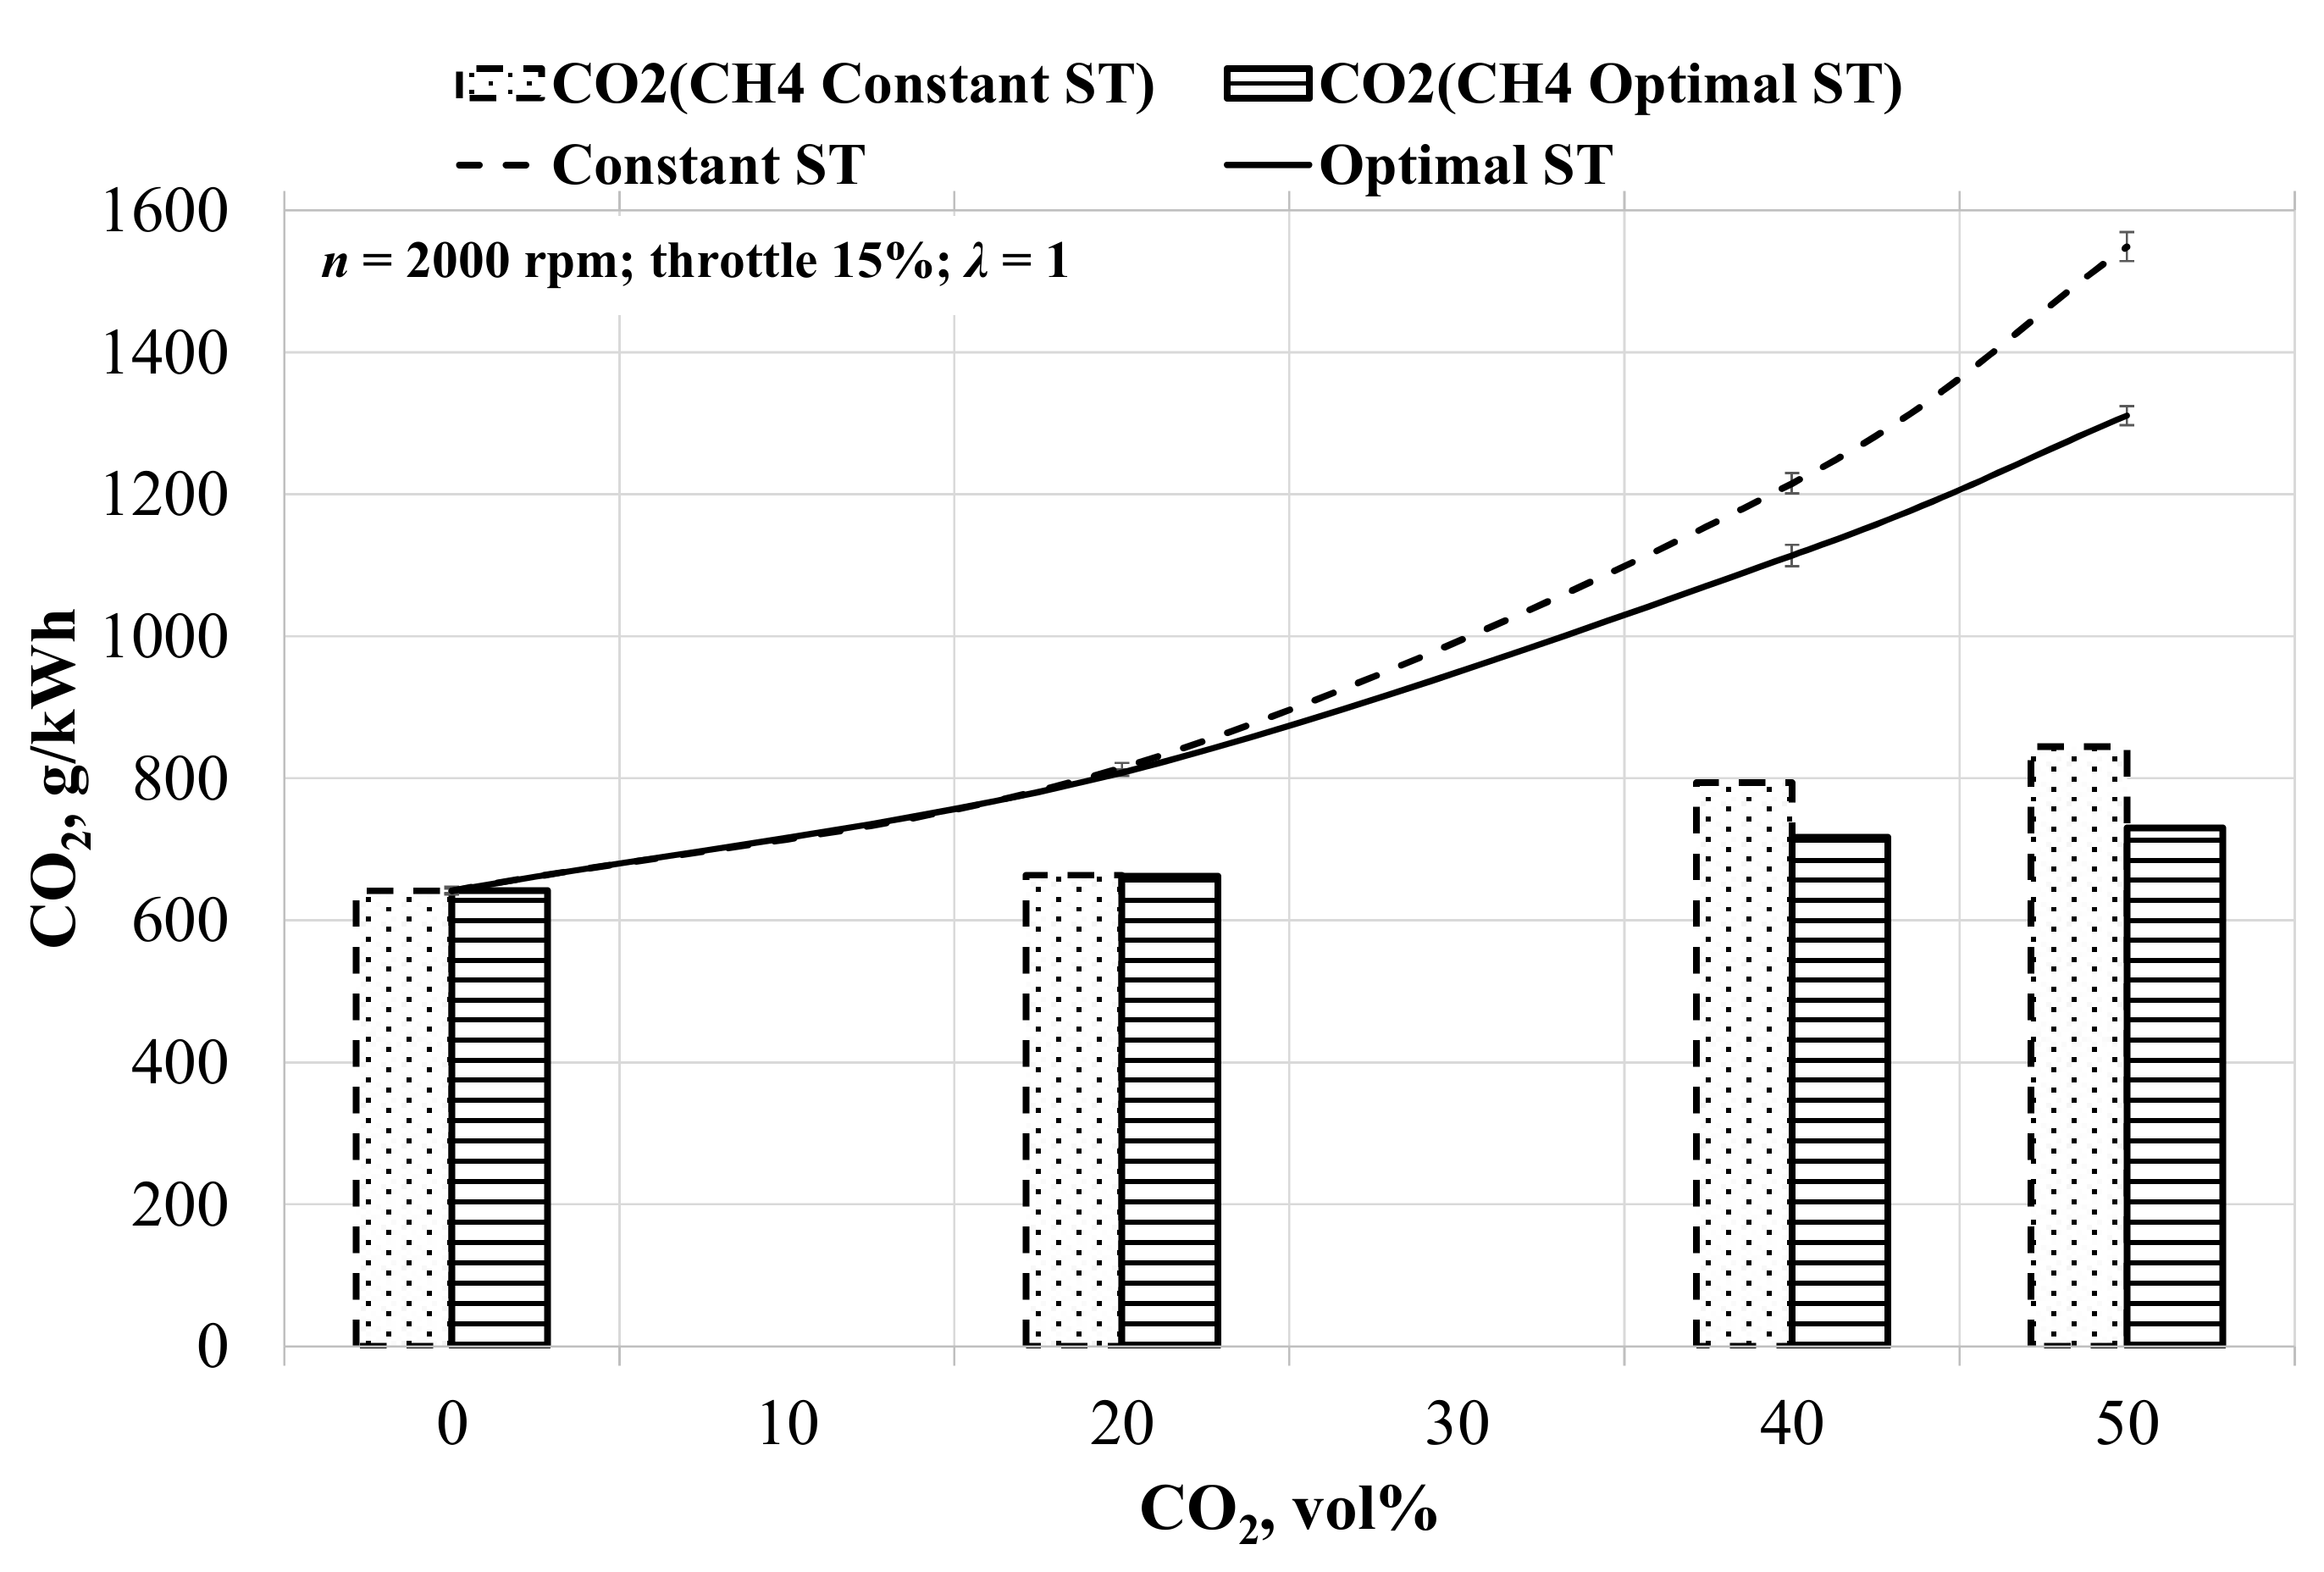
Increase of the CO2 concentration in biogas increased the total CO2 emission. At a constant ST of 26 CAD BTDC, CO2 emission increased by 24.5%, 89.4% and 141.3% at 20 vol%, 40 vol% and 50 vol% of CO2, respectively, in biogas (Figure 5). ST optimization reduces BSEC and requires less fuel. As a result, the CO2 concentration in the exhaust gas decreased by 15.9% and 37.1% when the engine was operated using BG40 and BG50, respectively. Biogas is considered to be a short carbon cycle fuel (during the combustion of biogas, CO2 is released into the atmosphere and then recaptured by newly growing biomass) [51]; therefore, the CO2 content in biogas was not assessed, and only the CO2 formed from combustion of methane was assessed (Figure 5, column chart, CH4 Constant ST—CO2 emission from methane at constant ST, CH4 Optimal ST—CO2 emission from methane at optimal ST). In this case, CO2 emission increased by just 3.1, 11.8 and 13.8% when the engine works on BG20, BG40 and GB50, respectively, and ST changed to the optimal value.
The concentration of nitrogen oxides (Figure 6) in the exhaust gas decreased for all measuring points. Lower LHV of biogas decreased the in-cylinder pressure, while a decreased burning speed of biogas and air mixture reduced the in-cylinder temperature [39]. Consequently, the NOx concentration reduced by 31.2%, 86.5% and 93.6% with BG20, BG40 and BG50, respectively, when ST was 26 CAD BTDC. The constant ST led to a decrease in the temperature and pressure in the cylinder, as the combustion rate of biogas with a higher concentration of CO2 decreased and shifted the peak pressure in the cylinder further away from the TDC. This is also visible from the exhaust gas temperature. The temperature increased by 0.22%, 1.01% and 2.50% (when comparing BG20, BG40 and BG50, respectively, with BG0) because of retarded ST and a higher amount of BG burning in the exhaust. However, optimal ST reduced the exhaust gas temperature by 0.80%, 2.05% and 4.08% as compared with the same measurement points (BG20, BG40 and BG50, respectively) and at 26 CAD BTDC. Reduced exhaust gas temperature indicates increased in-cylinder temperature and shifted the in-cylinder pressure closer to TDC. This is also confirmed by an increase in the NOx concentration (by 13.5%, 26.2% and 16.3% with BG20, BG40 and BG50, respectively, and optimal ST as compared with 26 CAD BTDC).
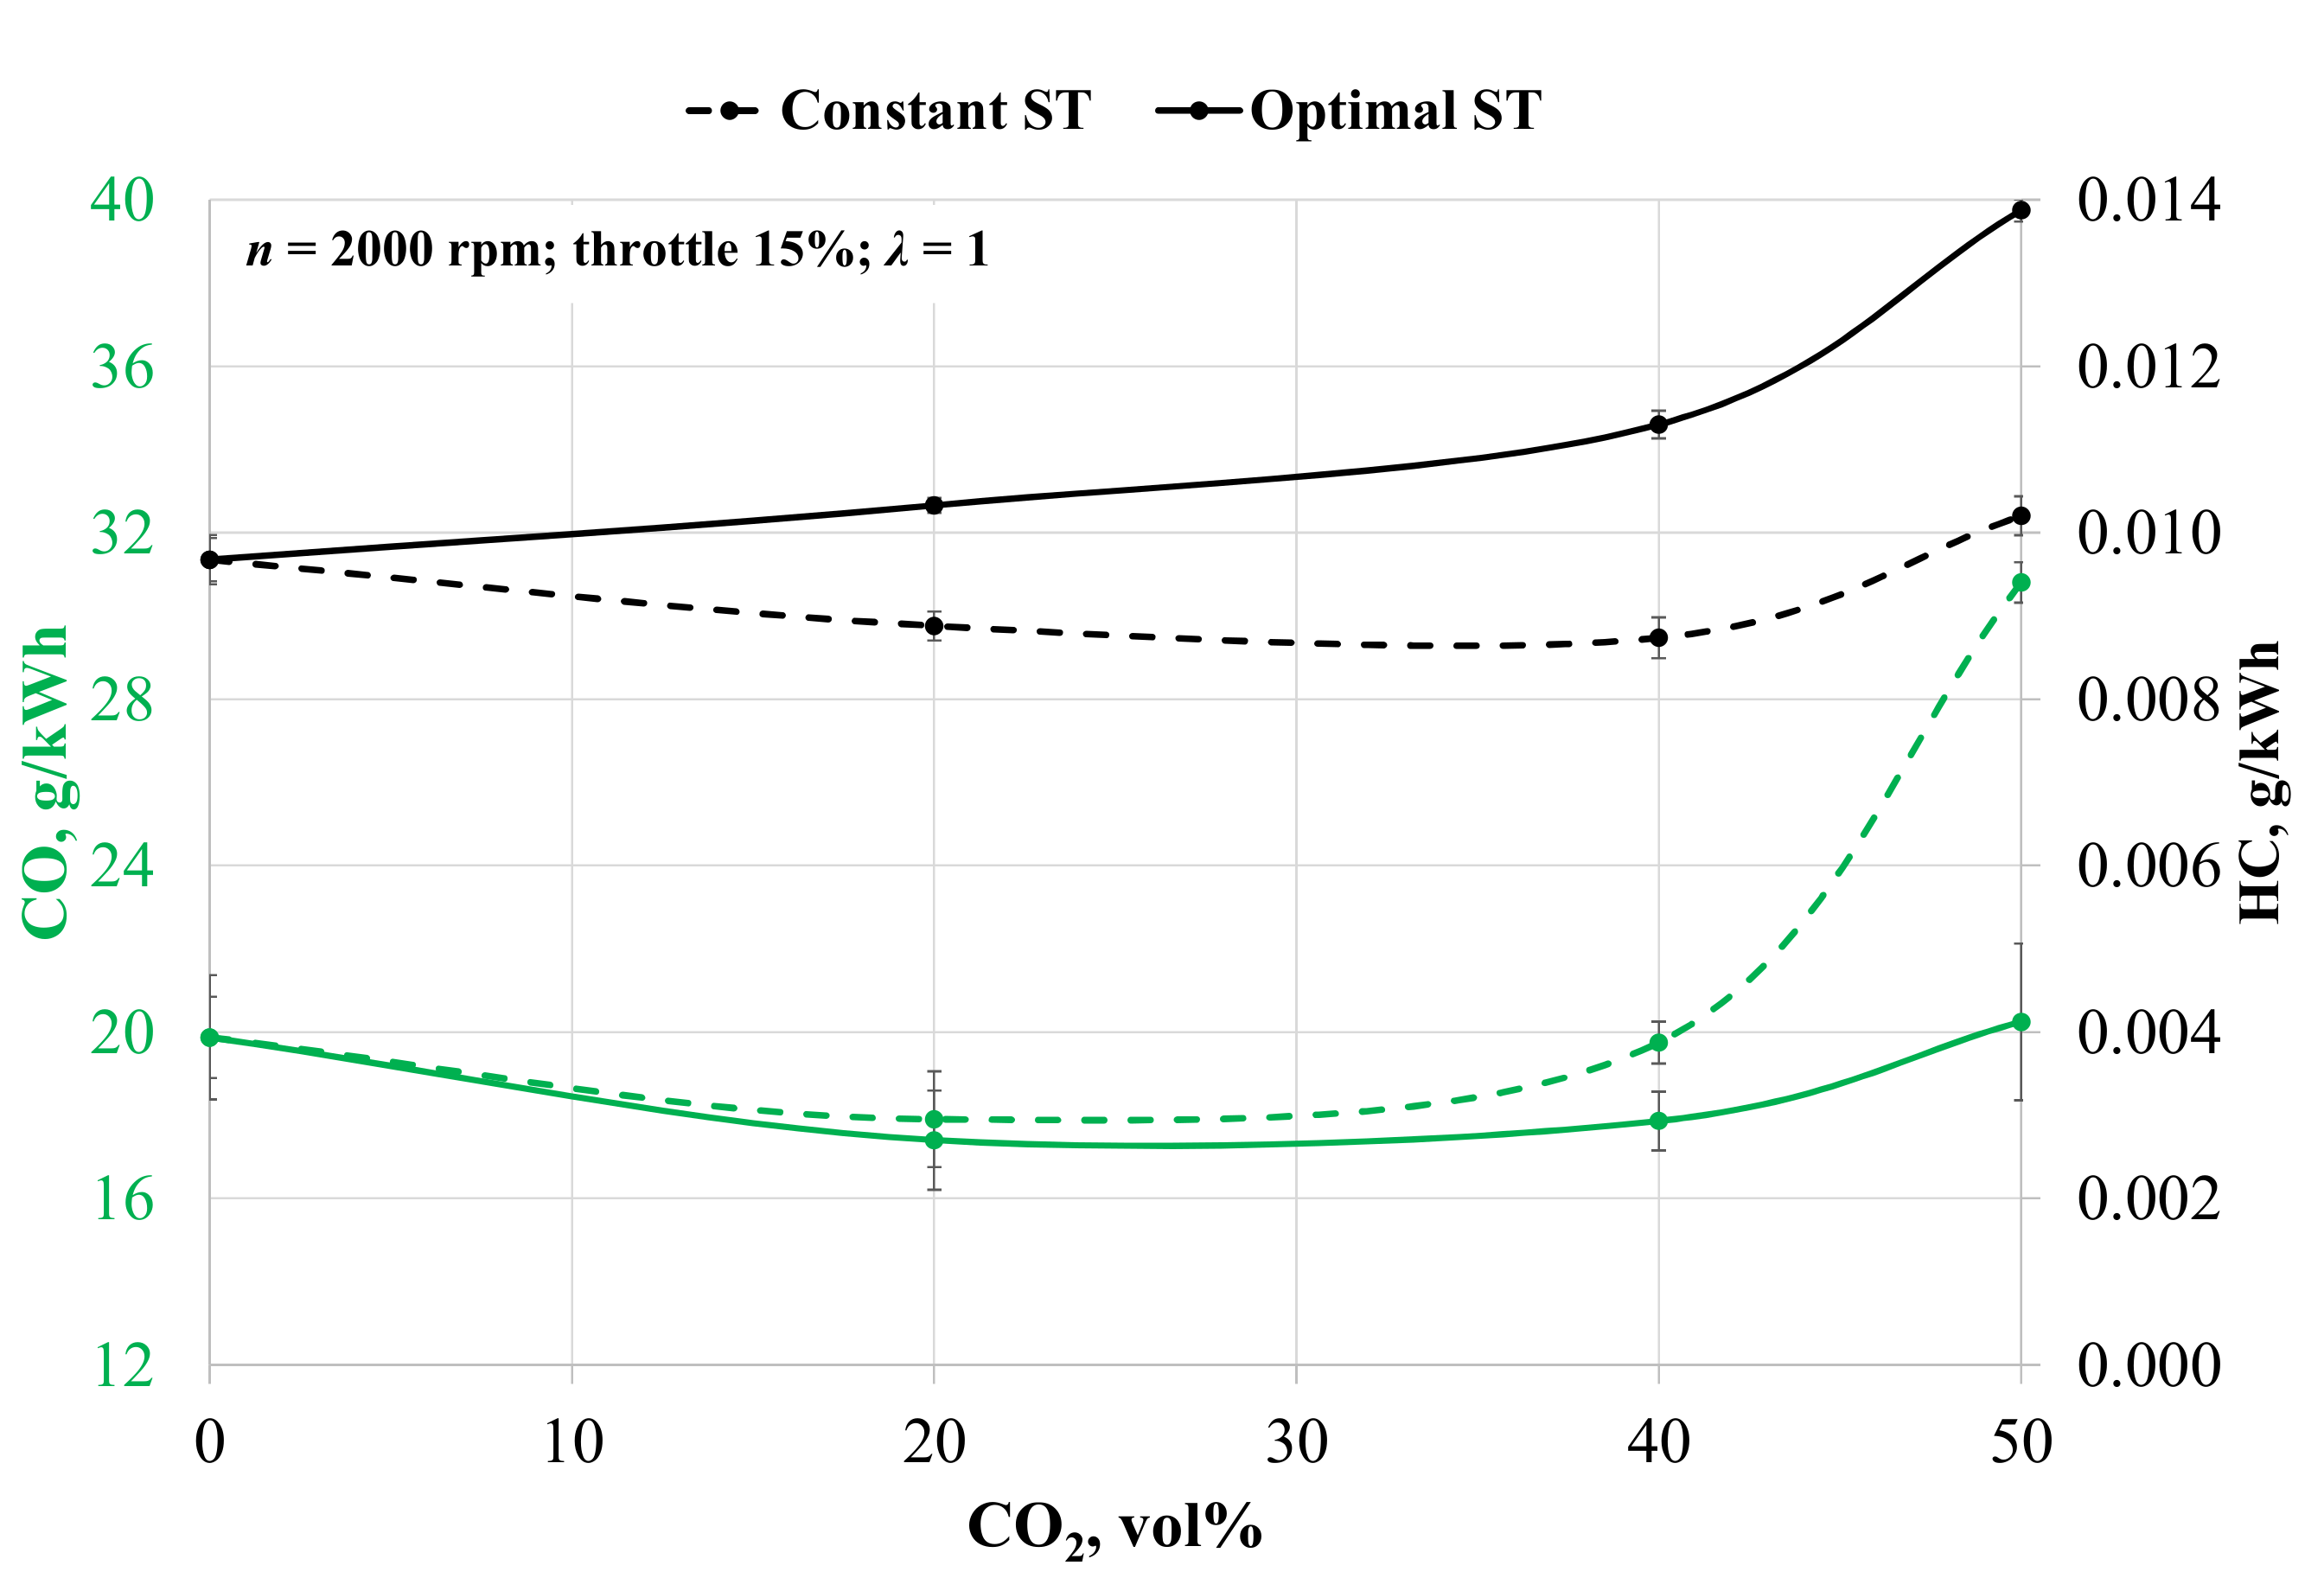
Harmful carbon monoxide emissions (Figure 7) were reduced by 2.8%, 9.6% and 34.4% with BG20, BG40 and BG50, respectively, when changing the constant ST of 26 CAD BTDC to the optimal ST. The optimal ST increases the engine BTE, and less fuel is needed; therefore, more air could get inside the cylinder and a larger amount of biogas could burn completely [52]. Comparing BG0 with BG20 and BG40, the CO emission decreased by 12.6% and 10.1%, respectively (optimal ST). CO emission decreased due to the reduced volumetric efficiency of the engine, because the addition of CO2 to an air–methane mixture limits the amount of methane that can get into the cylinder. Therefore, the amount of carbon involved in the combustion process decreases, and at the same time, less CO forms. Hydrocarbons (HC) emission increased by 6.7%, 16.7% and 43.3% at optimal ST when using BG20, BG40 and BG50, respectively. With a constant ST of 26 CAD BTDC, the HC emissions were reduced by 16.3%, 29.3% and 36.0% (with BG20, BG40 and BG50, respectively) compared with the same measurement points and optimal ST. Due to the constant ST (26 CAD BTDC), the exhaust gas temperature rose and reached the autoignition temperature of methane, resulting in post oxidation of HC [53].

3.3. Combustion Indicators

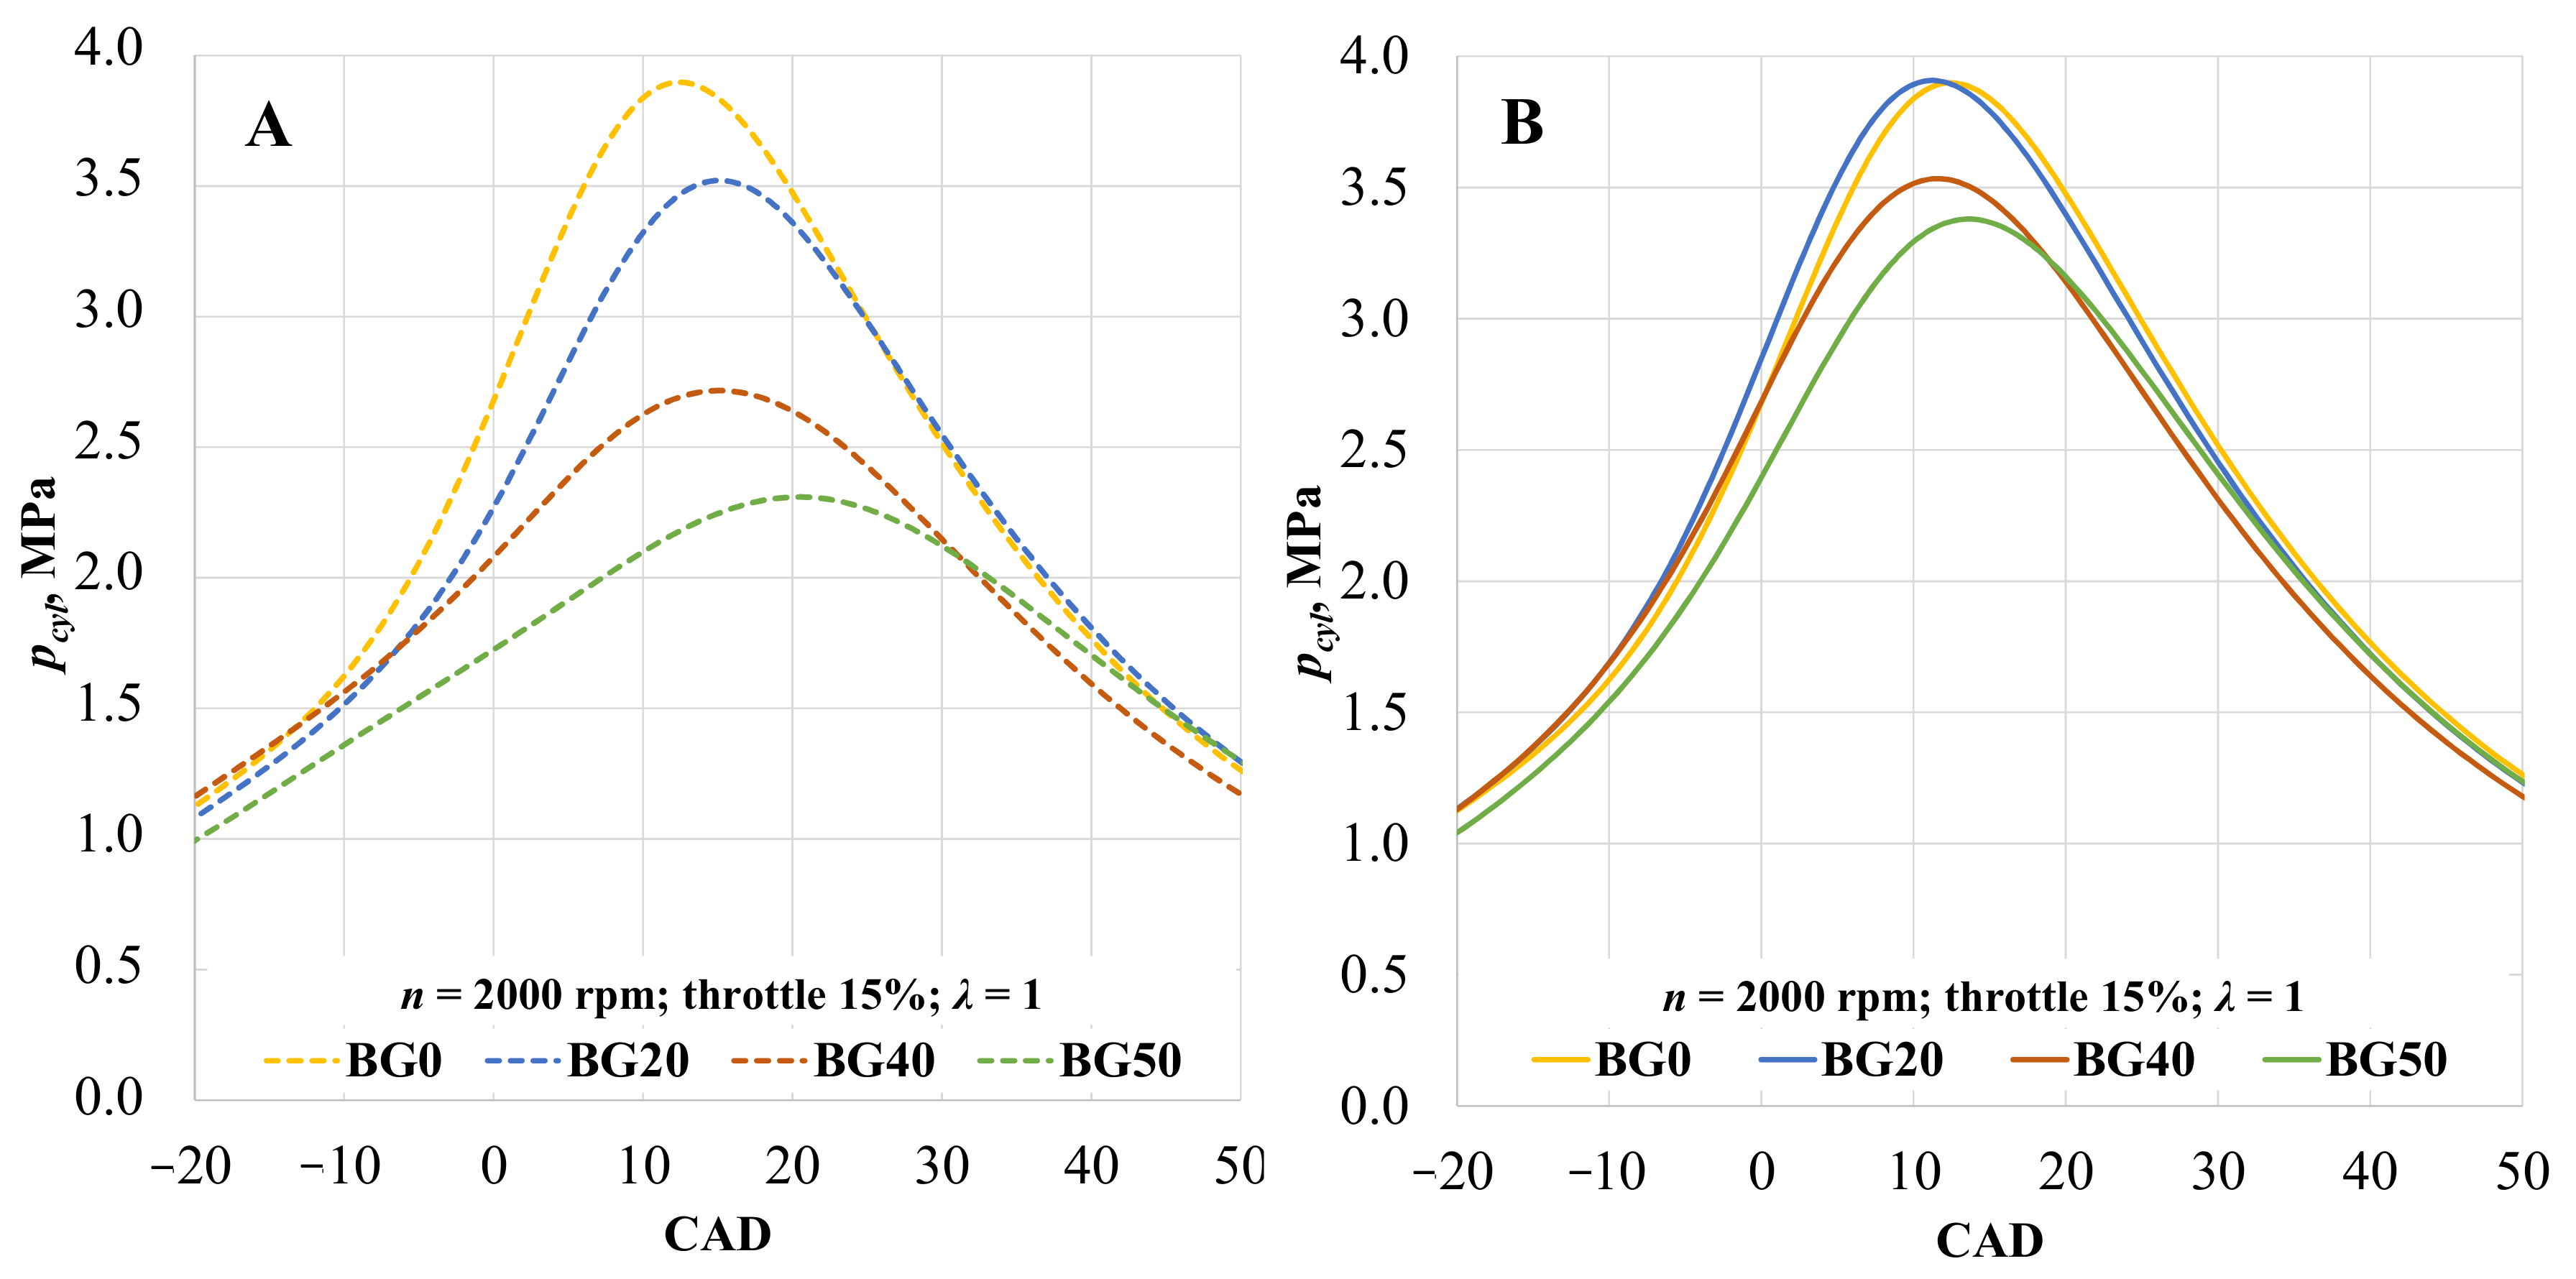
Combustion analysis was performed using the AVL BOOST software utility tool BURN. For the analysis, the in-cylinder pressure (Figure 8), fuel, air consumption and other parameters were used. The CO2 concentration and the ST influence on the combustion parameters were visible through the change of the in-cylinder pressure. When the engine ST was constant (26 CAD BTDC), the in-cylinder pressure dropped by 9.6%, 30.3% and 40.7% using BG20, BG40 and BG50, respectively. Biogas with a higher concentration of CO2 has a higher combustion delay and lower combustion speed [54]; therefore, the peak of the in-cylinder pressure shifted further from TDC (3, 3 and 8 CAD) and the maximum in-cylinder pressure occurred at a higher volume. Accessing the biogas combustion delay, a low combustion speed and selecting optimal ST increased the in-cylinder pressure by 9.9%, 20.9% and 27.4%, respectively, as compared with the constant ST of 26 CAD BTDC. The peak value of the in-cylinder pressure occurs in a range from 12–14 CAD ATDC when ST was optimized. A higher concentration of CO2 (BG40 and BG50) reduced the in-cylinder pressure by 9.4% (ST 35 CAD BTDC) and 13.3% (ST 40 CAD BTDC) compared to BG0, because of the prolonged combustion process and the decreased lower heat value of the fuels [55].
From the combustion parameters (Table 5), it is visible that CO2 increased the combustion delay. When comparing BG0 with BG20, BG40 and BG50, the start of the combustion delays is, on average, 8.2%, 9.7% and 18.6%, respectively. The CO2 effect is also visible in the change of the combustion duration. The time of 10% mass burned fraction (MBF) increased by 0.54%, 11.4% and 22.3% when comparing BG0 to BG20, BG40 and BG50, respectively, with a constant ST of 26 CAD BTDC. In this stage, the optimal ST prolonged the CD, and 10% MBF time extends by 9.2% and 3.3% using BG40 and BG50, respectively. The increase of the CD is visible, because BG started to burn at a higher volume, and the distance from air and fuel molecules are bigger; therefore, combustion speed decreased. In case of 90% MBF, combustion duration increased by 0.44, 31.3 and 32.2 when comparing BG0 with BG20, BG40 and BG50 at a constant ST of 26 CAD BTDC. Optimized ST reduced the combustion duration by 8.4% and 10.6% (BG40 and BG50), because the main fraction of combustion occurred closer to TDC and fuel burned at a lower volume. In the case of spark timing, 26 CAD BTDC burned a larger amount of fuel in a large volume (piston moving away from the TDC), which resulted in an increase in the exhaust gas temperature.
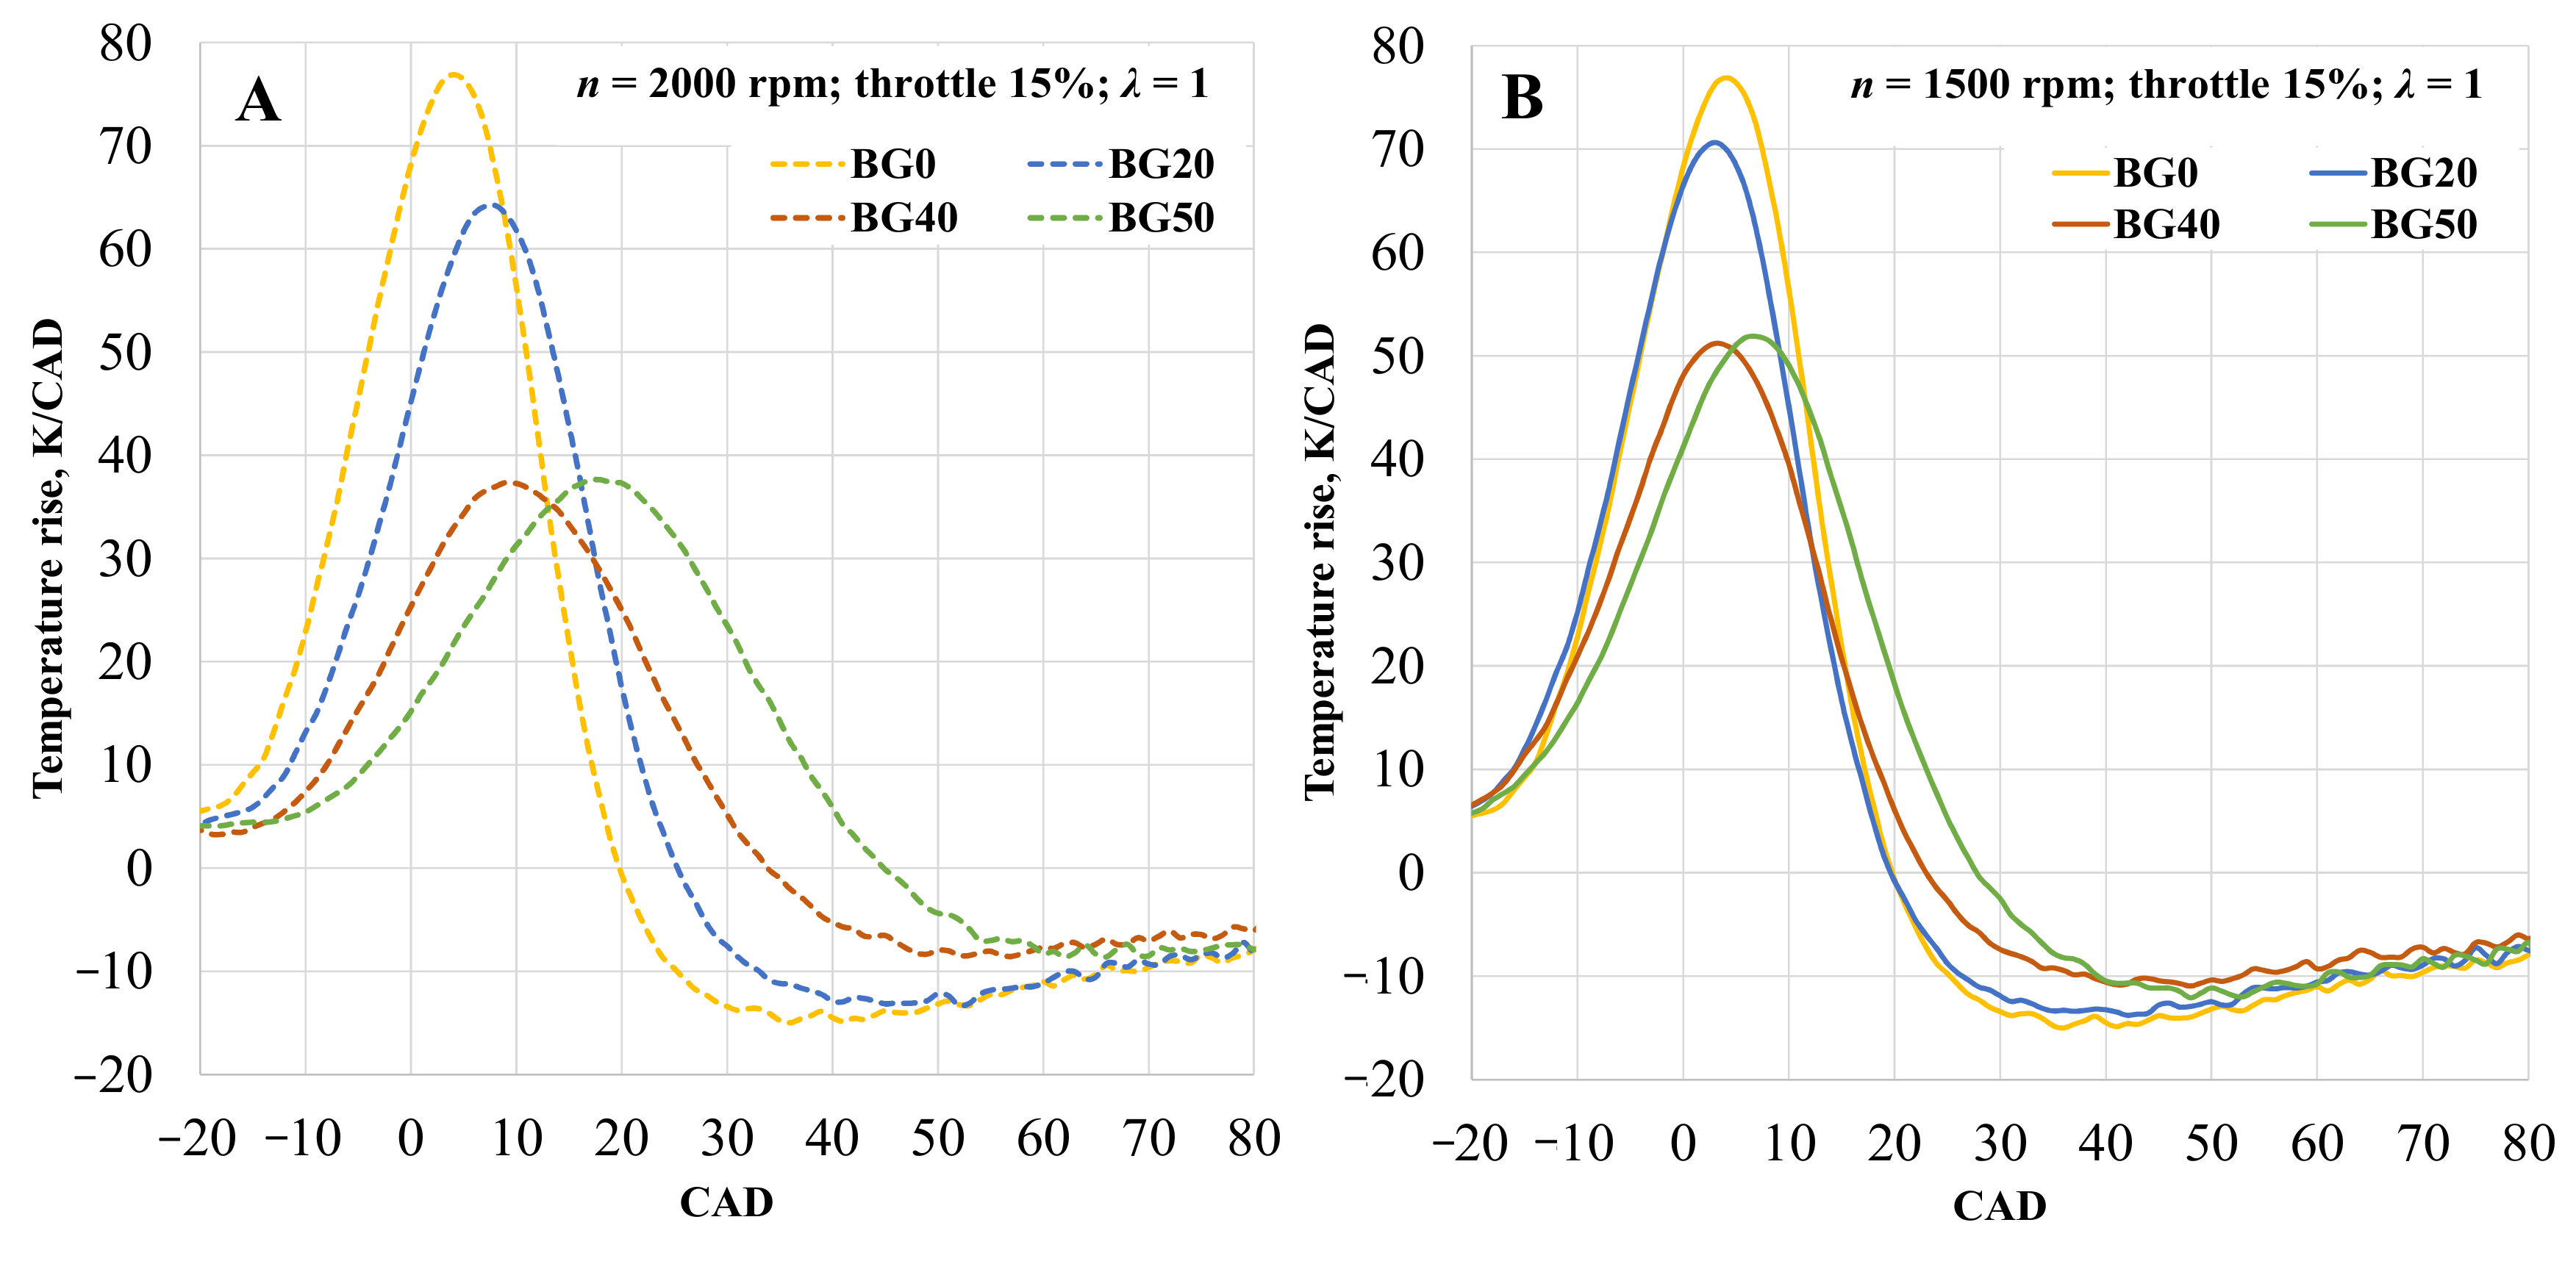
The change of the in-cylinder temperature rise (TR) can be seen in Figure 9. The maximum increase is tied to BG0. Increasing the CO2 concentration of BG without an optimal ST shifted the peak of the in-cylinder temperature rise further from TDC (BG20–4 CAD, BG40–5 CAD and BG50–14 CAD) in comparison to BG0. This led to a higher exhaust gas temperature and increased the exhaust energy losses. Optimal ST reduced the peak temperature rise drift up to ± 3 CAD and TR increased by 10.0%, 37.0% and 37.8% compared to BG20, BG40 and BG50, respectively, at a constant ST. The change in ST reduced the afterburning phase by 20.0%, 32.4% and 40.0% for BG20, BG40 and BG50, respectively, compared to a constant ST for 26 CAD BTDC. Therefore, exhaust losses decreased (Figure 4).
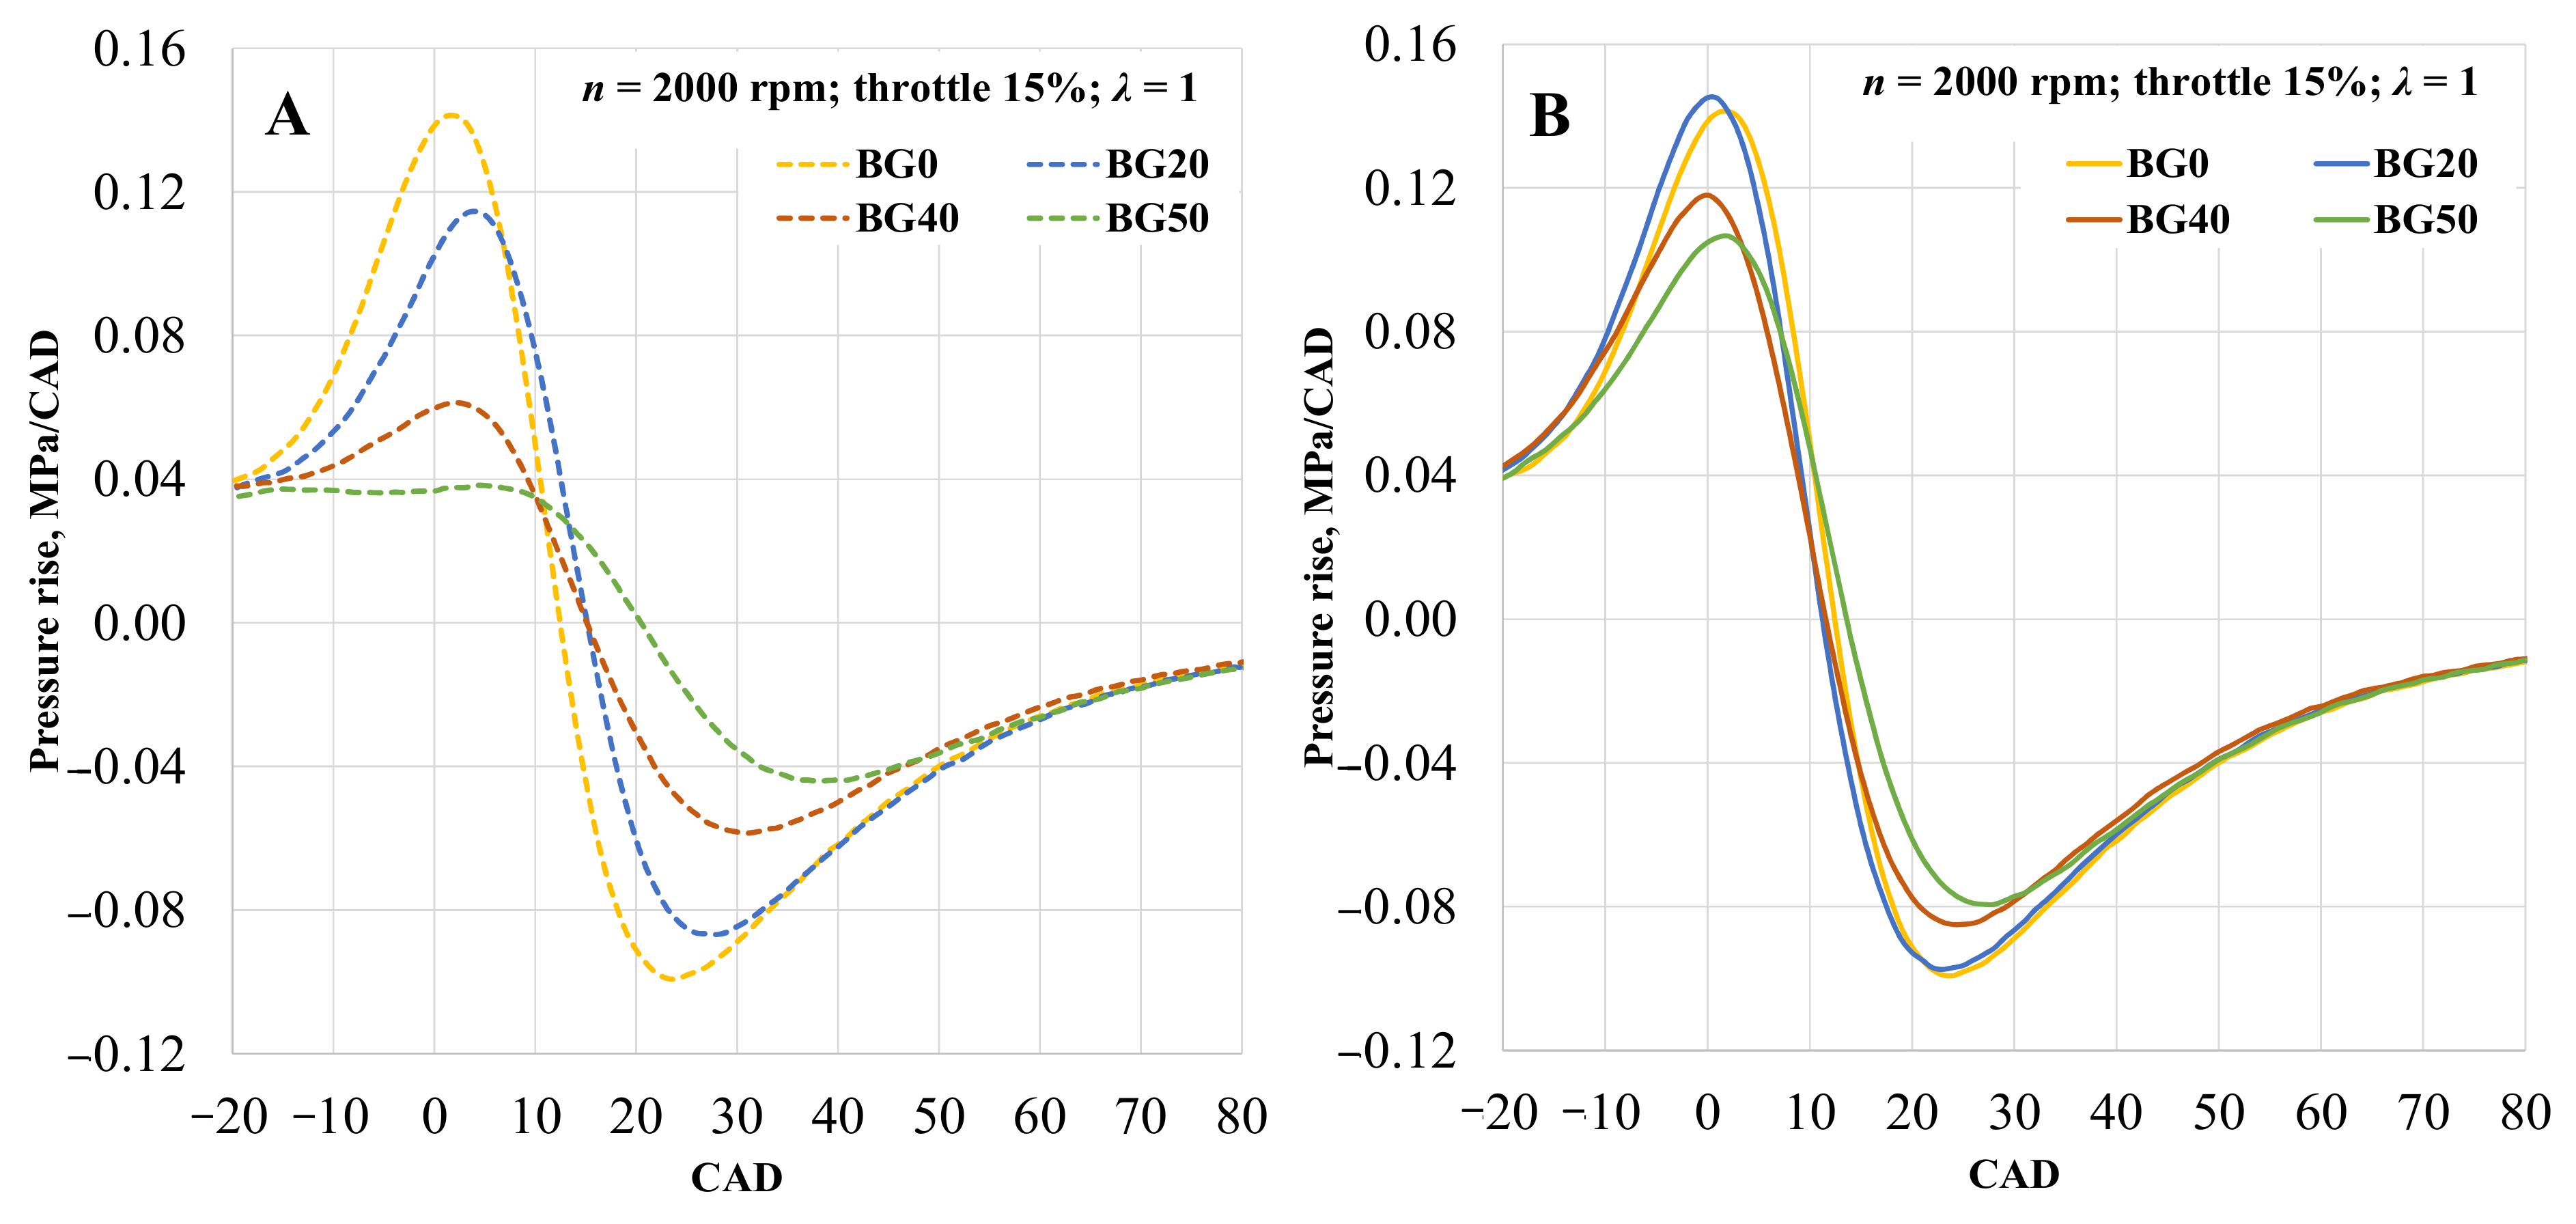
The change of the in-cylinder pressure rise (PR) is visible in Figure 10. Adjusting ST and changing BG composition led to increased PR when engine works on BG20. The maximum value of the pressure rise increased by 2.7% compared to BG0 and moved 1 CAD closer to the TDC. The increase occurred due to the low decrease of LHV and optimal ST. A further increase in the CO2 concentration decreased the PR by 16.5% and 24.5% at BG40 and BG50, respectively. The adjusted constant ST for 26 CAD BTDC decreased the pressure rise by 18.9%, 56.6% and 72.9% with BG20, BG40 and BG50, respectively, compared to BG0. The decrease in pressure rise is higher due to the extended timing of the flame formation phase and the low combustion speed of BG. The maximum value of the pressure increase moved further away from the TDC and the main biogas fraction burned in a larger cylinder volume, which reduced the PR and BTE.

4. Conclusions

In this study, the effect of different biogas compositions on spark ignition engine energy, environmental and combustions parameters was investigated under different spark timings with a 15% opened throttle, at 2000 rpm and with a stoichiometric air and biogas mixture. The following conclusions can be made from the collected and analyzed experiment results:
  • BSEC rises as the CO2 concentration in biogas increases, because the carbon dioxide reduces the biogas lower heat value (BG40—by 64.8% and BG50—by 73.6%) and reduces the combustion and flame propagation speed. Optimal ST compensates for the low combustion speed of biogas and BSEC increased by 6.39% and 16.6% for BG40 and BG50, respectively, compared to constant ST.
  • Engine brake thermal efficiency decreases when adding CO2. Additionally, BG40 and BG50 increase the amount of fuel flow, and therefore, they reduce the volumetric efficiency of the engine. Carbon dioxide increases the combustion duration and flame propagation time; therefore, it increases the exhaust losses. For a constant ST of 26 CAD BTDC, exhaust losses increase by 1.6%, 3.7% and 8.7% with BG20, BG40 and BG50, respectively, compared to BG0. At the same time, heat losses increase due to the increased heat transfer time to the cylinder walls. Optimal ST shortened the combustion duration and increased the combustion speed, therefore, the time for heat transfer is reduced. In this case, heat losses are reduced by 8.6% and exhaust losses by 5.4% when comparing BG50 with different ST cases.
  • Biogas is considered a short carbon cycle fuel; therefore, only CO2 formed from the combustion of methane is assessed. In the optimized ST case using BG20, BG40 and BG50, CO2 emission increases just by 3.1%, 11.8% and 13.8%, respectively, compared to BG0. The emission raised due to increased BSEC and fuel consumption, because a larger amount of fuel with lower LHV is needed.
  • The concentration of NOx decreases in all measuring points. Lower LHV of biogas decreases the in-cylinder pressure, fuel burning speed and in-cylinder temperature. Constant ST reduced the NOX emissions by 13.5%, 26.2% and 16.3% more than optimal ST (using BG20, BG40 and BG50), because the peak in-cylinder pressure moves further away from TDC and more fuel burns in the exhaust. This is confirmed by the increase in the exhaust gas temperature (0.22%, 1.01% and 2.50% with BG20, BG40 and BG50, respectively, compared with BG0).
  • Increasing the CO2 concentration in biogas decreases the combustion speed and increases the combustion delay. Therefore, the peak in-cylinder pressure moves further from TDC and the maximum in-cylinder pressure drops by 9.6%, 30.3% and 40.7% when comparing BG20, BG40 and BG50, respectively, to BG0 at 26 CAD BTDC. The optimal ST moves the peak in-cylinder pressure in the range of 12–14 CAD ATDC and increases the maximum value of the in-cylinder pressure.
  • The optimal ST increases the 10% of MBF time due to the combustion at a higher cylinder volume and distance from air and fuel molecules; therefore, the combustion speed decreases. In case of 90% MBF time, the combustion duration is reduced by 8.4% and 10.6% (BG40 and BG50, respectively, compared to constant ST), because the main fraction of combustion occurs closer to TDC and fuel burns at a lower volume and at a higher speed.
  • The pressure rise decreases at a constant spark timing for all CO2 concentrations, because the flame formation phase extends and prolongs the combustion duration of BG. The maximum pressure rise value shifts further from TDC and the main fraction of biogas burns in a larger cylinder volume. The optimal ST increases the BTE of the engine and the combustion parameters; therefore, the PR increases by 40.1% and 48.4% compared to BG40 and BG50, respectively, at 26 CAD BTDC.
  • The constant ST case is not suitable for the SI engine, because the exhaust gas temperature increases with increased CO2 concentration, which could cause damage to the exhaust valves. Additionally, the BTE and the energy share for generating brake power decrease.
  • When comparing all four BG mixtures, the ecological and energy parameters of BG20 are closest to BG0, but partial removal of CO2 in biogas is required to prepare this composition. When comparing BG40 and BG50 mixtures with BG0, the BTE values are decreased by 3.3% and 5.0%, respectively, while the time of 10% MBF increases by 2.2% using BG50. Additionally, the HC and CO emission increases for mixtures with 40 vol% of CO2. Considering the ecological and energy parameters of the mixtures, it can be said that the biogas production process should be adjusted for manufacturing biogas with 40 vol% of CO2 to keep engines running efficiently and ecologically.

Author Contributions

Conceptualization, D.K.; methodology, D.K. and A.R.; software, D.K.; validation, S.P.; formal analysis, S.P.; writing—original draft preparation, D.K.; writing—review and editing, S.P. and D.B.; visualization, D.B.; supervision, A.R. and S.P.; project administration, D.B. All authors have read and agreed to the published version of the manuscript.

Funding

The paper was supported by the Scientific Grant Agency of the Ministry of Education of the Slovak Republic and the Slovak Academy of Sciences in project KEGA, no. KEGA 023ŽU-4/2020: Development of advanced virtual models for studying and investigation of transport means operation characteristics.

Institutional Review Board Statement

Not applicable.

Informed Consent Statement

Not applicable.

Data Availability Statement

Publicly available datasets were analyzed in this study. The data presented in this study are available on request from the corresponding author.

Acknowledgments

The results of combustion indicators described in this article were obtained using the engine simulation software AVL BOOST utility tool BURN, acquired by signing a cooperation agreement between the Advanced Simulation Technologies (AVL) and the Faculty of Transport Engineering of Vilnius Gediminas Technical University.

Conflicts of Interest

The authors declare no conflict of interest.

References

  1. European Environment Agency. Greenhouse Gas Emissions from Transport in Europe. Available online: https://www.eea.europa.eu/data-and-maps/indicators/transport-emissions-of-greenhouse-gases/transport-emissions-of-greenhouse-gases-10 (accessed on 3 September 2020).
  2. Ecologic Institute: Science and Policy for a Sustainable World. Evaluating 15 Years of Transport and Environmental Policy Integration. Available online: https://www.ecologic.eu/13108 (accessed on 3 September 2020).
  3. White Paper Roadmap to a Single European Transport Area—Towards a Competitive and Resource Efficient Transport System. Available online: https://eur-lex.europa.eu/legal-content/EN/TXT/HTML/?uri=CELEX:52011DC0144&from=en (accessed on 3 September 2020).
  4. Chen, H.; He, J.; Zhong, X. Engine combustion and emission fuelled with natural gas: A review. J. Energy Inst. 2019, 92, 1123–1136. [Google Scholar] [CrossRef]
  5. Owczuk, M.; Matuszewska, A.; Kruczyński, S.; Kamela, W. Evaluation of using biogas to supply the dual fuel diesel engine of an agricultural tractor. Energies 2019, 12, 1071. [Google Scholar] [CrossRef] [Green Version]
  6. Kanth, S.; Debbarma, S.; Das, B. Effect of hydrogen enrichment in the intake air of diesel engine fuelled with honge biodiesel blend and diesel. Int. J. Hydrogen Energy 2020, 45, 32521–32533. [Google Scholar] [CrossRef]
  7. Yusri, I.M.; Mamat, R.; Azmi, W.H.; Najafi, G.; Sidik, N.A.C.; Awad, O.I. Experimental investigation of combustion, emissions and thermal balance of secondary butyl alcohol-gasoline blends in a spark ignition engine. Energy Convers. Manag. 2016, 123, 1–14. [Google Scholar] [CrossRef] [Green Version]
  8. Awad, O.I.; Mamat, R.; Ali, O.M.; Sidik, N.A.C.; Yusaf, T.; Kadirgama, K.; Kettner, M. Alcohol and ether as alternative fuels in spark ignition engine: A review. Renew. Sustain. Energy Rev. 2018, 82, 2586–2605. [Google Scholar] [CrossRef]
  9. Alrazen, H.A.; Ahmad, K.A. HCNG fueled spark-ignition (SI) engine with its effects on performance and emissions. Renew. Sustain. Energy Rev. 2018, 82, 324–342. [Google Scholar] [CrossRef]
  10. Yilmaz, I.T.; Gumus, M. Investigation of the effect of biogas on combustion and emissions of TBC diesel engine. Fuel 2017, 188, 69–78. [Google Scholar] [CrossRef]
  11. Porpatham, E.; Ramesh, A.; Nagalingam, B. Investigation on the effect of concentration of methane in biogas when used as a fuel for a spark ignition engine. Fuel 2008, 87, 1651–1659. [Google Scholar] [CrossRef]
  12. Pukalskas, S.; Kriaučiūnas, D.; Rimkus, A.; Przybyła, G.; Droździel, P.; Barta, D. Effect of hydrogen addition on the energetic and ecologic parameters of an si engine fueled by biogas. Appl. Sci. 2021, 11, 742. [Google Scholar] [CrossRef]
  13. Makareviciene, V.; Sendzikiene, E.; Pukalskas, S.; Rimkus, A.; Vegneris, R. Performance and emission characteristics of biogas used in diesel engine operation. Energy Convers. Manag. 2013, 75, 224–233. [Google Scholar] [CrossRef]
  14. Karagöz, M.; Sarıdemir, S.; Deniz, E.; Çiftçi, B. The effect of the CO2 ratio in biogas on the vibration and performance of a spark ignited engine. Fuel 2018, 214, 634–639. [Google Scholar] [CrossRef]
  15. BP Energy Outlook 2035. 2015. Available online: https://www.bankofcanada.ca/wp-content/uploads/2015/05/bp-energy-outlook-2035.pdf (accessed on 3 May 2020).
  16. Kan, X.; Zhou, D.; Yang, W.; Zhai, X.; Wang, C.-H. An investigation on utilization of biogas and syngas produced from biomass waste in premixed spark ignition engine. Appl. Energy 2018, 212, 210–222. [Google Scholar] [CrossRef]
  17. Benato, A.; Macor, A.; Rossetti, A. Biogas engine emissions: Standards and on-site measurements. Energy Proc. 2017, 126, 398–405. [Google Scholar] [CrossRef]
  18. European Biogas Association EBA. Statistical Report. 2018. Available online: https://www.europeanbiogas.eu/eba-statistical-report-2018/ (accessed on 18 May 2020).
  19. EurObserv’ER. Biogas Barometer. 2017. Available online: https://www.eurobserv-er.org/biogas-barometer-2017/ (accessed on 1 May 2020).
  20. European Commission. Optimal Use of Biogas From Waste Streams. 2016. Available online: https://ec.europa.eu/energy/sites/ener/files/documents/ce_delft_3g84_biogas_beyond_2020_final_report.pdf (accessed on 1 May 2020).
  21. Capodaglio, A.G.; Callegari, A.; Lopez, M.V. European framework for the diffusion of biogas uses: Emerging technologies, acceptance, incentive strategies, and institutional-regulatory support. Sustainability 2016, 8, 298. [Google Scholar] [CrossRef] [Green Version]
  22. Rupf, G.V.; Bahri, P.A.; de Boer, K.; McHenry, M.P. Broadening the potential of biogas in Sub-Saharan Africa: An assessment of feasible technologies and feedstocks. Renew. Sustain. Energy Rev. 2016, 61, 556–571. [Google Scholar] [CrossRef]
  23. Valenti, F.; Porto, S.M.C.; Dale, B.E.; Liao, W. Spatial analysis of feedstock supply and logistics to establish regional biogas power generation: A case study in the region of Sicily. Renew. Sustain. Energy Rev. 2018, 97, 50–63. [Google Scholar] [CrossRef]
  24. Stürmer, B. Feedstock change at biogas plants—Impact on production costs. Biomass Bioenergy 2017, 98, 228–235. [Google Scholar] [CrossRef]
  25. Zabed, H.M.; Akter, S.; Yun, J.; Zhang, G.; Zhang, Y.; Qi, X. Biogas from microalgae: Technologies, challenges and opportunities. Renew. Sustain. Energy Rev. 2020, 117, 109503. [Google Scholar] [CrossRef]
  26. Dutta, K.; Daverey, A.; Lin, J.-G. Evolution retrospective for alternative fuels: First to fourth generation. Renew. Energy 2014, 69, 114–122. [Google Scholar] [CrossRef]
  27. Rattanapan, C.; Sinchai, L.; Tachapattaworakul Suksaroj, T.; Kantachote, D.; Ounsaneha, W. Biogas production by co-digestion of canteen food waste and domestic wastewater under organic loading rate and temperature optimization. Environments 2019, 6, 16. [Google Scholar] [CrossRef] [Green Version]
  28. Capa, A.; García, R.; Chen, D.; Rubiera, F.; Pevida, C.; Gil, M.V. On the effect of biogas composition on the H2 production by sorption enhanced steam reforming (SESR). Renew. Energy 2020, 160, 575–583. [Google Scholar] [CrossRef]
  29. Sendzikiene, E.; Rimkus, A.; Melaika, M.; Makareviciene, V.; Pukalskas, S. Impact of biomethane gas on energy and emission characteristics of a spark ignition engine fuelled with a stoichiometric mixture at various ignition advance angles. Fuel 2015, 162, 194–201. [Google Scholar] [CrossRef]
  30. Khatri, N.; Khatri, K.K. Hydrogen enrichment on diesel engine with biogas in dual fuel mode. Int. J. Hydrogen Energy 2020, 45, 7128–7140. [Google Scholar] [CrossRef]
  31. Simsek, S.; Uslu, S. Investigation of the impacts of gasoline, biogas and LPG fuels on engine performance and exhaust emissions in different throttle positions on SI engine. Fuel 2020, 279, 118528. [Google Scholar] [CrossRef]
  32. Heywood, J. Internal Combustion Engine Fundamentals, 2nd ed.; MC Graw Hill Education: New York, NY, USA, 2018; ISBN 9781260116113. [Google Scholar]
  33. Malenshek, M.; Olsen, D.B. Methane number testing of alternative gaseous fuels. Fuel 2009, 88, 650–656. [Google Scholar] [CrossRef]
  34. Melaika, M. Research of a Combustion Process in a Spark Ignition Engine, Fuelled with Gaseous Fuel Mixtures. Ph.D. Thesis, Vilnius Gediminas Technical University, Vilnius, Lithuania, 2016. [Google Scholar]
  35. Gómez Montoya, J.P.; Amell, A.A.; Olsen, D.B. Prediction and measurement of the critical compression ratio and methane number for blends of biogas with methane, propane and hydrogen. Fuel 2016, 186, 168–175. [Google Scholar] [CrossRef]
  36. Gómez Montoya, J.P.; Amador Diaz, G.J.; Amell Arrieta, A.A. Effect of equivalence ratio on knocking tendency in spark ignition engines fueled with fuel blends of biogas, natural gas, propane and hydrogen. Int. J. Hydrogen Energy 2018, 43, 23041–23049. [Google Scholar] [CrossRef]
  37. Zhang, Y.; Zhu, M.; Zhang, Z.; Zhang, D. Combustion and Emission characteristics of a spark ignition engine fuelled with biogas from two-phase anaerobic digestion (T-PAD). Energy Proc. 2017, 105, 137–142. [Google Scholar] [CrossRef]
  38. Subramanian, K.A.; Mathad, V.C.; Vijay, V.K.; Subbarao, P.M.V. Comparative evaluation of emission and fuel economy of an automotive spark ignition vehicle fuelled with methane enriched biogas and CNG using chassis dynamometer. Appl. Energy 2013, 105, 17–29. [Google Scholar] [CrossRef]
  39. Kim, Y.; Kawahara, N.; Tsuboi, K.; Tomita, E. Combustion characteristics and NOX emissions of biogas fuels with various CO2 contents in a micro co-generation spark-ignition engine. Appl. Energy 2016, 182, 539–547. [Google Scholar] [CrossRef]
  40. Kruczek, G.; Przybyła, G.; Ziółkowski, Ł.; Adamczyk, W.P. Comparative assessment of the application of methane and biogas in energy production: An experimental and numerical investigation. Renew. Energy 2019, 143, 1519–1530. [Google Scholar] [CrossRef]
  41. Schiaroli, N.; Lucarelli, C.; Sanghez de Luna, G.; Fornasari, G.; Vaccari, A. Ni-based catalysts to produce synthesis gas by combined reforming of clean biogas. Appl. Catal. A Gen. 2019, 582, 117087. [Google Scholar] [CrossRef]
  42. Lee, S.; Yi, U.H.; Jang, H.; Park, C.; Kim, C. Evaluation of emission characteristics of a stoichiometric natural gas engine fueled with compressed natural gas and biomethane. Energy 2021, 220, 119766. [Google Scholar] [CrossRef]
  43. Valipour Berenjestanaki, A.; Kawahara, N.; Tsuboi, K.; Tomita, E. Performance, Emissions and end-gas autoignition characteristics of PREMIER combustion in a pilot fuel-ignited dual-fuel biogas engine with various CO2 ratios. Fuel 2021, 286, 119330. [Google Scholar] [CrossRef]
  44. Abdallah, M.S.; Mansour, M.S.; Allam, N.K. Mapping the stability of free-jet biogas flames under partially premixed combustion. Energy 2021, 220, 119749. [Google Scholar] [CrossRef]
  45. Bouguessa, R.; Tarabet, L.; Loubar, K.; Belmrabet, T.; Tazerout, M. Experimental investigation on biogas enrichment with hydrogen for improving the combustion in diesel engine operating under dual fuel mode. Int. J. Hydrogen Energy 2020, 45, 9052–9063. [Google Scholar] [CrossRef]
  46. Gong, C.; Si, X.; Liu, F. Combustion and emissions behaviors of a stoichiometric GDI engine with simulated EGR (CO2) at low load and different spark timings. Fuel 2021, 295, 120614. [Google Scholar] [CrossRef]
  47. Khoa, N.X.; Lim, O. The effects of combustion duration on residual gas, effective release energy, engine power and engine emissions characteristics of the motorcycle engine. Appl. Energy 2019, 248, 54–63. [Google Scholar] [CrossRef]
  48. Hotta, S.K.; Sahoo, N.; Mohanty, K. Comparative assessment of a spark ignition engine fueled with gasoline and raw biogas. Renew. Energy 2019, 134, 1307–1319. [Google Scholar] [CrossRef]
  49. Talibi, M.; Hellier, P.; Ladommatos, N. Combustion and exhaust emission characteristics, and in-cylinder gas composition, of hydrogen enriched biogas mixtures in a diesel engine. Energy 2017, 124, 397–412. [Google Scholar] [CrossRef]
  50. Li, J.; Huang, H.; Huhetaoli; Osaka, Y.; Bai, Y.; Kobayashi, N.; Chen, Y. Combustion and heat release characteristics of biogas under hydrogen- and oxygen-enriched condition. Energies 2017, 10, 1200. [Google Scholar] [CrossRef] [Green Version]
  51. European Biogas Association. Avoided Emissions from Biogas and Biomethane Can Lead to a Negative Carbon Footprint. Available online: https://www.europeanbiogas.eu/avoided-emissions-from-biogas-and-biomethane-can-lead-to-a-negative-carbon-footprint/ (accessed on 8 April 2021).
  52. Xie, F.-X.; Li, X.-P.; Wang, X.-C.; Su, Y.; Hong, W. Research on using EGR and Ignition timing to control load of a spark-ignition engine fueled with methanol. Appl. Therm. Eng. 2013, 50, 1084–1091. [Google Scholar] [CrossRef]
  53. Porpatham, E.; Ramesh, A.; Nagalingam, B. Effect of spark timing on the performance of a spark ignition engine running on biogas–hydrogen blends. Biofuels 2017, 8, 635–642. [Google Scholar] [CrossRef]
  54. Rimkus, A.; Stravinskas, S.; Matijošius, J. Comparative study on the energetic and ecologic parameters of dual fuels (diesel–NG and HVO–biogas) and conventional diesel fuel in a CI engine. Appl. Sci. 2020, 10, 359. [Google Scholar] [CrossRef] [Green Version]
  55. Slefarski, R. Study on the combustion process of premixed methane flames with CO2 dilution at elevated pressures. Energies 2019, 12, 348. [Google Scholar] [CrossRef] [Green Version]
Figure 1. Number of biogas plants in top 15 countries of Europe, arranged in descending order.
Applsci 11 06379 g001
Figure 2. Experiment setup. 1—HR16DE SI engine; 2—connecting shaft; 3—engine load stand; 4—load stand ECU and display; 5—crankshaft position sensor; 6—spark plug with pressure sensor; 7—in-cylinder pressure recording equipment; 8—exhaust gas temperature sensor; 9—exhaust gas temperature display; 10—wideband oxygen sensor; 11—reprogrammable engine ECU; 12—exhaust gas analyzer; 13—air mass flow meter; 14—throttle control servo motor; 15—CH4 injector; 16—low pressure regulator; 17—high pressure regulator; 18—fuel mass flow meter for CH4; 19—fuel mass flow meter display; 20—CH4 cylinder; 21—high pressure regulator; 22—fuel mass flow meter for CO2; 23—fuel mass flow meter display; 24—CO2 cylinder.
Applsci 11 06379 g002
Figure 3. Change of the brake-specific energy consumption and brake thermal efficiency depending on the volumetric fraction of CO2.
Applsci 11 06379 g003
Figure 4. Energy distribution. A—with optimal ST; B—with constant ST.
Applsci 11 06379 g004
Figure 5. Energy distribution. A—with optimal ST; B—with constant ST.
Applsci 11 06379 g005
Figure 6. Change of the exhaust gas temperature and NOx concentration in exhaust gas depending on the volumetric fraction of CO2.
Applsci 11 06379 g006
Figure 7. Change of the carbon monoxide and HC concentration in exhaust gas depending on the volumetric fraction of CO2.
Applsci 11 06379 g007
Figure 8. Change of the in-cylinder pressure depending on the volumetric fraction of CO2. (A) Constant ST, (B) Optimal ST.
Applsci 11 06379 g008
Figure 9. Change of the in-cylinder temperature rise depending on the volumetric fraction of CO2. (A) Constant ST, (B) Optimal ST.
Applsci 11 06379 g009
Figure 10. Change of the in-cylinder pressure rise depending on the volumetric fraction of CO2. (A) Constant ST, (B) Optimal ST.
Applsci 11 06379 g010
Table 1. Biogas properties at different compositions.
PropertyBG41BG34BG13
Composition (vol%)CH4–57%
CO2–41%
CO–0.18%
H2–0.18%
CH4–65%
CO2–34%
CO–traces
H2–traces
CH4–87%
CO2–13%
CO–traces
H2–traces
Lower heating value (LHV) at 1 atm and 15 °C (MJ/kg)17.021.735.5
Density at 1 atm and 15 °C (kg/m3)1.201.150.68
Stoichiometric A/F (kg of air/kg of fuel)5.89.512.2
Leaner flammability limits (vol% in air)7.57.57.5
Richer flammability limits (vol% in air)141414
Methane number142135110
Autoignition temperature (°C)650650650
Carbon/total mass ratio0.430.470.61
Oxygen/total mass ratio0.480.430.21
Table 2. In-cylinder pressure measuring equipment.
PropertyPressure Sensor ZI31_Y7SPropertySignal Amplifier DiTEST DPM 800
Measuring range0–200 barInput range6000 pC
Sensitivity12 pC/barSignal output1 mV/pC
Capacitance5 pFZero offset0.5 V
Acceleration sensitivity0.001 bar/gSignal amplitude0.5–4.5 V
Temperature range40–350 °CTemperature range−10–120 °C
Linearity±0.5%Power supply8 V–32 V
Natural frequency130 kHzDimensionsl = 131 mm, d = 13.8 mm
Table 3. AVL DICOM 4000 measurement range and accuracy.
ParameterMeasurement PrincipleMeasuring RangeResolution
CONon dispersive infrared0–10%, by vol.0.01%
CO2Non dispersive infrared0–20%, by vol.0.1%
HCNon dispersive infrared0–20,000 ppm, by vol.1 ppm
NOxElectrochemical0–5000 ppm, by vol.1 ppm
O2Electrochemical0–25%, by vol.0.01%
λCalculation0–9.9990.001
Table 4. Biogas properties and ST cases.
MarkingCO2, vol%CH4, vol%LHV, MJ/kgMethane NumberStoichiometric A/F RatioST, CAD BTDC 1
ConstantOptimal
BG0010050.010017.22626
BG20208029.711810.22630
BG40406017.71406.12635
BG50505013.41514.62640
1 CAD BTDC—crank angle degrees (CAD) before top dead center (BTDC).
Table 5. Combustion parameters.
MarkingST, CAD BTDCSOC 1, CAD BTDC10% MBF 2,
CAD BTDC
50% MBF,
CAD ATDC 3
90% MBF,
CAD ATDC
BG02622.54.17.022.9
BG203023.85.56.024.0
2620.11.810.425.5
BG403527.85.67.328.0
2619.3−1.215.940.3
BG504027.03.99.728.2
2617.8−4.721.242.2
1 SOC—start of combustion, 2 MBF—mass burned fraction, 3 CAD ATDC—crank angle degrees (CAD) after top dead center (BTDC).
Publisher’s Note: MDPI stays neutral with regard to jurisdictional claims in published maps and institutional affiliations.