1. Introduction
Students may vary their enrollment status each semester throughout their academic career, including part-time, full-time, or halting enrollment [
1,
2,
3,
4,
5]. A survey conducted at 253 academic institutions in 2017 showed that more than 53% of students switch their enrollment status at least once during their education; only 29% committed to a full-time status every semester, and only 18% maintained a part-time enrollment over their entire academic career [
6].
Academic institutions consider part-time enrollment status as a risk factor to students’ success. Feldman et al. [
7] show that, on average, full-time college students have higher retention rates and GPAs at the end of their first academic year compared to their part-time counterparts. In another study, Pelkey et al. [
8] analyzed how academic and demographic features such as age, race, enrollment status, GPA, and financial aid impact students’ persistence. Their results suggest that GPA and enrollment status incur the highest impact on college persistence. In [
9], Darolia argues that course-load is another critical factor affecting students persistence. Her study shows that students who register for more credits during their first semester are more likely to complete all required credits for their program, and ultimately their degree.
Despite the evident importance of enrollment status to student success, no clear definition outside the semester-based academic designation exists for what it means to be a part-time or full-time student. Such a binary designation appears to be overly simplistic as most students switch between full-time and part-time enrollment statuses during their academic career; as such, we believe there is value in understanding more complex enrollment patterns and their relationship to student outcomes. This assertion is supported by a nation-wide study in 2015 indicating that student success can be achieved through mixed enrollment strategies [
10]—the authors report that among non-first-time-in-college students that attend college, those who utilize a combination of full-time and part-time enrollment are more likely to complete degrees when compared to full-time students.
In this study, we build an advanced machine learning model to offer a more comprehensive methodology for identifying and grouping students based on their enrollment strategy. Unlike the commonly used single-period model in which a student’s enrollment strategy is equivalent to the observed semester enrollment status (i.e., part-time or full-time), we apply a multi-period dynamic approach using a Hidden Markov Model (HMM). Leveraging the proposed HMM model, a major contribution of this paper is a richer understanding of student enrollment patterns. Our model extends traditional categorizations by including the mixed enrollment strategy. Traditional models classify a student as mixed if the student has both full-time and part-time enrollment in their academic record. Our proposed model identifies the mixed enrollment category based not only on how many of a student’s semesters were full- or part-time but also on the order in which they appeared. In other words, students who use a mixed enrollment strategy regularly intersperse full-time and part-time semesters. After categorizing students into one of three groups (full-time, part-time, or mixed enrollment strategy), we examine the academic outcomes (GPA, DFW, and graduation rates) associated with each strategy. Accordingly, our second research contribution is reporting the correlation between academic engagement (via enrollment strategies) and different measures of academic success.
The remainder of the paper is organized as follows: In
Section 2, the research questions and corresponding contributions are explained.
Section 3 reviews the existing body of research on factors that impact students’ academic performance.
Section 4 explains the applied methodology for clustering students based on their enrollment strategy. A brief description of the data used in this paper is provided in
Section 5. In
Section 6, more detailed analysis is provided over the estimated model parameters, and
Section 7 and
Section 8 cover the demographic and academic performance analysis, respectively, for students with different enrollment strategies. In
Section 9, the results from previous sections are validated, and the paper is concluded in
Section 10.
2. Problem Statement
We consider the problem of classifying students according to a higher-order enrollment strategy as opposed to their enrollment status during any given semester. For many students the distinction between enrollment strategy and actual semester enrollment is minor. Undergraduate students are considered full-time in a given semester at the University of Central Florida (Orlando, FL, USA) if they enroll in more than 12 credits in that semester. Approximately 35% of the student body at the University of Central Florida consistently enroll full-time throughout their academic career, implying they employ a strategy of enrolling full-time. In contrast, the case for so-called part-time students it is not as clear. In any given semester, about 30% of enrollments are part-time, yet only 7% of students consistently enroll part-time over their academic careers. Enrolling part-time in a single semester over an academic career is not equivalent to the strategy of consistently enrolling part-time. It follows that a student who enrolls in a single semester part-time may not share similarities with other students who consistently enroll part-time.
This paper aims to recognize and report the distinction between a student’s semester-by-semester enrollment status and enrollment strategy, and to establish a more meaningful way to classify students’ enrollments over their academic careers. In other words, this paper develops an advanced machine learning model that uses a sequence of enrollment statuses, and returns a sequence of estimated strategies applied over the same time-frame. In recognition that students use a greater diversity of strategies than just a full-time enrollment strategy (FES) or part-time enrollment strategy (PES), we introduce the notion of a mixed enrollment strategy (MES). For a mixed enrollment strategy, students may occasionally alternate between part-time and full-time enrollment.
Table 1 provides examples of the enrollment status of four different students over their academic careers along with the corresponding enrollment strategy. For instance, enrollment strategies for students 1 through 3 are FES, MES, and PES, respectively. Student 1 has registered as a full-time student for five semesters and just one semester as part-time. Based on the model proposed in this paper, this student is classified as an FES student. From the example, one part-time semester among many full-time semesters does not affect this student’s overall enrollment strategy. The traditional methods for classifying students based on their enrollment status cannot capture this distinction. Student 2 frequently alternates enrollment status between full-time and part-time enrollment semester by semester. Therefore, the corresponding enrollment strategy for this student is MES. Finally, student 4 applies two different enrollment strategies over their academic career.
3. Literature Review
In practice, not every college registration leads to degree completion and many students leave college before graduation with no degrees earned, potentially misapplying time and financial resources [
11,
12]. There are a variety of factors that can affect degree completion rate, part-time enrollment rate, time to graduation, and delayed college enrollment at universities [
13]. Such factors include students’ demographic characteristics, educational behavior patterns, and their academic engagement. This section reviews the existing body of research which investigate the effect of these factors on students’ academic performance. We divide the literature into three main categories: students’ socioeconomic backgrounds, students’ enrollment patterns, and students’ engagement.
First we provide a review of the studies that have investigated the impact of students’ socioeconomic backgrounds on their academic performance. Ref. [
14] claim that students who come from families with low-level income are more likely to leave college without degrees. This study also shows that offering additional financial aid to these students can significantly help them finish their program over the regular course of four years. Similarly, other studies indicate that students with low socioeconomic backgrounds are more likely to leave university or have a longer transition time from high school to university [
15,
16,
17,
18,
19]. Other demographic features noted to correlate with students’ performance include race [
20], age [
21], life course transition including work and marriage [
22], and gender [
23]. All these studies suggest that these factors engender inequalities among college students with regards to academic success [
20].
The second category of studies investigate the relationship between students’ enrollment patterns and academic success [
24,
25,
26]. Similarly, Ref. [
27] uses the concept of academic momentum perspective to examine the effect of students’ academic trajectories on degree completion. Their results indicate that the number of credits that students earn in their first semester creates a trajectory has a positive correlation with degree completion. Another study [
20], investigates the relationship between continuous and non-continuous enrollment on graduation rates. Analysis of data collected from the University of Minnesota-Twin Cities (Minneapolis, MN, USA) shows that students with stop-outs (non-continuous or interrupted enrollment) are more likely to leave school without a degree when compared to students who continuously enroll at the university. Ref. [
28] studied the relationship between students’ enrollment status (full-time and part-time) and discontinuous enrollment on students’ academic persistence and graduation rate. Similarly, their results indicate that there is a positive relationship between the number of full-time enrollment semesters and the graduation rate. They also suggest that continuous enrollment is a key factor in academic success at universities. In a similar study, Ref. [
29] show that college students who register for consecutive semesters with no interruption have a higher GPA and graduation rate compared to students who skip one or more semesters.
The third category of studies assess the impact of students’ academic engagement on academic success. Student engagement has gained significant attention among education researchers over the past decade. Many studies indicate that there is a strong relationship between student academic performance and student engagement. Ref. [
30] defines engagement as the amount of time students spend in collaboration with educational facilitates to enhance their knowledge and learning. The Community College Survey of Student Engagement (CCSSE) defines five student engagement benchmarks [
31]: active and collaborative learning, student effort, academic challenge, student-faculty interaction, and support for learners. Additional studies focus on investigating the relationship between students’ engagement and students’ outcomes [
24,
32,
33]. Research conducted using CCSSE data demonstrate that the greater the student engagement the better the academic performance, including average GPA, retention, graduation rate, and persistence. For example, ref. [
34] provides empirical evidence that shows student engagement of type active and collaborative learning has a significant impact on student graduation rate.
All these findings collectively demonstrate that a wide range of factors gives rise to differences among college students in their pathway toward academic success. A large number of these studies focus on the impact of students’ engagement and educational behavior patterns, however, virtually all classify students based on their enrollment status-full-time, part-time, and mix groups, ignoring the number of full-time and part-time semesters and the order in which they appeared during their academic career. In this study, we intend to fill this gap by modeling student enrollment over the course of an educational career through application of a Hidden Markov Model. We model students’ enrollment behavior by investigating the sequence of their enrollment status, which helps us to classify students into the three main categories: full-time enrollment strategy (FES), mix enrollment strategy (MES), and part-time enrollment strategy (PES). Since the student enrollment strategy is not directly observable, we take advantage of Hidden Markov Modeling tools to tackle the proposed framework’s inherent complexities.
More specifically, this study intends to answer the following research questions:
(1) Does there exist a more holistic approach for classifying students based on their enrollment strategies?
(2) If (and how) demographic features correlate to enrollment strategies?
(3) Does there exist a relationship between students’ enrollment strategies and their academic performance?
4. Methodology
In this study, we generate and apply a Hidden Markov Model (HMM) to identify students’ enrollment strategy and characterize the impact of enrollment strategy on student outcomes. The use of HMM is not new to educational data mining and modeling. Previously it has been used to investigate students’ sequential behaviors, decision-making, and performance [
35,
36,
37,
38,
39,
40]. As an example, ref. [
41] classified students engagement (in terms of checking their course progress) in a massive open online course using Hidden Markov models and then predicted students retention for each class. Results show that students who never or scarcely check their progress are more likely to drop the course than students who actively check their progress. Other papers have used HMMs to model sequential student behavior. Ref. [
37] modeled high school students’ actions and behaviors using HMMs. By estimating HMM parameters with the Baum–Welch algorithm for each student, the authors clustered the students based on the individual transition matrices to assess differences in behavior and achievement between clusters. This study aimed to investigate the relationship between students’ educational outcomes and learning tutorial modes. The results of this study identify a significant correlation between tutorial dialogue structure and student learning outcomes.
As depicted in
Figure 1, similar to ordinary Markov Models, an HMM represents the dynamics of a system as it moves between operating states or modes (e.g., Modes 1, 2, and 3 in the figure). When operating within a state or mode, the system generates state-related output
at each time-step. Unlike Markov Models, in the case of the standard HMM problem, the states are not always directly observable, and as such, they can only be inferred by observing a sequence of outputs. For the problem under consideration here, the hidden state corresponds to the enrollment strategy of a student (i.e., full-time enrollment strategy, mixed enrollment strategy, and part-time enrollment strategy), while the observations refer to the actualized enrollment in any given semester as reported in the student’s academic history.
To give a formal definition of Hidden Markov models, we begin with the following notations: represents the set of N possible states in the system; is a transition matrix, where each denotes the probability of transitioning from state i to j at any given time-step; represents a sequence of observations of length T, each drawn from the set of M possible observations ; and represents the initial distribution of the system. When a system is operating in a specific state , the output at time t is generated according to a unique probability distribution denoted as , the emission probability.
To generate an HMM to represent student enrollment strategies, we must learn the optimal model parameters that reproduce known observations. The process of learning is based on the Baum–Welch algorithm, an iterative process that requires calculating the likelihood of any sequence of observations given , and decoding relationships between observations and hidden variables. As the model is iteratively updated, the likelihood calculations and the decoding is updated.
5. Student Data Records
The study presented in this paper makes use of processed undergraduate student records collected by the University of Central Florida, a large public university in the southeast United States, between the years 2008 to 2017. The total data-set amounts to approximately 170,000 records. The data set contains a wide variety of information regarding individual students at UCF, including but not limited to: (1) demographic information, (2) admission information for students who have been admitted and enrolled, (3) degrees awarded (for bachelor level), (4) courses taken at UCF, and (5) FAFSA reported family income. Some of the self-reported demographic information along with the percentage of students who enroll as full-time and part-time, and admission type (FTIC and transfer) are provided in
Table 2,
Table 3,
Table 4 and
Table 5. Unique to UCF, the student body includes a significant population of transfer students and Hispanic students;accordingly, UCF was recently designated as a Hispanic serving institution by the US Department of Education.
Student record data is processed to extract each student’s observed academic load for the semester they enrolled. Synthetic examples are shown in
Table 1. For each student, their enrollment sequence is ordered from their first observed enrollment to their last observed enrollment. The data set includes partial, halted, and graduated enrollment sequences within the indicated ten years date-range. For the purposes of this study, we restrict the problem to enrollment during Fall and Spring semesters; as such, information regarding Summer enrollment is excluded when constructing the HMM. It is worth noting that the data-set includes both first-time-in-college students and transfer students.
6. Applying HMM to Student Data
In applying the HMM model to our problem, we begin by identifying the set of hidden states corresponding to three different enrollment strategies: full-time enrollment strategy (FES), part-time enrollment strategy (PES), and mixed enrollment strategy (MES). The probability of students changing their enrollment strategy from one semester to the next is represented using the probability transition matrix A. The probability of observing a particular enrollment status when a student uses a specific enrollment strategy is given by the emission matrix B. Finally, is the initial enrollment strategy distribution by which students start their education.
Beginning with an initial guess for
A,
B, and
, the Baum–Welch algorithm is applied to estimate the optimal model parameter set,
. Converging after 20 iterations, the following values for
A,
B, and
are numerically calculated. Additionally
, the steady-state distribution, is provided:
Between any two subsequent semesters at time-steps t and , the rows in the transition matrix A correspond to states FES, MES, and PES at semester t, while the columns correspond to states FES, MES, and PES at semester . Each element of A thereby describes the probability of switching from one enrollment strategy to another between semesters. Based on the estimated transition matrix A, most students maintain their enrollment strategy with high probability from one semester to the next. Reading the matrix’s diagonal, with 0.898 probability, a student employing a FES will continue employing a FES. Similarly, with probabilities 0.74 for PES and 0.873 for MES, students maintain their strategy. These findings indicate that most students persist in their enrollment strategy regardless of which strategy they deploy.
For emission matrix B, each row corresponds to the probability of full-time and part-time enrollment status in a semester for a given enrollment strategy. The results indicate that students employing FES register full-time with a probability of 0.974, or, part-time with a probability of 0.026. Students employing a PES register full-time with a probability of 0.061 and part-time at a probability of 0.939. Most interesting are students with MES, as the probability of their full-time or part-time enrollment is 0.611 and 0.389, respectively. The initial probabilities vector indicates that most undergraduate students start their academic career with a full-time enrollment strategy (with a probability of 0.718). The initial probabilities of using PES or MES are 0.169 and 0.113, respectively. Furthermore, the steady-state probabilities vector shows that 0.417 of students employ a full-time enrollment strategy at any given time. Moreover, the probability of using PES and MES is 0.239 and 0.344, respectively. Comparing vs. shows that most students have a full-time enrollment strategy initially, and also that the probability of MES and PES increases in later semesters.
7. Demographics Clustering Analysis
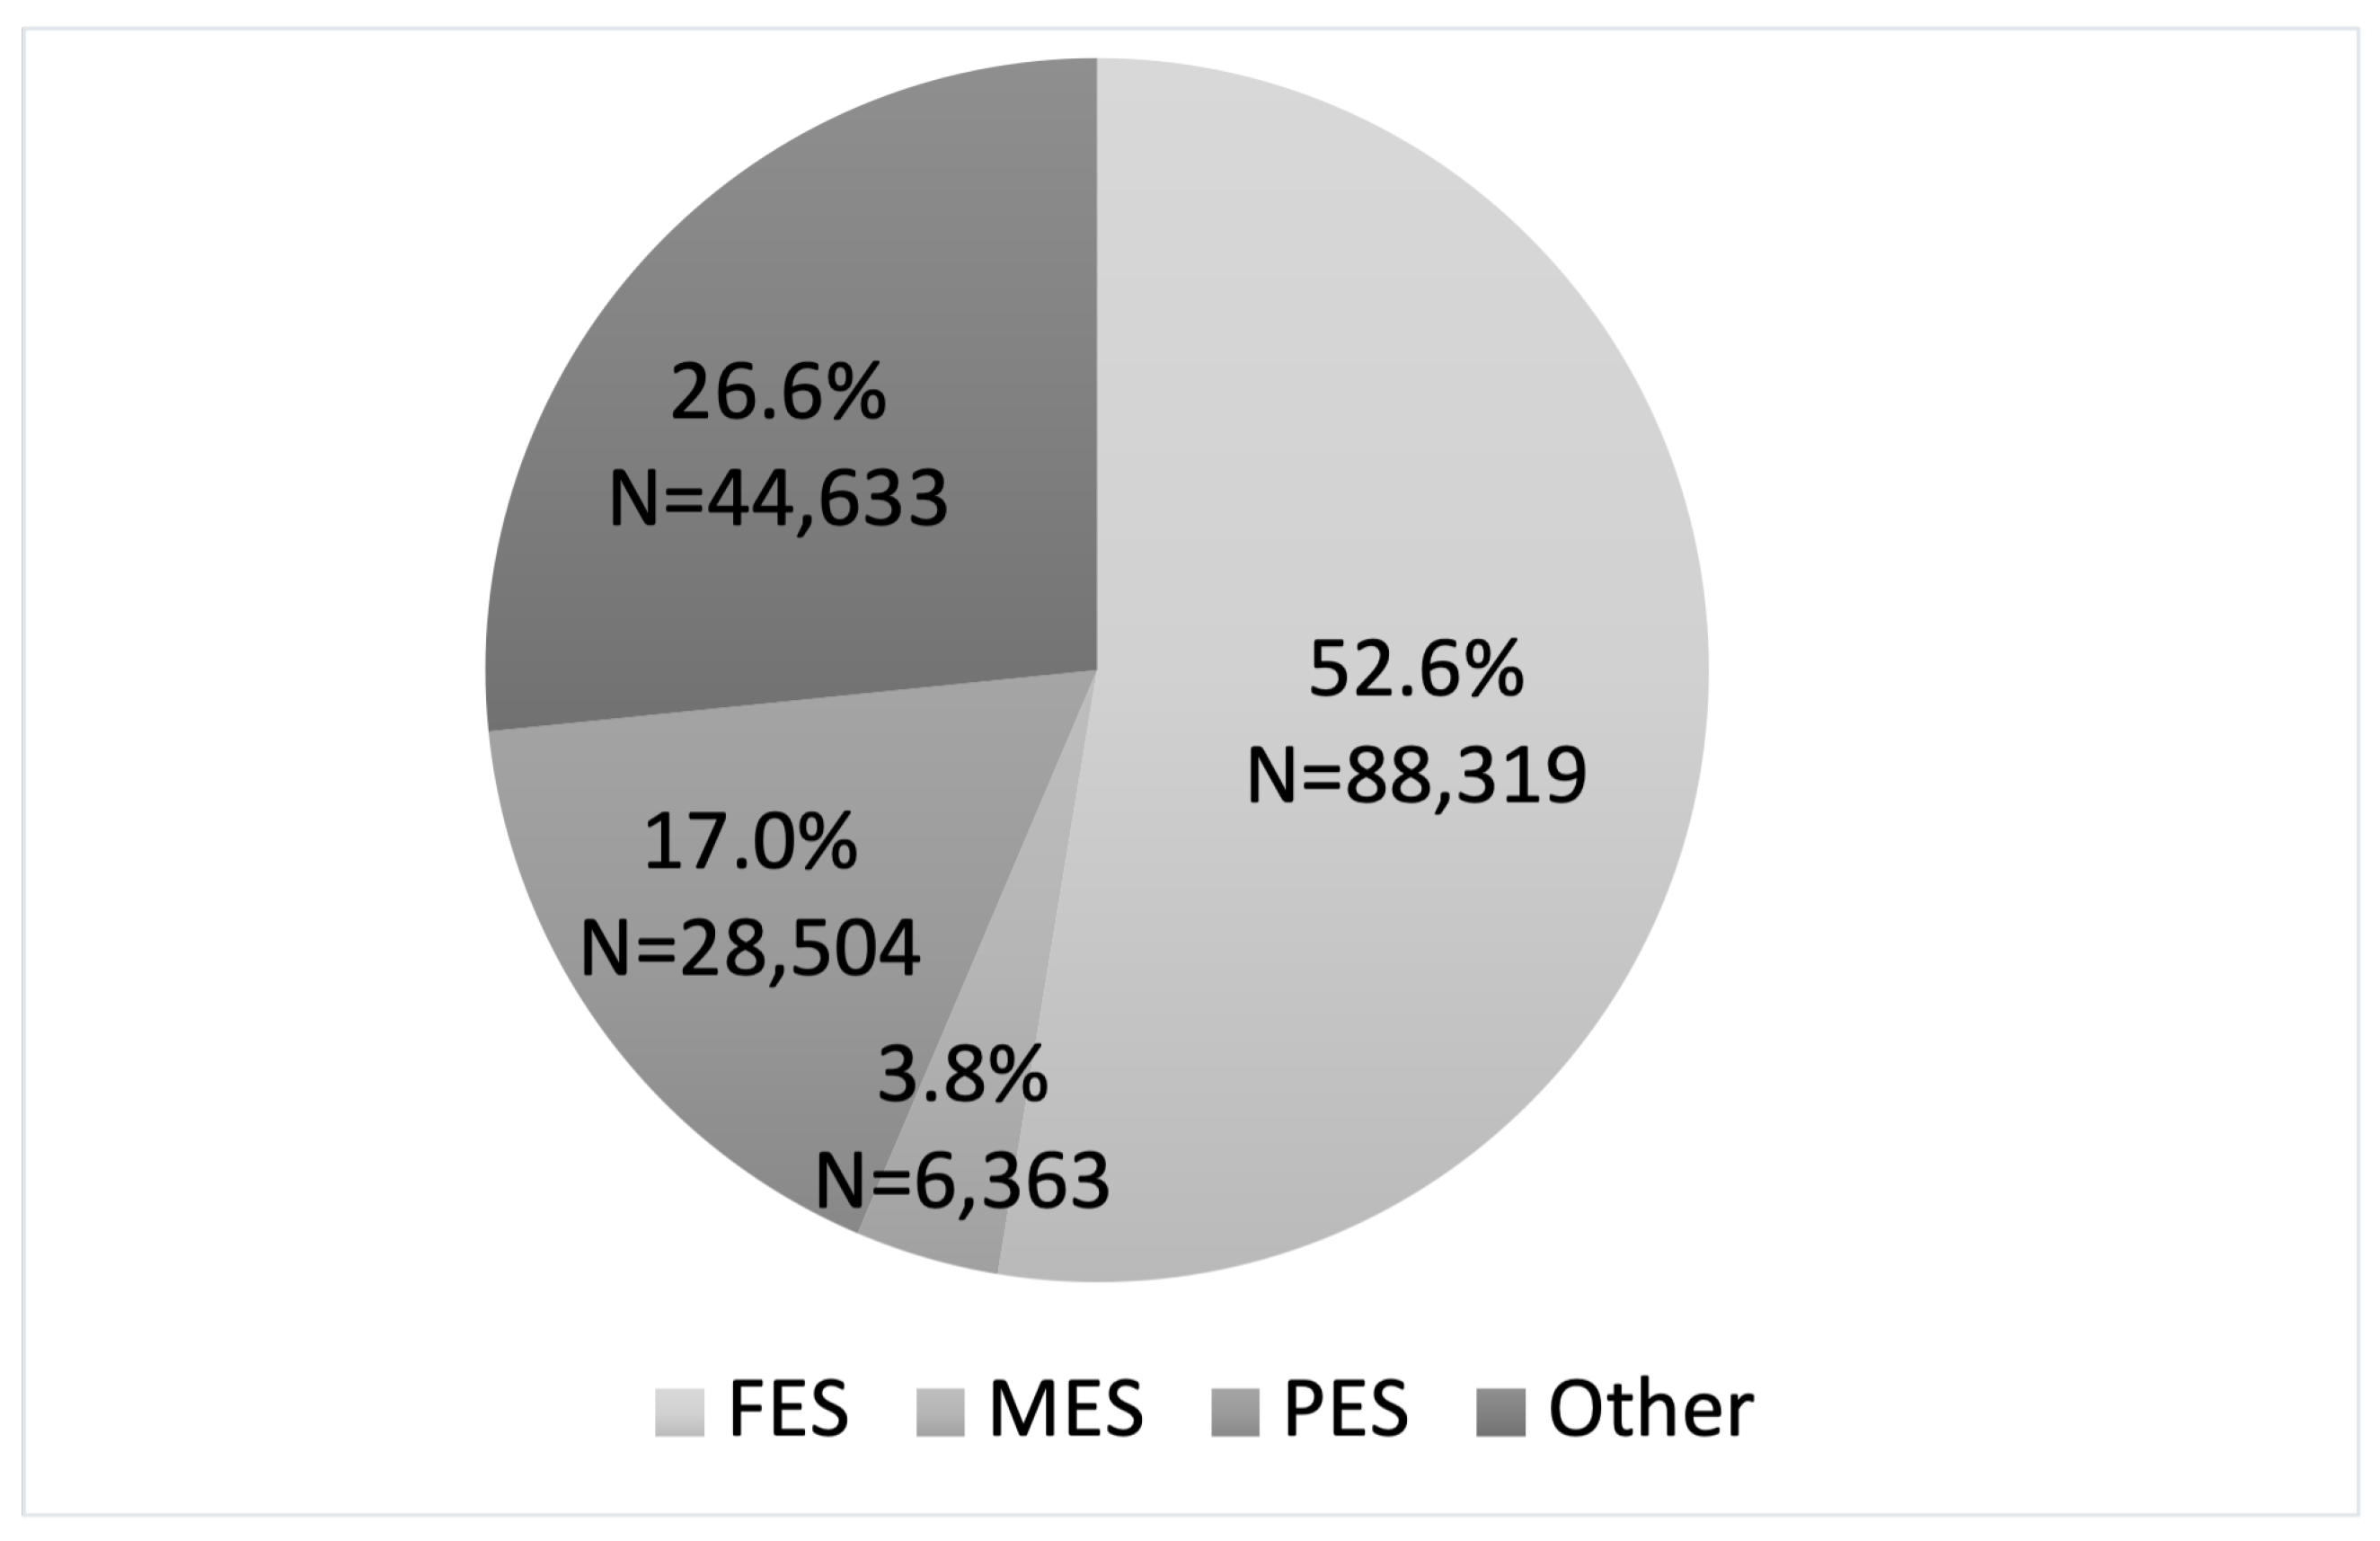
After estimating the model parameters, the next step is to identify and label the strategy (hidden state) for each student in the data set each semester. Based on the estimated hidden states, students are classified into four groups: three groups correspond to students who maintain a consistent strategy of FES, PES, or MES during their education, and a fourth group corresponds to students who employ a combination of FES, MES, and PES over their academic career.
Figure 2 shows the distribution of students among these four groups.
Based on results illustrated in
Figure 2, most students maintain their enrollment strategy during their educational career (the sum of FES, MES, and PES is approximately 73.4%). The most prevalent consistent enrollment strategy is FES, followed by PES and MES. For students who change strategy at some point during their academic career, 73% change from FES to PES, and 15% move from PES to MES. Furthermore,
Table 6 compares students’ enrollment distributions with statistics reported in [
6] at 253 academic institutions. Comparing results indicates that students at UCF are more likely to register consistently full-time and less likely to enroll part-time than the other universities (35% vs. 29% for full-time and 7% vs. 18% for part-time).
Table 7 provides the distribution of different enrollment strategies employed by male and female students. A Chi-square hypothesis test is conducted to see if students’ enrollment strategies vary by gender at UCF. The
p-value of the Chi-square test (
p-value <
) indicates that the aggregated enrollment strategy distribution for female students differs from male students. For example, female students are more likely to adopt a full-time enrollment strategy compared to male students. On the other hand, male students are more likely to apply a combination of enrollment strategies (as illustrated by ‘other’ in
Figure 2). Note however, the differences in distributions does not appear to be predictive or informative whereby one can predict gender based on enrollment strategy; in other words, the effect size is likely small.
Table 8 and
Table 9 show gender distribution over the enrollment strategy for FTIC and transfer students separately. Based on these tables, for both FTIC and transfer students, female students with higher probability have the full-time enrollment strategy compared to male students (
p-value <
for FTIC and
p-value <
for transfer). However, male FTIC and transfer students are more likely to have the ”other” enrollment strategy than female students (
p-value <
for FTIC and
p-value <
for transfer).
Table 10 describes how enrollment strategies are distributed across race/ethnicity. As the table indicates, students who identified as Black and students who identified as Hispanic applied FES at similar rates, while students who identified as white used FES at a higher rate than both groups. A hypothesis chi-square post hoc test was conducted to assess if different ethnicity groups use strategies with different distributions. The
p-values of all the tests between possible pairs of race/ethnicity groups are less than
, implying that students with different races/ethnicity have different distributions over the enrollment strategies.
Table 11 and
Table 12 summarized this information for FTIC and transfer students, respectively. For both FTIC and transfer students, the enrollment strategy differs between different race/ethnicity. For example, for transfer students, students who self-identify as white are more likely to employ FES (43%) than self-identifying hispanic students (38.9%).
Key Finding 1: Both FTIC and Transfer Students: Enrollment strategies vary among different demographic groups.
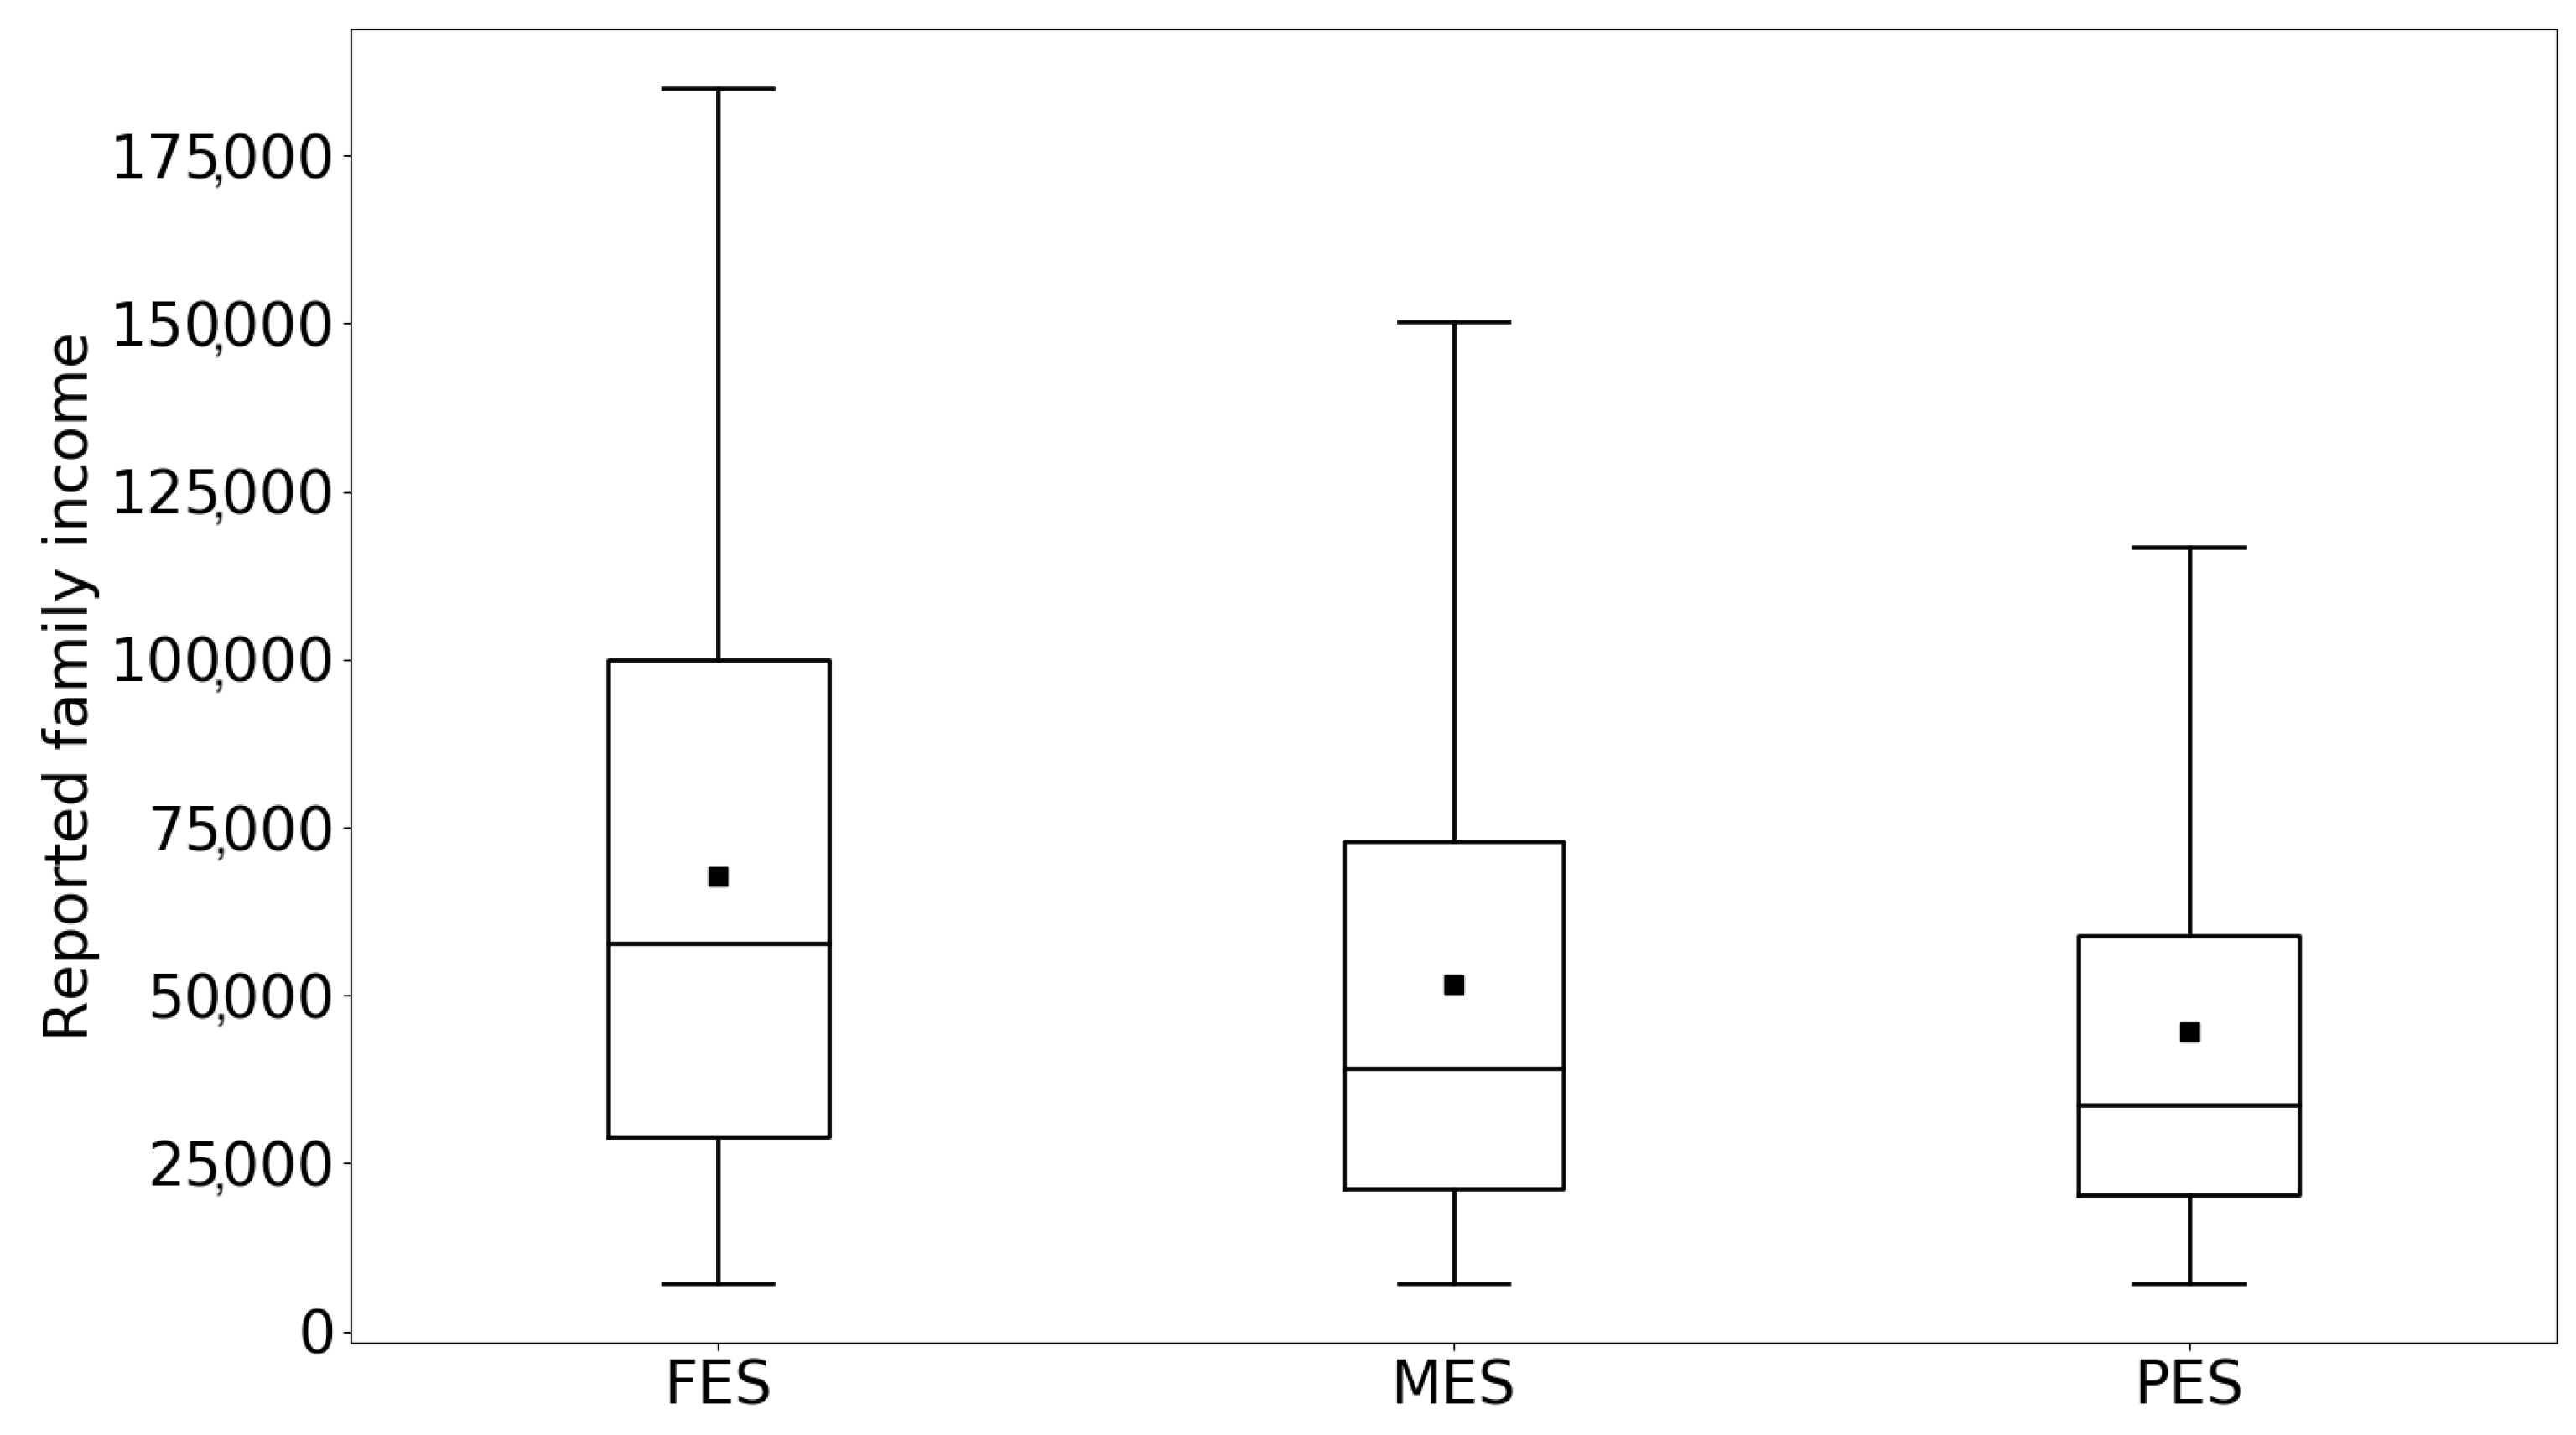
The relationship between family financial status and student enrollment strategy in each group is compared in
Figure 3. Based on the figure, students employing a part-time enrollment strategy reported lower family incomes compared to student using MES or FES. The Kruskal–Wallis H test was applied to assess if there is a statistically significant difference in family income distribution for students with different enrollment strategies. The
p-values associated with the hypothesis test results are zero the sample size for FES, MES, and PES is 59,400, 4170, and 16,371, respectively), indicating a significant difference in annual family income distribution between students with different enrollment strategies.
Key Finding 2: Financial support: PES students are more likely to come from families with lower income levels as compared to FES and MES students; aligned with prior research [
42,
43,
44], we believe family and individual socioeconomic status is a driving factor.
8. Academic Performance Clustering Analysis
Following students’ clustering based on enrollment strategy (FES, PES, MES), several descriptive statistics were calculated. They included average cumulative GPA, graduation rate, and DFW rate.
8.1. GPA Analysis
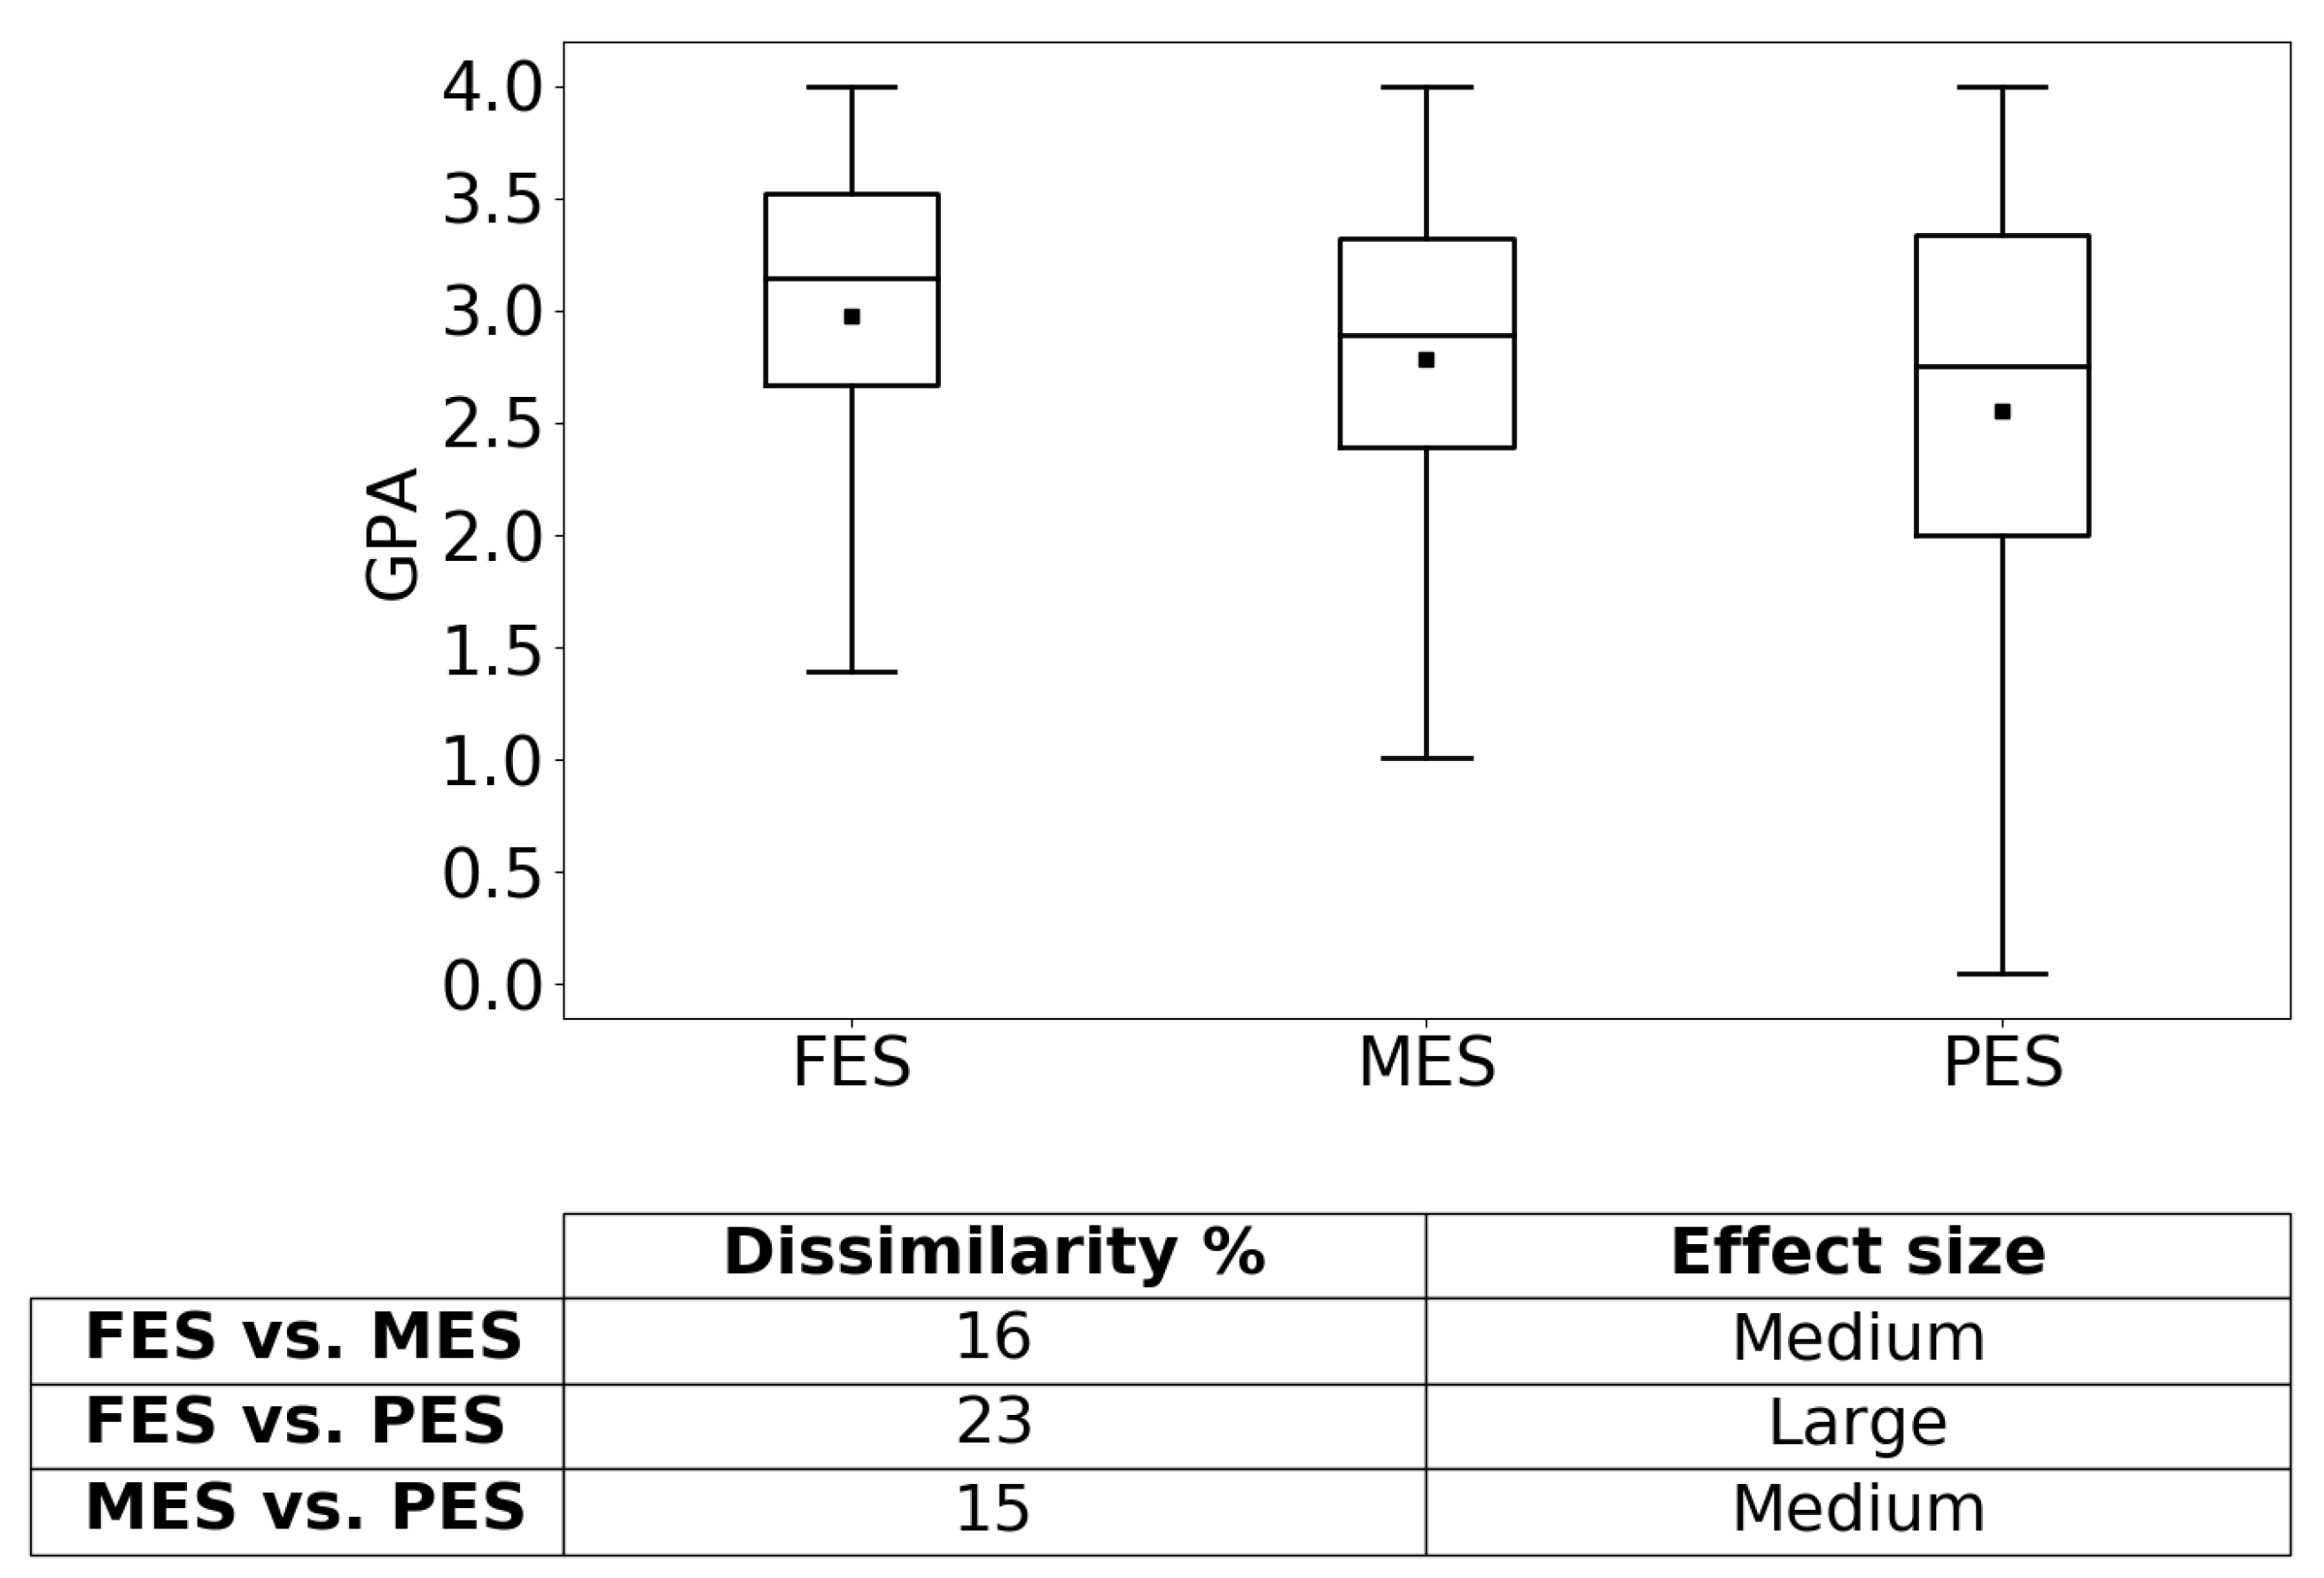
The average GPA for each strategy cluster is shown in
Figure 4. To compute the average GPA, we first calculate the average cumulative GPA for each student over their semesters, and then for each enrollment strategy group, we take the average over students’ cumulative GPA in that group. Results show that the FES group has the highest average GPA (2.97). The lowest GPA corresponds to the PES group (2.55), while the MES group’s GPA (2.78) lies between PES and FES. Statistical hypothesis Games–Howell post hoc multiple comparison tests were conducted to assess if the average GPA for each group is statistically different from the average GPA of other groups. We use the Games–Howell test because it is non-parametric and does not assume homogeneity of variances (which is the underlying assumption for the ANOVA test). The test statistic
p-values for all the hypothesis tests are 0, indicating that each group’s average GPA is statistically different from the others (the sample size for FES, MES, and PES is 88,319, 6,363, and 28,504, respectively). The table in
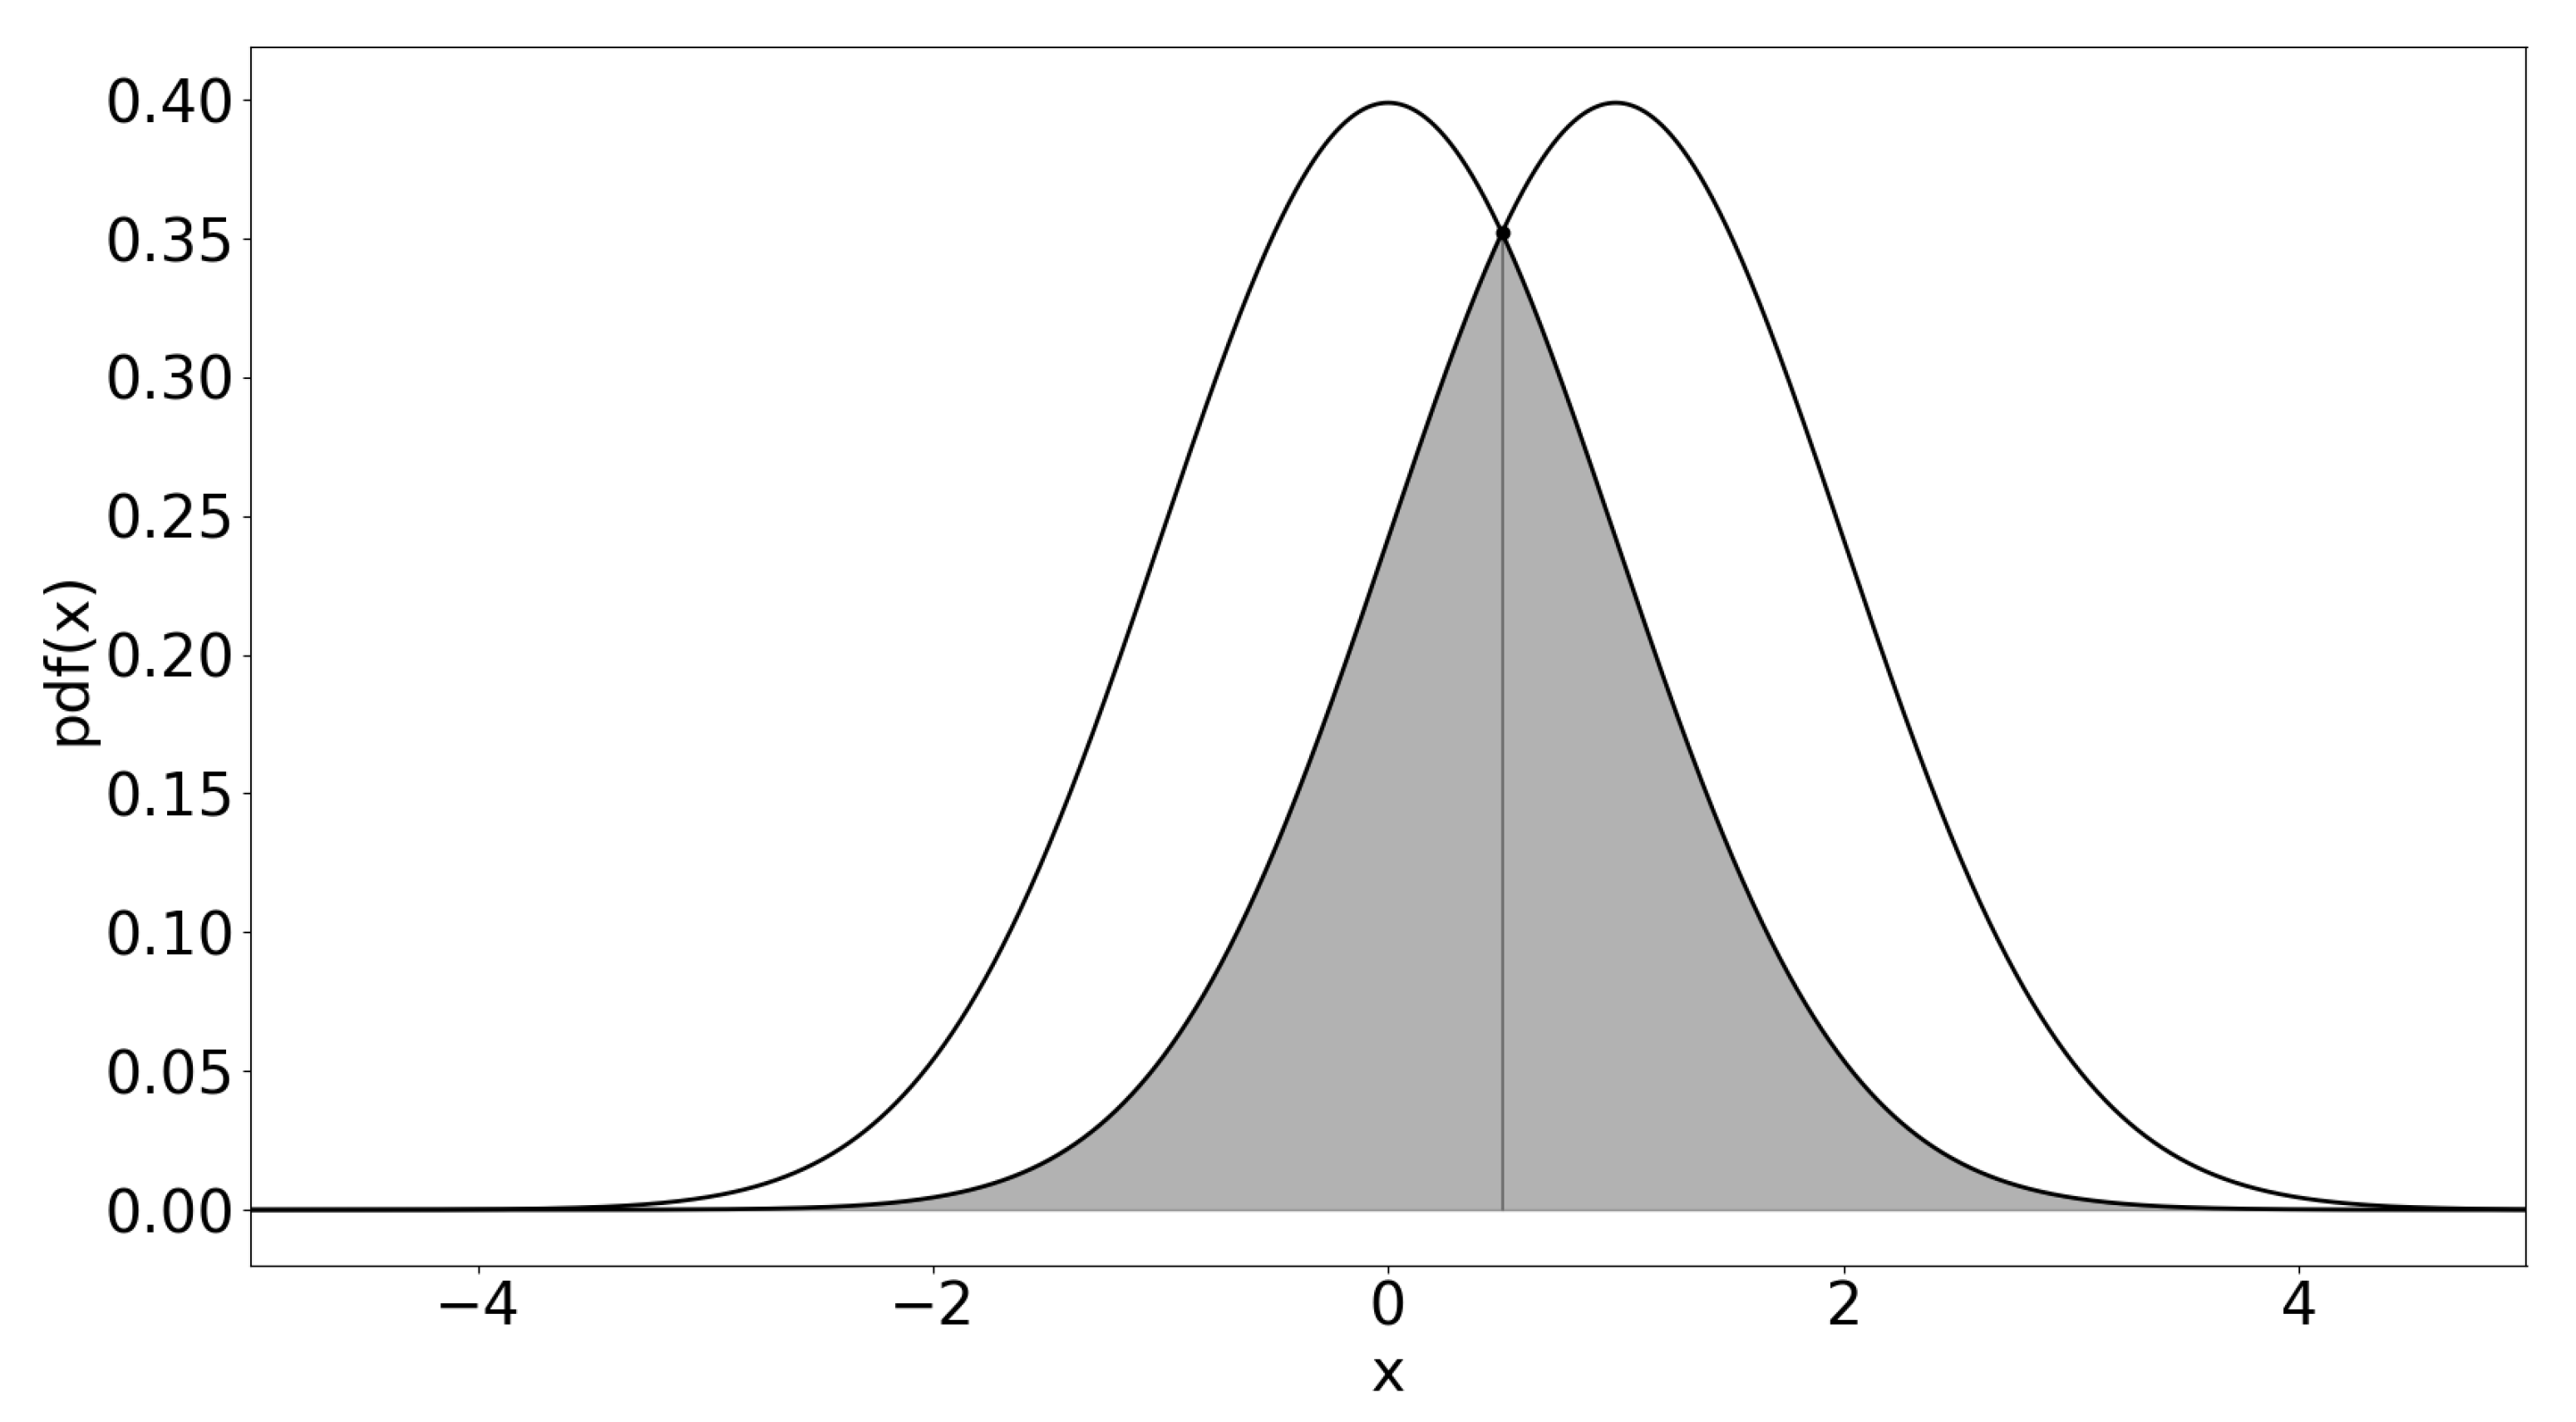
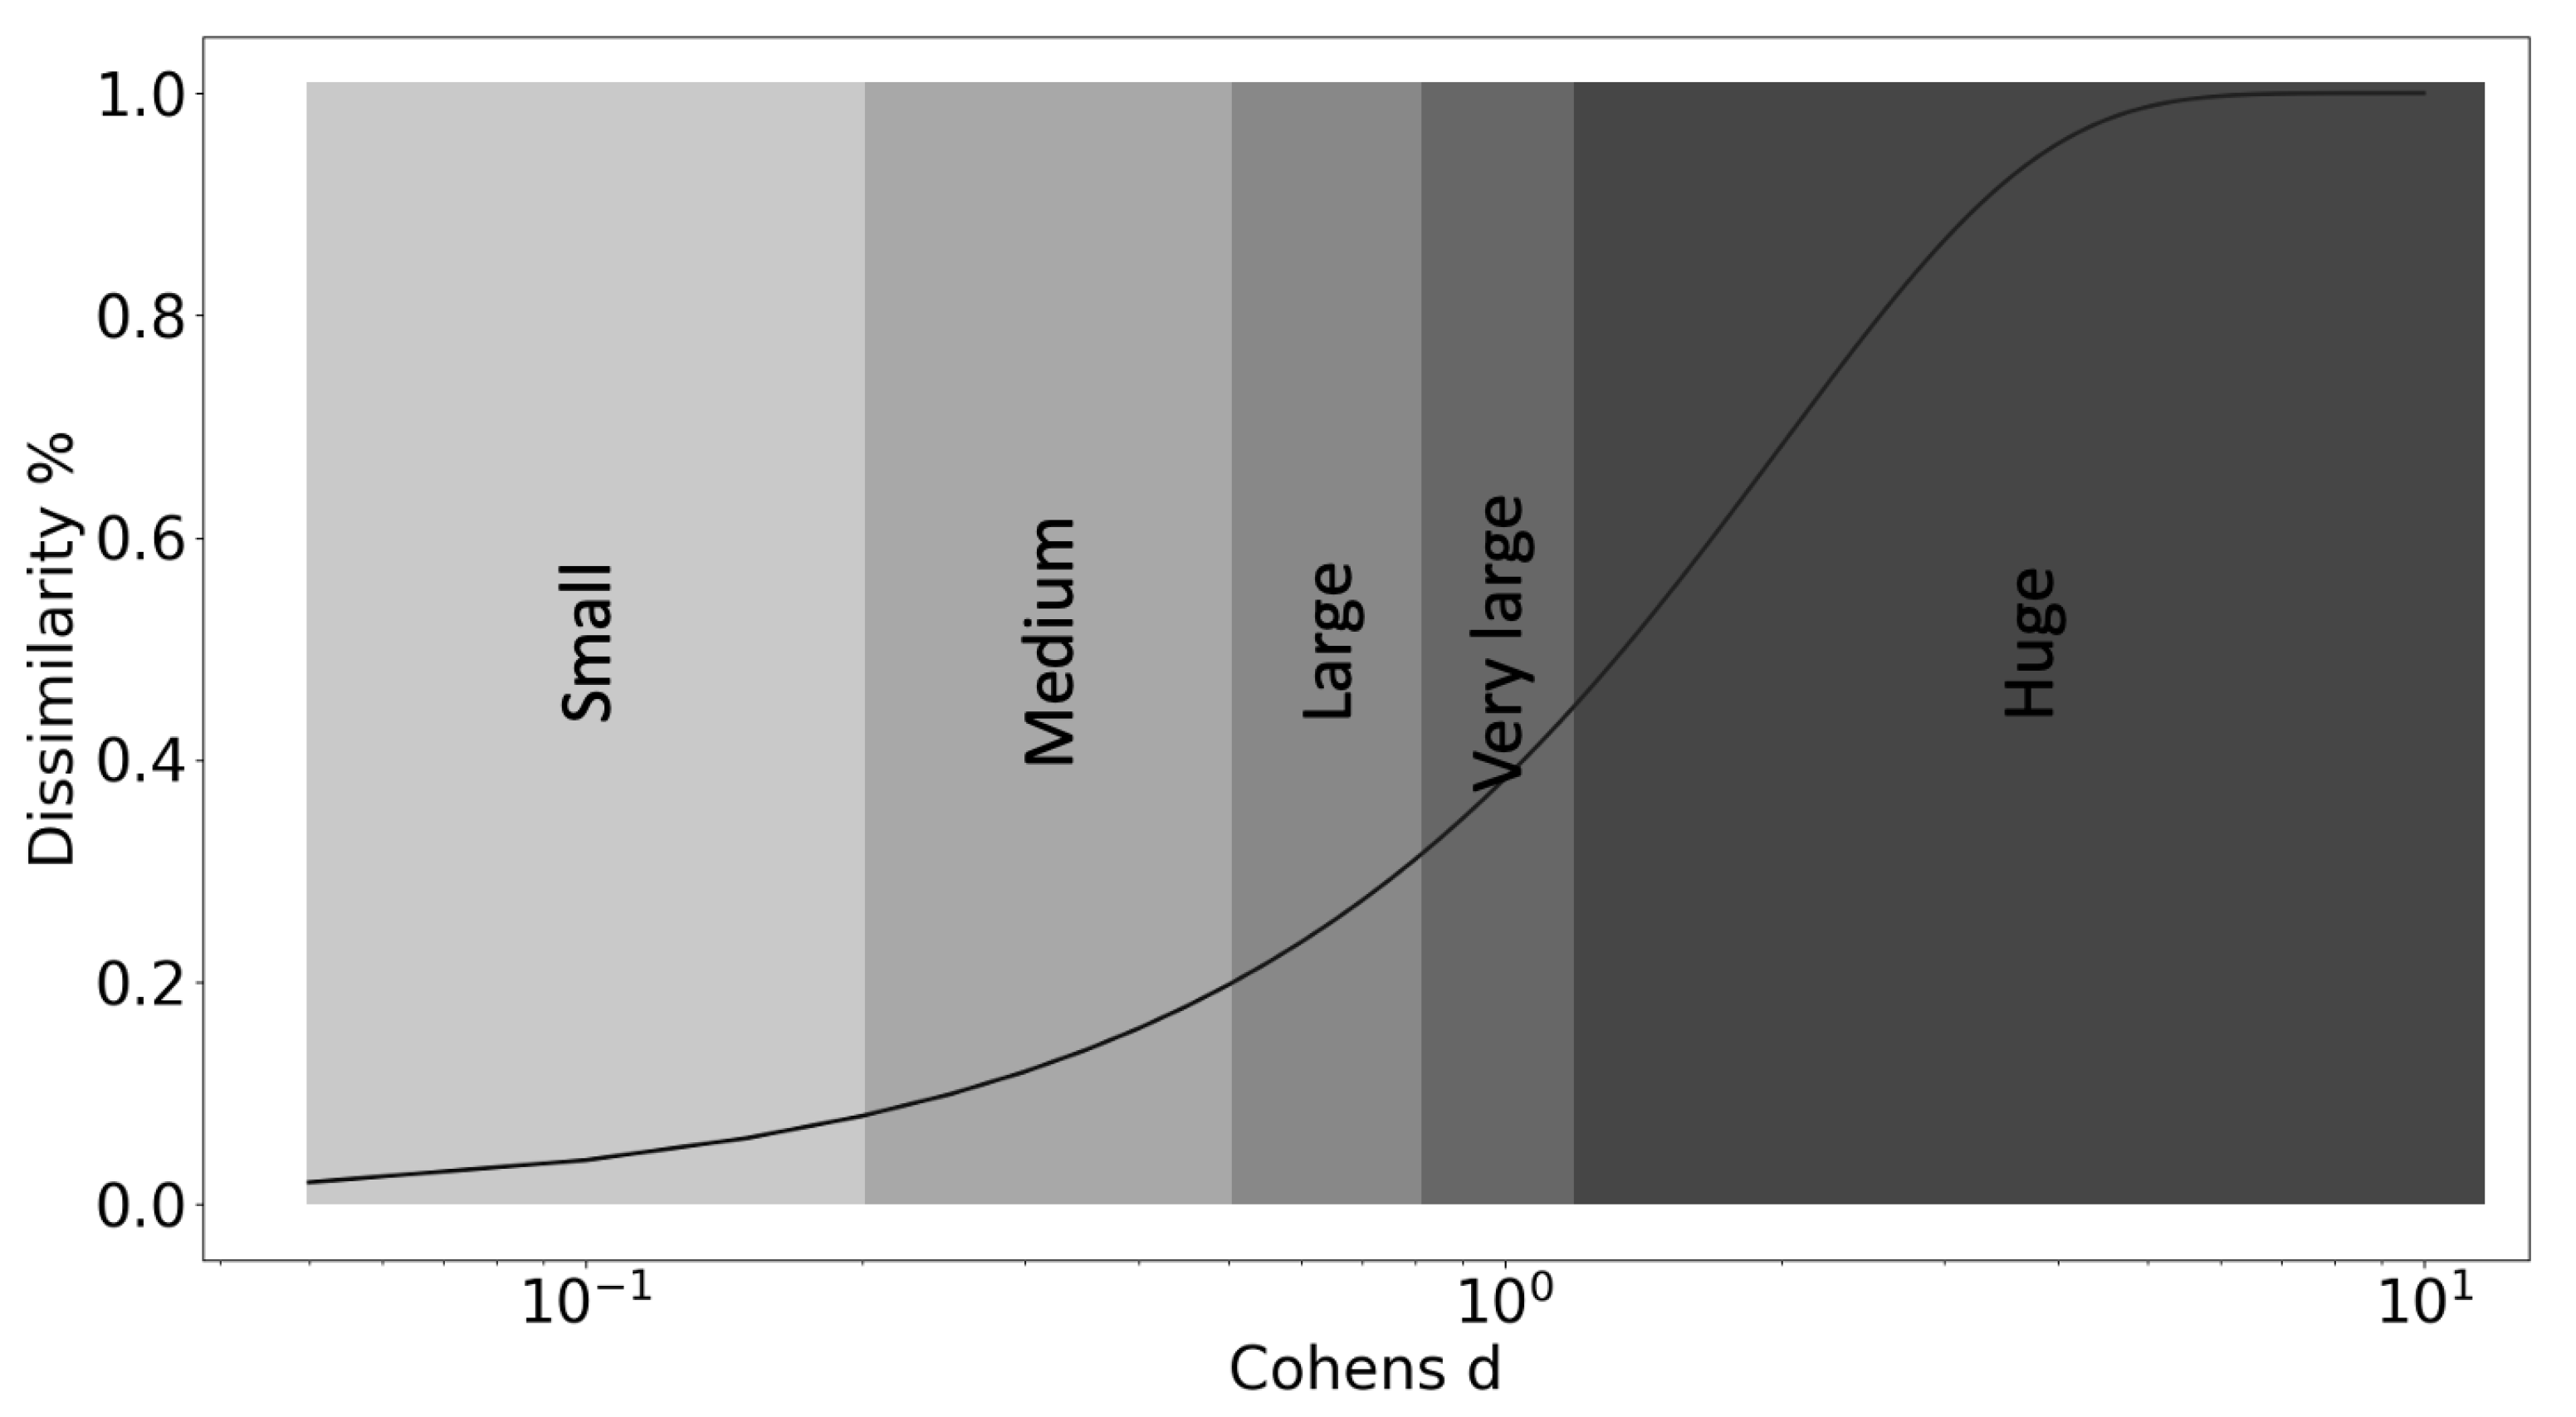
Figure 4 provides an effect size categorization and dissimilarity% metric, that is the percentage by which the distribution of each group differs from each other. The relationship between dissimilarity% and the commonly used Cohen’s d metric for normal distributions is explained in
Appendix A. Based on the table, the difference in GPA between FES and PES groups is more significant than the other pairs. Furthermore, the box and whiskers in
Figure 4 indicate that student clusters that employ FES and MES have more consistent performance than the PES student cluster. These findings suggest that increased student engagement through full-time enrollment with the university is associated with higher academic performance. Therefore university policymakers may help students improve their academic performance by providing the necessary support and opportunities (e.g., financial aid, on-campus work) to students to better facilitate full-time enrollment.
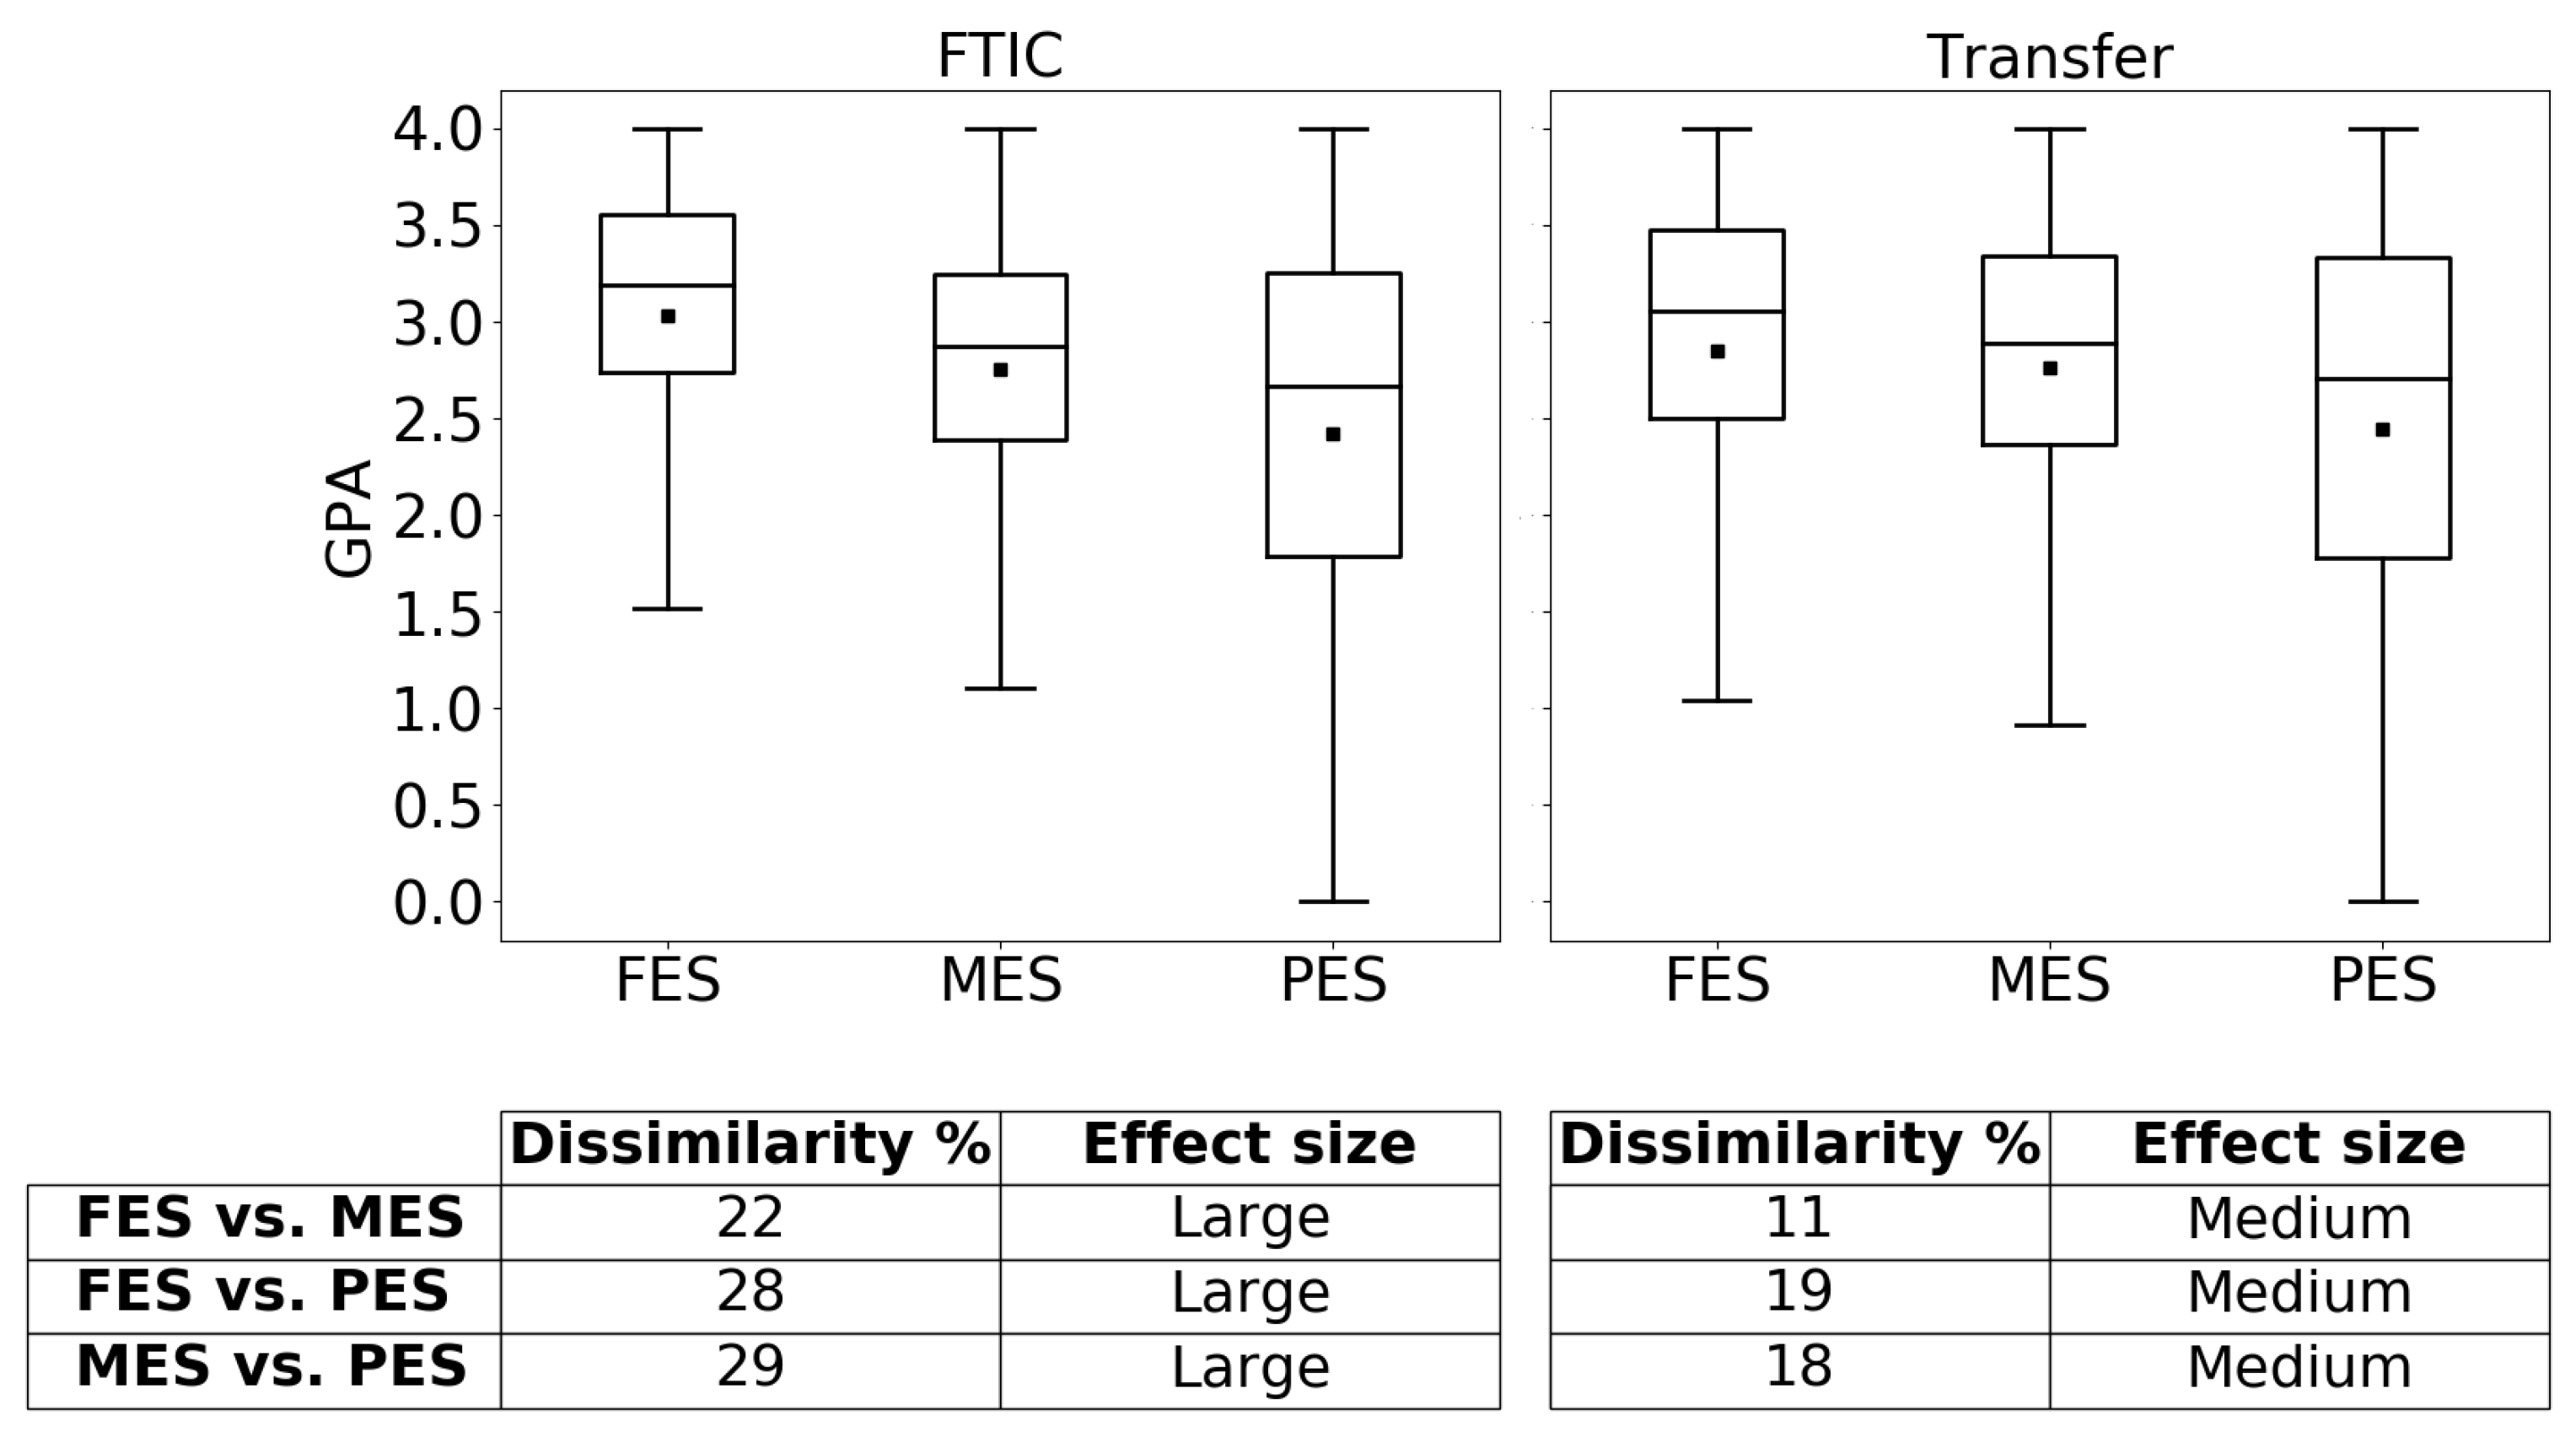
Figure 5 illustrates the average GPA for FES, MES, and PES groups separately for FTIC and transfer students. The average GPA for FTIC and transfer students is 2.99 and 2.75, respectively. For both FTIC and transfer students, FES groups have the highest average GPAs (3.03 for FTIC and 2.85 for transfer), followed by MES (2.75 for FTIC and 2.76 for transfer), and PES (2.42 for FTIC and 2.44 for transfer). Furthermore, PES students have a less consistent GPA (wider interquartile range) compared to FES and MES students for both groups. The effect size table in the figure shows that the mean GPA differences between different enrollment strategies for FTIC students (large) are larger than the difference for transfer students (medium). In fact, FTIC students’ GPAs are more sensitive to enrollment strategy compared to transfer students’ GPAs.
Conducted KS2 tests show that for both FTIC and transfer students, the GPA distribution for FES, MES, and PES groups statistically differ from each other (for FTIC students, sample sizes for FES, MES, and PES groups are 39,414, 578, and 600, respectively. For transfer students, these sample sizes are 31,748, 4515, and 18,580, respectively). Furthermore, we compared the mean GPA of FTIC and transfer students with different enrollment strategies. For FES groups, FTIC students have a higher mean GPA compared to transfer students, and the difference is statistically significant (with a small effect size). On the other hand, the Games–Howell post hoc multiple comparison tests for MES and PES groups indicates that there is no difference in mean GPAs between FTIC and transfer students. In other words, for MES and PES groups, transfer students perform similarly to FTIC students.
Key Finding 3: Both FTIC and Transfer Students: FES students have the highest GPA, followed by MES, followed by PES. The higher the student’s engagement, the higher is the student’s GPA.
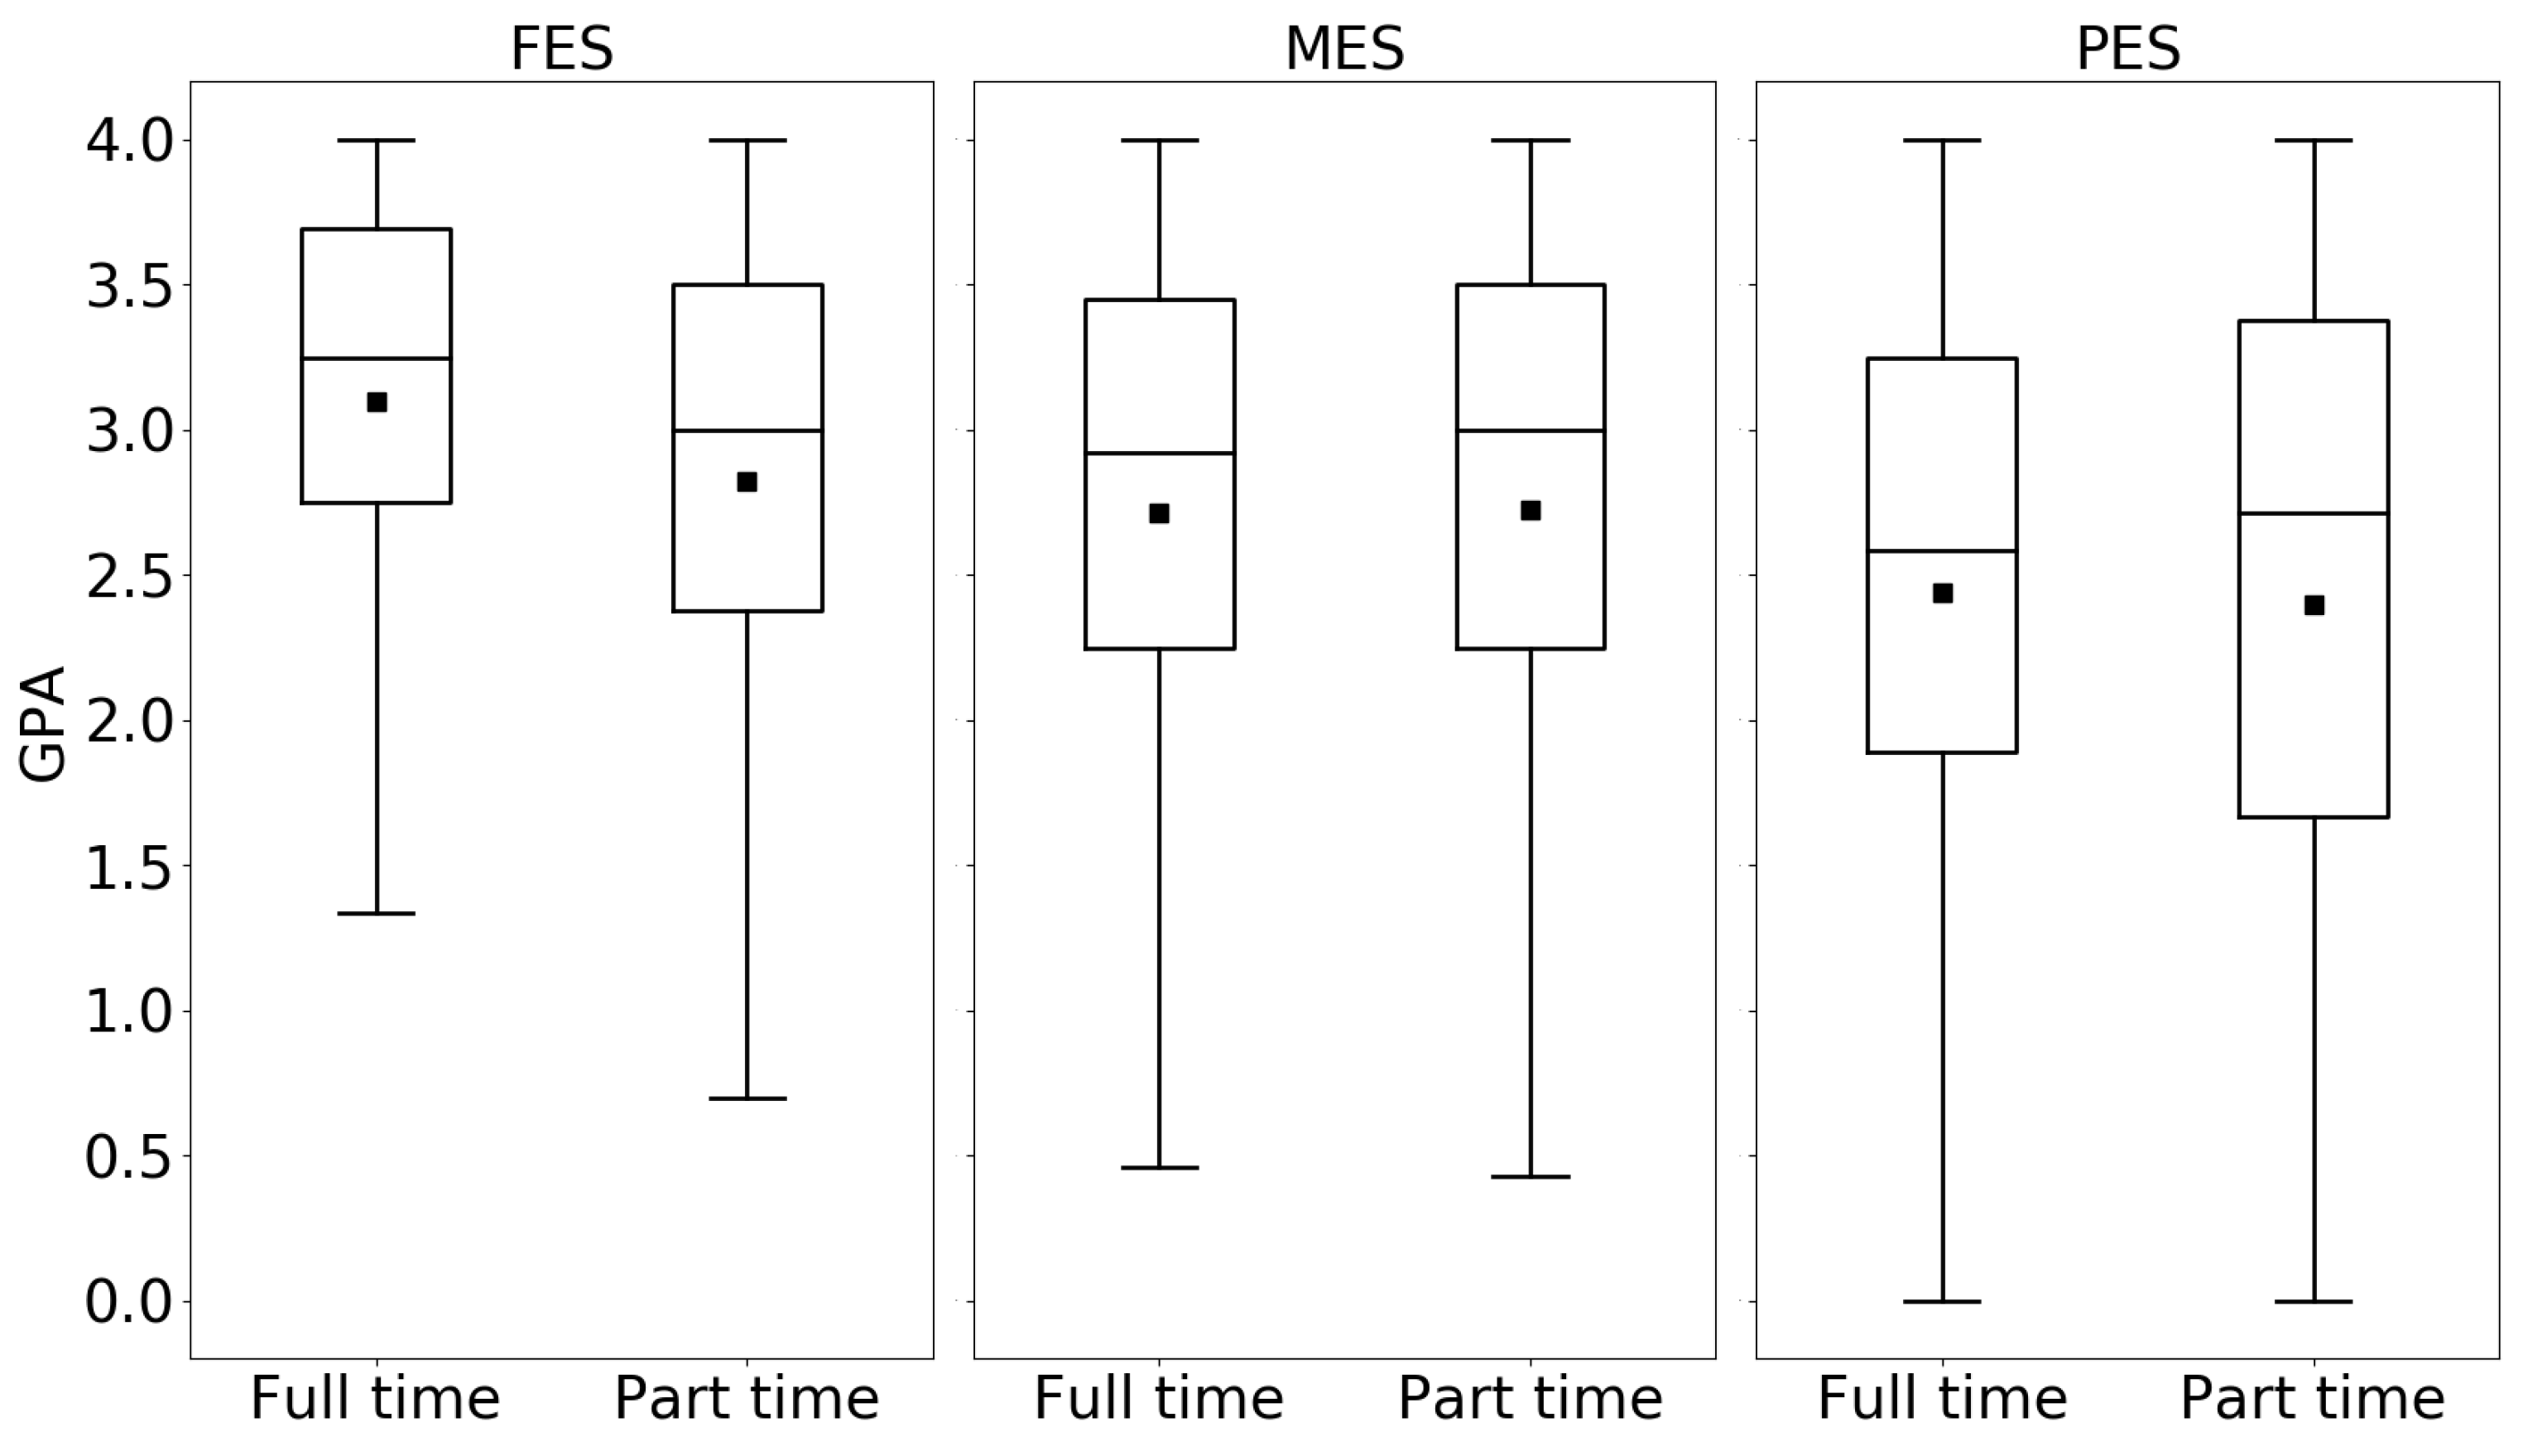
Furthermore, inside each strategy cluster, the average GPA during full-time and part-time semesters were calculated. As indicated in
Figure 6, FTIC students who adopt a full-time enrollment strategy have a higher average GPA in full-time semesters than their part-time semesters (3.1 vs. 2.82). This finding indicates that students employing a full-time enrollment strategy tend not to perform well when registering part-time. However, for students using a mixed-enrollment strategy, hypothesis tests indicate there is no statistical difference in the means between the GPAs of full-time and part-time semesters. In other words, the results suggest that semester enrollment status for MES students does not significantly impact their GPAs (the sample size for full-time and part-time semesters are 1,576, and 1,281, respectively). While the GPA reductions observed for students employing a full-time enrollment strategy appear reasonable, the lack of GPA drop for mixed enrollment strategy students is somewhat surprising. It suggests potential value in encouraging part-time students to occasionally enroll full-time. The same conclusion is observed for students in the PES group; that is, there is no statistical difference between the average GPAs of full-time and part-time semesters (the sample size for full-time and part-time semesters are 107 and 1,556, respectively).
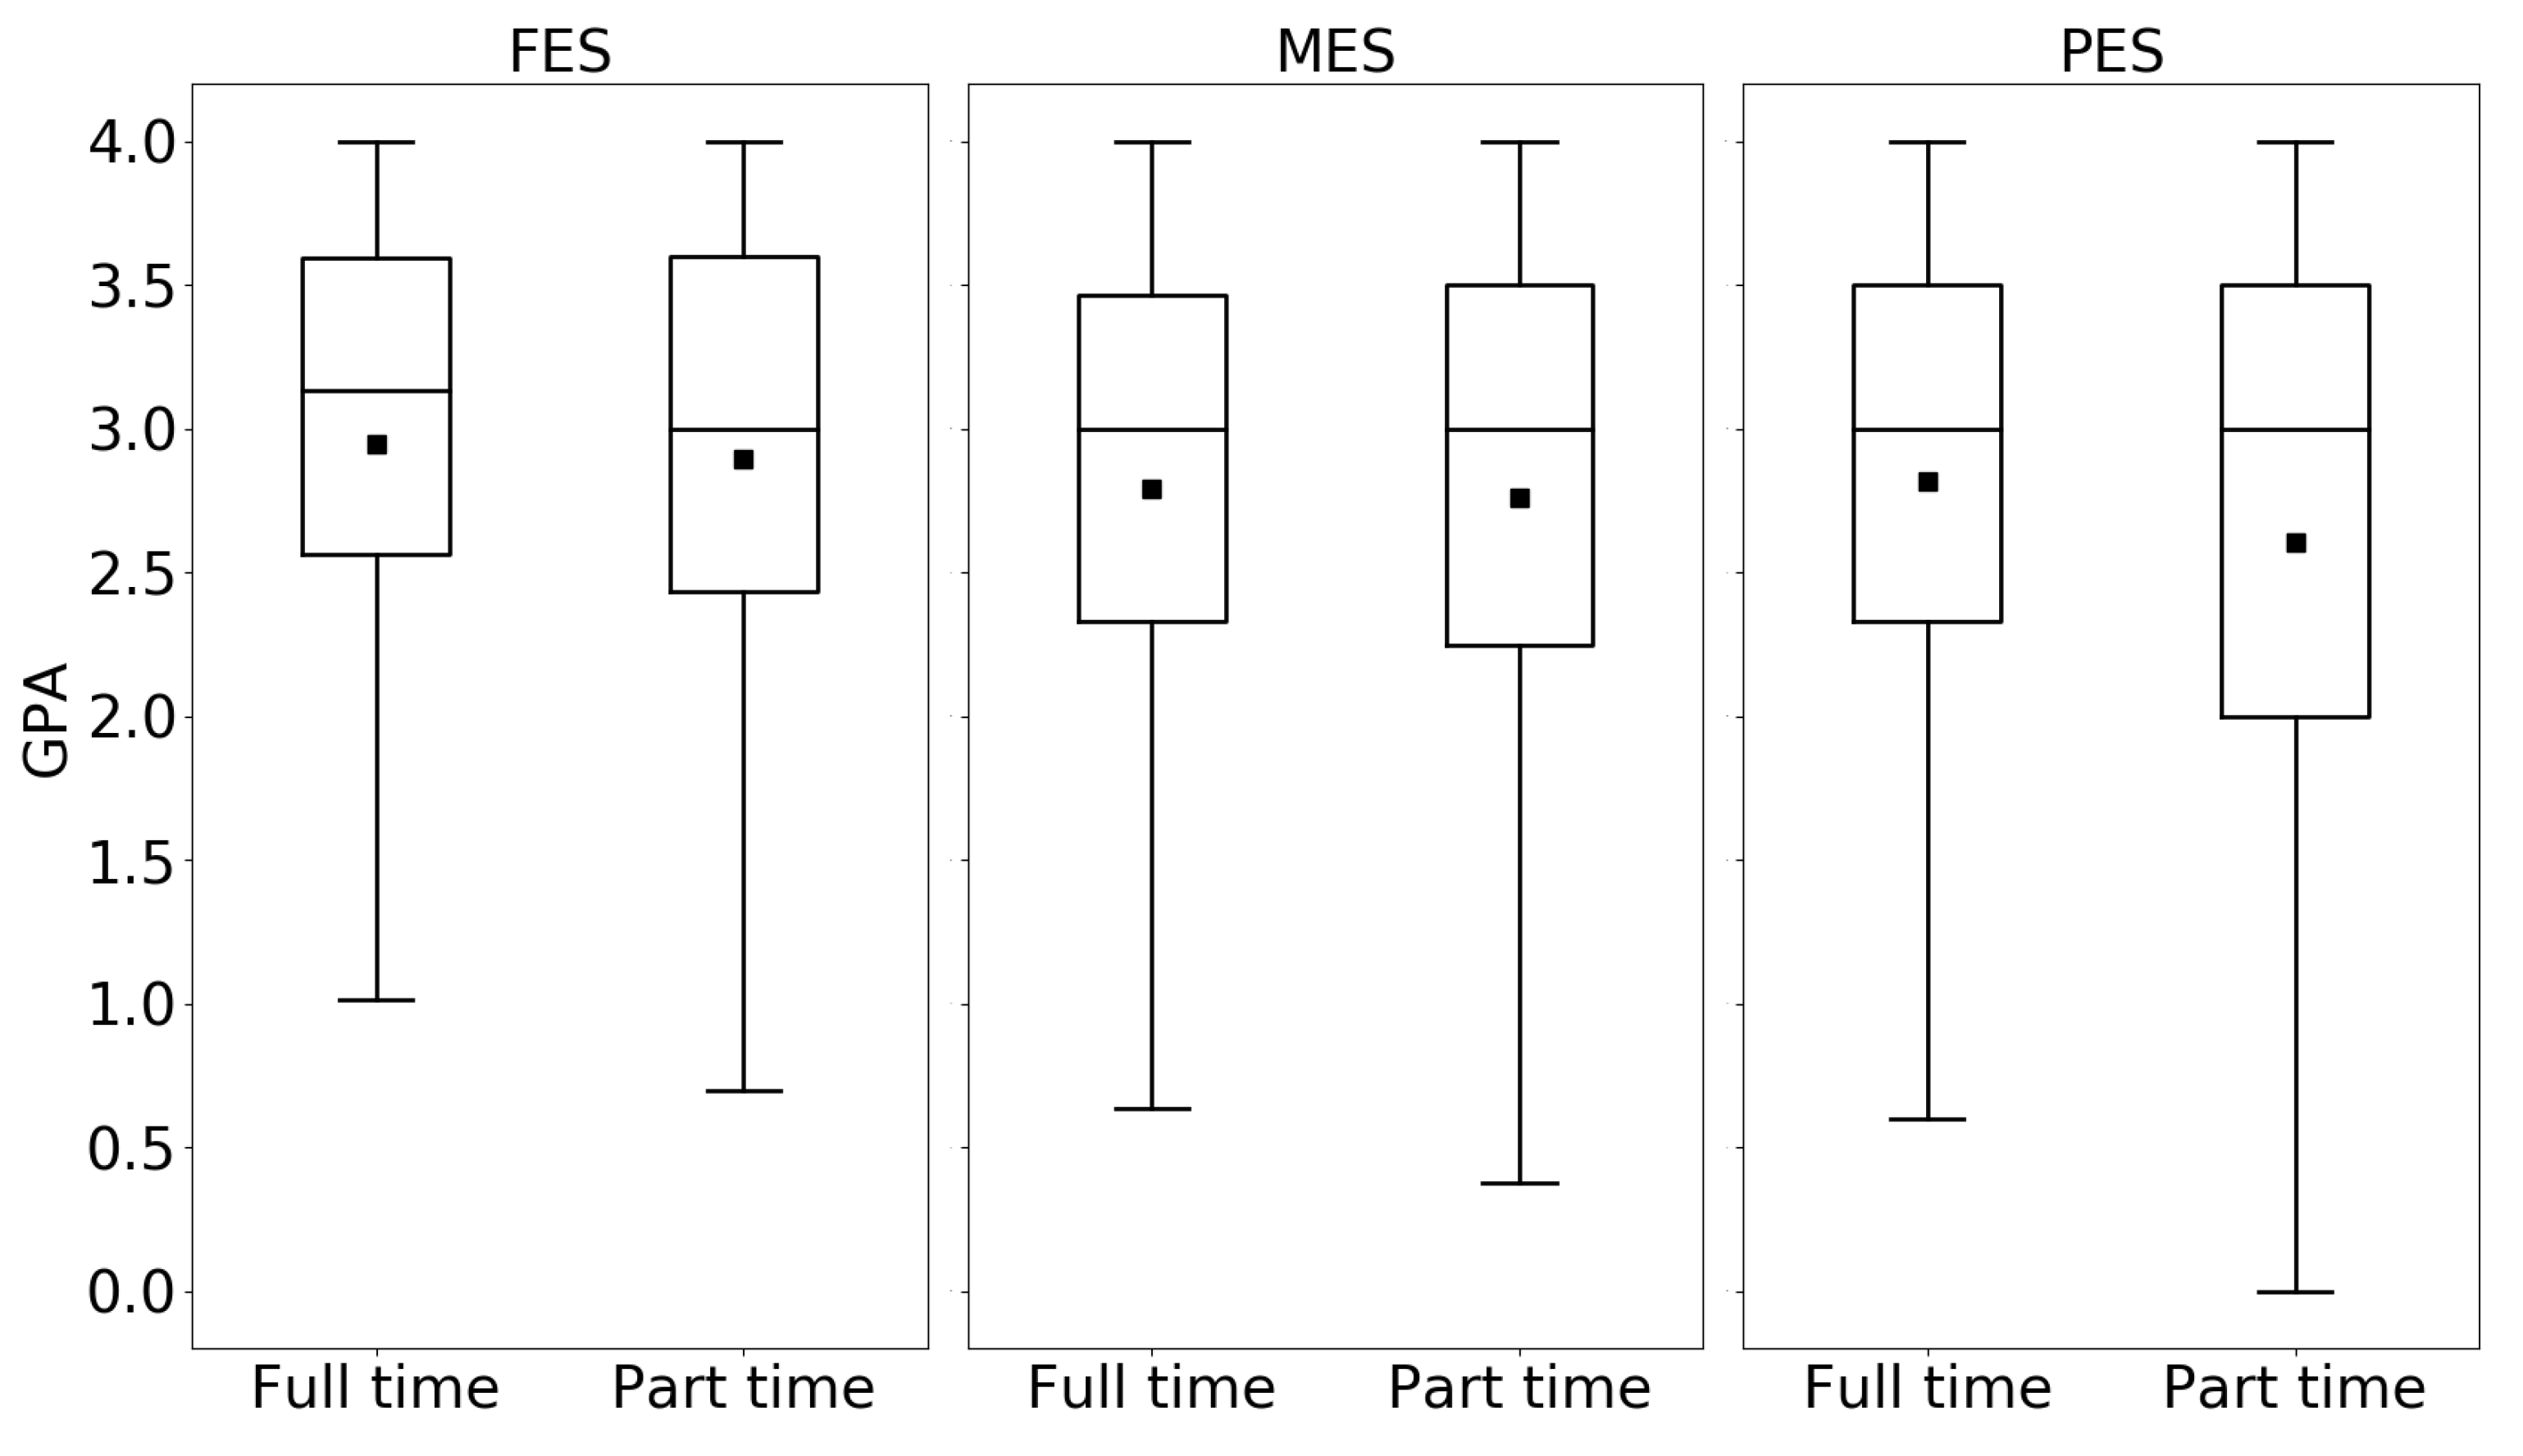
In
Figure 7, we performed a similar analysis focusing on transfer students. The results indicated that FES and PES students have higher GPAs when registered full-time than when registered part-time (2.95 > 2.89 and 2.81 > 2.6). However, there is no statistical difference between GPAs in full-time and part-time semesters for the MES group (the sample size for full-time and part-time semesters are 10,480 and 9,390, respectively).
Table 13 and
Table 14 show the computed effect size between GPA distributions in full-time and part-time semesters for FTIC and transfer students. As we see in these tables, the effect sizes for FTIC students (
Table 13) are larger than transfer students (
Table 14), which implies transfer students are less sensitive to enrollment strategy decisions compared to FTIC students.
Furthermore, some comparisons were conducted between FTIC and transfer students in terms of average GPA in full-time and part-time semesters. For example, for the PES group, the average GPA for transfer students in full-time semesters is 2.81, while for FTIC students, it is 2.44. The equivalent values for part-time semesters are 2.60 and 2.40, and the differences are statistically significant. In other words, PES transfer students have a higher GPA compared to PES FTIC students for their full-time and part-time semesters. These results may seem counter-intuitive, but it might be explained by the academic history of transfer students. The students transferring from community colleges may be acclimated to maintaining part-time jobs and, therefore, enrolling in part-time semesters, which explains them maintaining reasonable academic performance in part-time semesters [
45].
Key Finding 4: FTIC Students: FES students, when register as full-time, have a higher GPA compared to when they register part-time. There is no difference between the GPA of the full-time and part-time semester for MES and PES students.
Key Finding 5: Transfer Students: FES and PES students, when register as full-time, have a higher GPA compared to when they register part-time. For MES students, there is no difference between the GPA of the full-time and part-time semester.
Key Finding 6: FTIC and Transfer Students: For PES students with full-time and part-time enrollment, transfer students have a higher GPA than FTIC students. More broadly, FTIC students appear to be more sensitive to their enrollment strategy and status.
8.2. DFW Rate Analysis
As another indicator of students’ performance we compare the DFW rate for students with different enrollment strategies. The DFW rate is defined as the number of courses with D, F, and W grades over the total number of courses taken by a student.
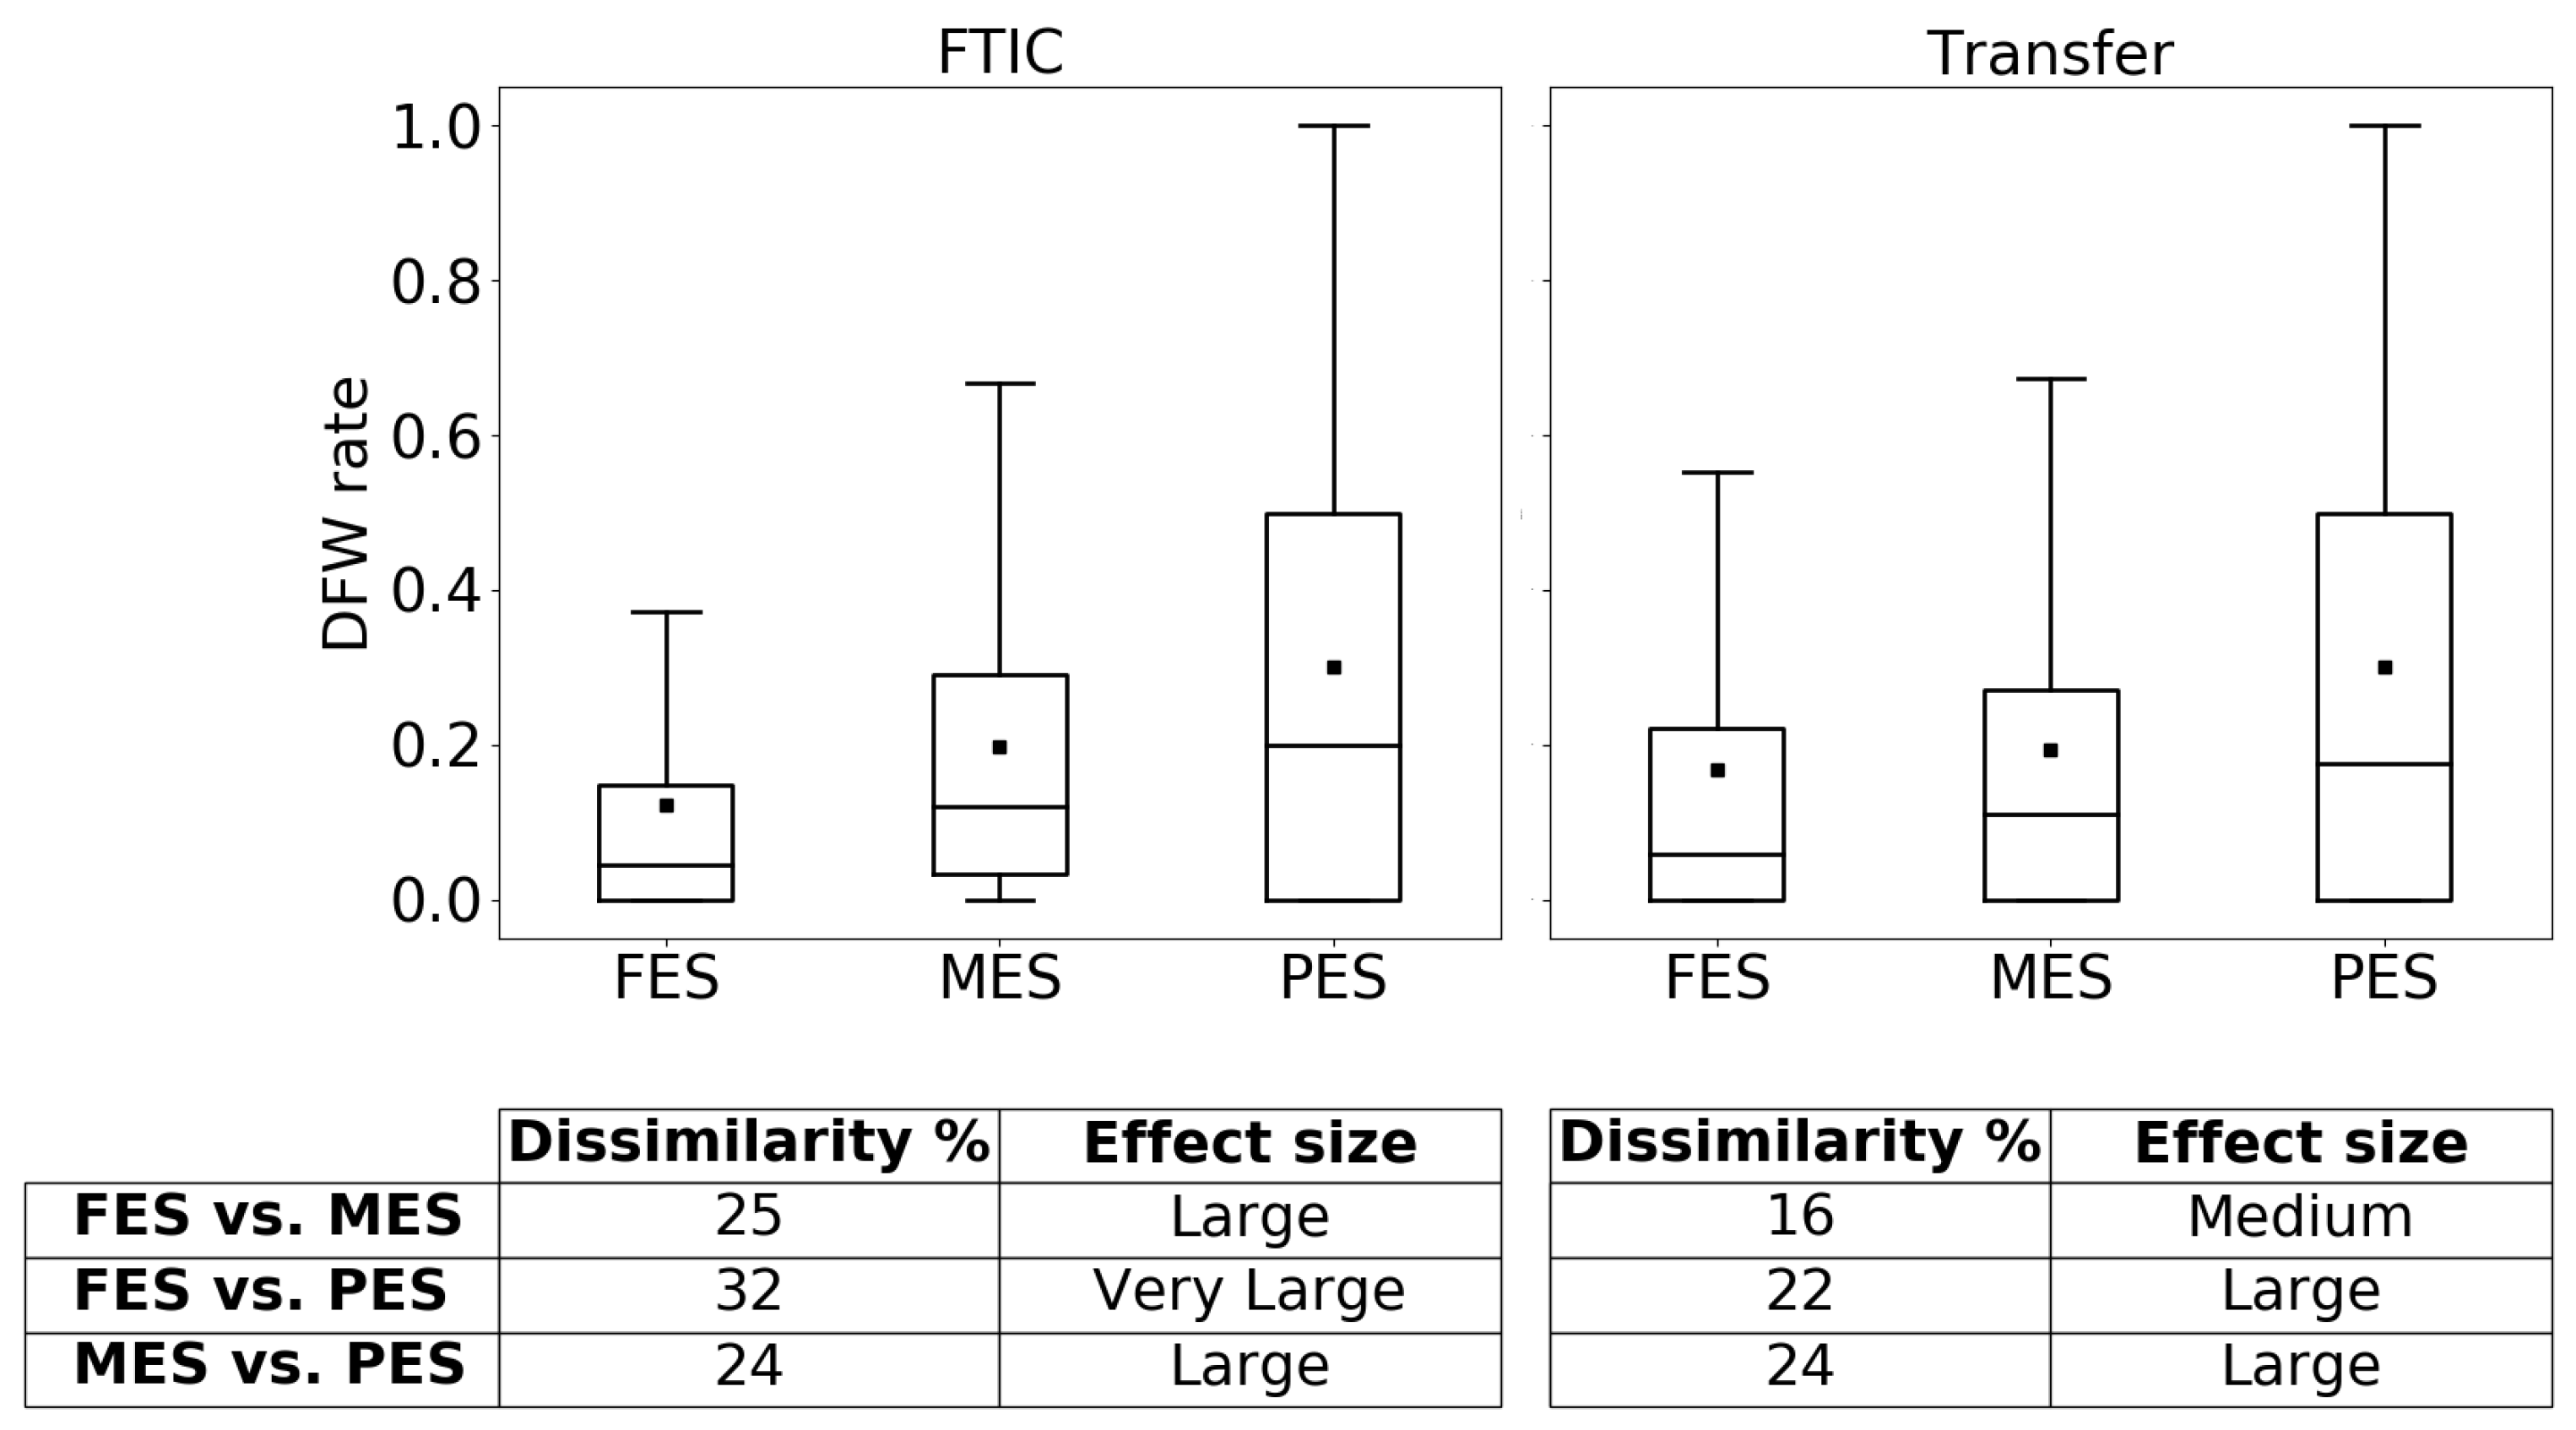
Appendix B shows an example of computing the DFW rate. Whisker plots for DFW rates separated by FTIC and transfer students are provided in
Figure 8. As expected, for both FTIC and transfer students, the PES group is the most likely to get DFW grades, followed by MES and FES, respectively. Games–Howell post hoc multiple comparison tests were conducted to see if the average DFW rates of each group differ from other groups. For both FTIC and transfer students, the
p-values of the tests for all possible pairs between FES, MES, and FES is 0, which means the difference is statistically significant (For FTIC students, the sample size of FES, MES, and PES groups is 39,371, 578, and 596, respectively, and for transfer students, the values are 31,721, 4515, and 18,521, respectively).
Furthermore, effect size results in the figure show that the mean DFW rate for FTIC students is more sensitive to enrollment strategy than transfer students’ DFW rates. When comparing FTIC and transfer students in terms of the DFW rate, we find that for the FES group, FTIC students have a lower average DFW rate compared to transfer students, and the difference is statistically significant. However, for MES and PES groups, there is no significant difference in the mean DFW rate. To get a better idea of the grade distribution,
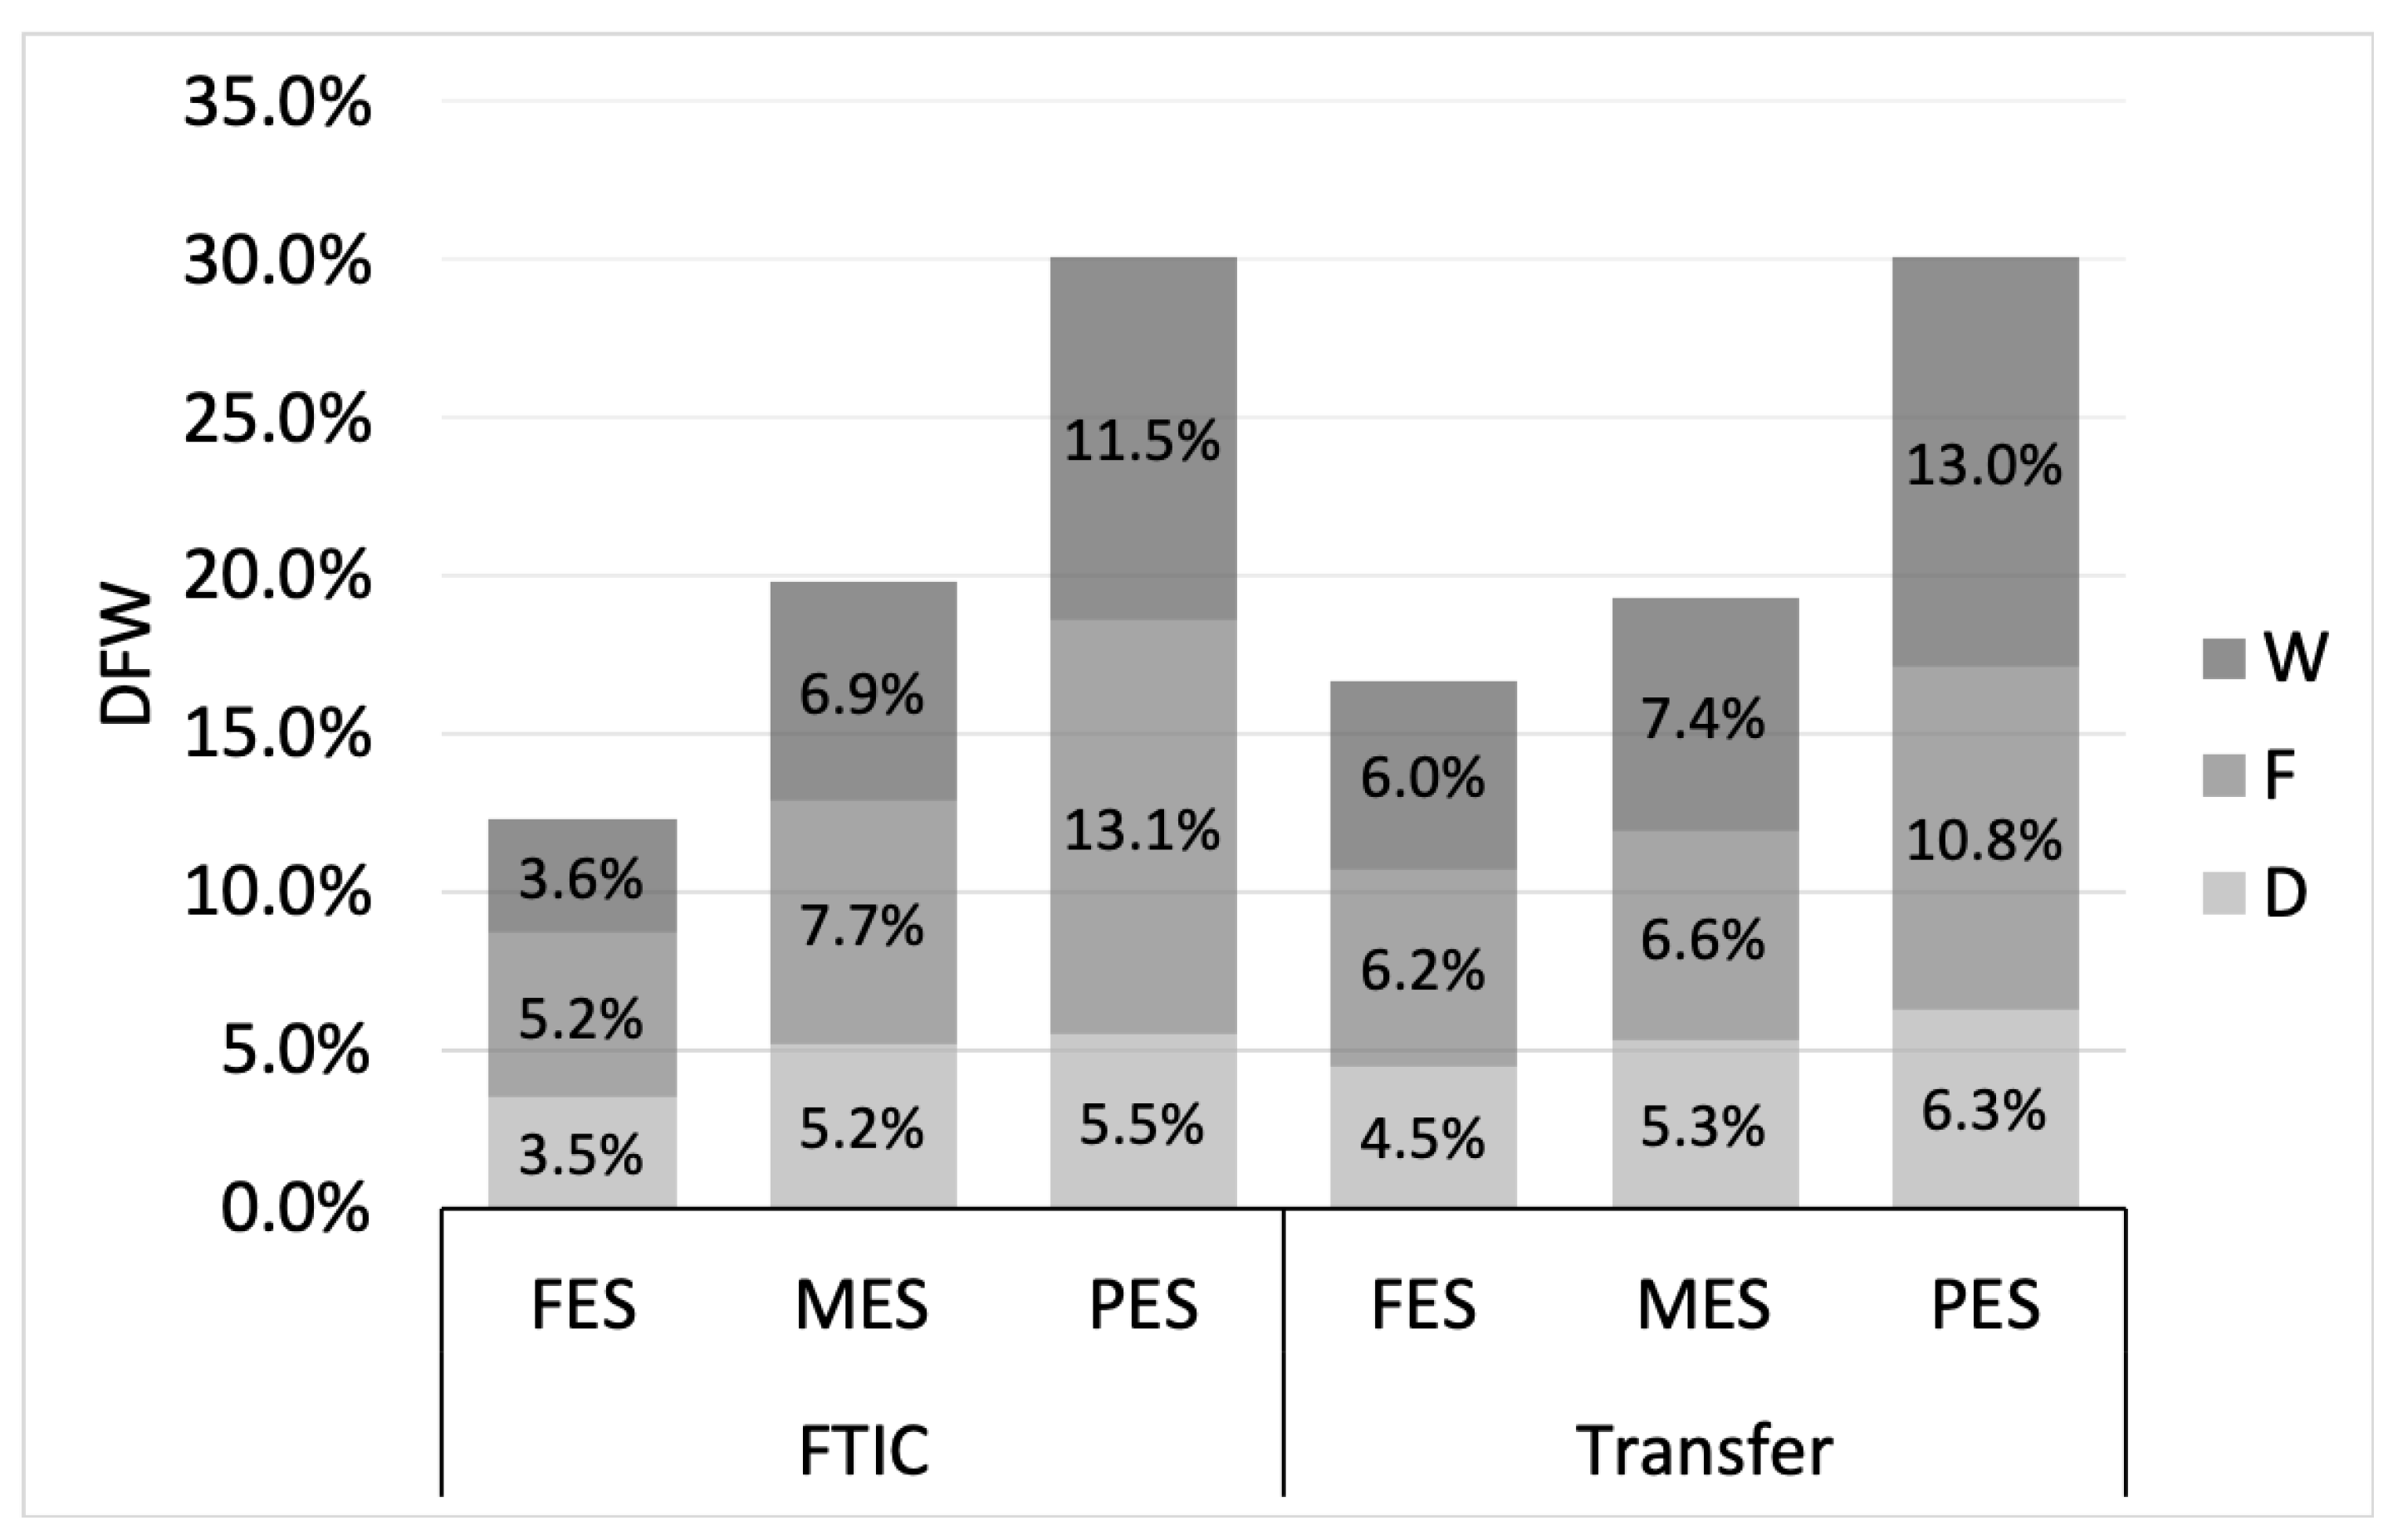
Figure 9 represents DFW rates broken to D, F, and W for FTIC and transfer students separately. Based on the figure, following a similar pattern as for the DFW rates, FES students have the lowest rates of D, F, and W grades when compared to MES and PES students. Moreover, among students who are not in an overall good standing (having DFW grades), those adopting PES show more intention to drop the course (38% FTIC and 54% transfer) compared to MES (35% FTIC and 38% transfer) and FES (29% FTIC and 36% transfer).
Key Finding 7: FTIC and Transfer Students: PES students have a higher DFW rate compared to MES and FES groups. As before, the academic performance of FTIC students, as measured by DFW rate, appears more sensitivity to enrollment strategy, then that of transfer students.
8.3. Graduation Rate Analysis
Another important metric in assessing academic performance for different enrollment strategies is graduation rate. To compute this metric, American universities use the six-year graduation rate approach. Based on the federal definition, the six-year graduation rate refers to the percentage of FTIC students who complete their program within 150% of the standard enrollment time to degree [
46]. For example, for a four-year program, students who earn degrees within six years are considered graduates.
Despite its popularity, the six-year graduation rate approach has two main blind spots. First, no distinction exists between students with different enrollment strategies. PES students often take fewer courses each semester compared to MES and FES. Therefore, they are more likely to finish their program in more than six years. All such students are considered halting their program in the six-year graduation rate method, leading to underestimating the actual graduation rate. Second, the six-year graduation rate is only computed for FTIC students, excluding transfer students.
In this paper, we apply two alternative methodologies for computing the graduation rate. In the first methodology, we calculate the halt rate as a substitute for the graduation rate. The halt rate refers to the percentage of FTIC students who halt enrollment at UCF within six years. Students are considered as halted if they do not register at UCF for three consecutive semesters. This measure helps us avoid the underestimation caused by excluding students who take more than six years to graduate.
In the second approach, we use an absorbing Markov Chain to compute the graduation rates. This approach does not exclude students who graduate after six years, as it can calculate the graduation/halt rate probability for any duration of time that students spend in their program. Moreover, it makes it possible to consider transfer students by inserting them into the Markov chain model, taking into account their academic level when they join the new program. This approach is explained in detail by [
47].
Table 15 reports the six-year graduation and halt rates for FTIC students who start their program in Fall 2008, 2009, and 2010. As indicated in the table, PES students have a higher six-year halt rate than FES and MES students.
Table 16 shows the graduation rate for FTIC students with different types of enrollment strategies using the absorbing Markov chain method. Aligned with prior studies, FES students have the highest graduation rate for any academic level, this is followed by MES and PES, respectively. Furthermore, for FTIC students with any enrollment strategy, higher academic levels correspond to higher graduation rates. For example, Senior students have a higher graduation rate compared to Junior, Sophomore, and Freshman students; that is to say persistence is a critical factor.
Columns
Time to graduate and
Time to halt in
Table 15 and
Table 16 provide the expected time it takes for students to graduate and halt enrollment, respectively. As shown in the tables, regardless of metric, the time to graduate for the FES group is notably shorter than for MES and PES groups. For example, students in the FES group with the
Freshman academic level need an average of 11.09 semesters to graduate from their program, while for students in the MES and PES groups, it takes 12.74 and 13.26 semesters on average, respectively. However, the comparisons between enrollment strategies differ when considering Time to halt. As an example, time to halt for freshman students in the MES (4.70) group is longer than FES (3.82) and PES (3.15) groups. This could be explained as some full-time students may decide to alternate between full-time and part-time semesters as a strategy to decrease imposed workload and avoid halting enrollment.
Table 17 provides the same measures in
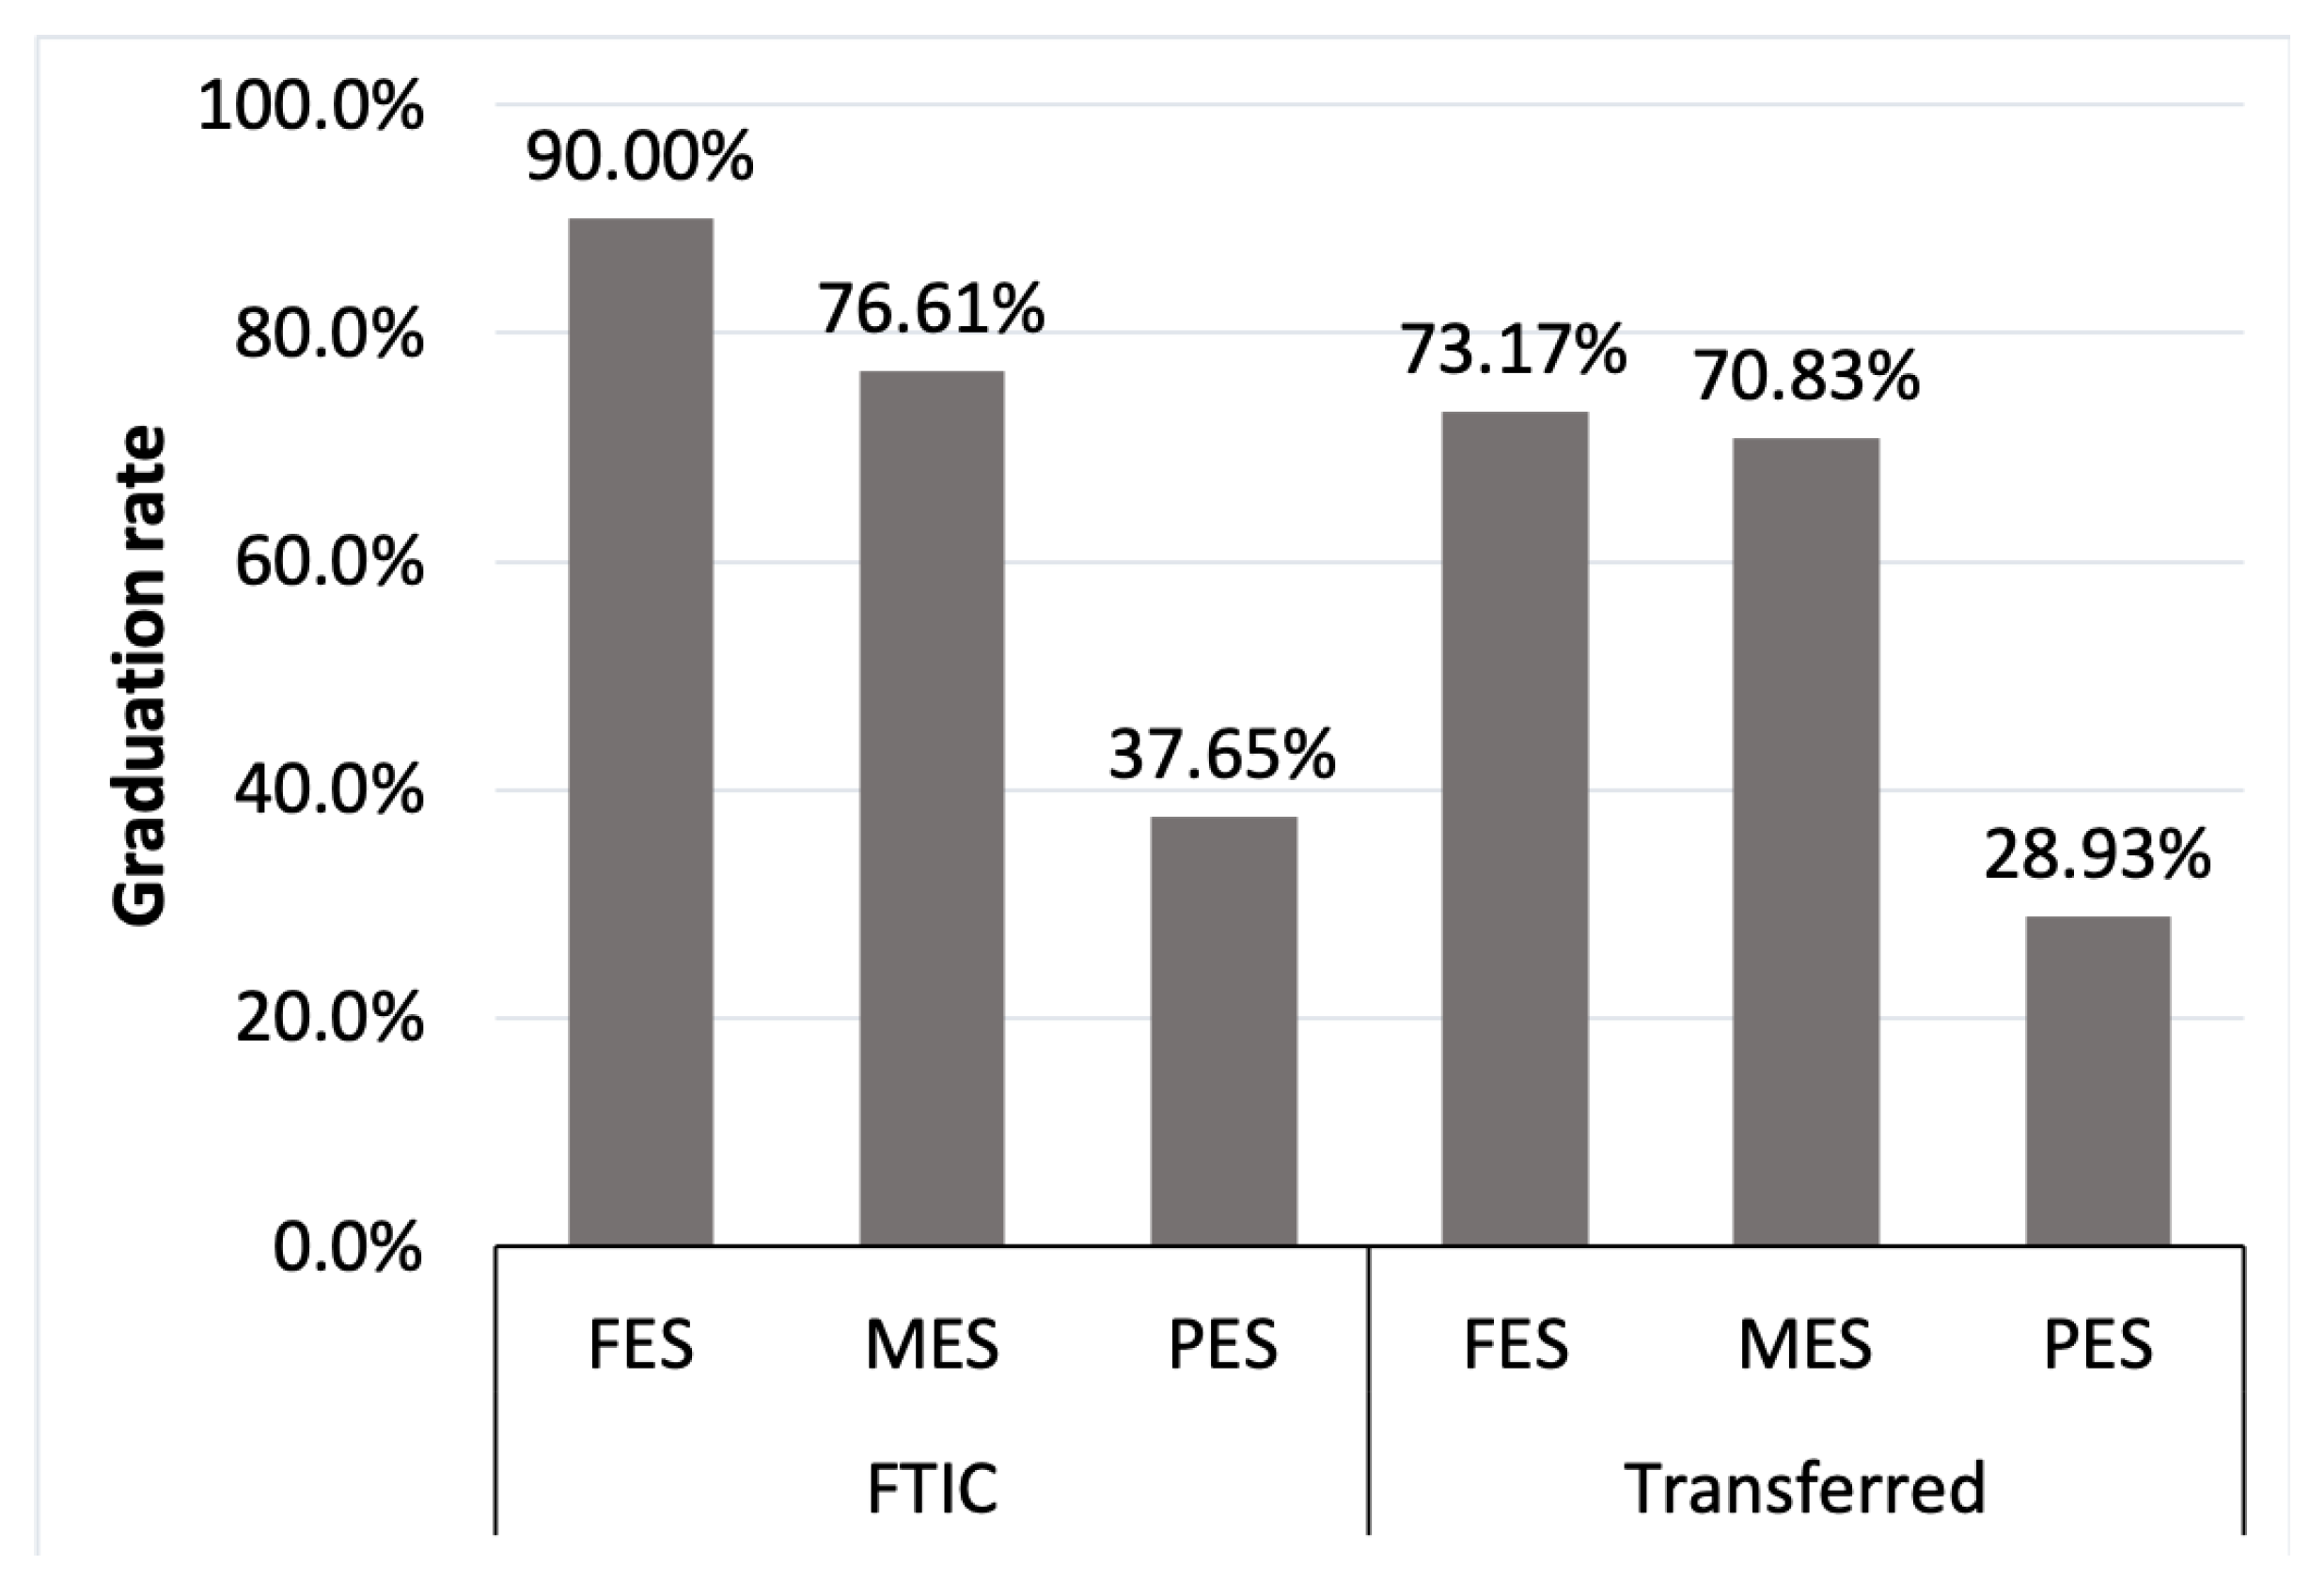
Table 16 for transfer students. For both FTIC and transfer groups, FES students have the highest graduation rate, followed by MES, and PES, respectively. These results are shown in
Figure 10.
Key Finding 8: FTIC and Transfer Students: FES students have a higher graduation rate than MES and PES groups. While MES students have a substantially improved graduation rate as compared to PES students, especially for transfer students.
Key Finding 9: Transfer Students: Time to graduate for PES students is greater than time to graduate for MES and FES students. When comparing strategies, MES appears to be a suitable strategy as required for transfer students (e.g., for students that must work while in school); while employing MES may extend time-to-graduation, the impact on the graduation rate is limited as compared to PES.
Key Finding 10: FTIC Students: MES and PES students have a longer time to graduate than FES students.
9. Discussion
In
Section 8, we showed that students who are more engaged with their study program through full-time enrollment have a better academic performance on average. In this section, we use the other group of students-students who use a combination of the FES, MES, and PES during their academic career-to help validate our results. Specifically, we seek to extract the direction of causality between enrollment strategy and academic performance.
The graduation rate results in the previous section showed that PES students are more likely to halt school before graduation. This finding raises the potential concerns that students who change their enrollment strategy from FES to PES increase their likelihood of halting. To assess this concern, we compare enrollment persistence of students who switch from FES to PES with those who maintain FES. To minimize bias in the analysis, we consider students in the same college that have similar GPAs (i.e., with binned GPAs of width 0.2). Statistic indicate that around 16% of students in the College of Science, who switched after three FES semesters to PES, have halted. This percentage is significantly lower for students who maintain FES throughout the same period (less than 1% dropout). Similar results for other colleges are summarized in
Table 18. While not providing a complete explanation, the results provide partial support to the claim that the choose of enrollment strategy affects academic performance.
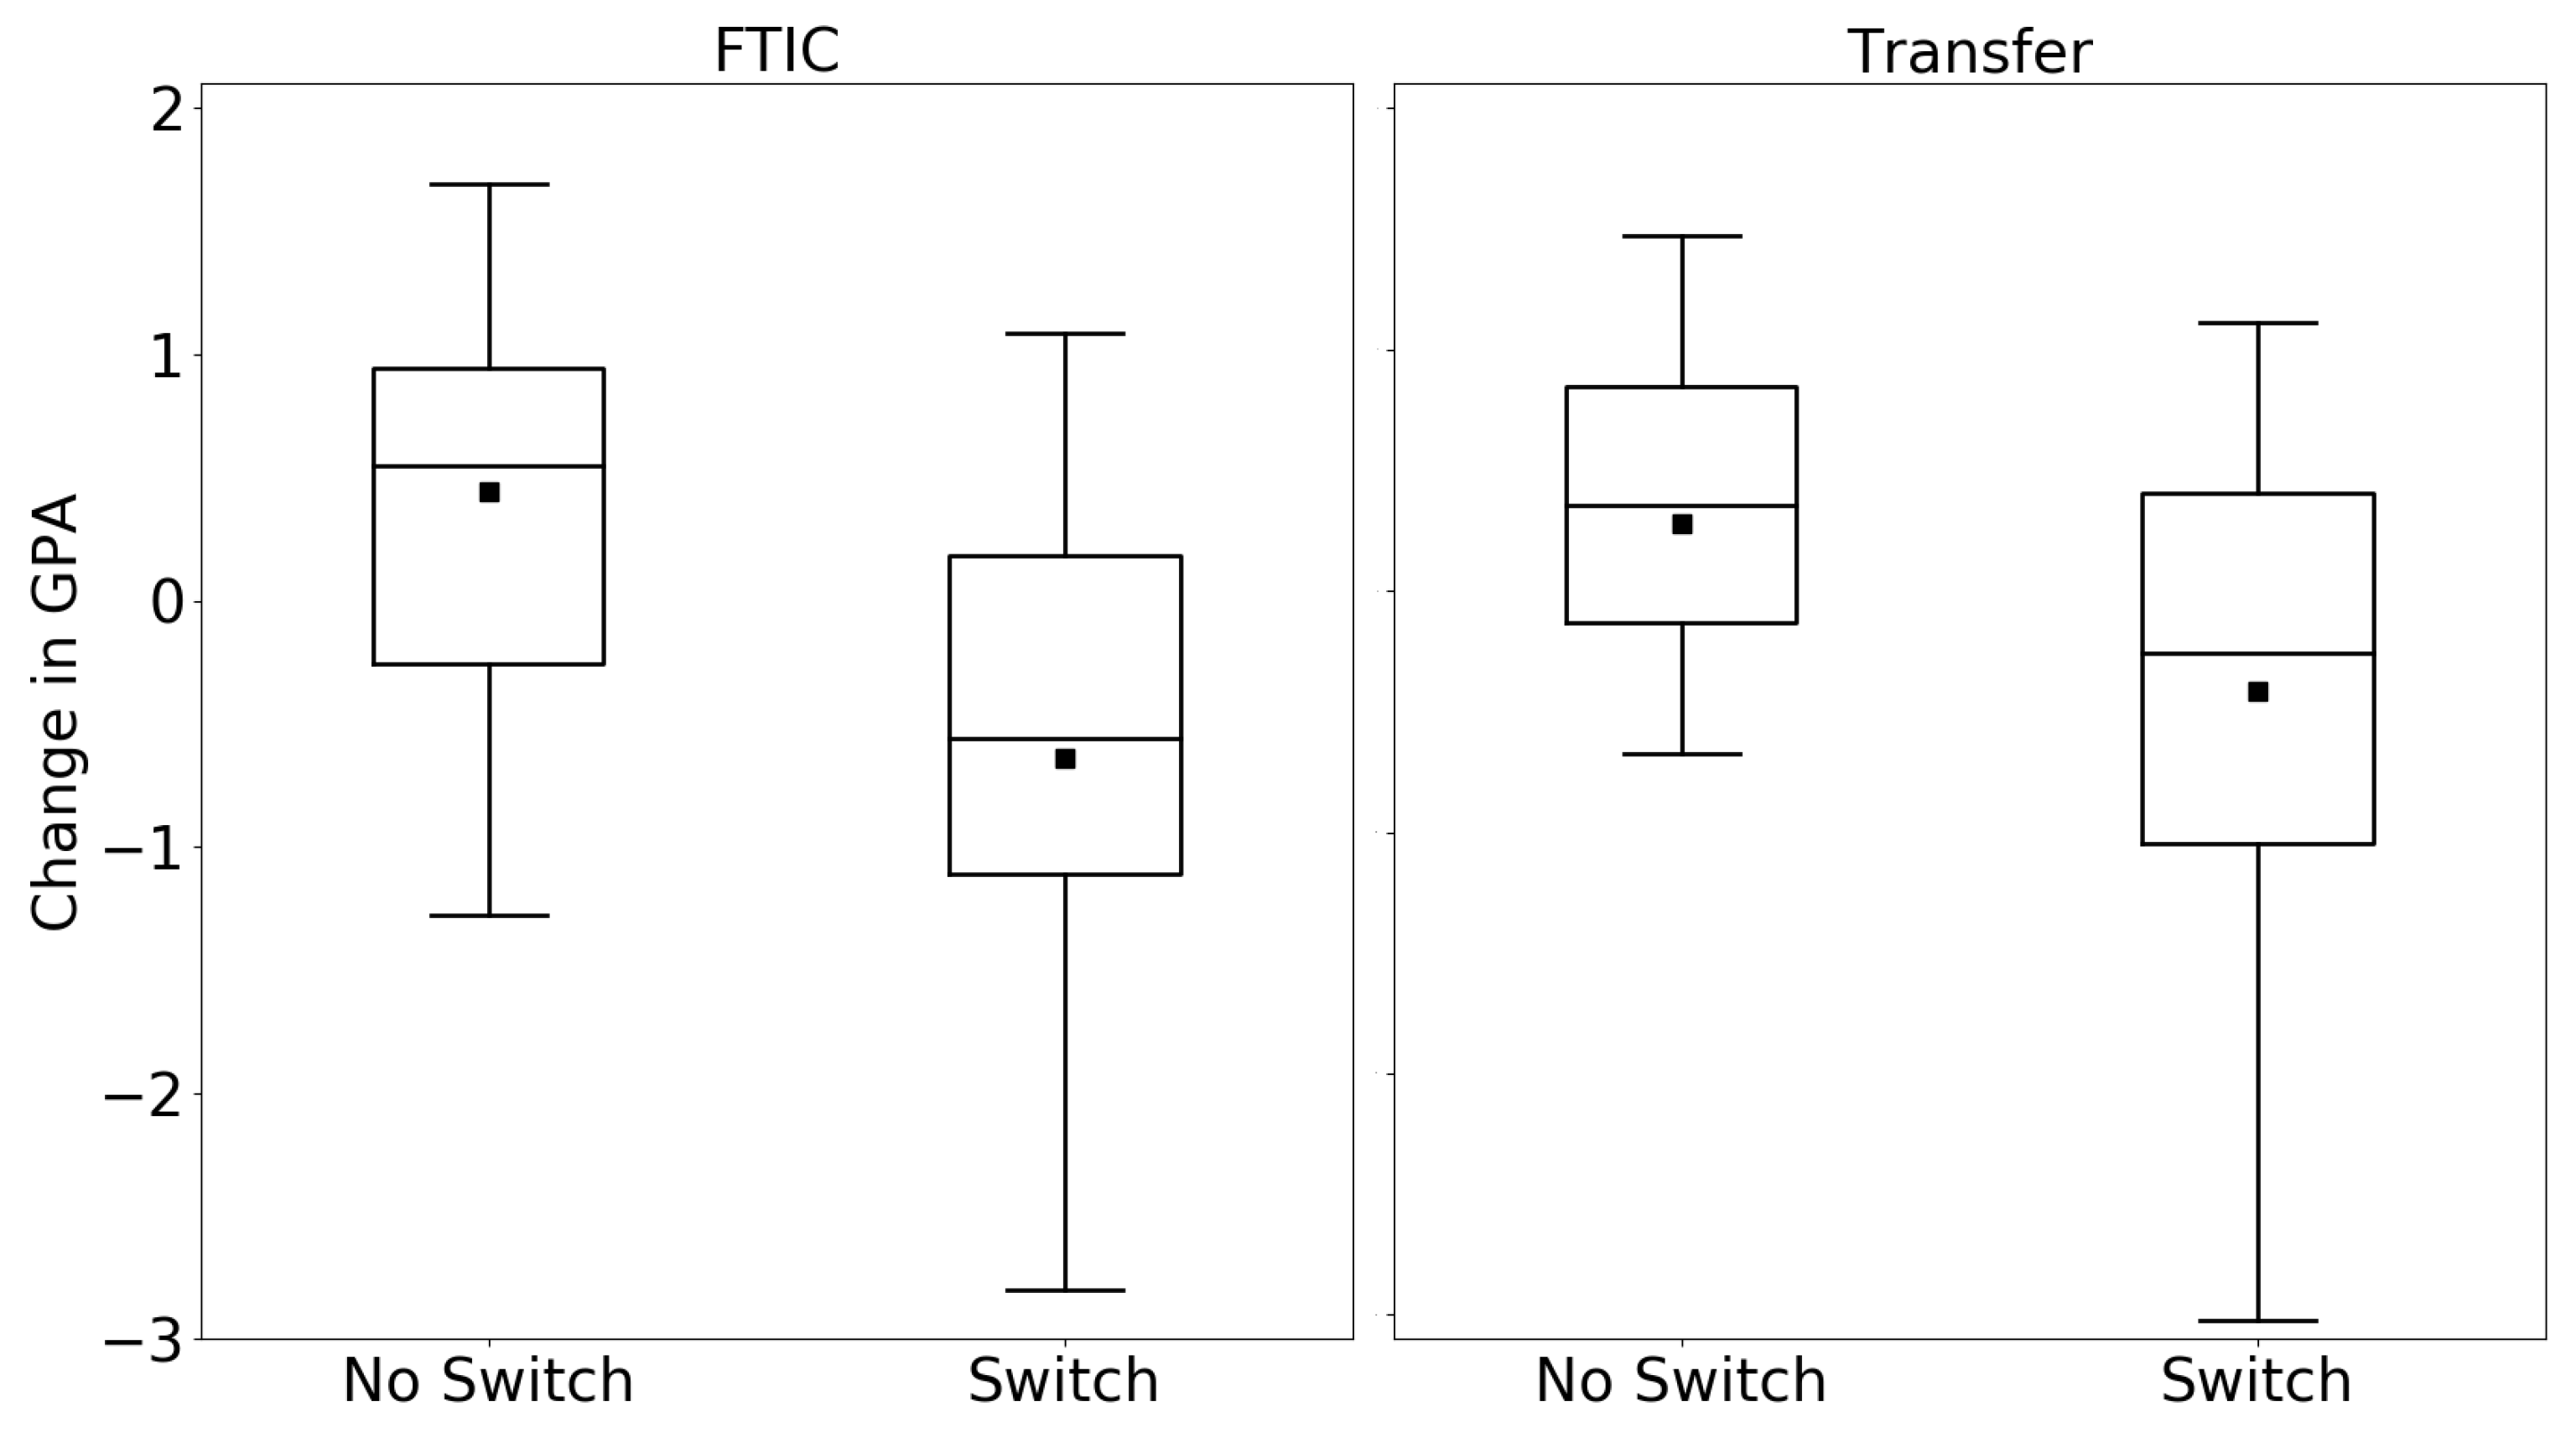
Next, we compare the GPA trend between students who switch their enrollment strategy to PES after three FES semesters and those who stay FES through their academic career. Again, students in both groups are selected from the same colleges and have similar GPAs at the end of the third semester. To get the GPA trend, we compute the difference between the fourth semester GPA and the average GPA for the first three semesters and compare the result between the two groups. For FTIC students, the average difference for students who switch from FES to PES is −0.64, while for students who remain FES the difference in GPA is +0.44. These results for transfer students are −0.42 and +0.28, respectively, between switching and remaining. More detailed statistics are provided in
Figure 11 for FTIC and transfer students separately.
We use two different statistical tests to examine if the decrease in the GPA for those who have switched their enrollment strategy from FES to PES is significant: (1) the hypothesis
t-test, and (2) the two-ways Anova test. The
p-value for the hypotheses
t-tests (0) shows that for both FTIC and transfer students, the difference between the average GPA of the three first semesters and the fourth semester is statistically significant. Although the t-test is informative, one may argue that different academic expectations and policies across academic colleges (e.g., Engineering, Business) are important factors and may impact students’ behavior. To address this possibility we apply a two-way ANOVA test to investigate the impact of switching enrollment strategy together with the academic college of enrollment on the observed decline in GPA. Therefore, a linear regression model is fitted on data with two independent variables; one categorical variable, which represents the college of enrollment, and one binary variable, which indicates if a switch is made from FES to PES after three semesters. The switching variable is equal to 1 if the student switches from FES to PES in the fourth semester, and is equal to 0 otherwise. We consider the difference between the fourth semester GPA and average GPA for the three first FES semesters as the response variable. The results of ANOVA test for FTIC and transfer students are summarized in
Table 19 and
Table 20, respectively.
As we see in
Table 19 and
Table 20 the switching variable (with the
p-value <
) is the only factor impacting students’ GPA. This finding implies that regardless of academic colleges, a change in a students enrollment strategy is an important factor in future performance; monitoring such changes can potentially help university policymakers design interventions to decrease the likelihood of undesirable academic outcomes.
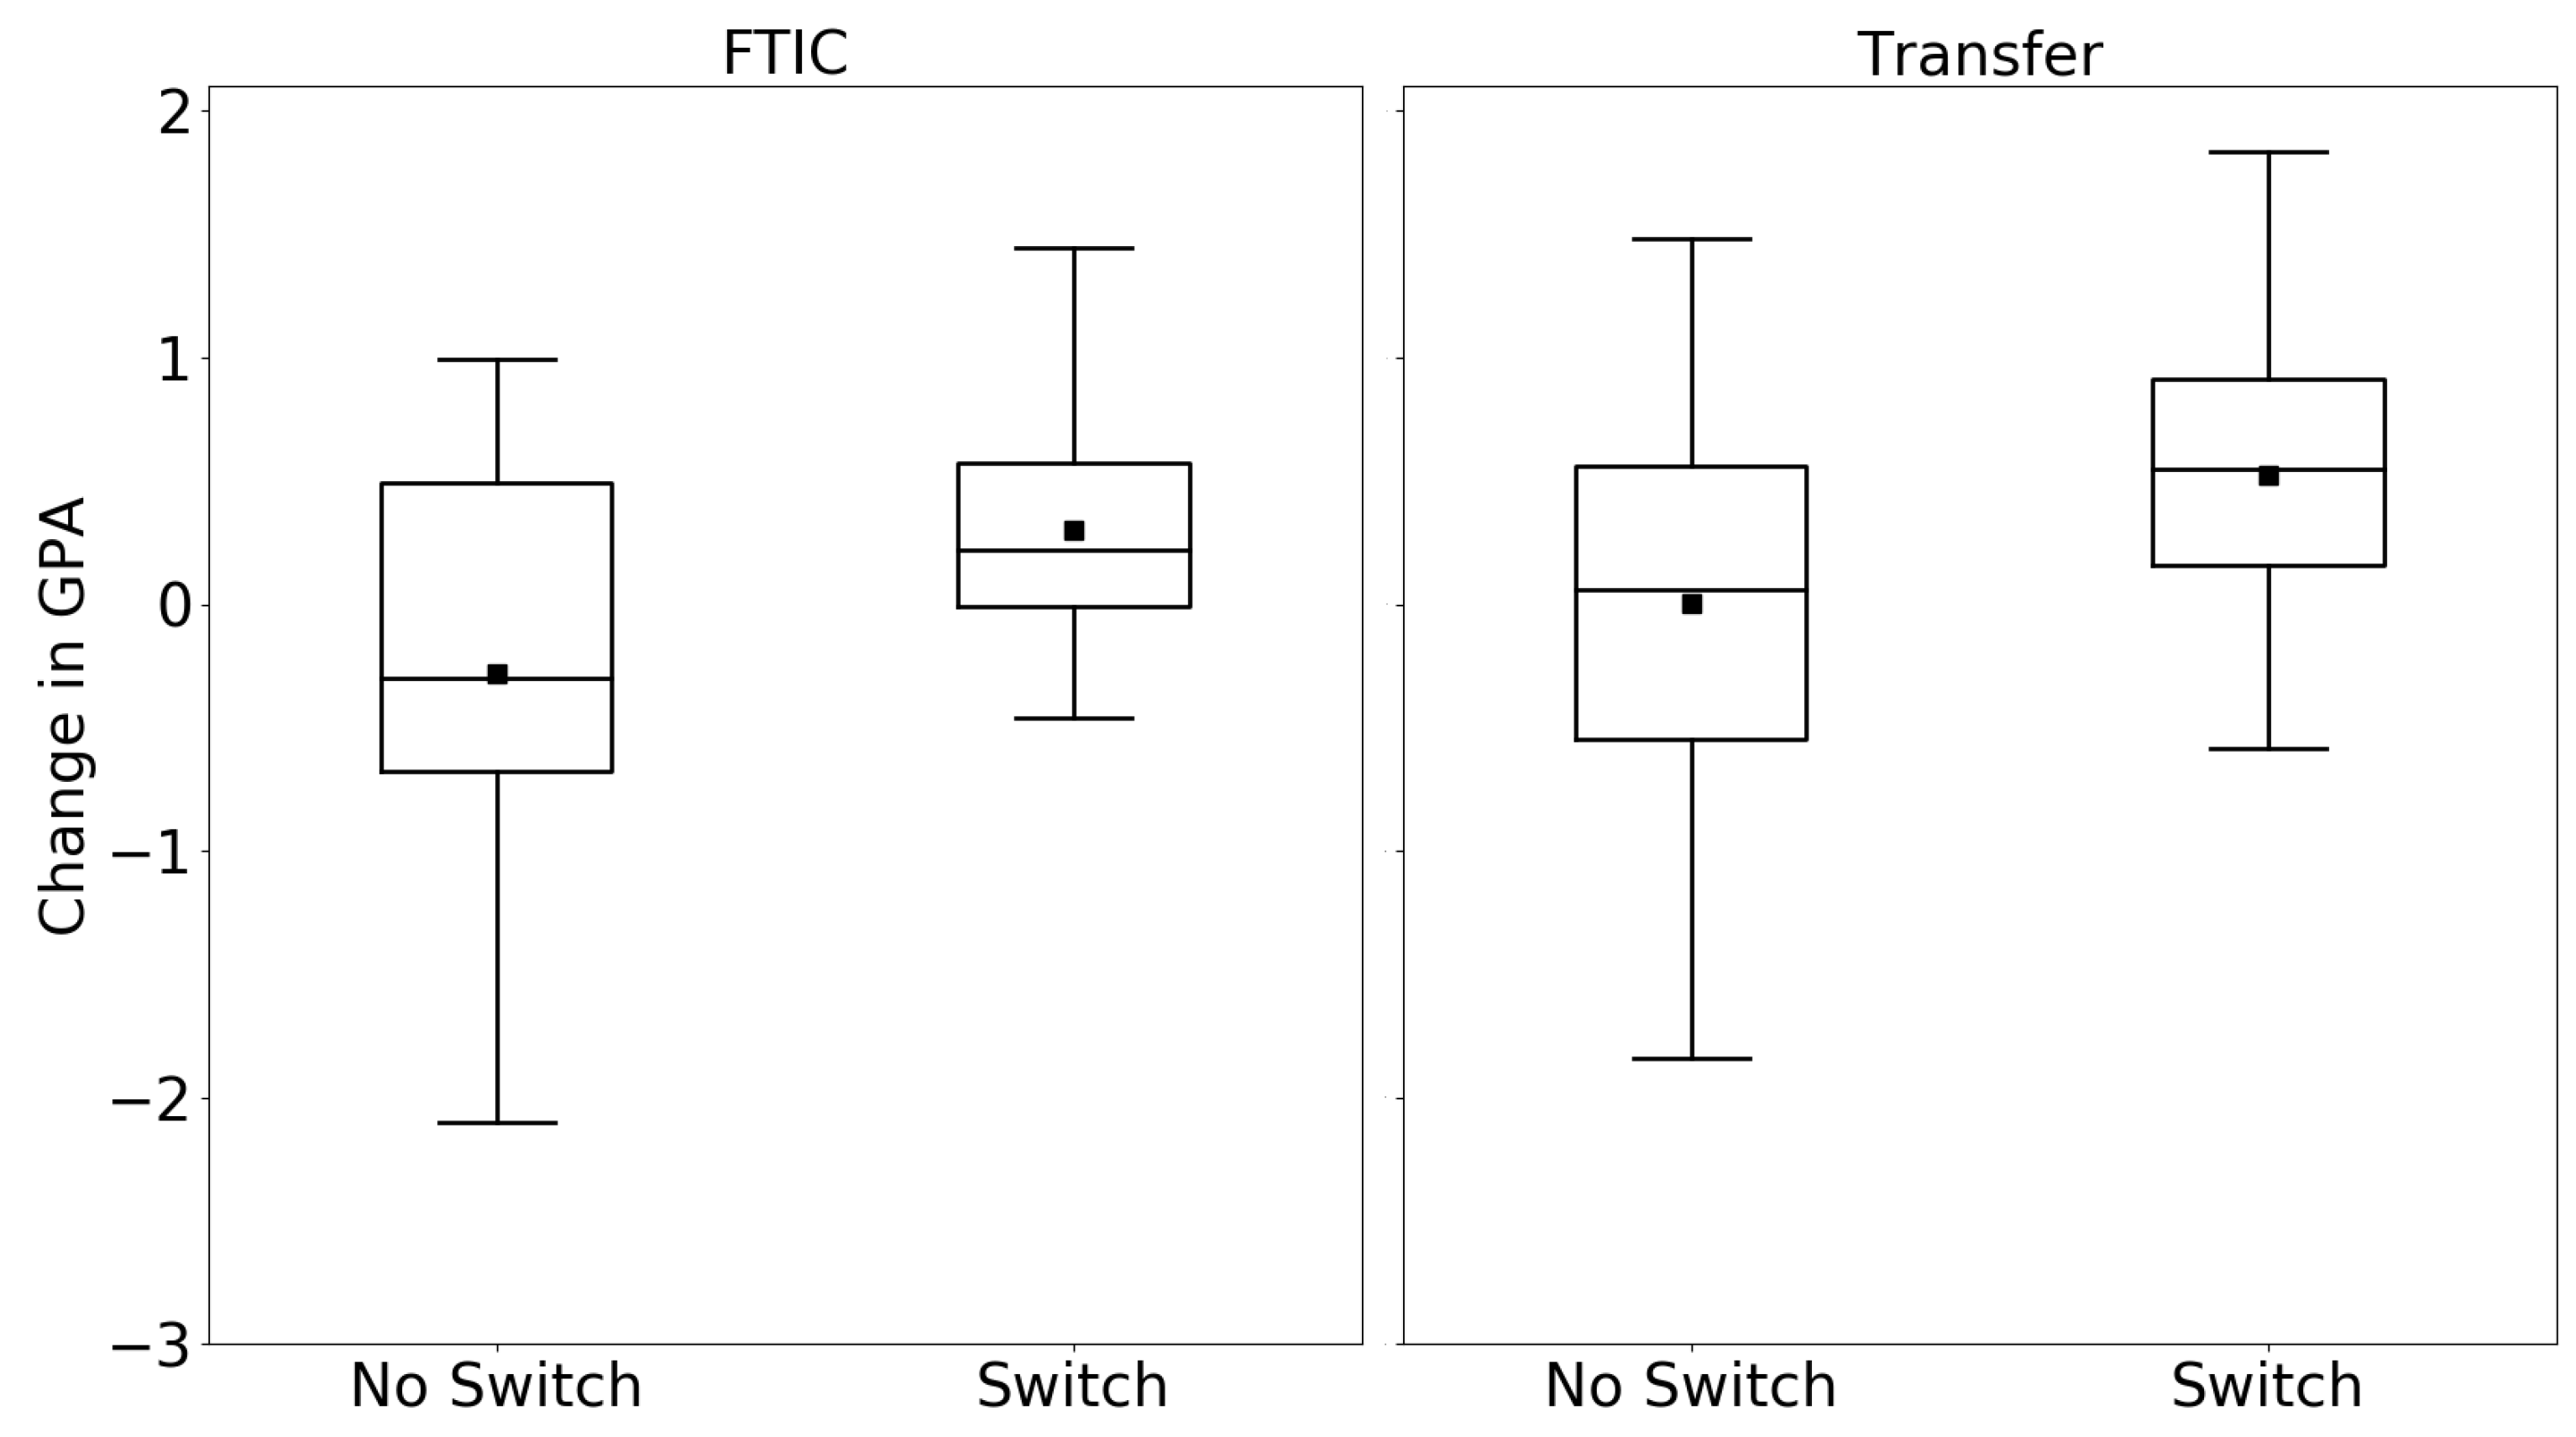
A similar analysis is conducted for students who switch their enrollment strategies from MES to FES. Two groups of students are considered: students who change their enrollment strategies after three MES semesters to FES, and students who maintain their enrollment strategies as MES. Again, both groups are selected from the same colleges with similar GPAs at the end of the third semester. For those FTIC students who switch their policy in the fourth semester, the average difference in GPA between the fourth semester and mean of the first three semesters is +0.30, while for students who stay MES, this difference is averaged at −0.28. These values for transfer students are +0.53 and +0.004 for students who do and do not switch, respectively. These results are shown in
Figure 12.
Hypothesis t-test for average GPA before and after switching for both FTIC and transfer students shows that the differences are statistically significant. Similar to the analysis we made for FES to PES strategy switch, we have conducted a two-way ANOVA test to identify if changes in GPA for the student who switches from MES to FES is impacted by their colleges of enrollment.
Table 21 and
Table 22 summarize the Anova test results for FTIC and transfer students, respectively. Our findings are identical with the previous analysis in that the switching variable (with
p-value <
) is the only factor affecting students’ GPA.
Key Finding 11: All Students: Switching from FES to PES: For students who switch from FES to PES, the probability of halting increases, while their GPA is more likely to decrease.
Key Finding 12: All Students: Switching from MES to FES: For students who switch from FES to MES, the probability of halting decreases, while their GPA is more likely to increase.
Taken all together, while not proving causality, the analysis above helps to support the claim that selection and employment of an FES and MES enrollment strategy improves academic outcomes over a PES strategy. Nonetheless, the relation between students’ academic performance and changes in enrollment strategies requires a more thorough investigation. Although these two are commonly interconnected forces, it is essential to understand which acts as the trigger and when, in doing so, universities can be empowered to more efficiently identify and address early signs of academic trouble. Furthermore, while this study focuses on the effect of enrollment strategy on academic performance, in the opposite direction, the impact of students’ academic performance on their motivation to change enrollment strategies is left as an interesting topic for future studies.
This study also gives rise to an additional question regarding observed differences in performance between transfer students and FTIC students that employ a part-time strategy. Specifically, why do PES transfer students outperform PES FTIC students with respect to GPA? In
Section 8, we posited that this observation might be explained by a filtering process whereby transfer students from community college might have a history of part-time enrollment, as such they are acclimated to enrolled and performing well within this structure. Nevertheless, additional research is needed to understand other potential factors (if any) that drive this positive outcome in transfer students. Any related finding could potentially shift this paper’s major assertion that FES and MES are almost always preferred over PES, as there may exist unique conditions in which PES is a suitable strategy.
Finally, it is worth noting some limitations associated with this study. First, all the analyses in this paper were conducted within the context of universities within the United States; the criteria and ability for students to enroll full-time or part-time enrollment likely differs in other countries. Second, we restricted our study to enrollment during the Fall and Spring semesters. Thus, information regarding summer enrollment is excluded when constructing the HMM. In practice, summer enrollments may be informative and provide greater context in understanding students that employ PES and MES. While including summer data could complicate the analysis, it may reveal key information on students enrollment behavior. Third, this study was performed based on data collected at the University of Central Florida, which may yield conclusions that are not representative for other universities given it’s unique demographics (e.g., significant transfer and Hispanic study body), even within the United States. Furthermore, while UCF is an ideal candidate for conducting research through the application of machine learning techniques due its population size, the portion of students who switch their enrollment strategies is still relatively small, making it difficult to validate results. All these limitations can be perceived as potential avenues for future research.
10. Conclusions
In this paper, we examine the impact of students’ enrollment patterns on their academic performance. We developed and applied a Hidden Markov model on our data set collected from the University of Central Florida to classify students based on their enrollment strategies. This classification divides students into three categories: full-time enrollment strategy, part-time enrollment strategy, and mixed enrollment strategy. Assessing academic performance for each enrollment strategy shows that the FES groups have a higher performance compared to the MES and PES group. Meanwhile, additional analysis supported the argument that family income correlates with student selection of their enrollment strategy. All these analyses are conducted for FTIC and transfer separately.
To summarize, based on key findings 3 and 7, on average FES students exhibit better academic performance in terms of GPAs (higher) and DFW rates (lower) when compared to MES and PES students. Furthermore, when compared to transfer students, the academic performance of FTIC students appears to be more sensitive their enrollment strategies (as illustrated by key findings 6 and 7). Furthermore, key findings 8, 9, and 10 indicate that to increase graduation rates FES is always preferred, while PES is the least preferred; for transfer students, MES is an acceptable strategy as it yields a graduation rate similar to the FES group.
The significant contributions of this research are twofold. Firstly, while traditional models classify a student’s enrollment as mixed if the student has both full-time and part-time enrollment in their academic record, we used an HMM approach to introduce a new manner of classification according to multi-period full-time, part-time, and mixed strategies for students. Secondly, our quantitative assessments of each strategy emphasize vulnerability of students that employ PES, while encouraging universities to identify such students early during their studies and develop policies (financial, educational, and social) that support them in shifting towards a mixed or full-time enrollment strategy.


