Article

Damage Detection and Localization on Real Structures Subjected to Strong Motion Earthquakes Using the Curvature Evolution Method: The Navelli (Italy) Case Study

1
School of Engineering, University of Basilicata, Viale dell’Ateneo Lucano 10, 85100 Potenza, Italy
2
National Institute of Oceanography and Applied Geophysics-OGS, Borgo Grotta Gigante 42/C, 34010 Sgonico, Italy
*
Author to whom correspondence should be addressed.
Appl. Sci. 2021, 11(14), 6496; https://doi.org/10.3390/app11146496
Submission received: 31 May 2021 / Revised: 5 July 2021 / Accepted: 12 July 2021 / Published: 14 July 2021

Abstract

:
In recent years, structural health monitoring (SHM) has received increasing interest from both research and professional engineering communities. This is due to the limitations related to the use of traditional methods based on visual inspection for a rapid and effective assessment of structures and infrastructures when compared with the great potential offered by newly developed automatic systems. Most of these kinds of systems allow the continuous estimation of structural modal properties that are strictly correlated to the mechanical characteristics of the monitored structure. These can change as a result of material deterioration and structural damage related to earthquake shaking. Furthermore, a suitable configuration of a dense sensor network in a real-time monitoring system can allow to detect and localize structural and non-structural damage by comparing the initial and a final state of the structure after a critical event, such as a relevant earthquake. In this paper, the modal curvature evaluation method, used for damage detection and localization on framed structures, considering the mode curvature variation due to strong earthquake shaking, is further developed. The modified approach is validated by numerical and experimental case studies. The extended procedure, named “Curvature Evolution Method” (CEM), reduces the required computing time and the uncertainties in the results. Furthermore, in this work, an empirical relationship between curvature variation and damage index has been defined for both bare and infilled frames.

1. Introduction

Structural health monitoring (SHM) is a topic of major interest in different fields of applied engineering. In particular, in civil engineering SHM applications are becoming increasingly important since at global level a larger number of structures are subject to an advanced state of deterioration due to aging of materials or inadequate maintenance. In this regard, continuous monitoring systems can allow quick identification of structural defects and/or damage occurred, in order for effective maintenance programs for restoring optimal conditions and reducing direct and indirect costs to be planned efficiently. Furthermore, the maintenance program can be calibrated based on the real structural conditions, with a consequent reduction of intervention time and, at the same time, an increase in both safety and functionality of the building.
Nowadays, the recent developments in dynamic identification techniques allow retrieval of the characteristics of a generic system, and then to suitably calibrate numerical models able to reproduce the observed behavior under certain operating conditions (i.e., weak- and strong-motion conditions).
Over the past few decades, the application of such techniques in structural engineering has considerably increased due to the awareness that the dynamic properties of a building can provide a reliable overview of the state of integrity of the monitored structure. Considerable progress has been made in the field of structural monitoring and dynamic identification, using approaches based on the analysis of the variations of wave propagation [1,2,3,4,5,6,7] and on the techniques operating in the time-frequency domain [8,9,10,11,12,13,14,15,16,17]. The latter are particularly effective when the structural dynamic characteristics rapidly change over time. After an event generating strong motion, the rapid and reliable evaluation of damage on strategic structures and infrastructure in the epicentral area is of major importance for Civil Protection authorities. SHM may be used for rapid and first order assessment in order to provide, in near real-time, reliable information about a system’s performance during and after critical events (such as earthquakes, explosions, etc.). The possibility to remotely monitor the state of health of an instrumented structure and detect potential damage during a critical event could also be used as an indicator to calibrate a damage scenario, also providing several benefits in reducing the potential loss of life and injuries and improving the effectiveness of a potential emergency response in case of a disaster.
It is well known that the presence of damage on any type of structure is able to change the dynamic characteristics of the structural system. Several methods for damage detection are based on the evaluation of the variation of these characteristics, called modal parameters (frequency, mode shape, equivalent viscous damping) or non-modal parameters (e.g., operational deflection shapes) [18,19,20,21,22,23,24,25,26,27,28,29]. The presence of damage is detected by variations in these parameters in the damaged configuration compared to the reference state (undamaged) evaluated before the event (sometimes seconds before an event for continuously monitored structures). There are several approaches that allow such comparisons [30,31,32,33,34,35,36,37,38,39,40,41,42] to be made. It has been observed that methods based on the analysis of variations in the modal shapes and/or their derivatives, such as the mode curvature, are very effective [1] and can also be used as a diagnostic tool for structural and/or non-structural damage localization and quantification.
The aim of this paper is the upgrade of an existing method for damage detection and localization on framed structures based on the evaluation of the modal curvature evolution over time [1], reducing the number of steps of the method from three (before, during and after) to two (before and during) significant time instants that must be evaluated to correctly apply the damage detection method, reducing uncertainties associated to all the variables included within the procedure and, as a consequence, the calculation time. The aim of this approach is to detect structural damage and to localize the most damaged stories, using a series of accelerometers installed on the monitored structure at each floor level. An extensive campaign of numerical simulations of regular and irregular models of reinforced concrete structures designed only for gravity loads without and with the presence of infill panels was carried out. Compared with the first version of the method [1], a correlation between the maximum curvature variation and maximum inter-story drift has been defined in this work. Furthermore, the method has been applied to an experimental case study in order to test its effectiveness considering a real accelerometric dataset.

2. Materials and Methods

Curvature evaluation method is based on the evaluation of modal curvature variation over time, [1]. The method uses a narrow-band-time-variable filter [10] to isolate the fundamental modal shape over time, as well as during the phase of maximum nonlinearity (strong motion phase). This makes it possible to estimate and localize the occurring damage during the seismic event by evaluating the modal curvature evolution over time. In other words, this filter is able to extract from a nonstationary and/or nonlinear signal only the energy content of interest, preserving both the amplitude and phase in the region of interest for each time instant [8,10].
The band-variable filter is based on the Stockwell Transform [43], a time–frequency representation of a time-series that overcomes the limitations due to the assumptions of stationary behavior. Under the assumption of linear behavior over a short time interval, the S-transform allows analysis of the nonlinear behavior of any dynamic system, also during strong motion phases [44]. The Stockwell Transform operates simultaneously in both the time and frequency domains.
The novelty of the approach presented in this present paper consists of the evaluation of the mode curvature difference. Firstly, the modal shape variation has been evaluated between different stories before and after the strong shaking phases and, secondly, at different time instants.
The Procedure for Damage Localization (PDL) involves several steps:
  • Identification of the fundamental frequency of the structure in the time-frequency domain by analyzing the top floor’s relative accelerometric recordings (difference between top and bottom instant acceleration values, see Figure 1);
  • definition of a filtering matrix, using the band-pass-time-variable filter, fitting the evolution over-time of the fundamental frequency of the monitored structure (evaluated in the previous step);
  • convolution of the filtering matrix with the Stockwell Transform of the signal recorded at each floor, along the same direction for all floors;
  • evaluation of the variation of the fundamental mode shape and related mode curvature over time (time instants A and B, see Figure 1);
  • computation of the mode curvature differences among floors at different time steps (see Equations (2) and (3));
  • selection of two different time instants (one immediately before the earthquake and one corresponding to the minimum fundamental frequency) and evaluation of the mode curvature difference between them (time instants A and B, see Figure 1).
In order to completely automatize the procedure, the Short Time Impulse Response Function (STIRF) procedure, as described in [45], has been used to filter the matrix selection. Using a combined approach based on the FT and on the seismic interferometric analysis, it can be a useful tool for the automatic evaluation of both fundamental frequency and related equivalent viscous damping factors of nonlinear structures.
Modal curvature can be calculated by modeling a framed structure as a beam:
W ( v , t ) = M ( v , t ) E I ( v , t ) = W ( v h , t ) 2 W ( h , t ) + W ( v + h , t ) h 2
where v is the position along the height of the monitored structure, h is a finite increment of v , M ( v , t ) is the bending moment, E I ( v , t )  is the bending stiffness, W ( v , t ) is the displacement, and W ( v , t ) is the related curvature. Considering the fundamental mode shape of a framed structure as a beam displacement, it is possible to localize structural damage by analyzing the singularity on the curvature of the fundamental mode shape [46].
In the first version of the method, the damage feature was evaluated by only considering the curvature variation over time. In order to reduce the uncertainties on the damaged floor localization and to upgrade the version of the method to identify and localize the damaged level, the curvature differences among floors have been evaluated according to the following equation:
δ W ( i + 1 ) i , t = W i + 1 , t W i , t
where W i , t is the value of the curvature evaluated at the ith floor and W i + 1 , t is the value of the curvature evaluated at the (i + 1)th floor.
After the evaluation of the mode curvature variation between floors, it is necessary to evaluate the second variation of the mode curvature operating in the time domain:
Δ W t + Δ t t = Δ W B A = δ W B δ W A
where δ W A is the difference in the curvatures between floors evaluated in the time instant A, and δ W B is the difference in the curvatures between floors evaluated in the time instant B. A is a general time instant immediately before the earthquake (during the stationary behavior of the monitored structure), while B is the time instant corresponding to the minimum fundamental frequency exhibited by an oscillating building during the strong motion phase.
Figure 1 shows an example of the top floor relative accelerometric recording (evaluated as the difference in time domain with respect to the station installed at the bottom floor) and the normalized S-Transform of the signals related to the fundamental mode of vibration of the monitored structure, extracted by using the PDL described above. Analyzing the S-Transform, it is possible to follow the evolution of the fundamental frequency of the structure.
As discussed in [10], using the band-variable filter, it has also been possible to evaluate the modal shape associated with the minimum fundamental frequency (instant B) recorded during the maximum excursion in the plastic field. Particularly, CEM is based on the possibility to evaluate each structural mode shape, and its geometrical curvature, during the linear behavior in correspondence of a time instant during the stationary phase (named A, see Figure 1), where structural eigenfrequencies are constants, and during the nonlinear phase of the structural response in correspondence of the minimum value of recorded fundamental frequency (named B).

3. Numerical Applications

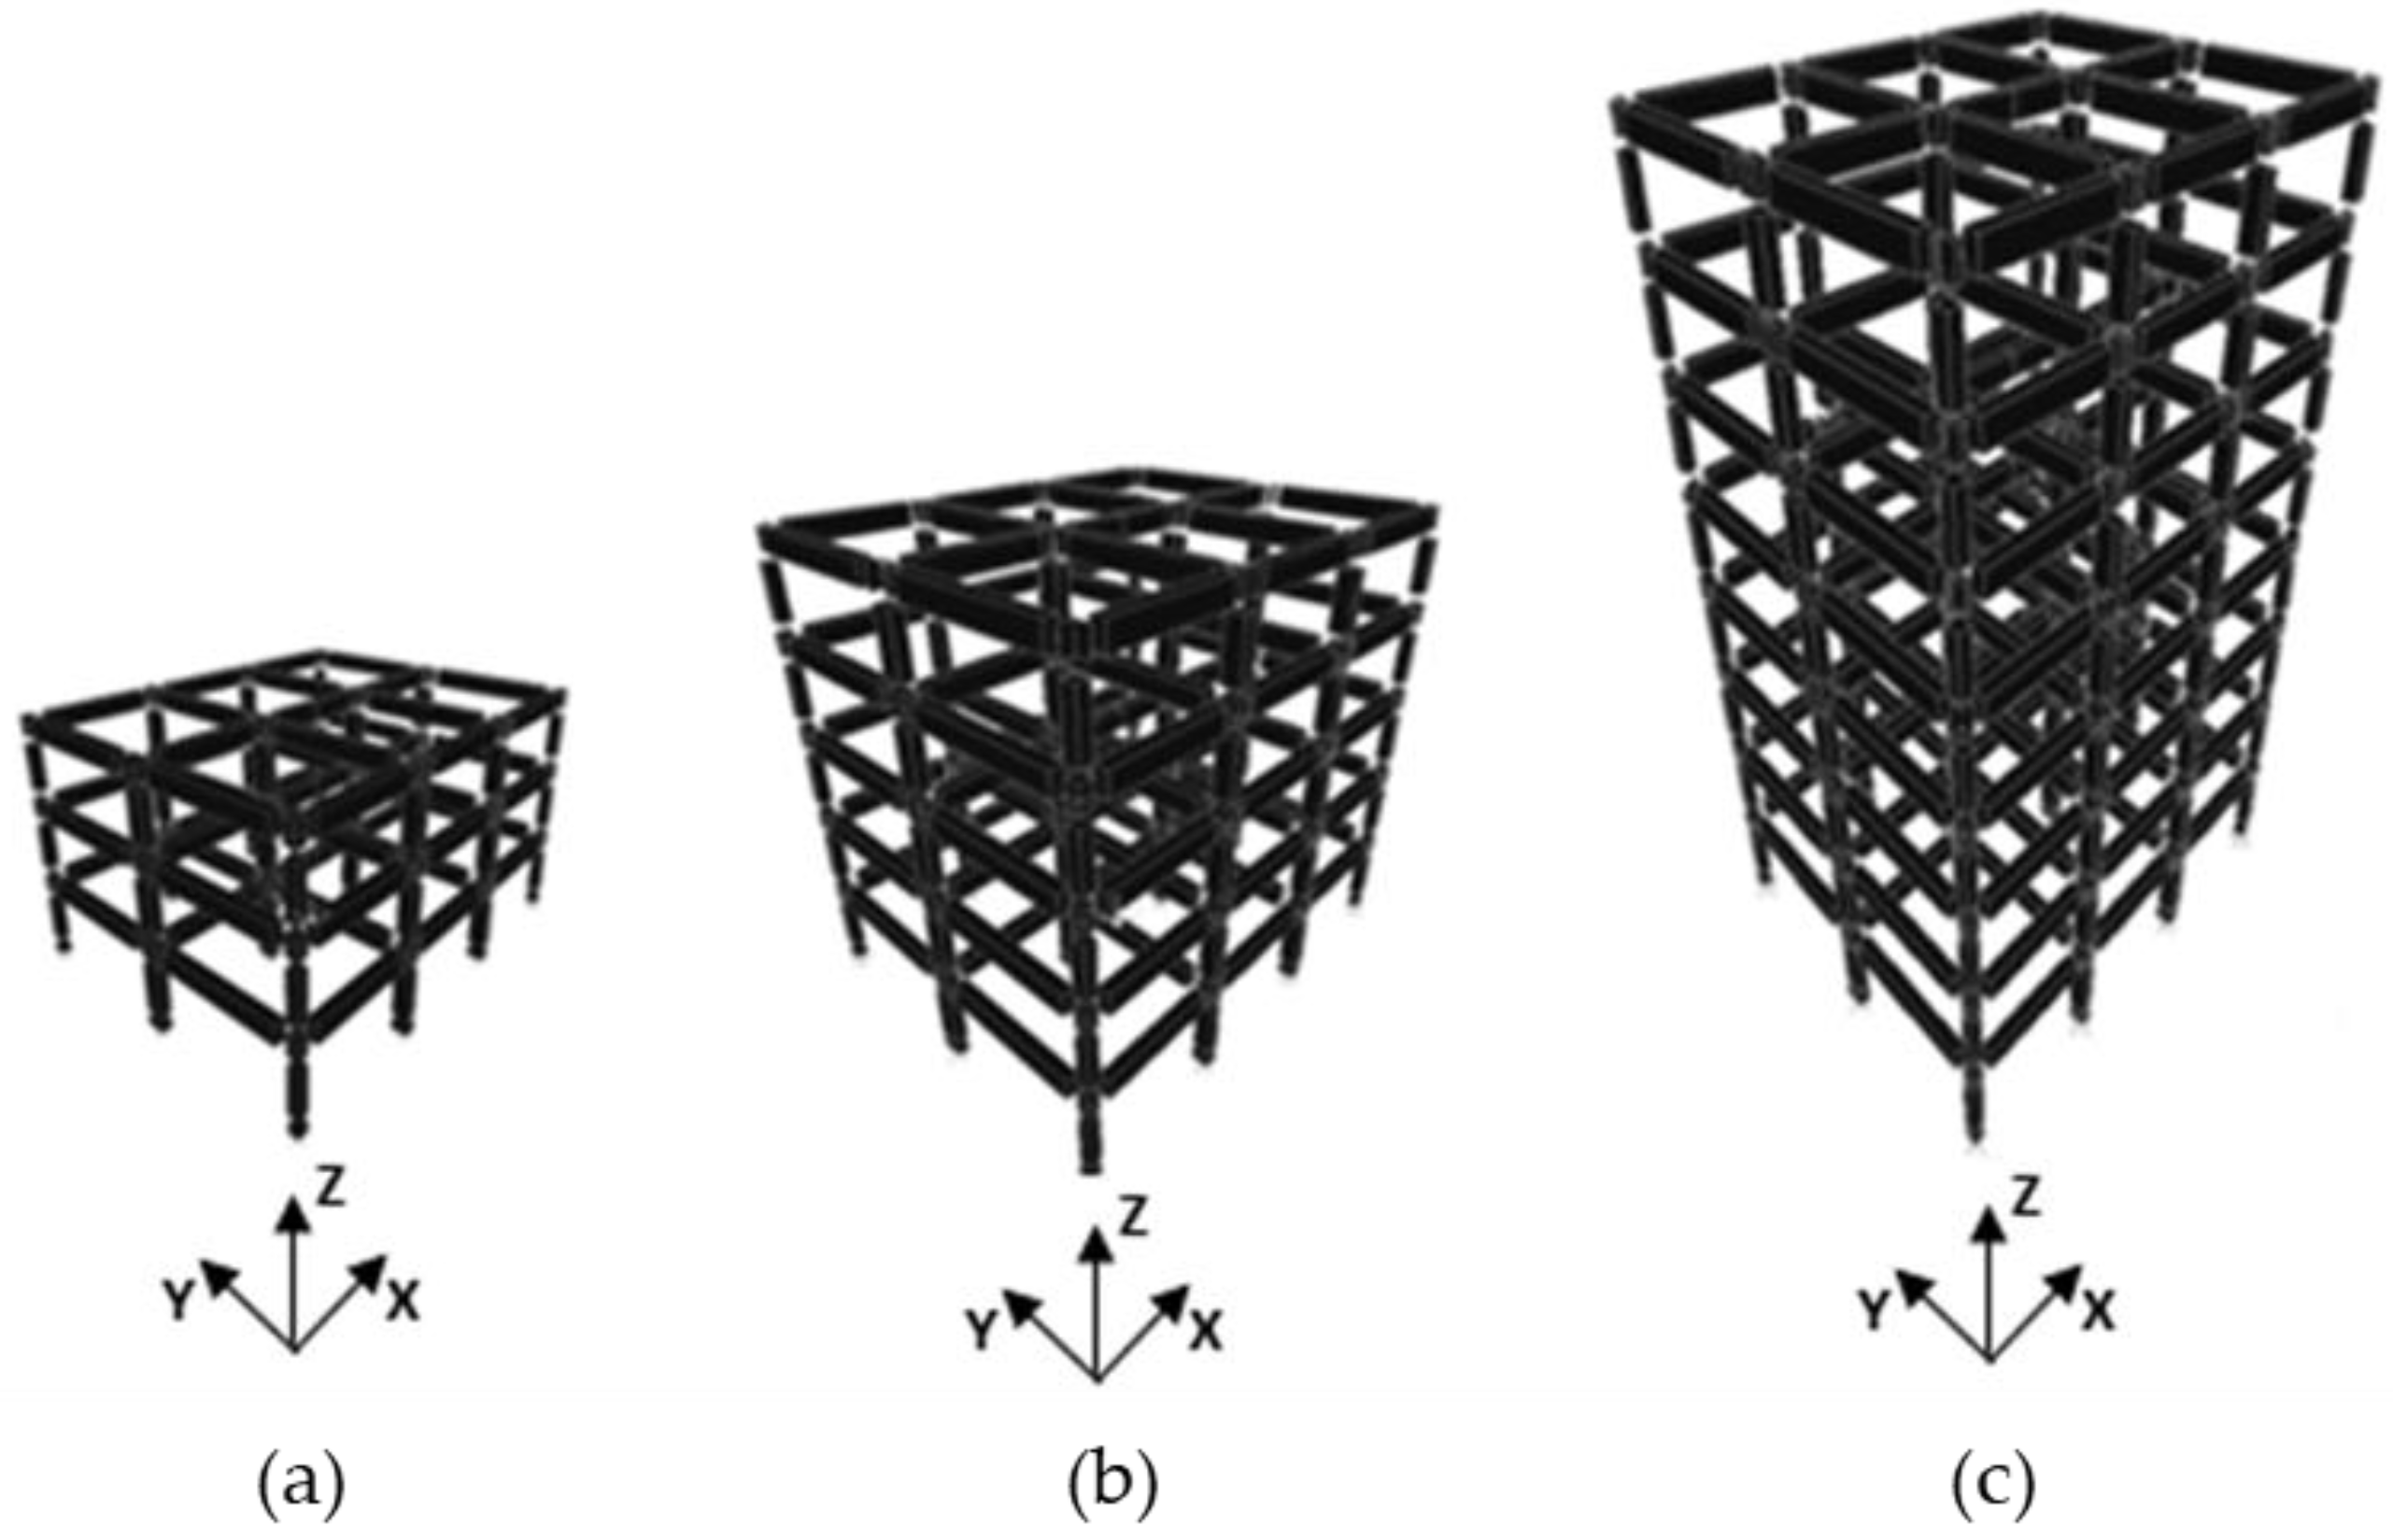
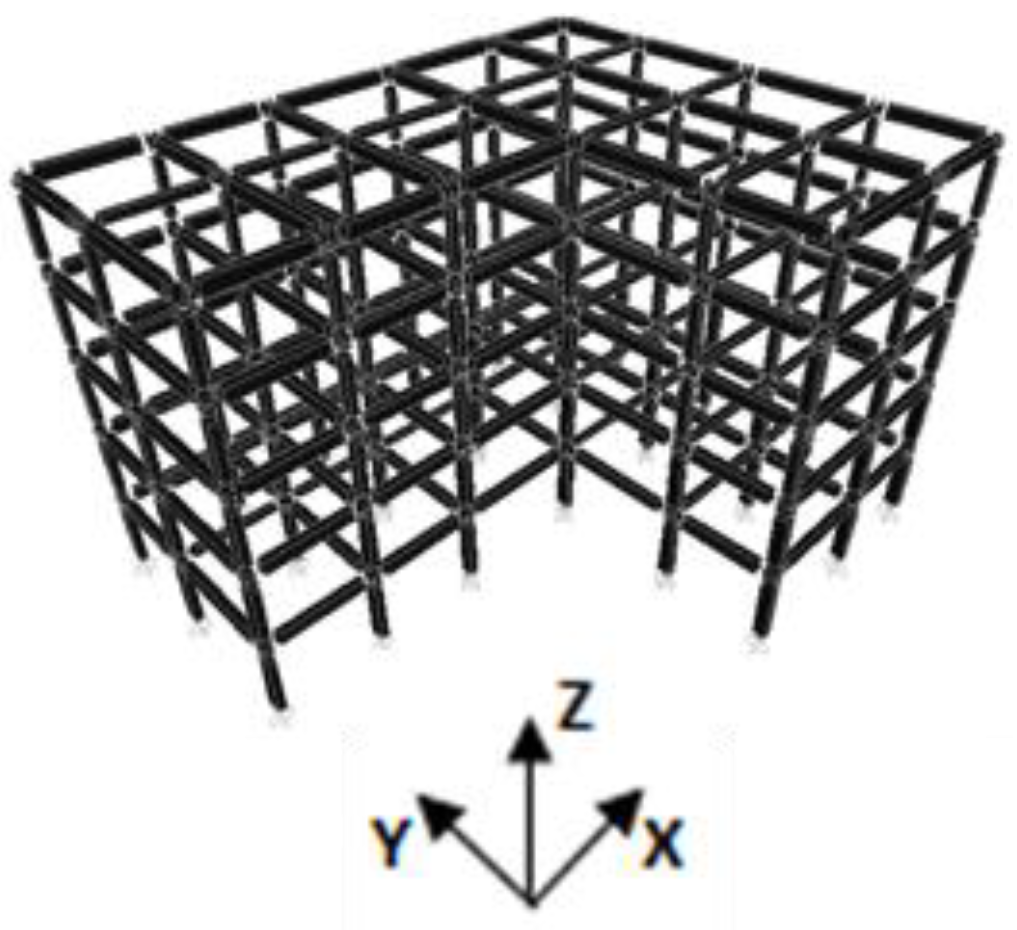
In order to test and verify the performance of the upgraded Curvature Evolution Method (CEM), the method has been applied to several nonlinear numerical models representative of realistic reinforced concrete framed structures characterized by 3, 5 and 8 floors, with regular and irregular geometric plans designed by considering only gravity loads (Figure 2 and Figure 3). The inter-story height is constant and equal to 3 m, resulting in a total height of the buildings equal to 9 m, 15 m and 24 m, respectively. With reference to the mechanical properties of the materials adopted in the numerical models, the concrete is characterized by a compressive strength equal to 25 MPa, whereas the steel by a yield stress equal to 380 MPa. Reinforced concrete floors with a thickness of 25 cm have been considered. The dead load was set as 5 kN/m2, while the live load was 2 kN/m2.
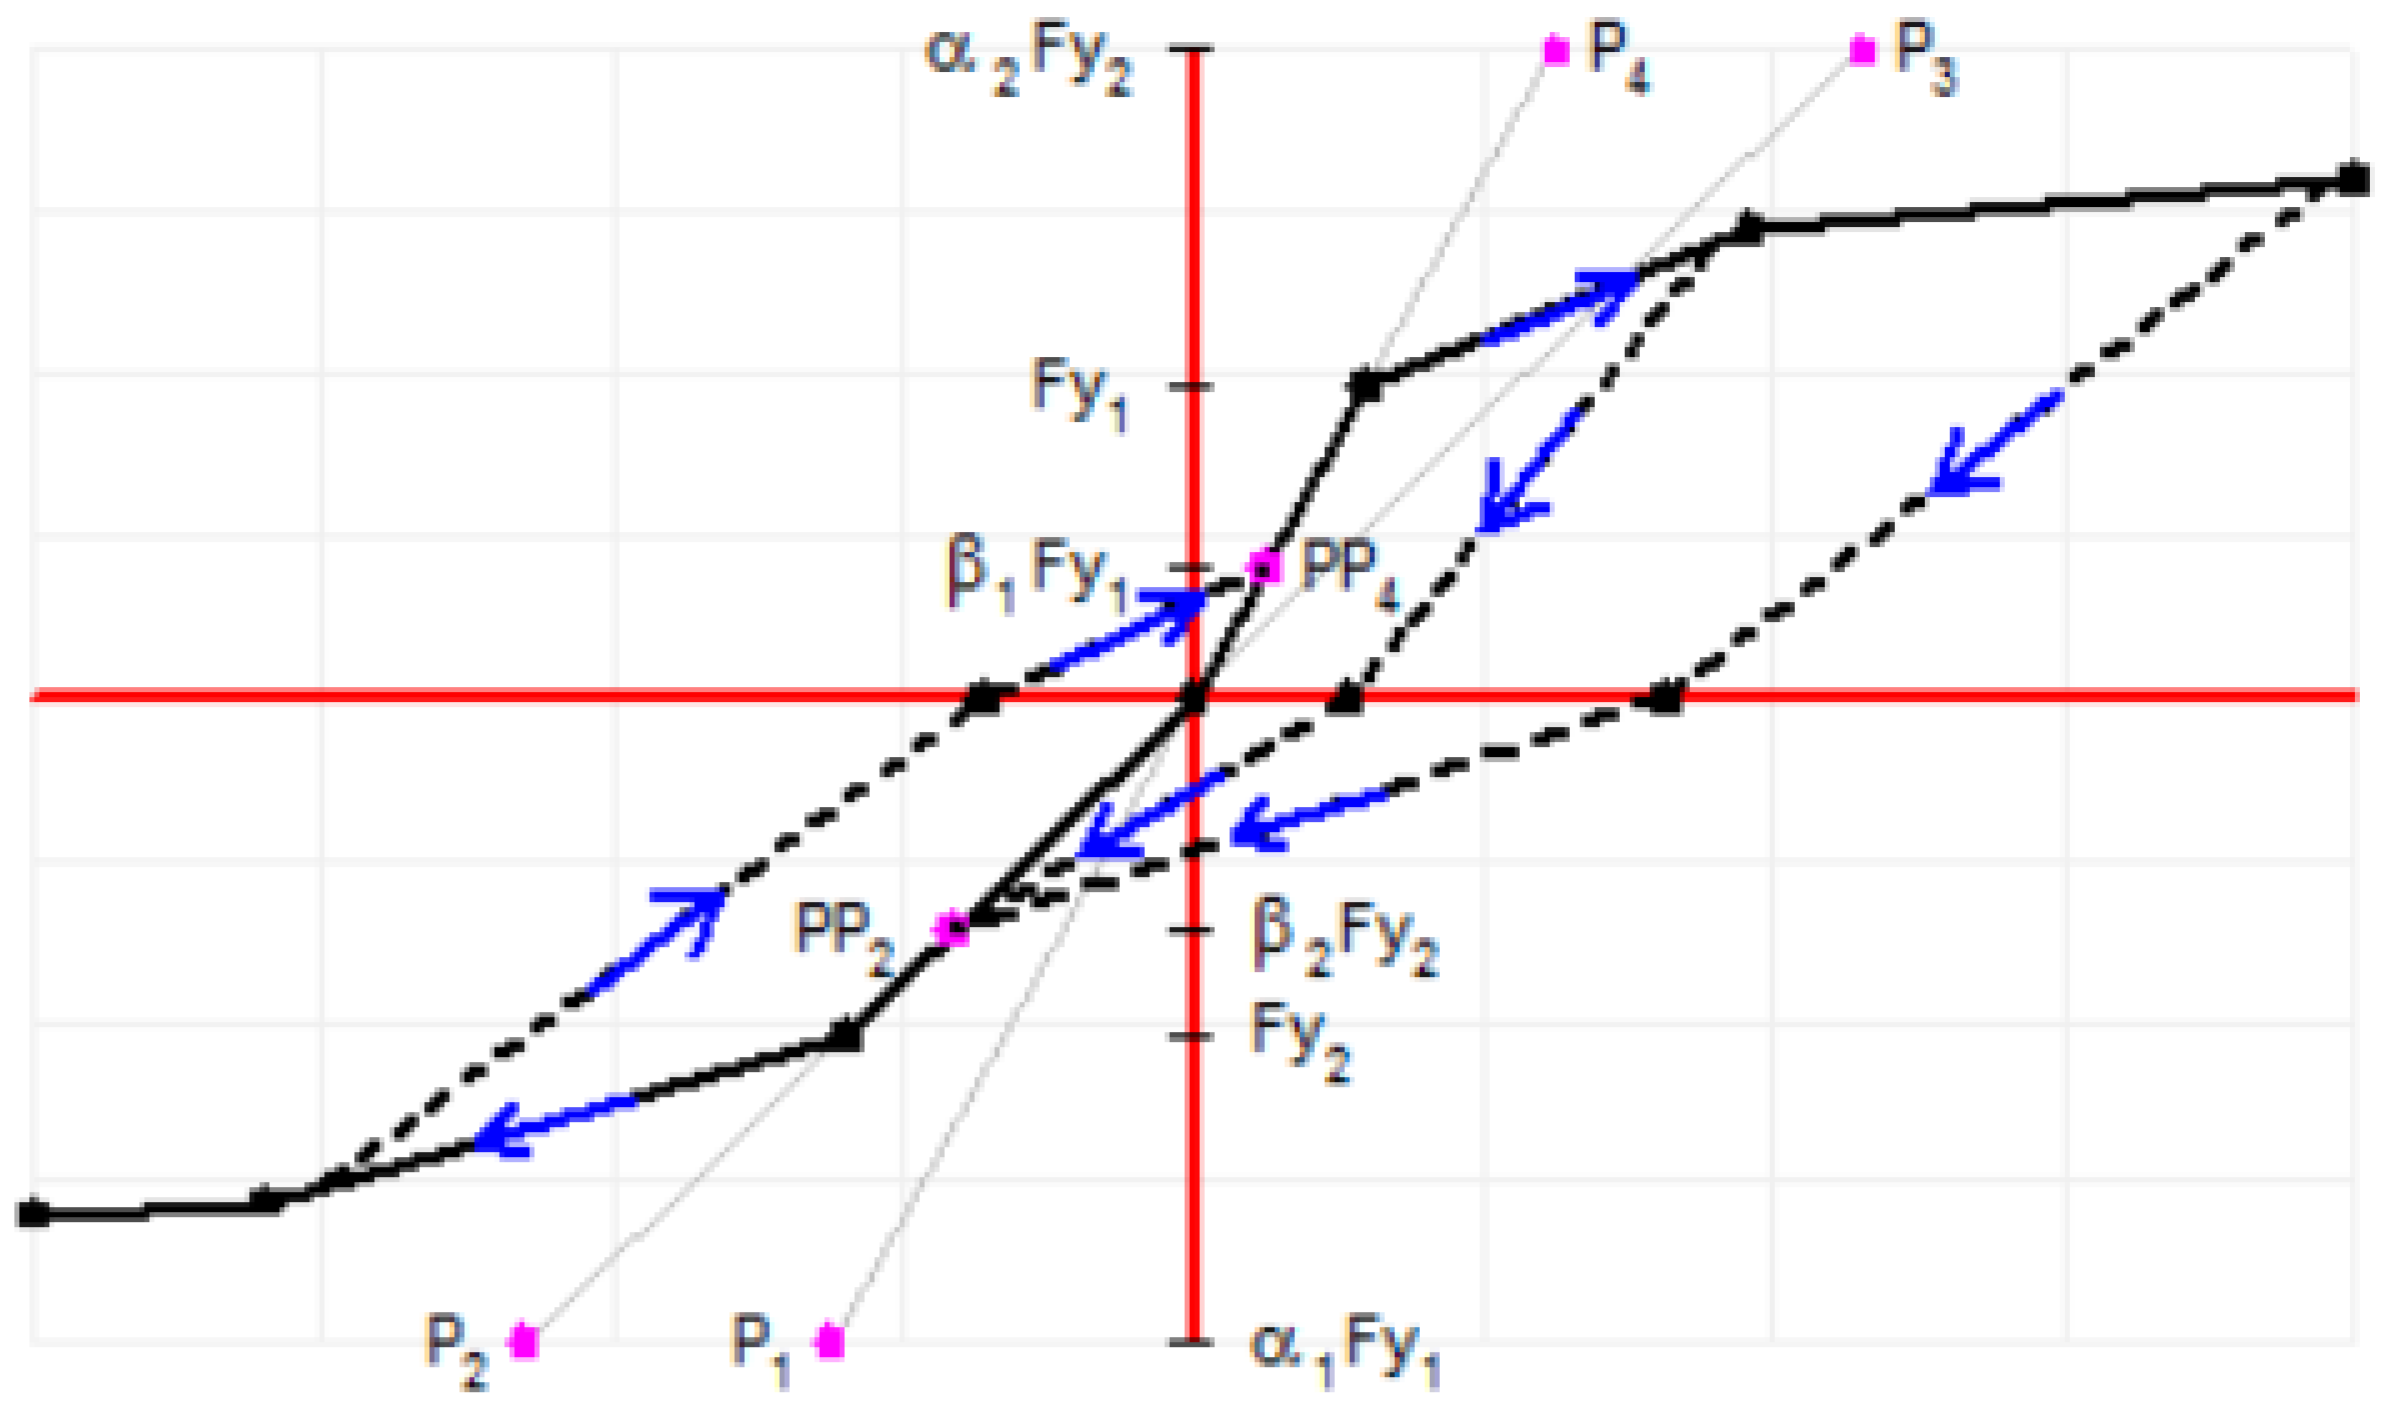
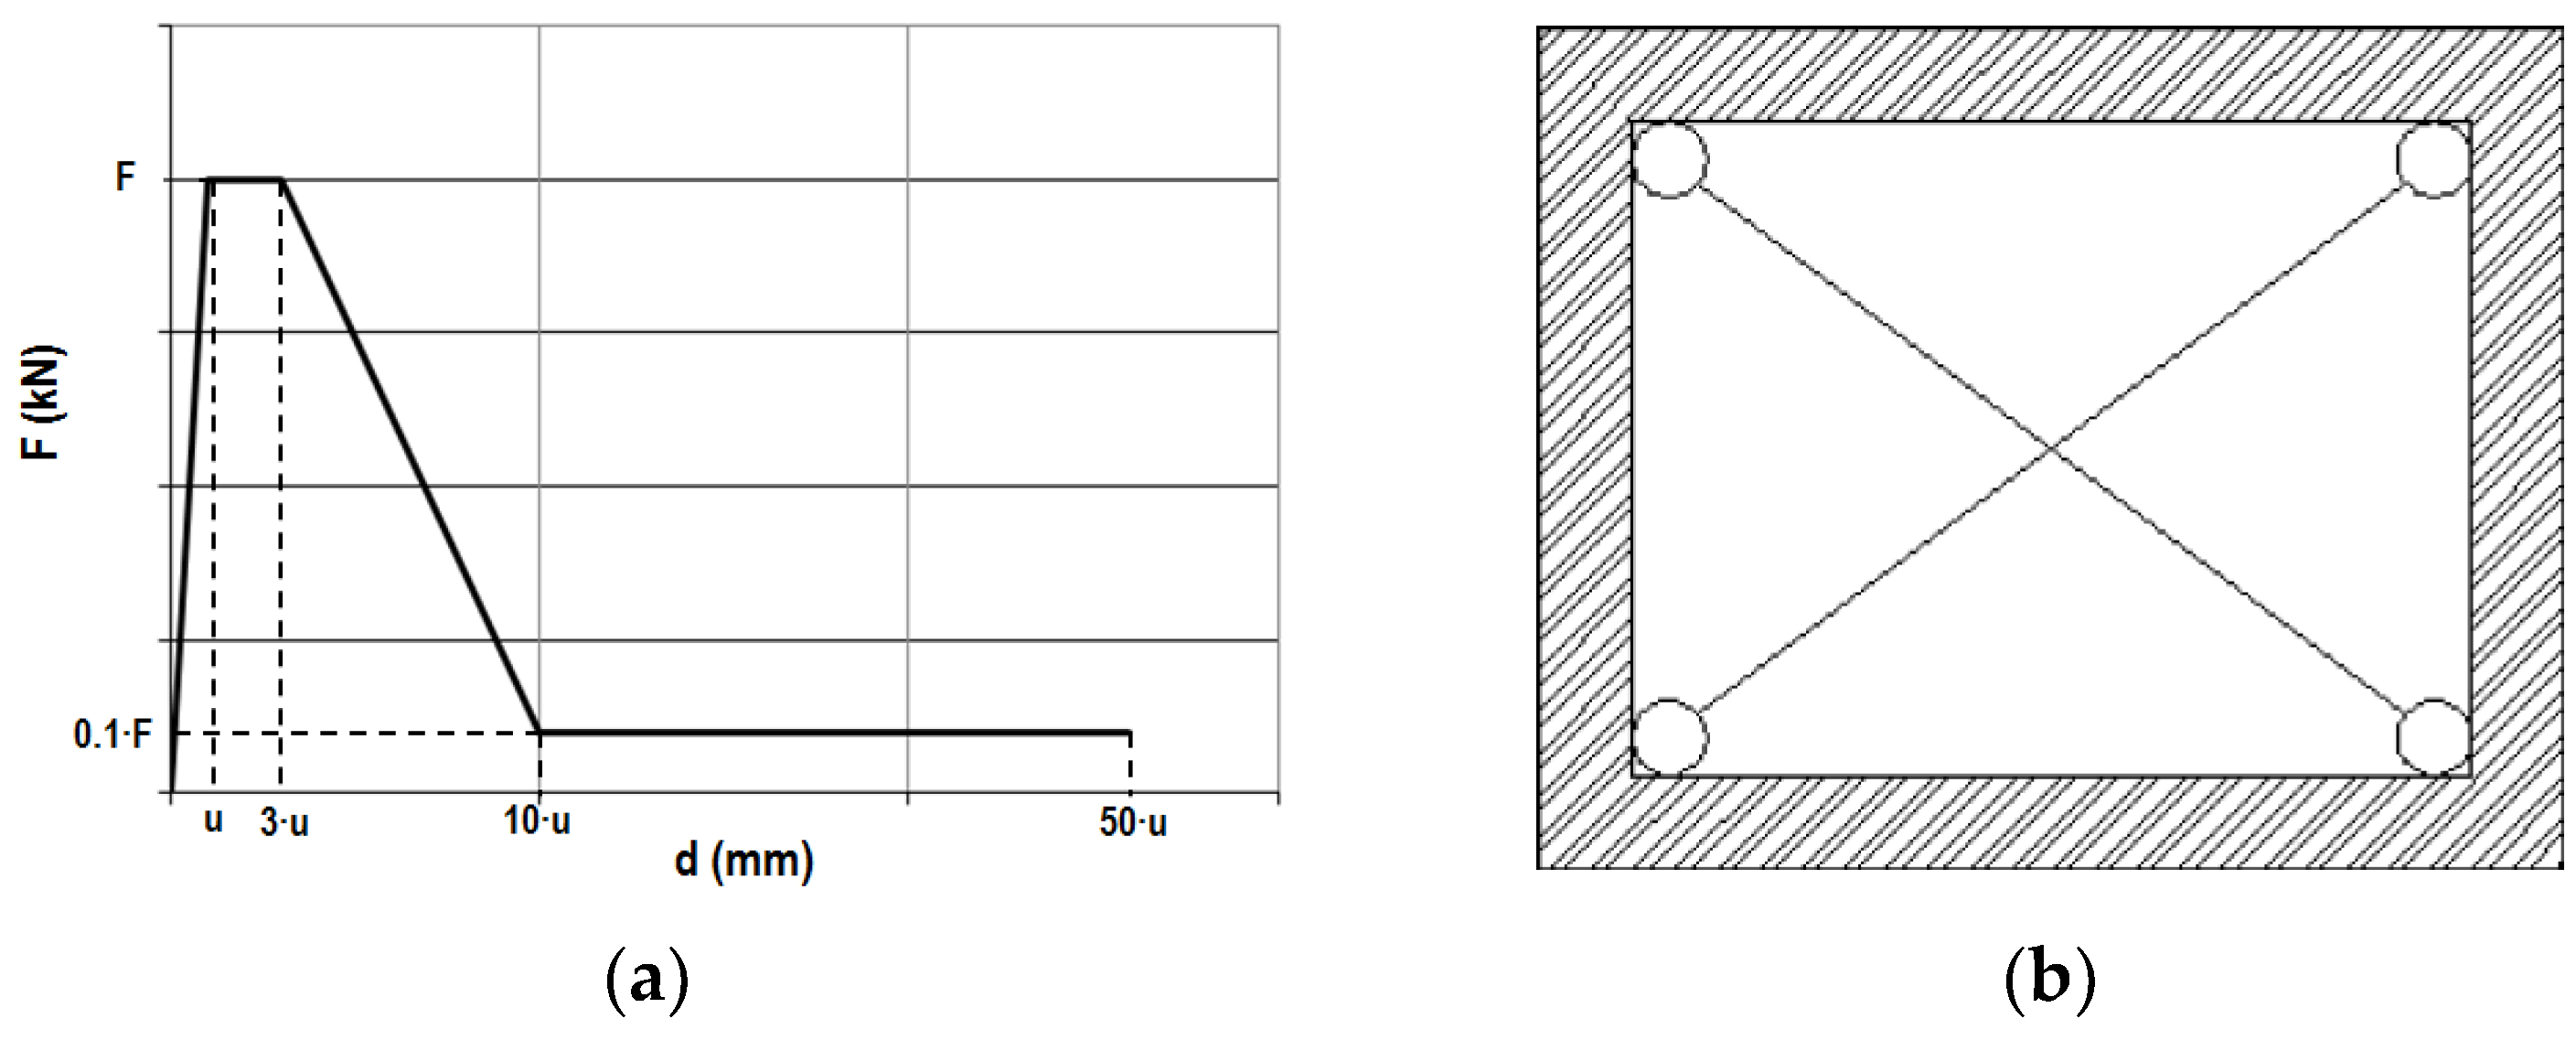
Nonlinear numerical analyses have been carried out using a software tool based on nonlinear finite elements (SAP2000 non-linear [47]). A kinematic constraint has been added to each floor to simulate the slab as rigid diaphragms. Structural elements, such as beams and columns, were modeled with type elements “FRAME”, while the non-linear characteristics have been applied using the “LINK” elements. Link elements and plastic hinges were introduced at the ends of both beam and column elements to simulate the structural nonlinear behavior during a strong ground motion. Link elements have a Pivot hysteretic behavior, while plastic hinges have an axial load-dependent one. Rigid offsets at beam-column joints have been considered. Figure 4 shows the Force-Deformation relationship of the link elements used for the nonlinear numerical analyses. The masses were considered distributed on the structural elements.
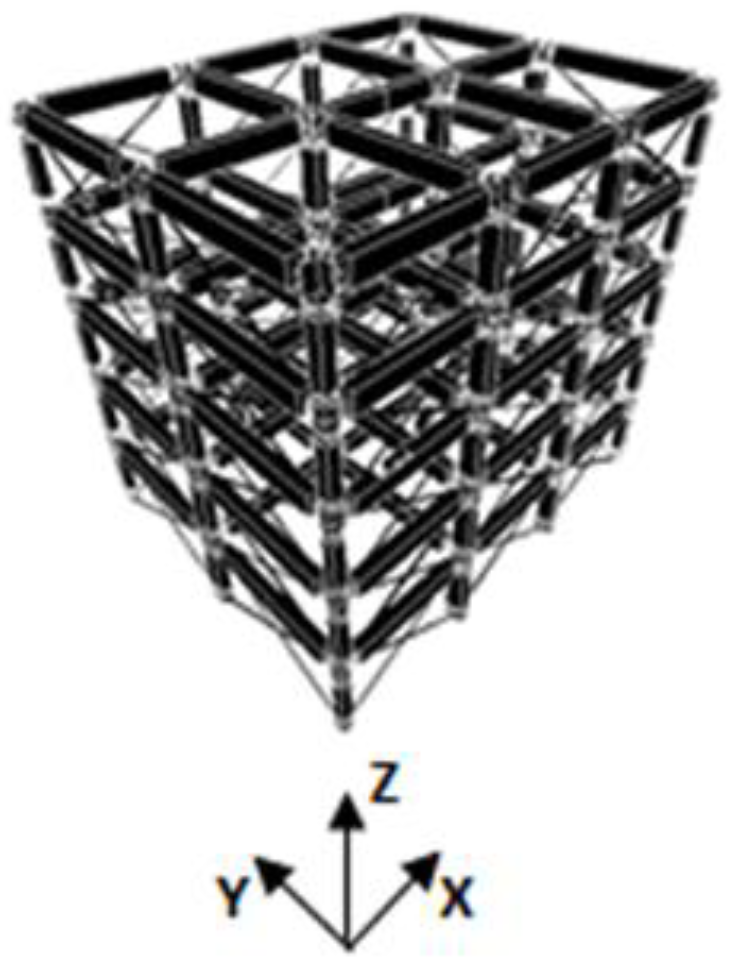
In order to define the damage threshold of even the non-structural component, the numerical simulations have been carried out by modeling the effects caused by the presence of infill panels within the structural R/C framed models (Figure 5).
Both the masonry strength and stiffness contribution have been considered by introducing two equivalent structural elements in the models. The mechanical characteristics of these elements were evaluated considering the Mainstone model, through the Equation (4) [48]:
b w = d w · 0.20 · s i n   s i n   2 θ · ( E w · t w · h w 3 · s i n s i n   2 θ   E c · I p ) 0.1 1 10 d w  
where b w is the equivalent width, h w is the panel height, d w is the strut length, t w is the panel thickness, θ is the angle that the strut forms with the horizontal line, E w is the elastic modulus of the panel, chosen as 2000 N/mm2, E c is the elastic modulus of the concrete and I p is the moment of inertia of the columns.
In the simulation, a 12 cm + 8 cm thick panel has been considered. Using the SAP2000 finite elements program, these elements were modeled using multi-linear plastic links. The Force-Displacement behavior of the Mainstone model is depicted in Figure 6a. Concentric connection of the equivalent diagonal struts has been considered in the modelling strategy (Figure 6b). This sees a fundamental period of vibration of the 5-story infilled numerical model to be 0.51 s. Table 1 reports the value of the fundamental periods of vibration of the numerical models.
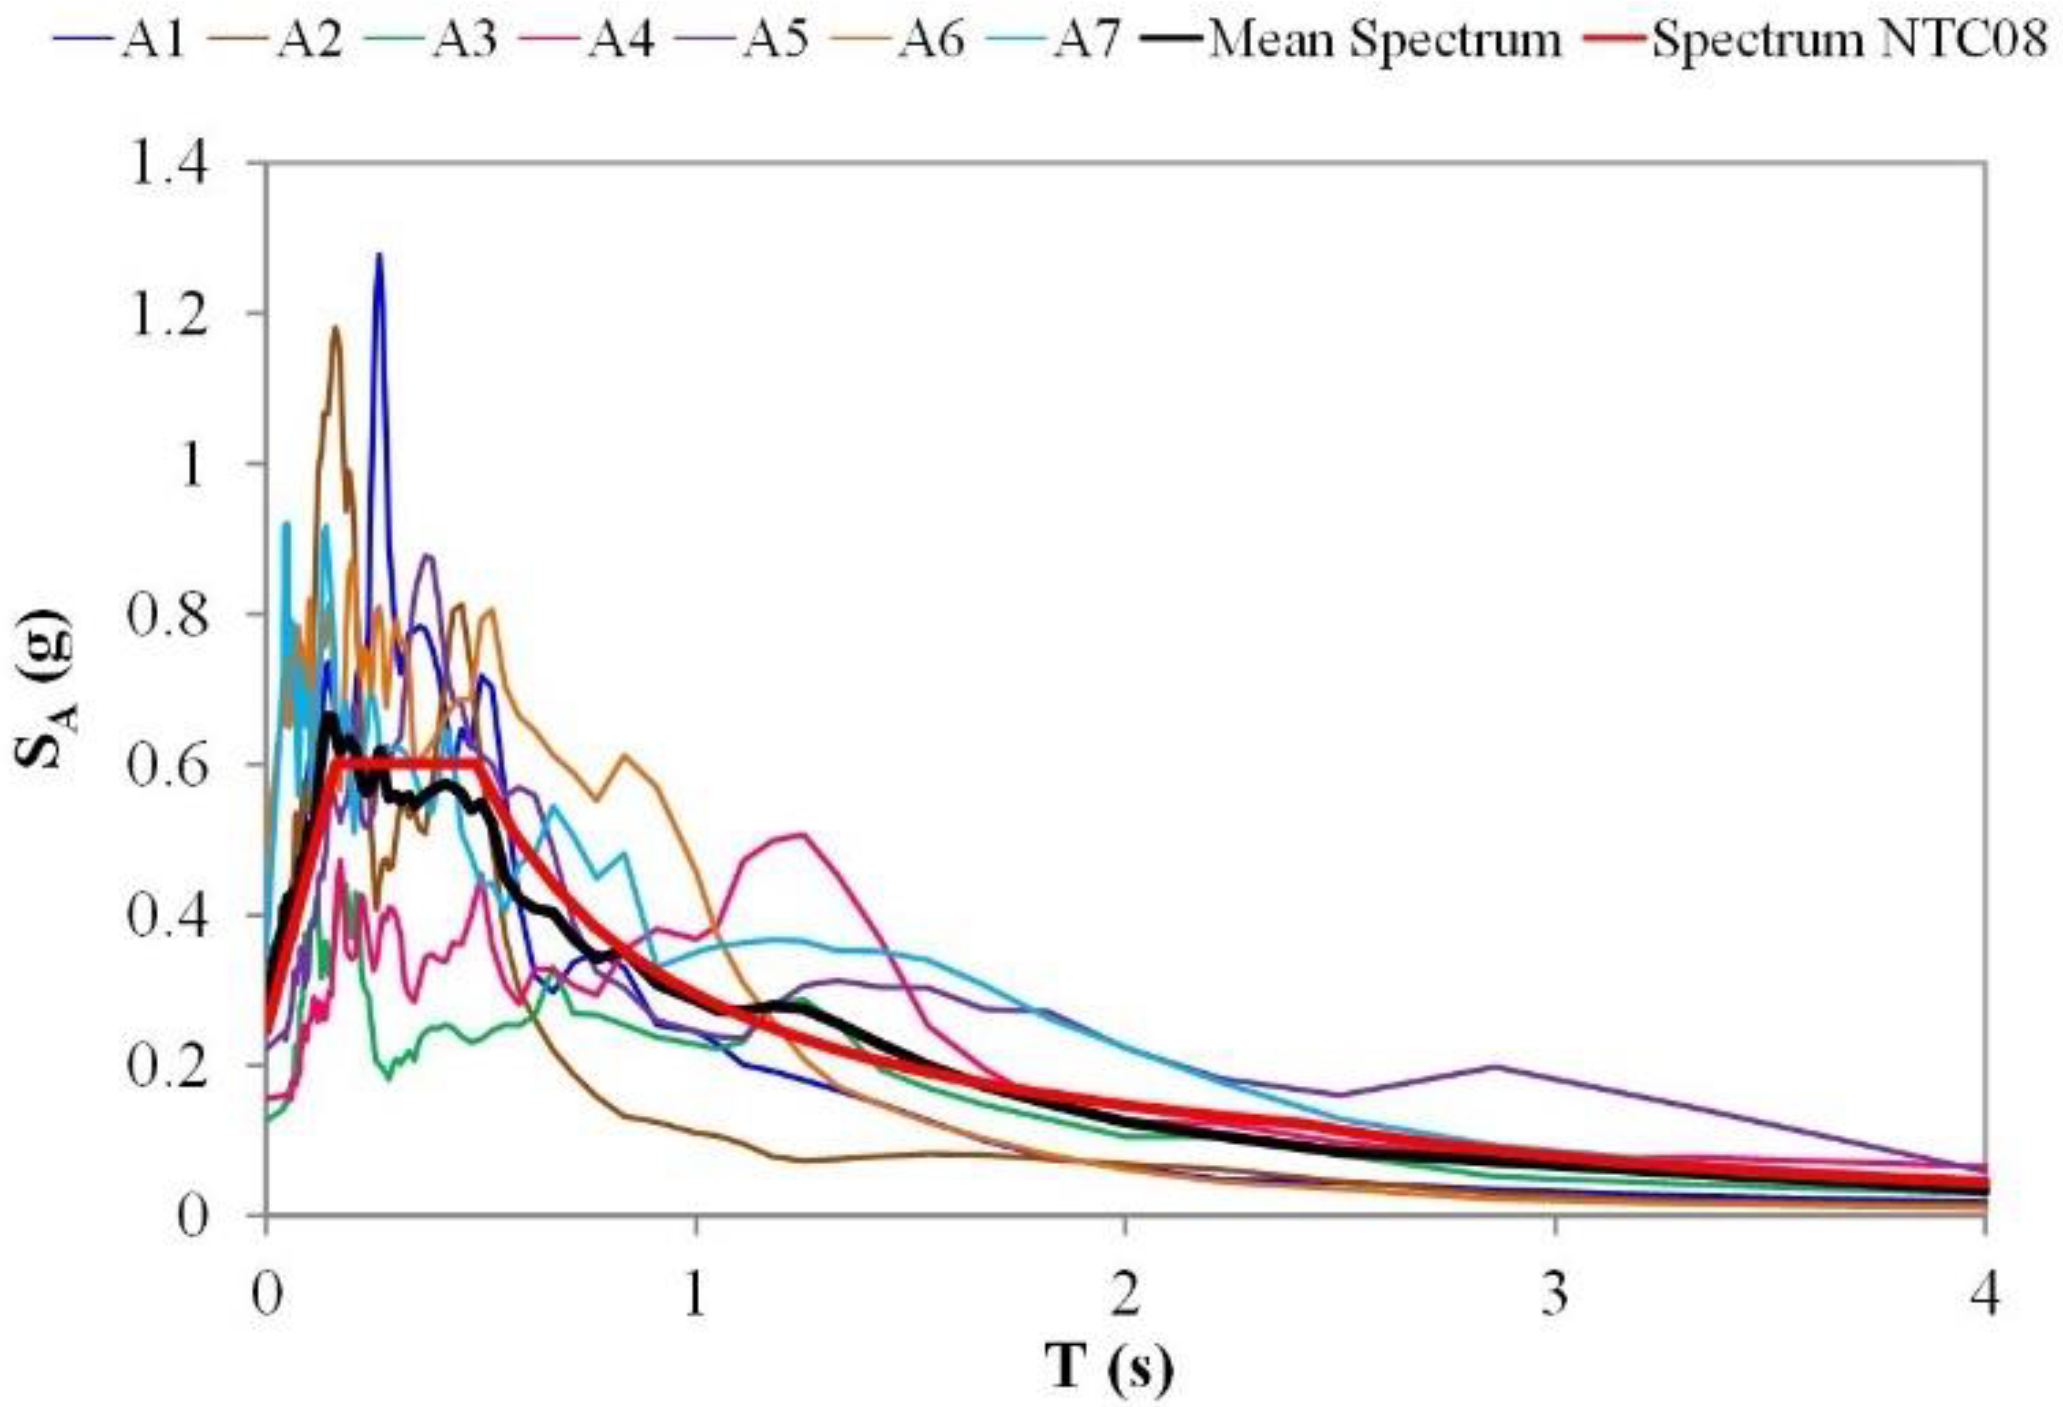
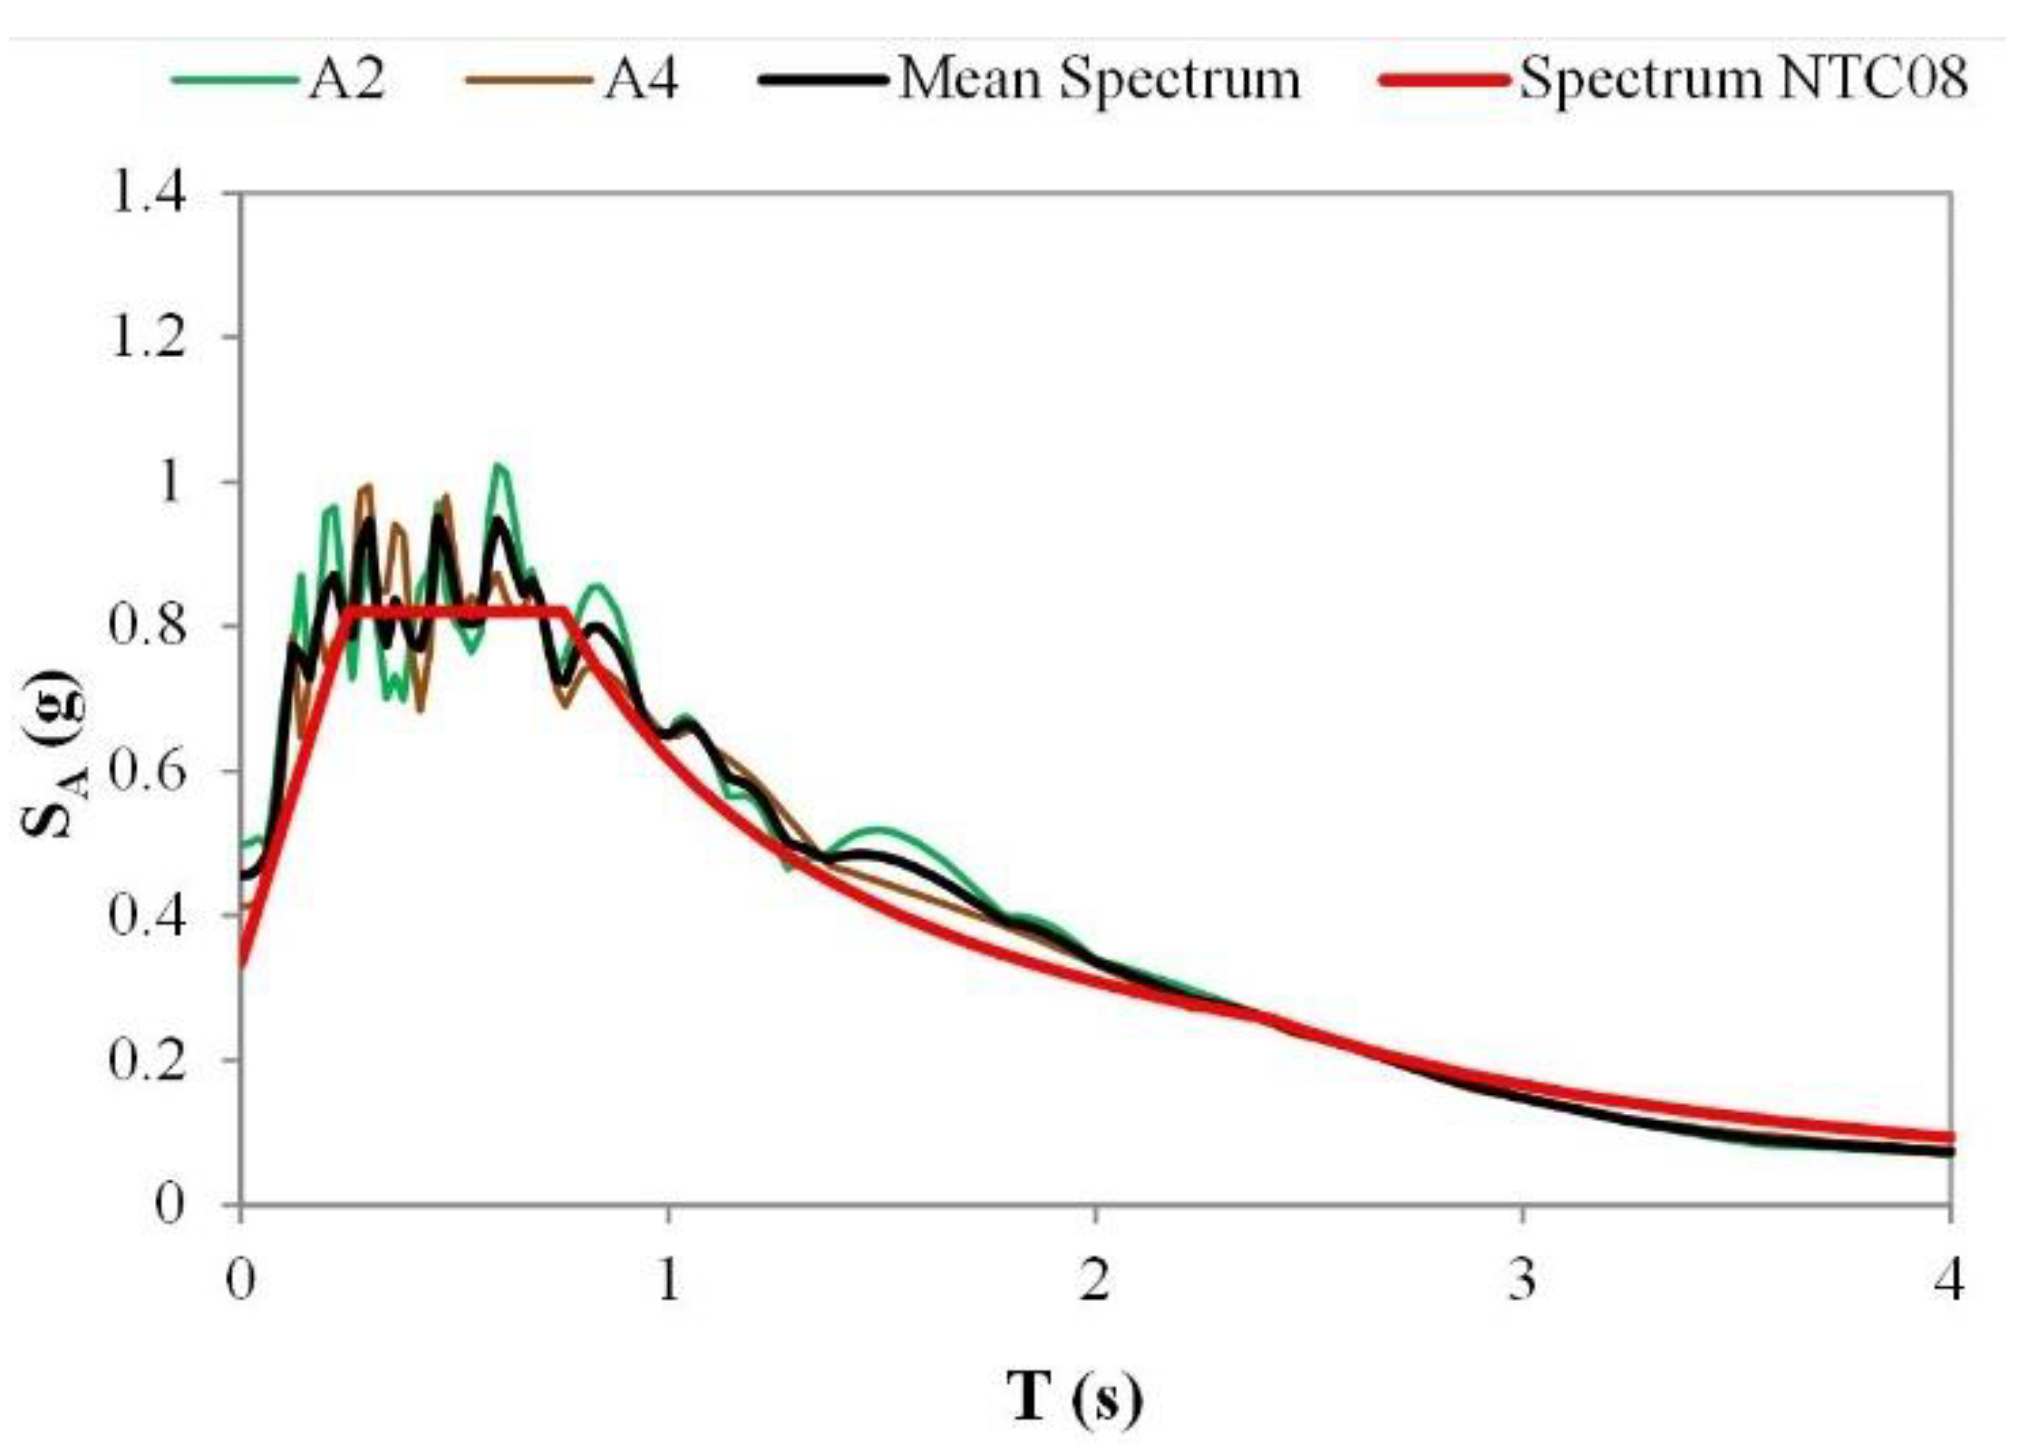
Natural and artificial accelerograms, compatible (in terms of average among three and seven accelerograms) with the Italian Seismic Code [49] for soil types B and D (using the spectral conventional shape of the Italian Seismic Code), have been selected from the Italian Accelerometric Archive ITACA. Figure 7 and Figure 8 show the response spectra associated with the natural and artificial accelerograms, respectively. A comparison between the related mean spectrum and the spectrum provided by the Italian Seismic Code (NTC18) is presented in both figures. İn order to simulate the presence of ambient noise vibrations (microtremors), in the numerical analyses twenty seconds of pink noise have been added before and after the strong motion phase of each considered accelerogram.

3.1. Numerical Results

In this section, the main outcomes obtained by applying the method to the responses of the nonlinear numerical models are presented. In Appendix A, Table A1, Table A2, Table A3, Table A4 and Table A5 present the values of fundamental mode shapes, related mode curvatures and curvature differences among floors evaluated in the reference time instant immediately before the earthquake (A) and in the time instant of minimum fundamental frequency (B). Furthermore, the values of curvature differences between the two-time instants and Inter-Story Drift retrieved from the nonlinear numerical analyses performed in SAP2000 are shown.
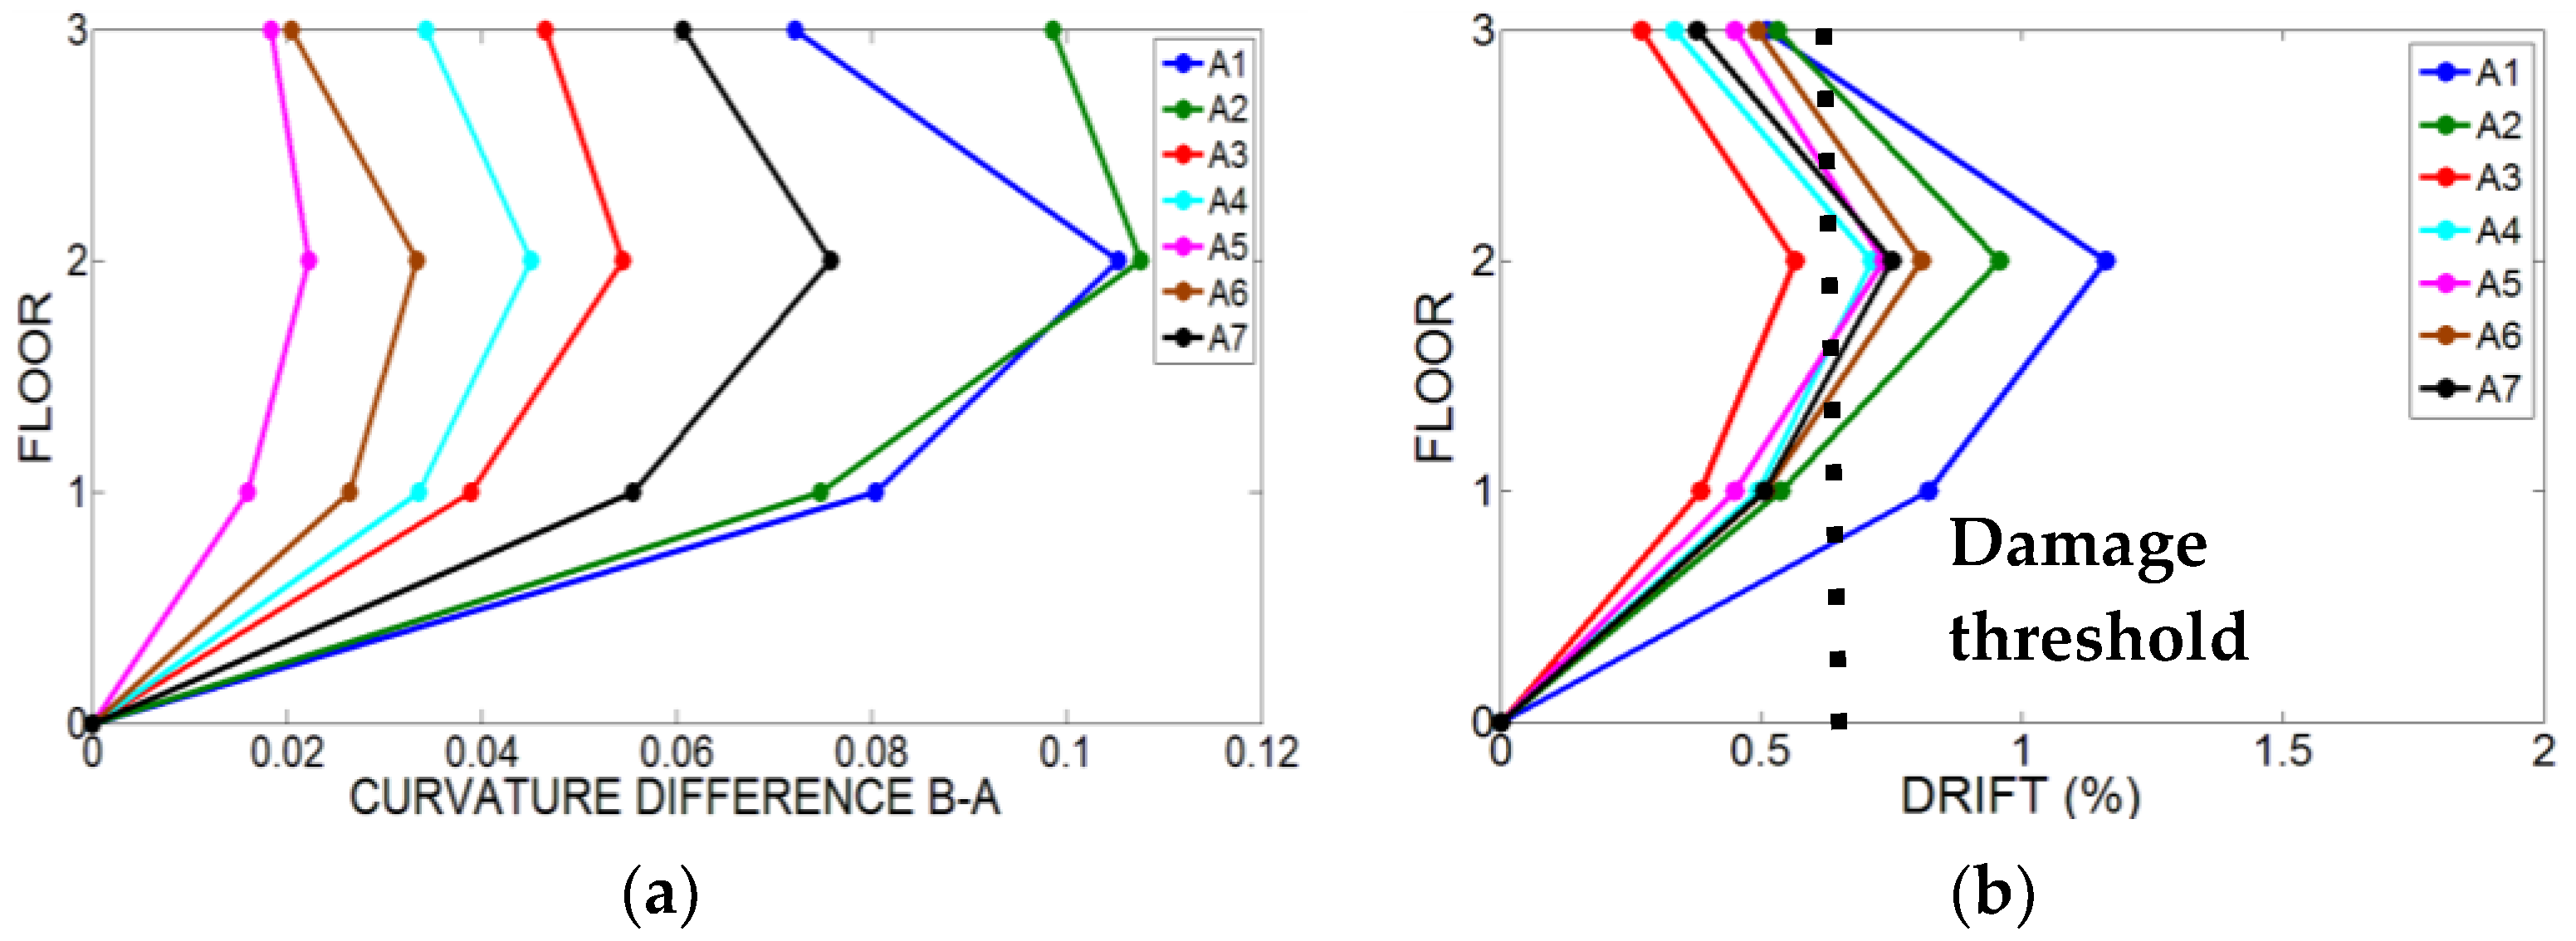
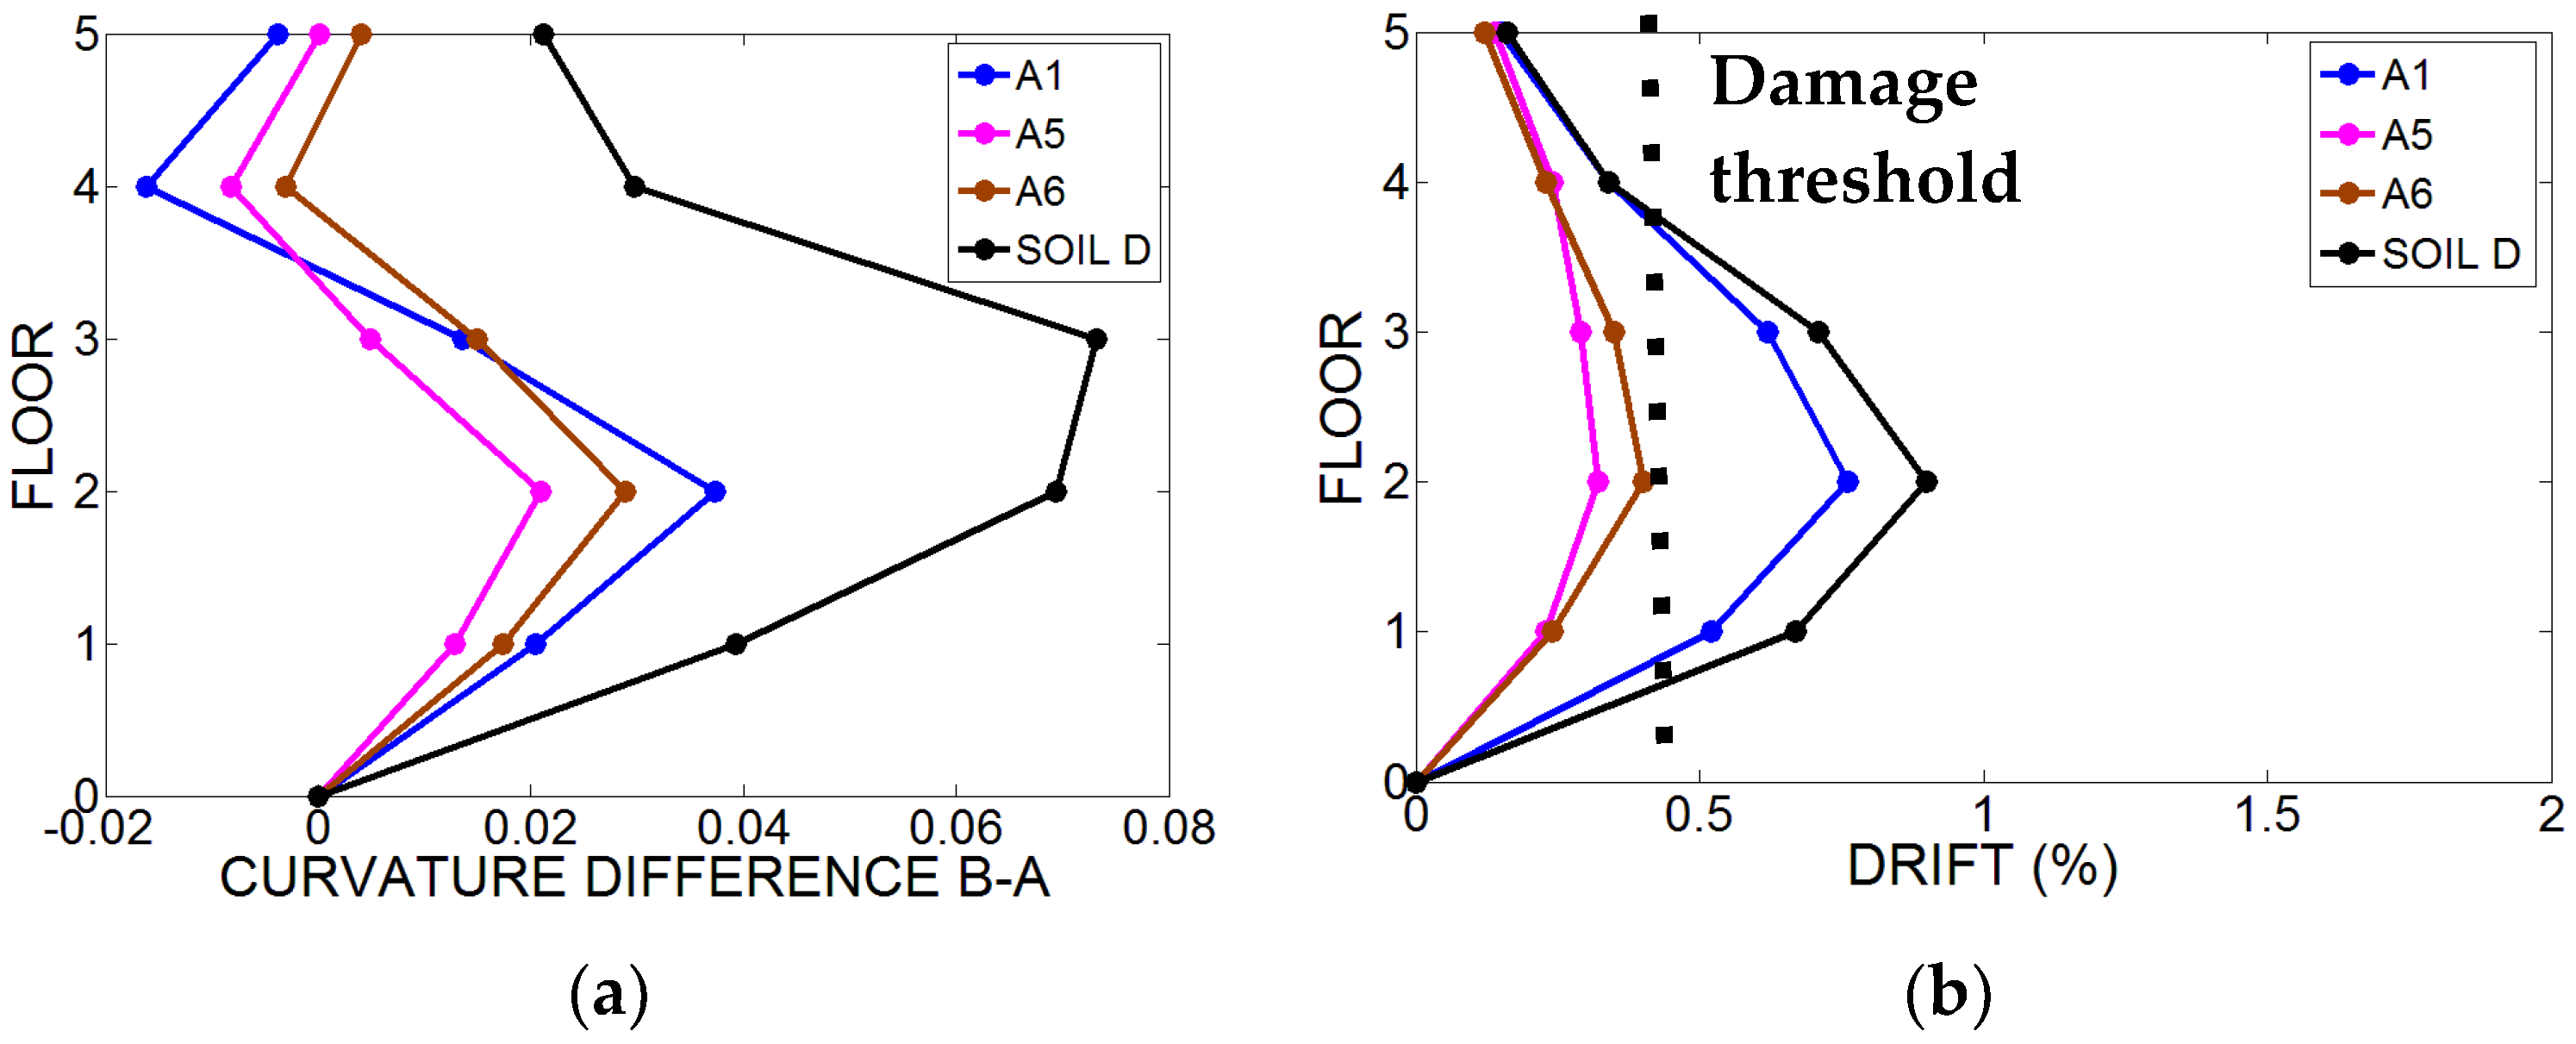
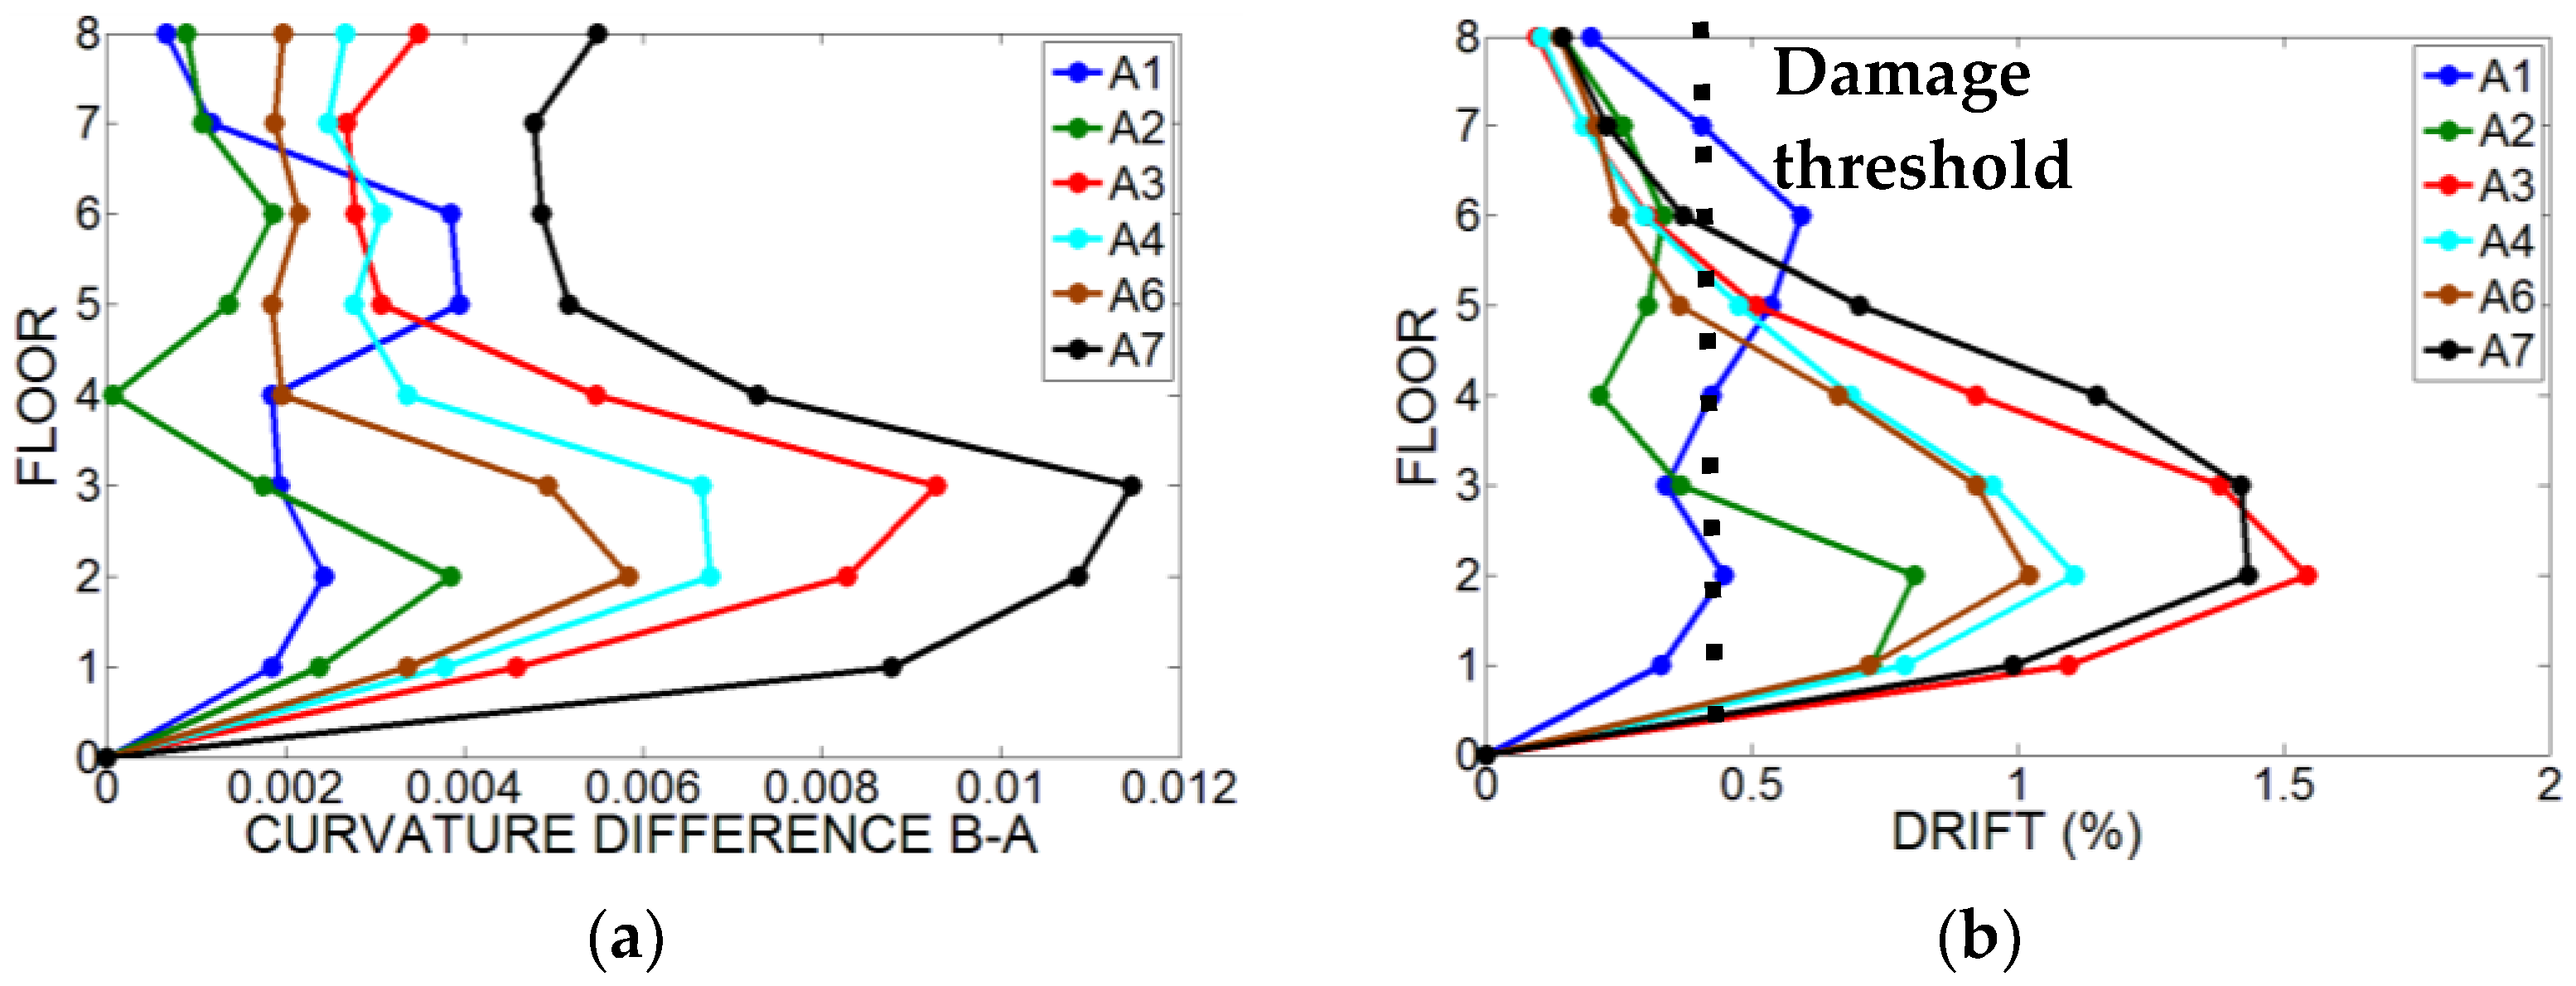
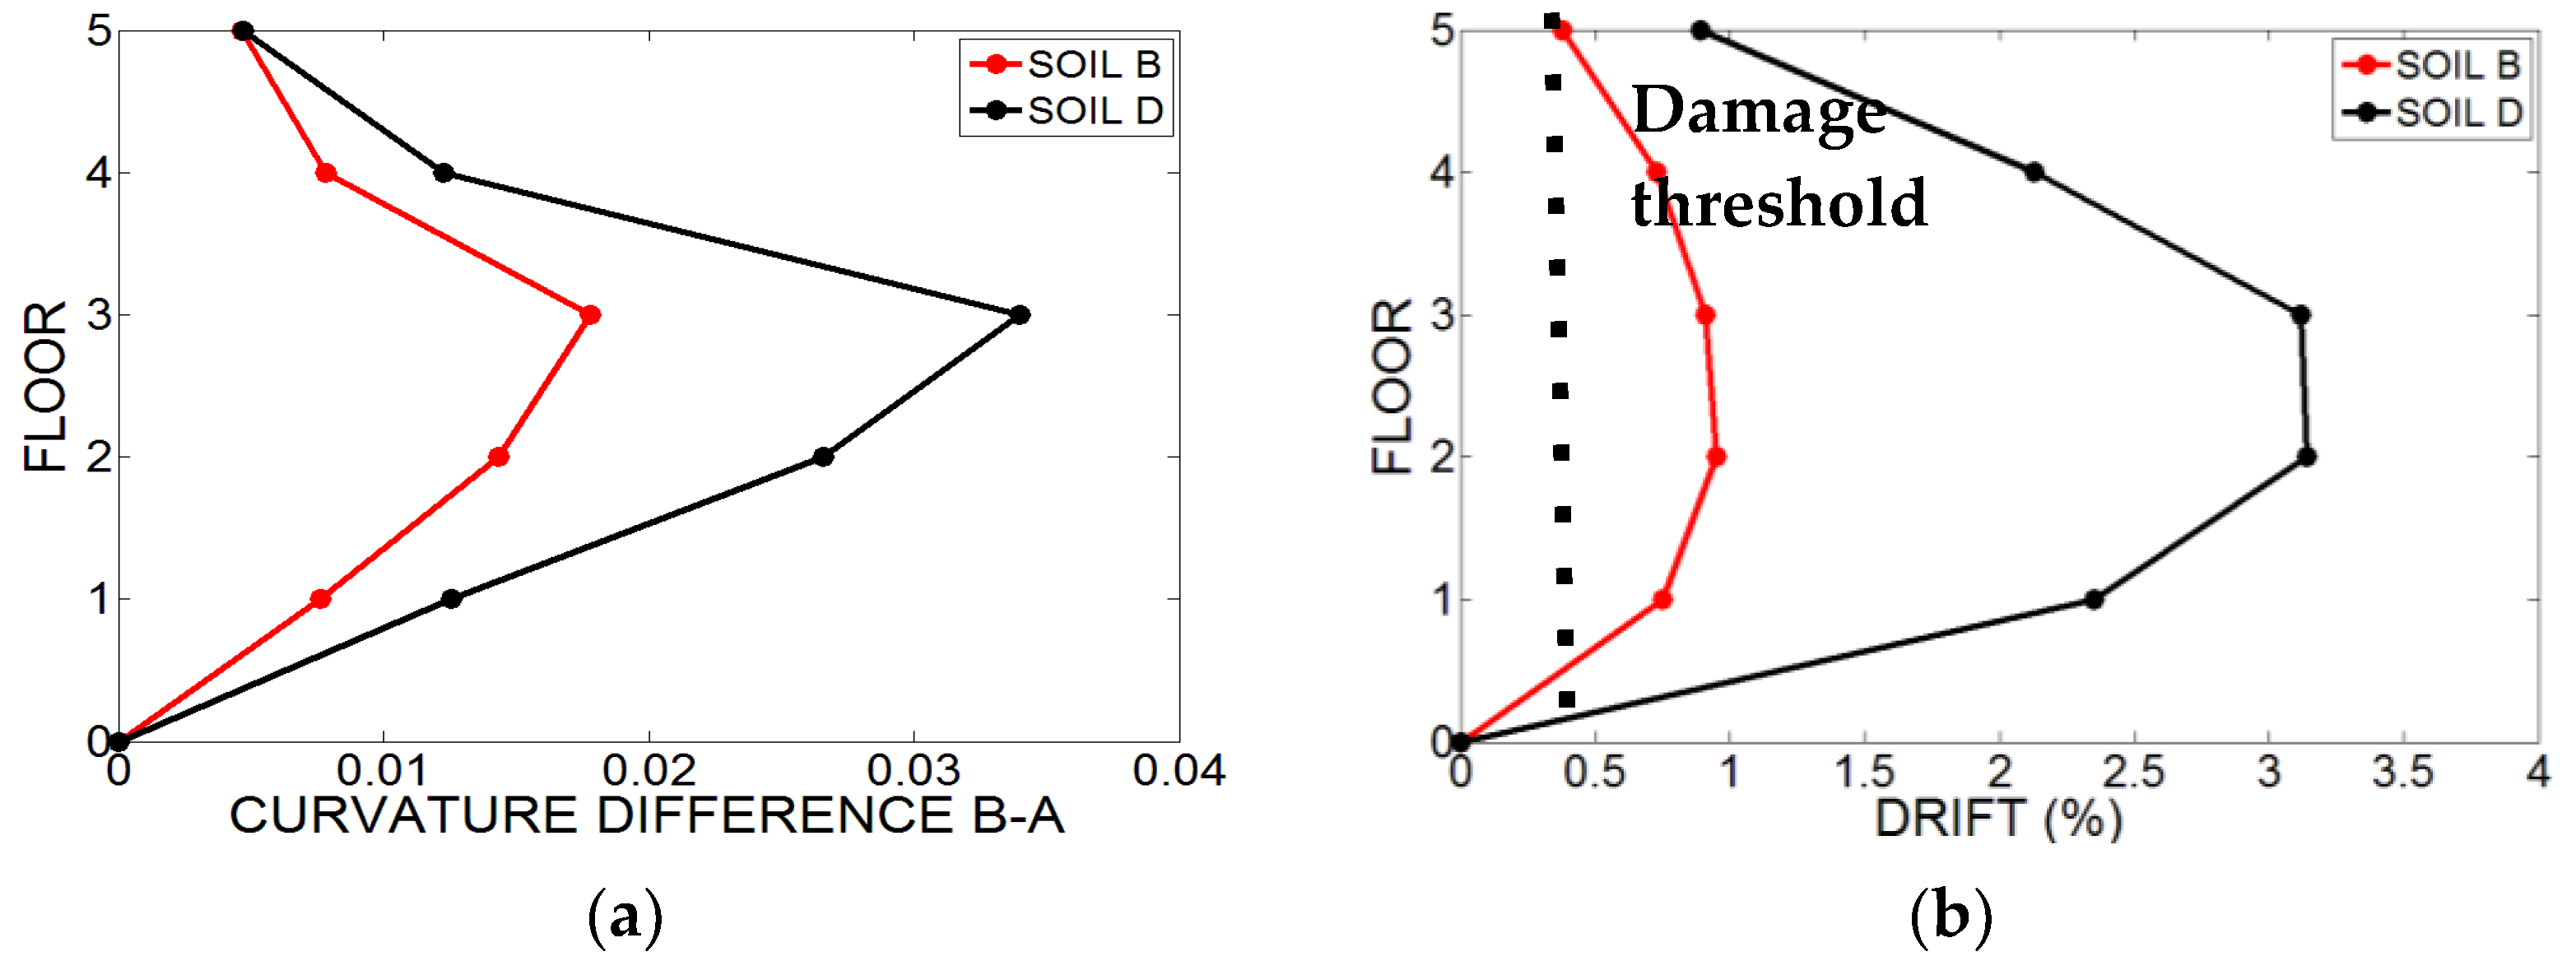
The curvature difference between the two time-instants (B) and (A), and the inter-story drift, are plotted from Figure 9, Figure 10, Figure 11, Figure 12 and Figure 13 for all the numerical models.
To verify the presence of damage along the height of the structures the inter-story drift has been considered as damage indicators in order to validate the proposed method. Table 2 shows the values of drift related to the different performance levels [45]. Figure 8, Figure 9, Figure 10, Figure 11 and Figure 12 show the inter-story drift equal to 0.5%, representing a threshold for non-structural components (such as the infilled panels). Above this threshold, the monitored structure changes its damage mechanism with a change in the maximum curvature difference and maximum inter-story drift relationship.
Analyzing the results obtained from the numerical campaign, it can be observed that the mode curvature difference B–A is able to localize structural damage and identify the most damaged floors after strong motion earthquakes.

3.2. Definition of Empirical “Curvature Variation-Maximum Inter-Story Drift” Relationships

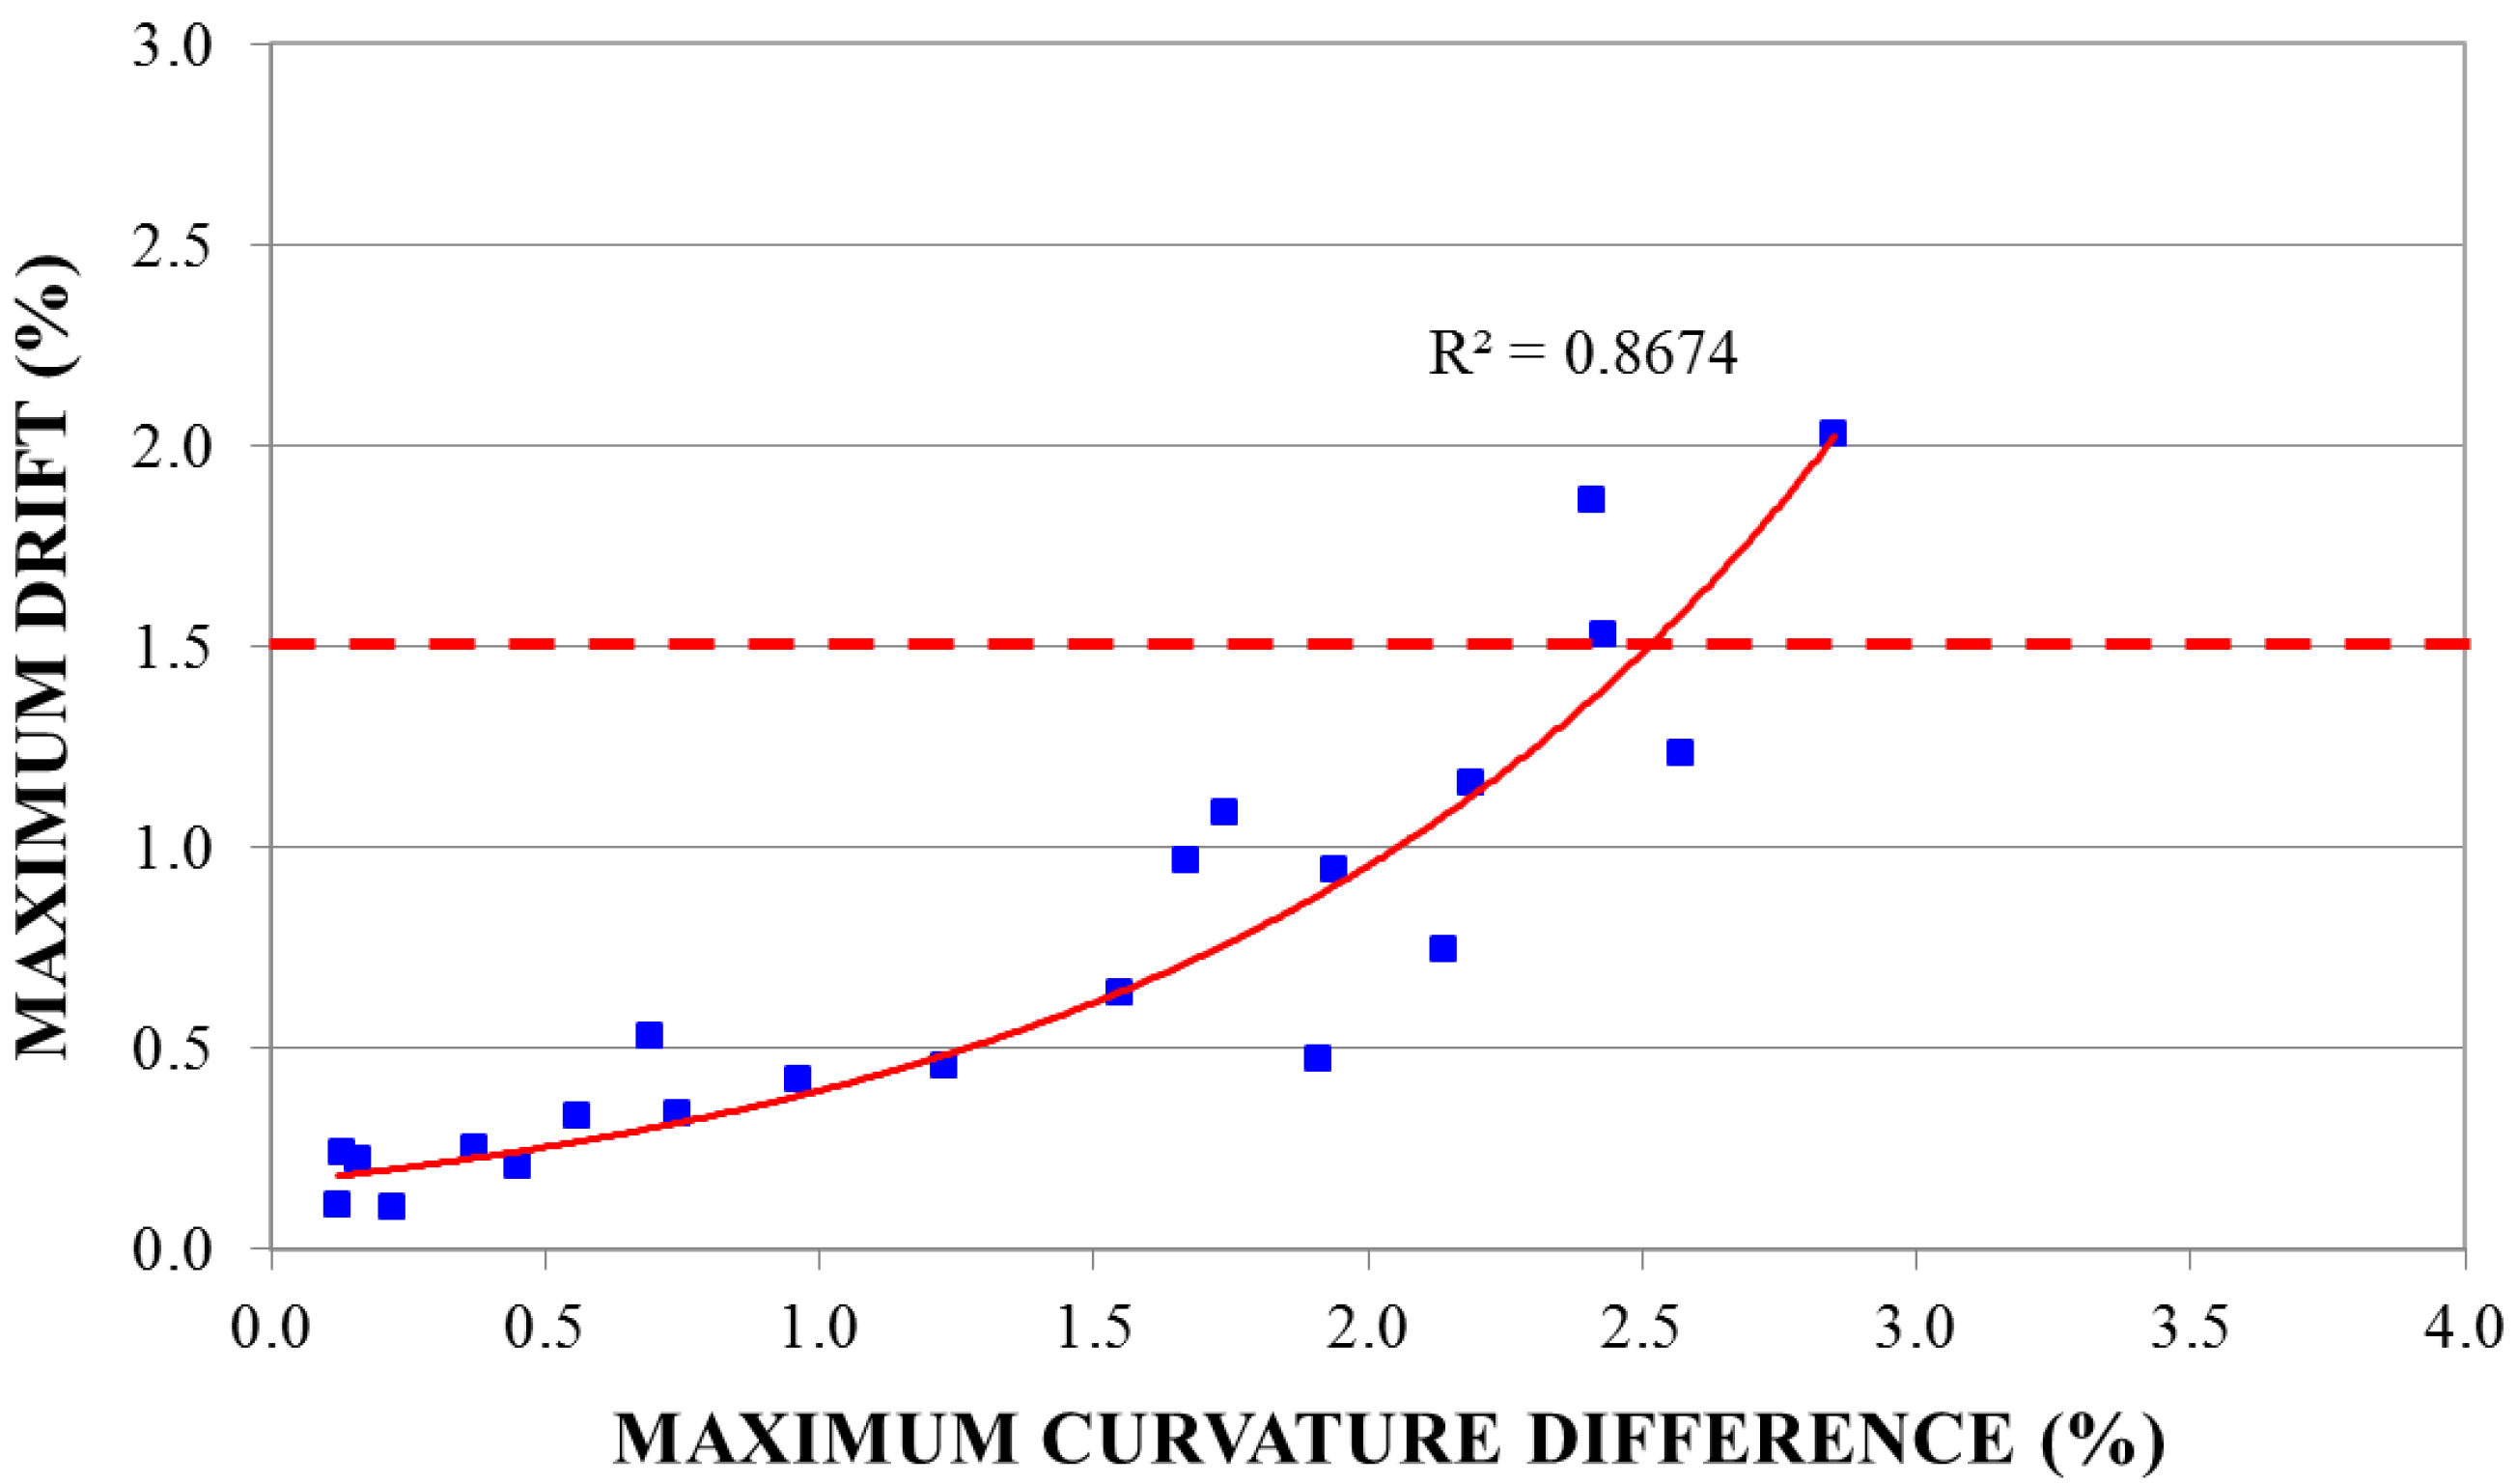
In order to quantify structural damage, a correlation between maximum inter-story drift and maximum curvature difference has been defined. The peak ground acceleration (PGA) values of the accelerograms used for the numerical analyses have been scaled with a scaling factor value between 0.25 and 1.50.
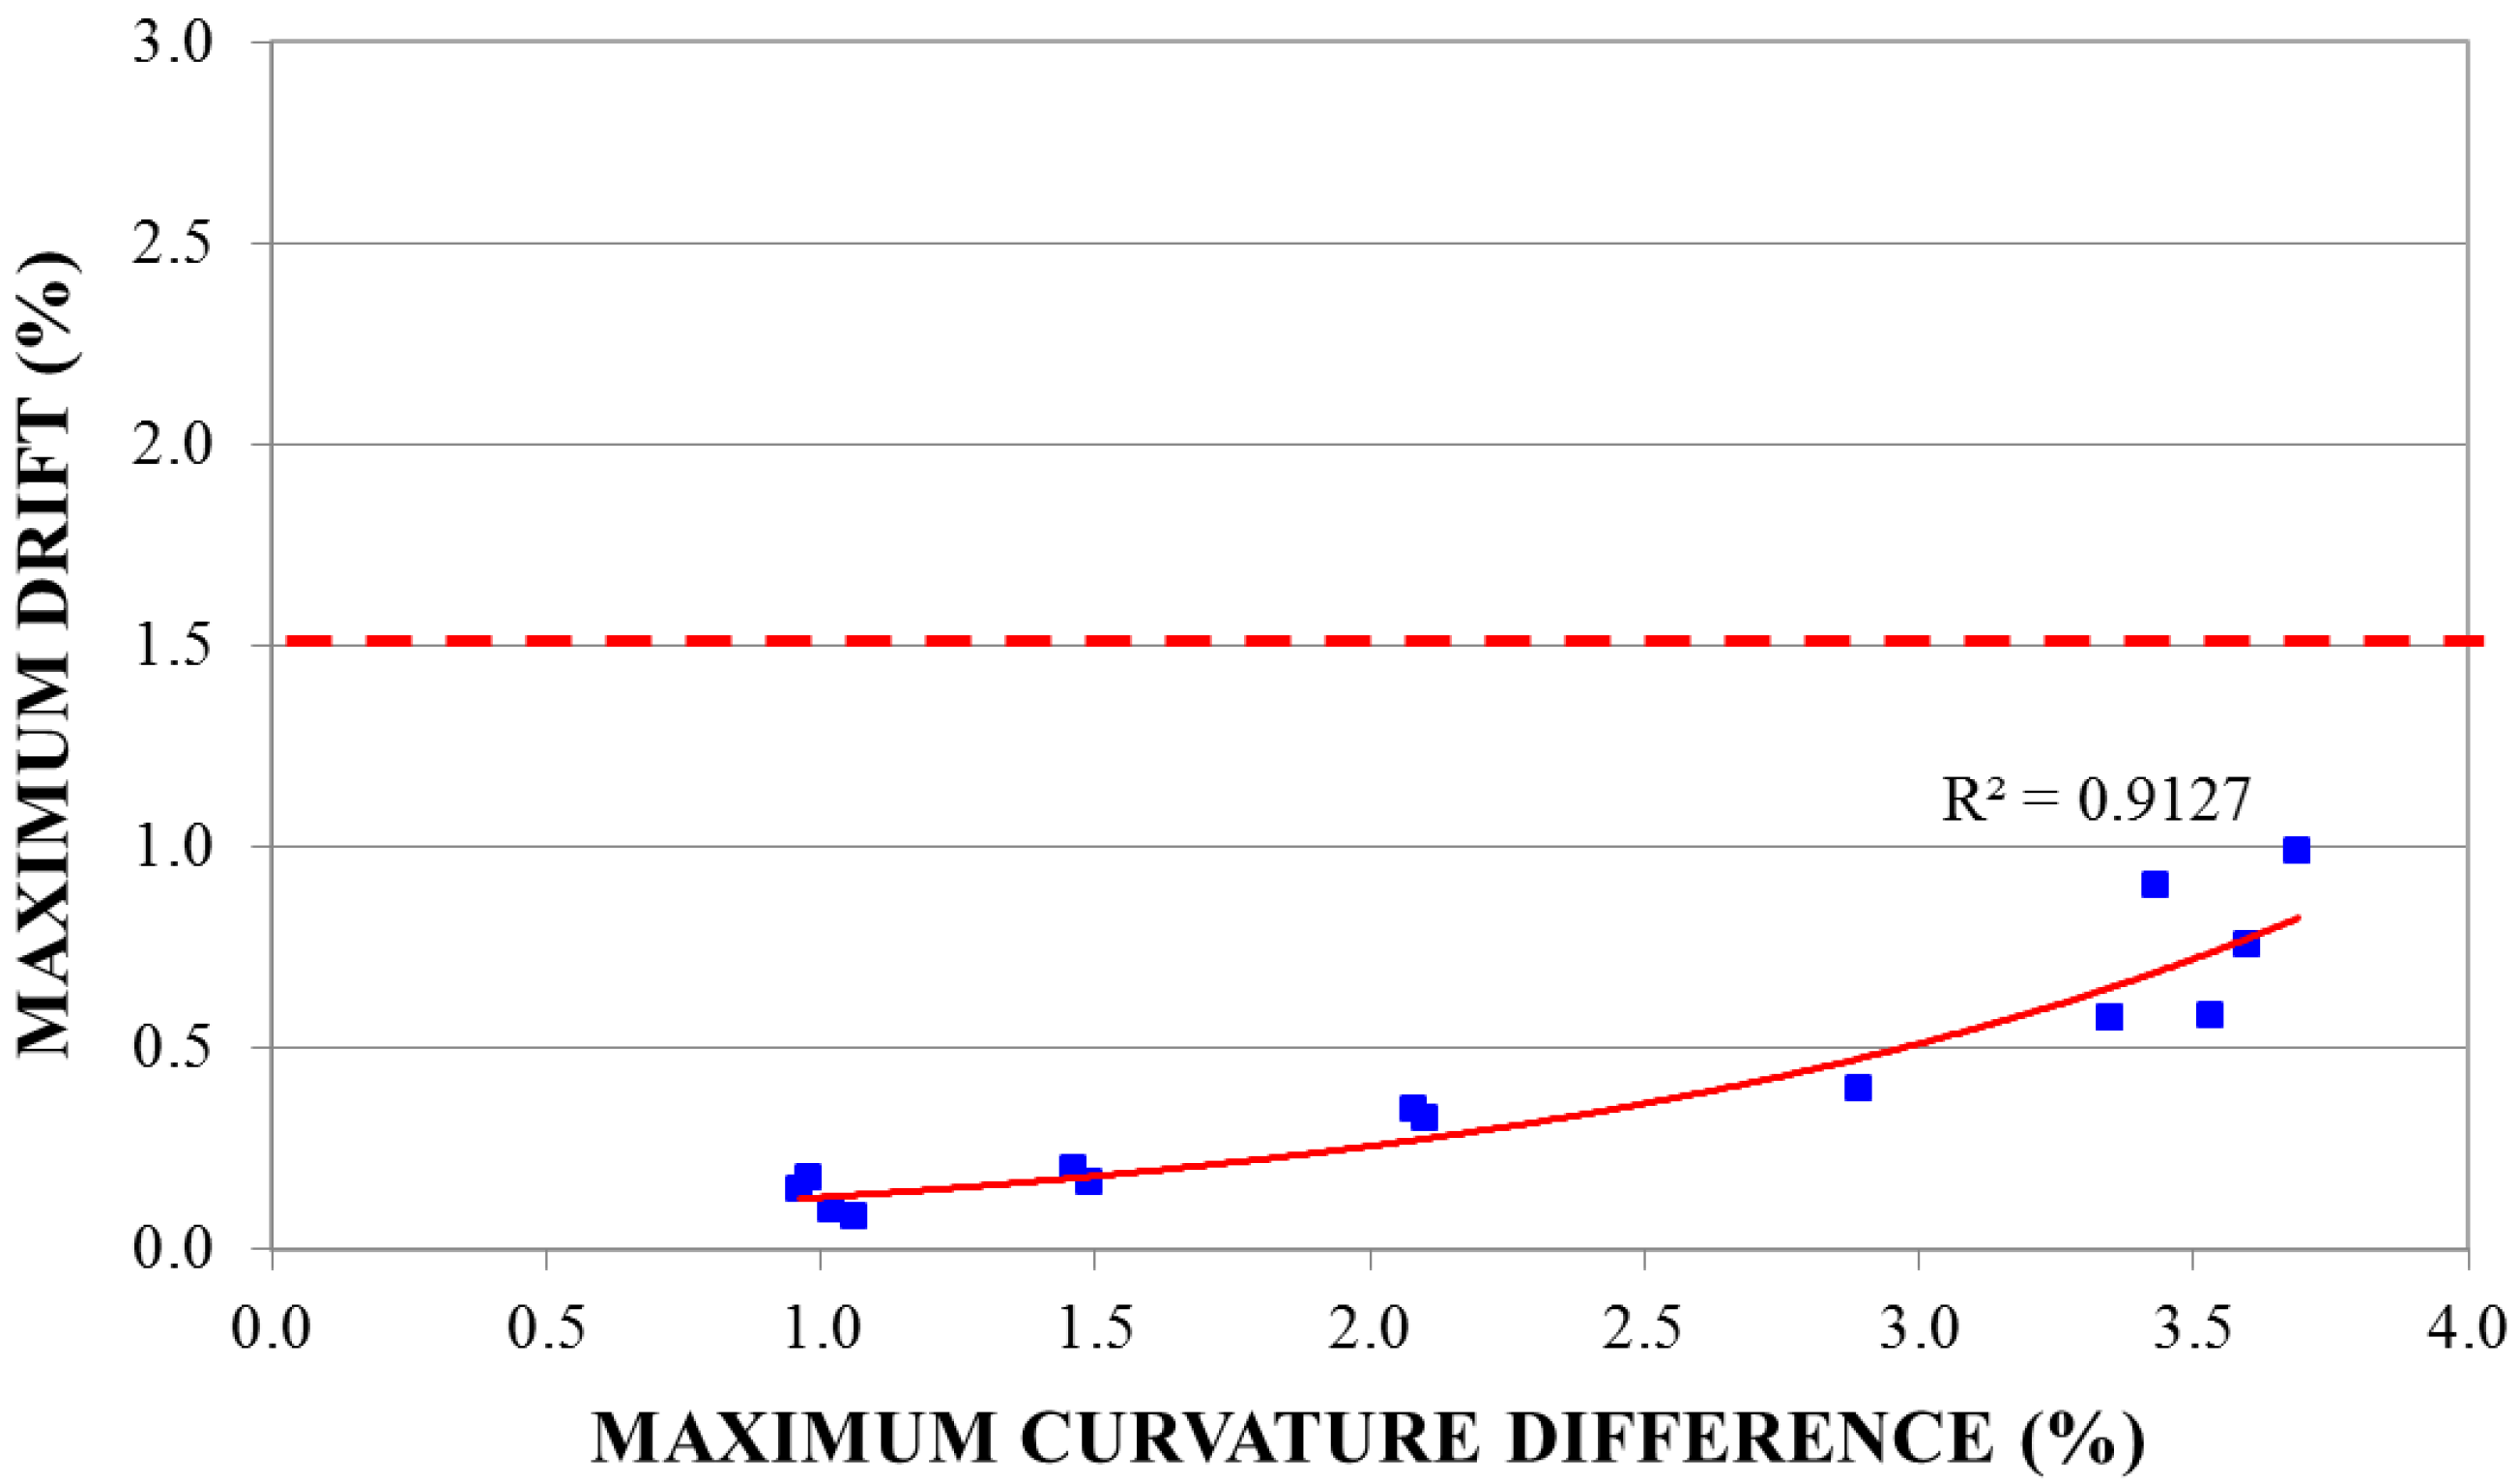
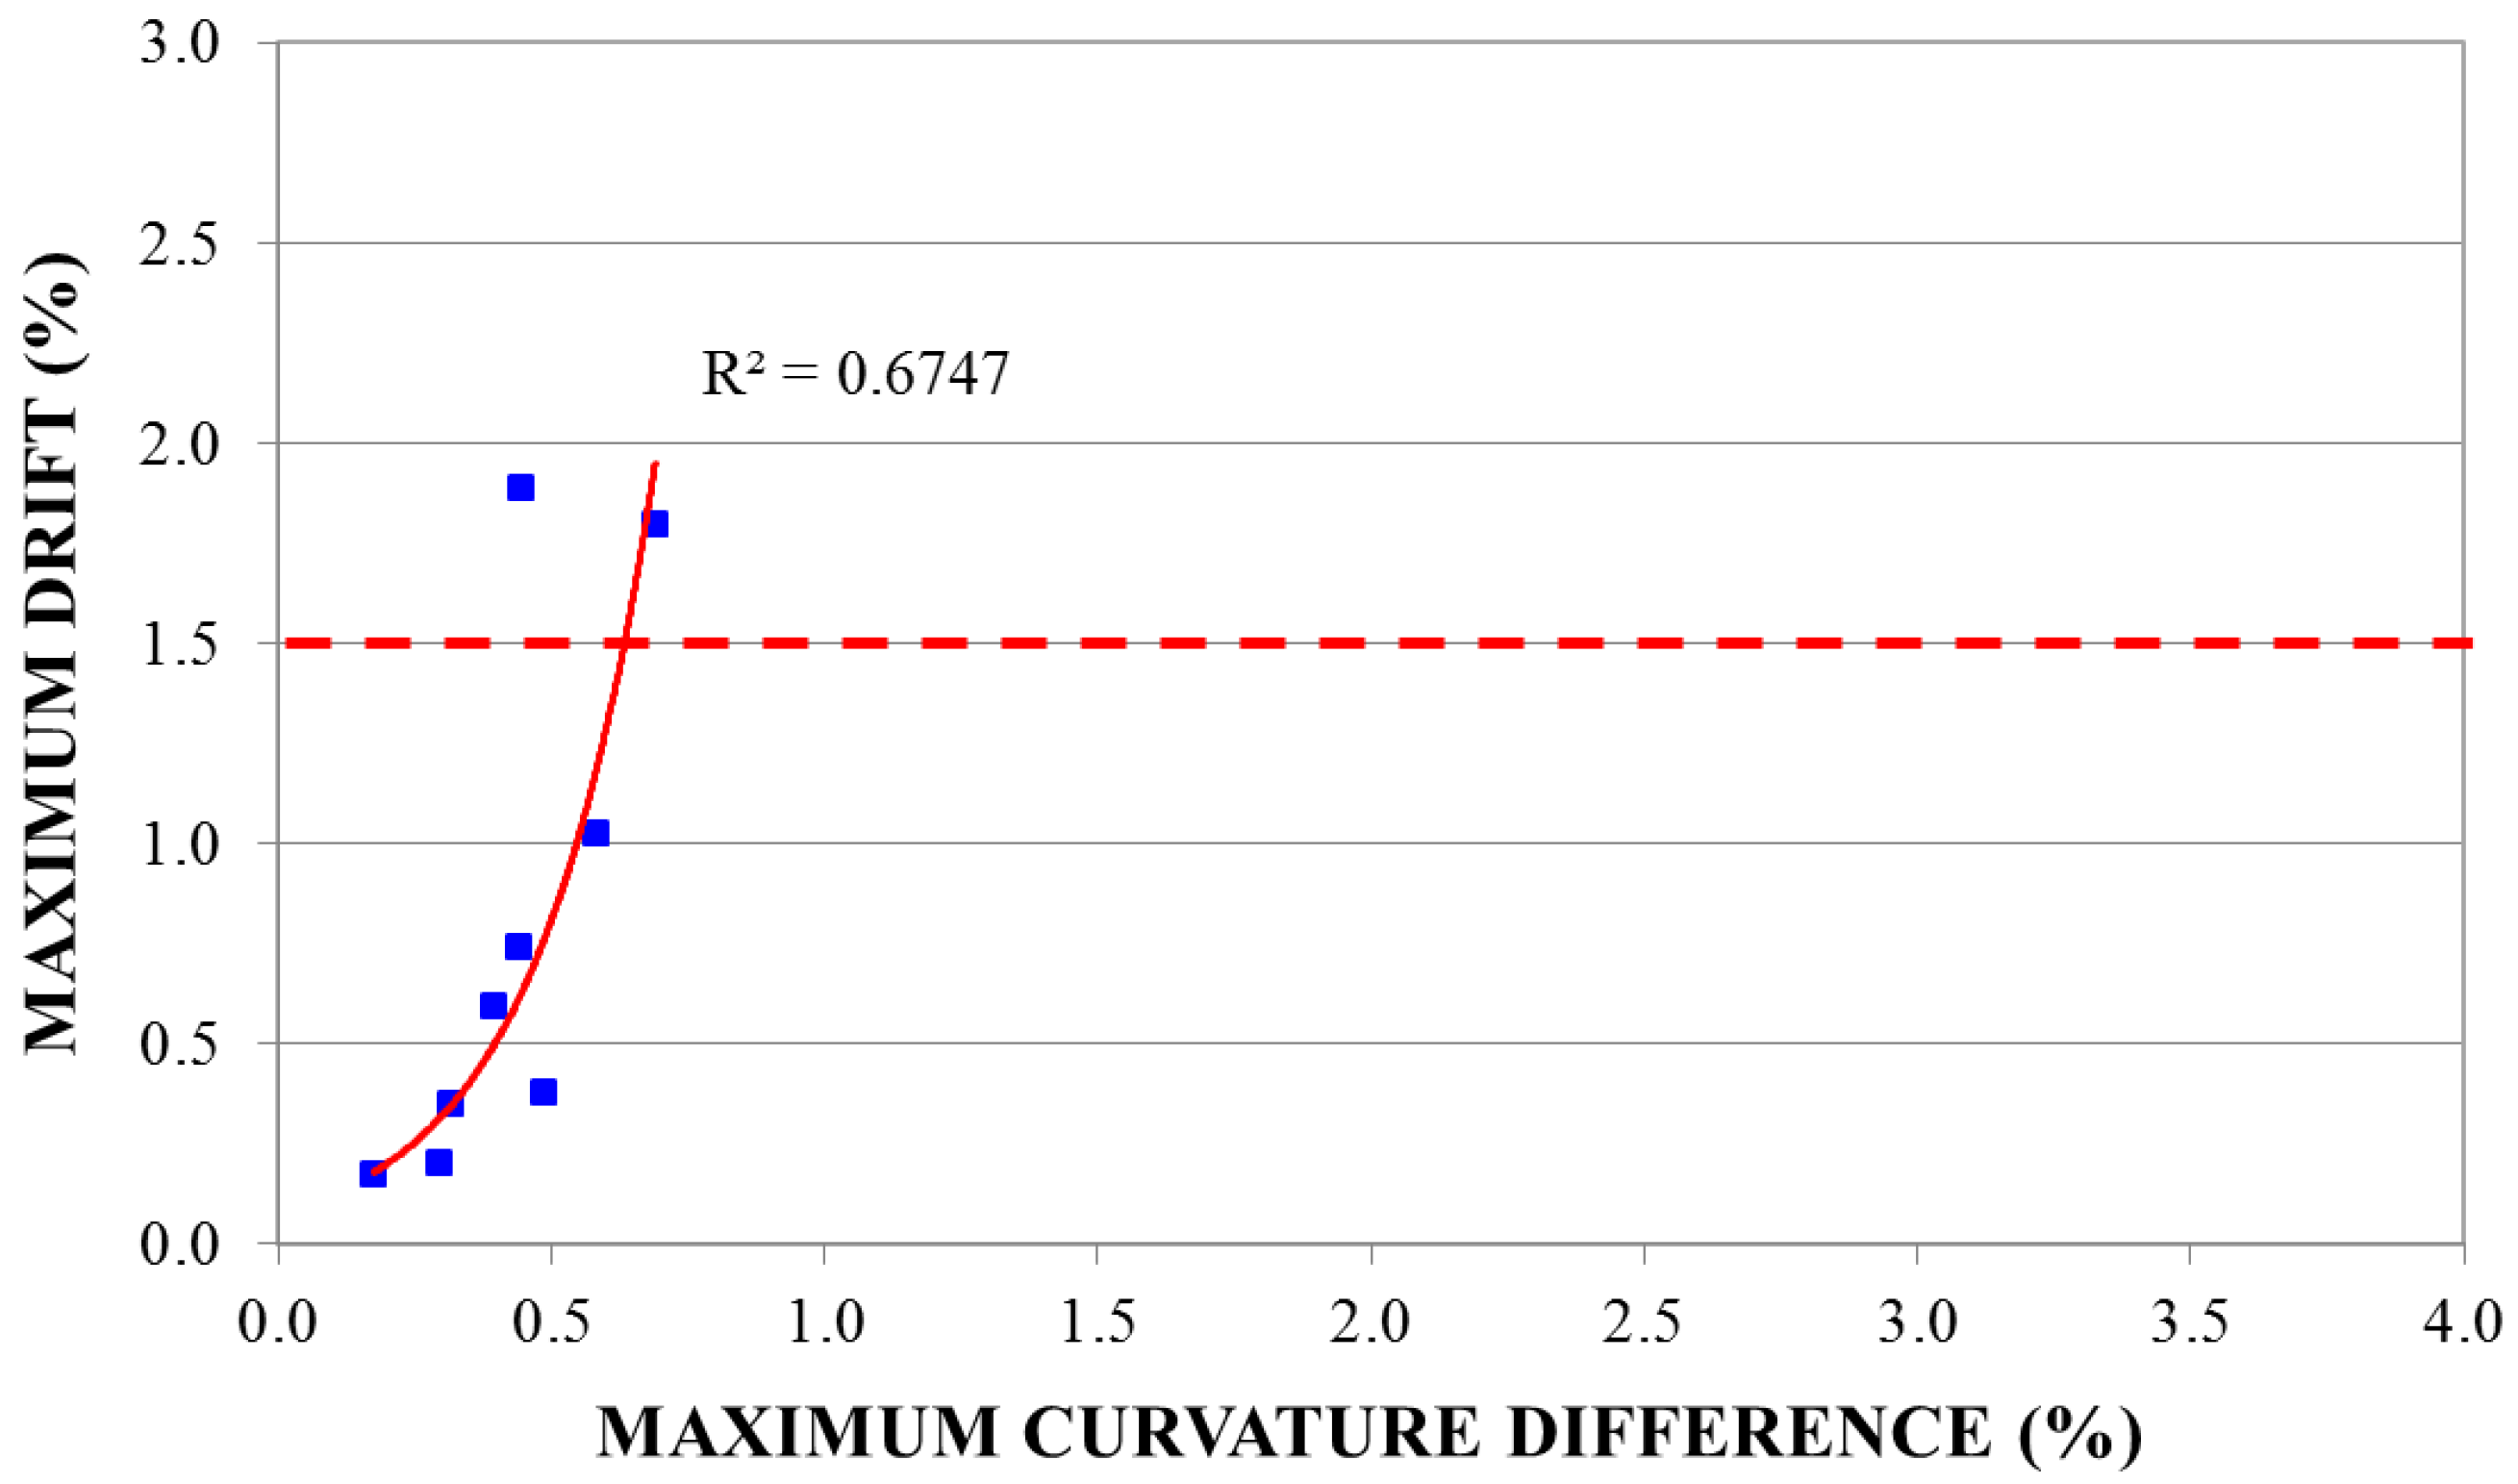
The following figures show the different correlations with the related R-squared coefficients: Figure 14 shows the correlation for the 3-story building subjected to three selected natural accelerograms (A1, A5, A6); Figure 15 and Figure 16 show the results for the 5-story regular in plan building without and with infill panels, subjected to three selected natural accelerograms (A1, A5, A6). Figure 17 shows the correlation for the 8-story building subjected to three selected natural accelerograms (A1, A5, A6).
The expected performance of the structure can be associated with the inter-story drift that allows defining, through different performance levels, the expected damage to both the non-structural and structural elements [50]. The following figures show the threshold related to the (LS) performance level (Table 2), where damage is moderate, the structure remains stable, and life safety is generally protected.
The following equations show the relationships for the different analyzed structures:
3-story   building d r ( c ) = 0.180 e 0.68 x         0 c 4 %
5-story   building d r ( c ) = 0.163 e 0.89 x         0 c 4 %
5-story   infilled   building d r ( c ) = 0.064 e 0.69 x         0 c 4 %
8-story   building d r ( c ) = 0.079 e 4.64 x         0 c 2 %
where d r ( c ) is the maximum inter-story drift and c is the maximum curvature difference.
The above results show that the relationship between maximum inter-story drift and maximum curvature difference can be defined through the following correlation:
d r ( x ) = A · e B · x
where A and B are parameters depending on the monitored structure.
The mode curvature variation is strongly related to the maximum inter-story drift. It can be noted as a quasi-linear behavior between 0% and 0.5% of the maximum inter-story drift. After this range of values, corresponding to a structural linear behavior, it is possible to note a slight nonlinear behavior, with the growth of nonlinear effects occurring within the damaged structure. It is important to highlight the limited dispersion of data. This kind of trend has been found for all of the analyzed numerical models. In conclusion, further studies are necessary to better understand how it could be possible to generalize the empirical relationship mentioned above, with the aim to reduce uncertainties on structural damage localization and quantification.

4. Experimental Case Study

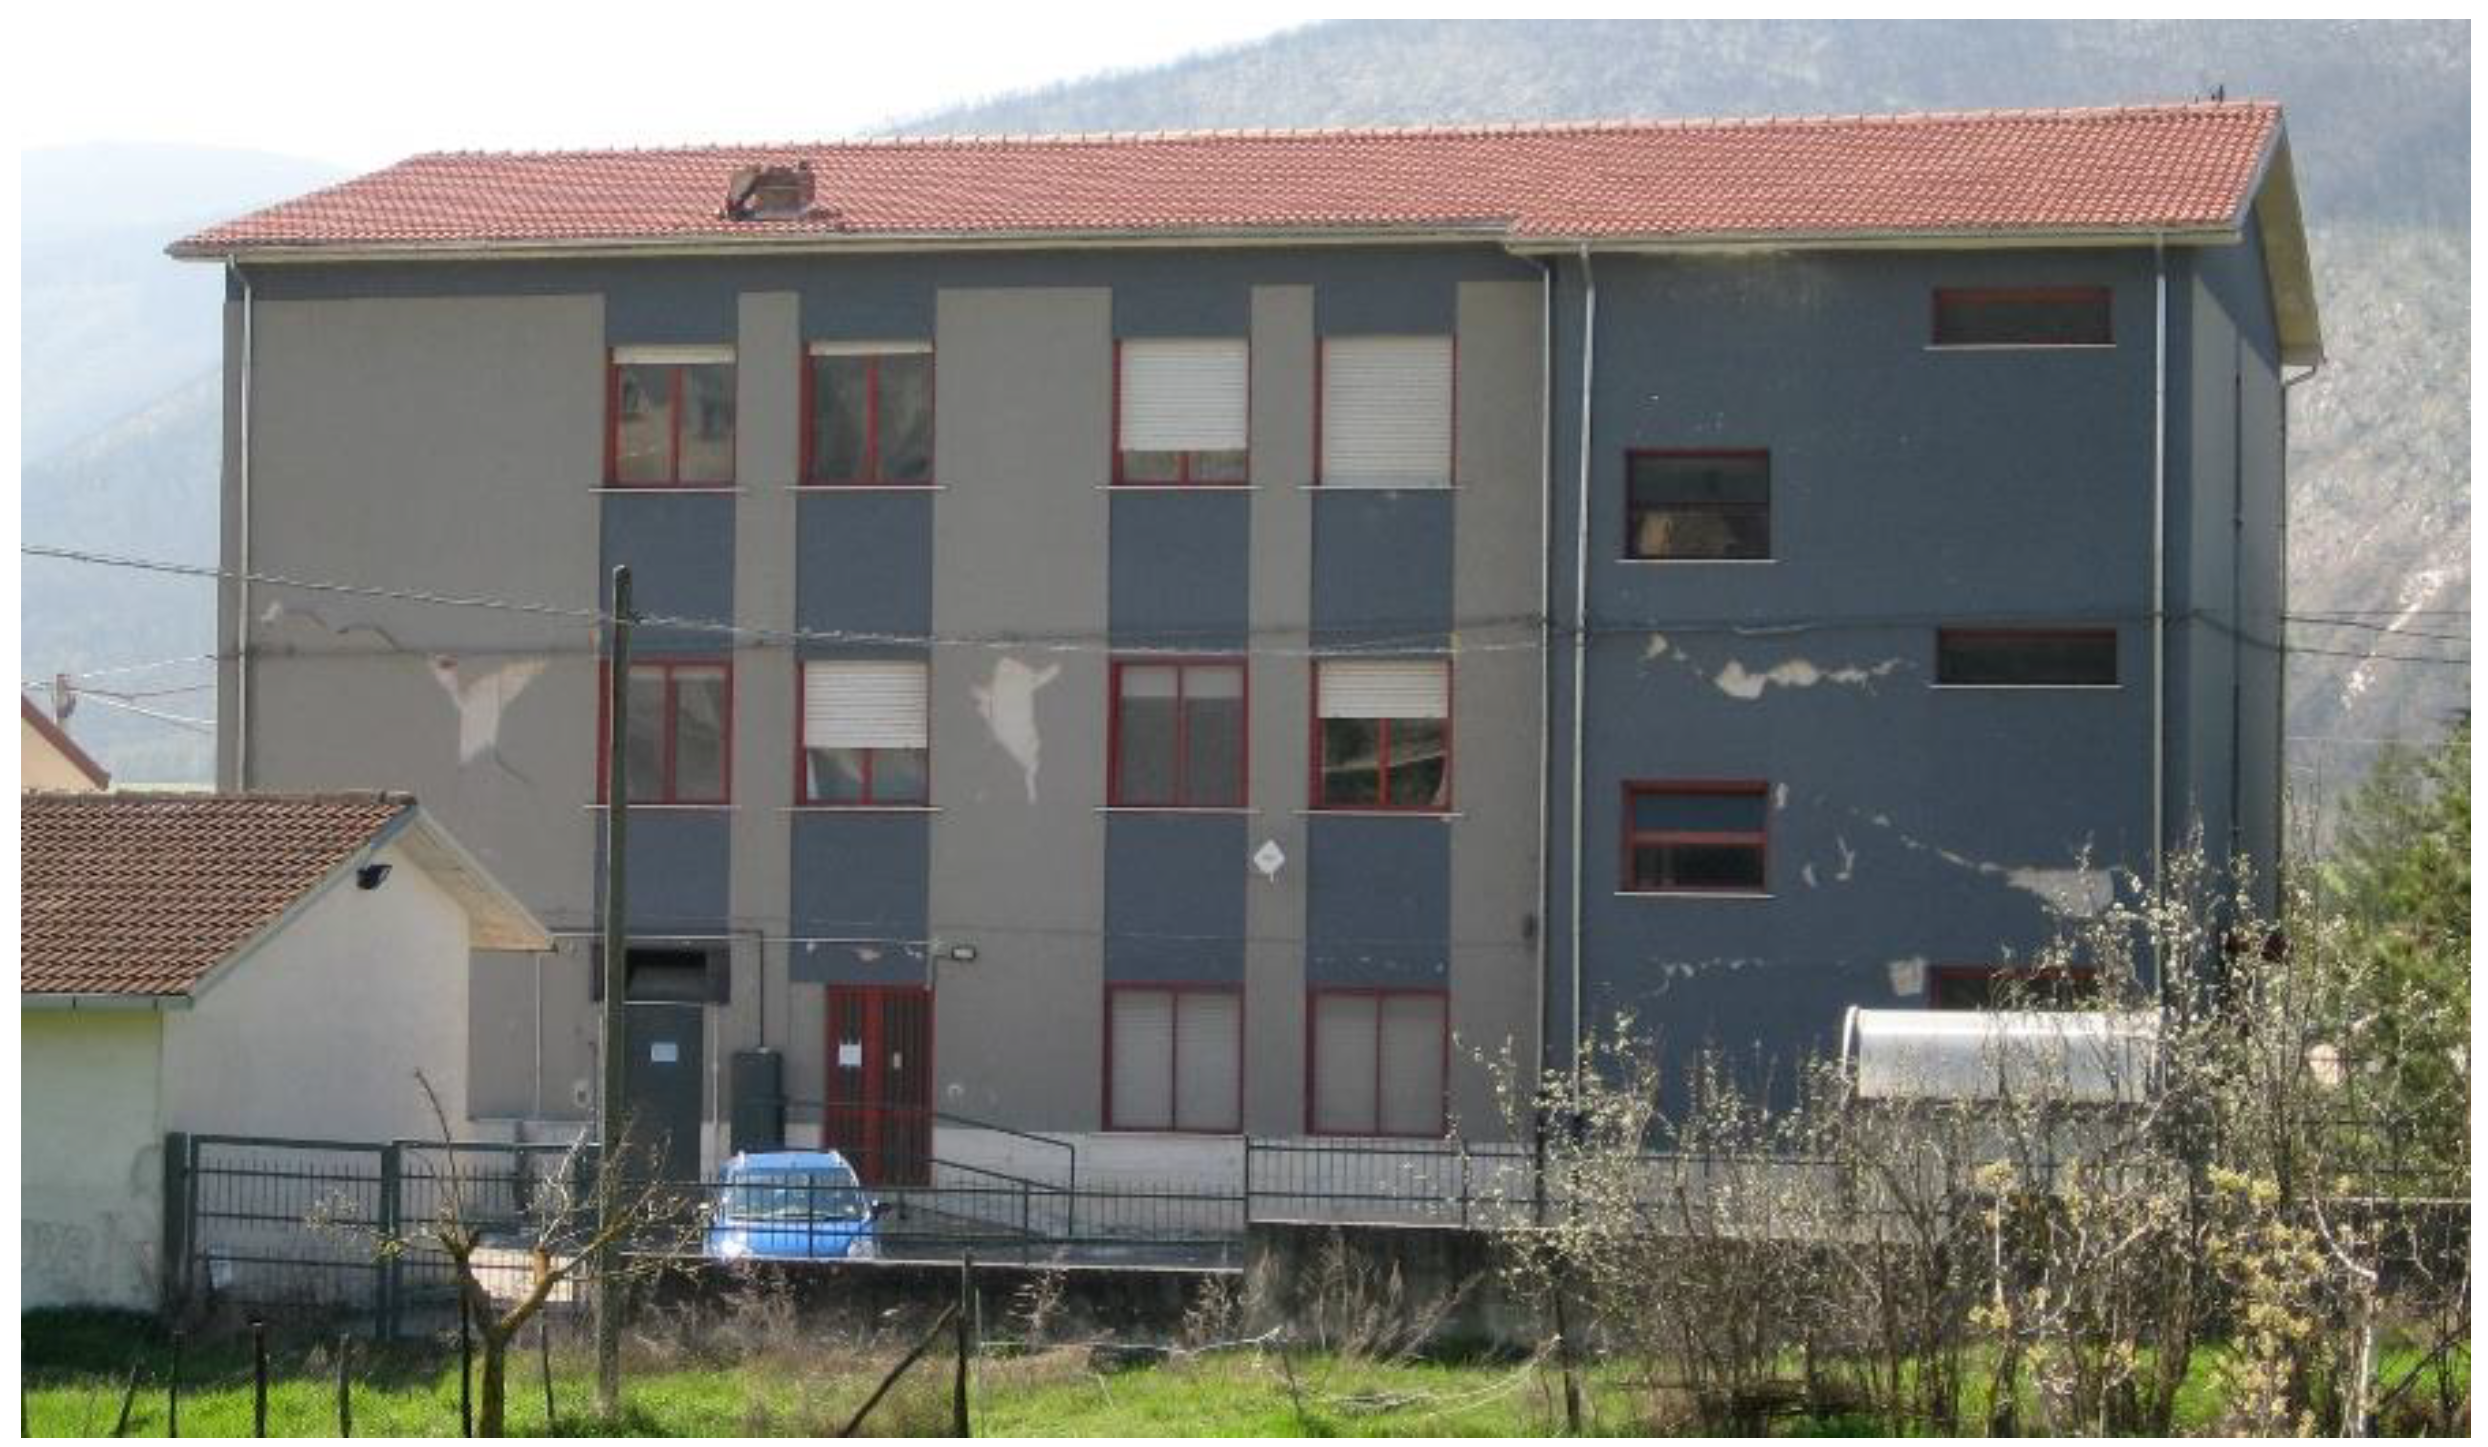
In order to test and verify experimentally the proposed approach, the method has been applied to a real case study: the Navelli town hall located in Central Italy. The building is a reinforced concrete framed structure with three stories and two (about 6.5 m in length) by four (length varying between 3.65 and 7.0 m) bays. Inter-story height is 3.5 m [3,51].
The Navelli town hall was affected by the earthquake of 6 April 2009 (Mw = 6.3). Starting from 7 April 2009, ambient noise measurements on the structure were performed and, from the 8 April, a local accelerometric network was installed outside and inside the building.
Concerning nonstructural elements, significant damage was found both in the external infill panels and in the internal partitions. Infill panels suffered wide cracking at the ground and first stories along both the longitudinal and transversal frames. The most damaged areas were near the stiff stair-structure and along the longitudinal direction. Wide cracks occurred along the longitudinal direction of the infill placed in the last bay of the ground and the first story (Figure 18). Along the transversal direction, lower damage was detected. The damage mechanism was mainly in-plane. Cracking along the diagonals of the panel (due to inclined tension stress mostly concentrated within the center region of the panel) and crushing of panel corners (due to the interaction with the surrounding frame) were observed [52].
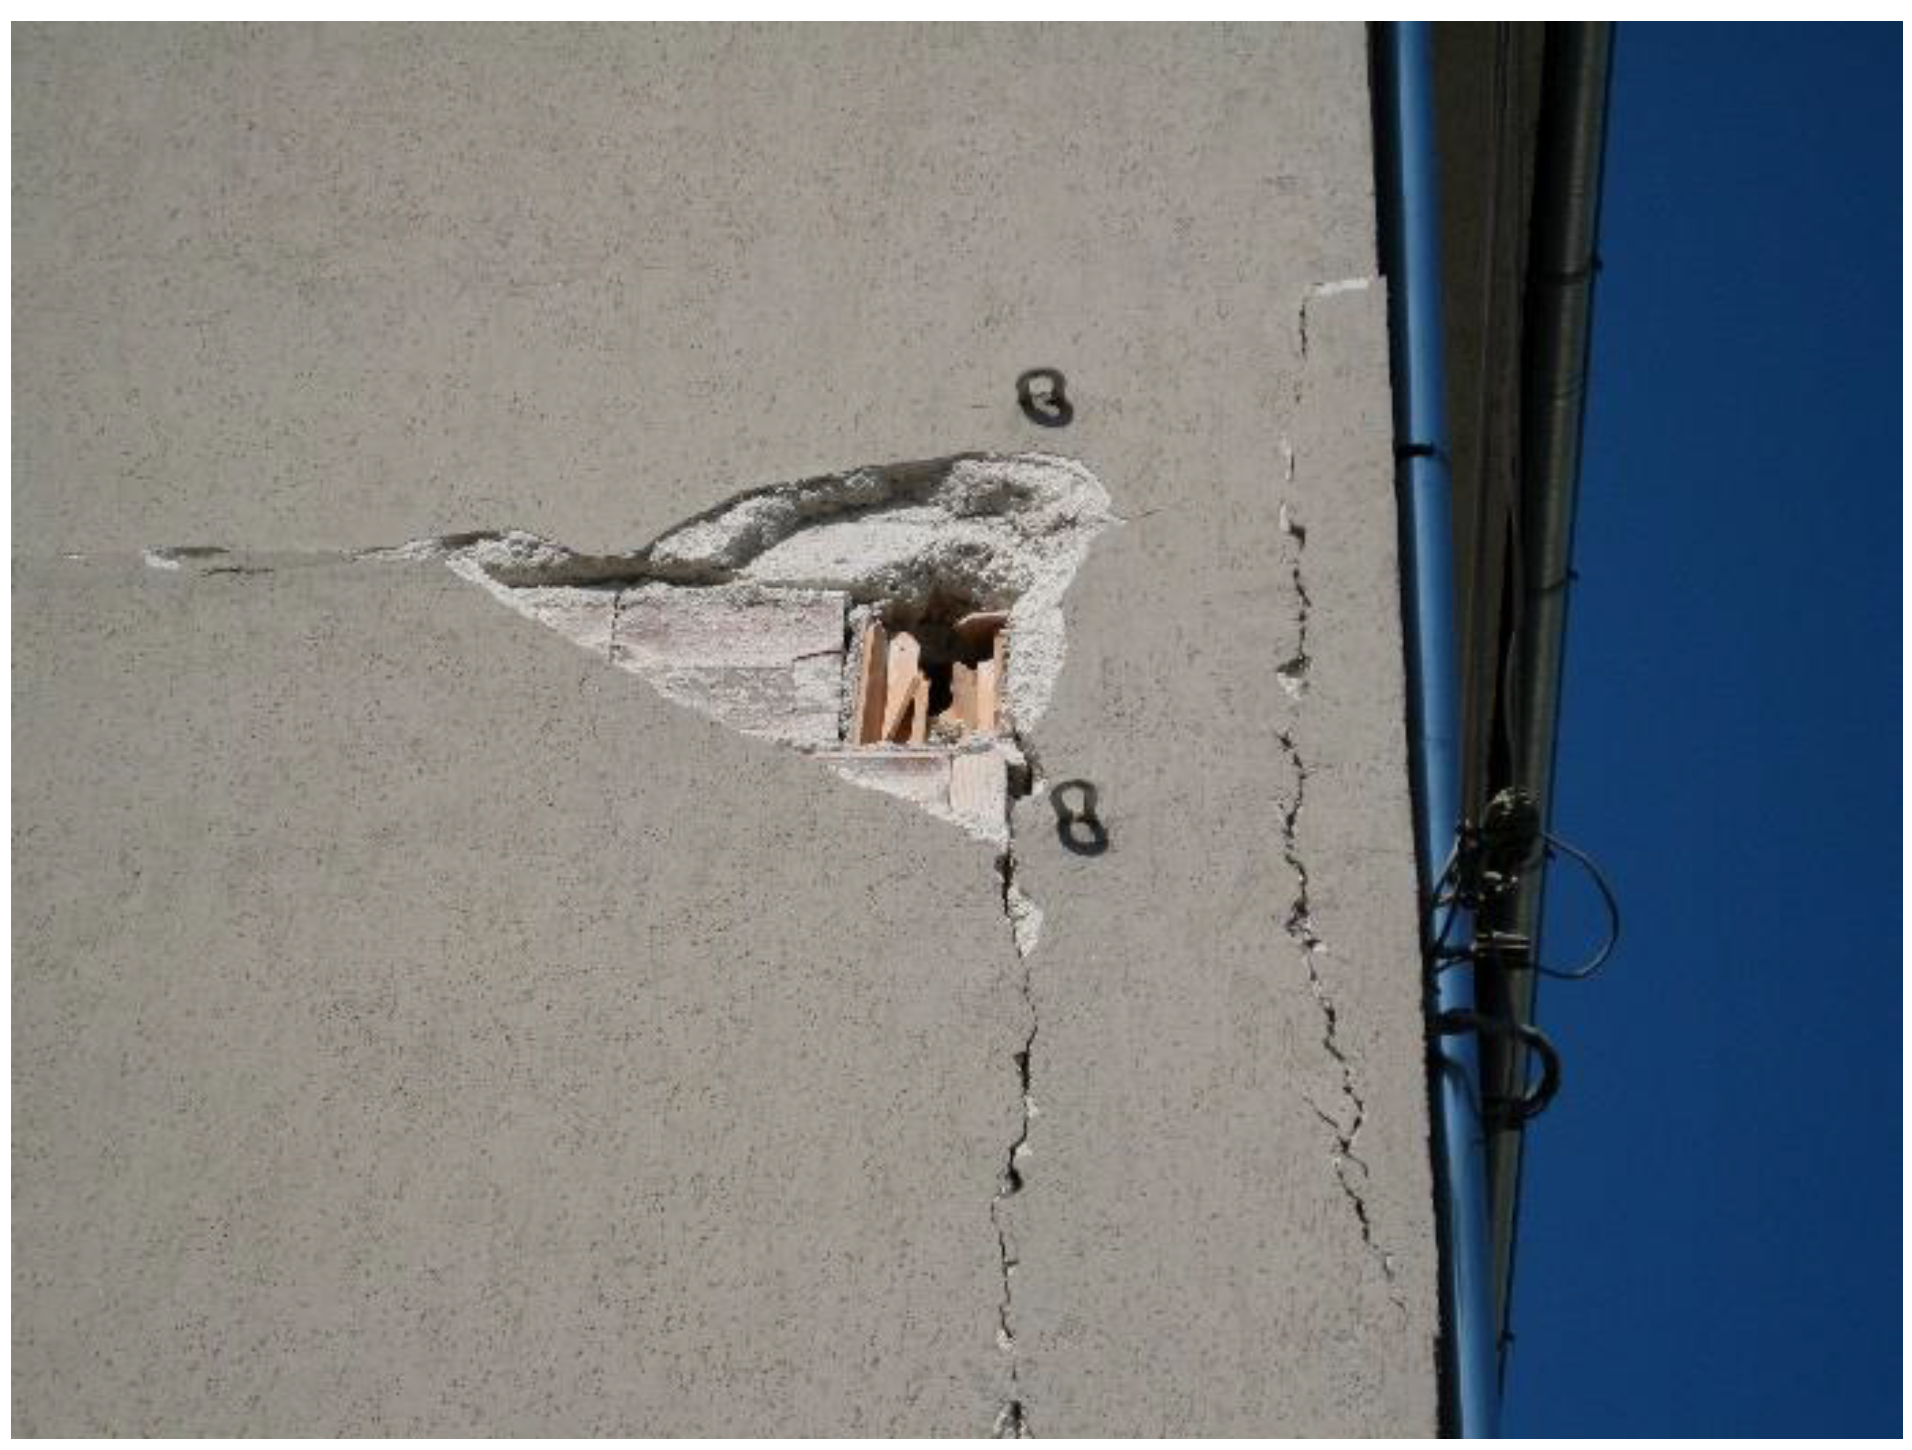
Concerning the structure, some beams showed cracks due to the shear action (Figure 19), particularly those loaded by the one-way slab. As reported in [3], the columns’ damage was particularly heavy and extensive at the first level. Possibly, damage on columns was increased by the interaction with the adjacent infill panels [3]. For the same reason, even structural damage on some beam–column joints was found (Figure 19).
As described in [52], on 8 April 2009, four accelerometric stations were installed for the continuous monitoring of the building. The monitoring system was composed by one station installed in each floor (three) on the same vertical along the building height, and one station buried in the ground near the building. Stations were developed by Helmholtz-Centre Potsdam-German Research Centre for Geosciences (GFZ) and the Humboldt University of Berlin [53].
Particularly, wireless three-directional accelerometers named SOSEWIN were based on MEMS (Micro Electro Mechanical System) with a measurement range of ±1.7 g, a bandwidth of 25 Hz and a noise level of 0.5 mg, which were arranged to sample the three components of the ground motion. The digitizer board was characterized by a resolution of 24 bits, effectively providing a resolution of 19 bits. The sample rate, variable between 50 and 400 samples per second (sps), was set up as 100 sps.
Table 3 shows the information regarding the selected seismic events recorded by these instruments and used in the analysis. Figure 20 shows the map of the recorded seismic events.

Data Analysis and Experimental Results

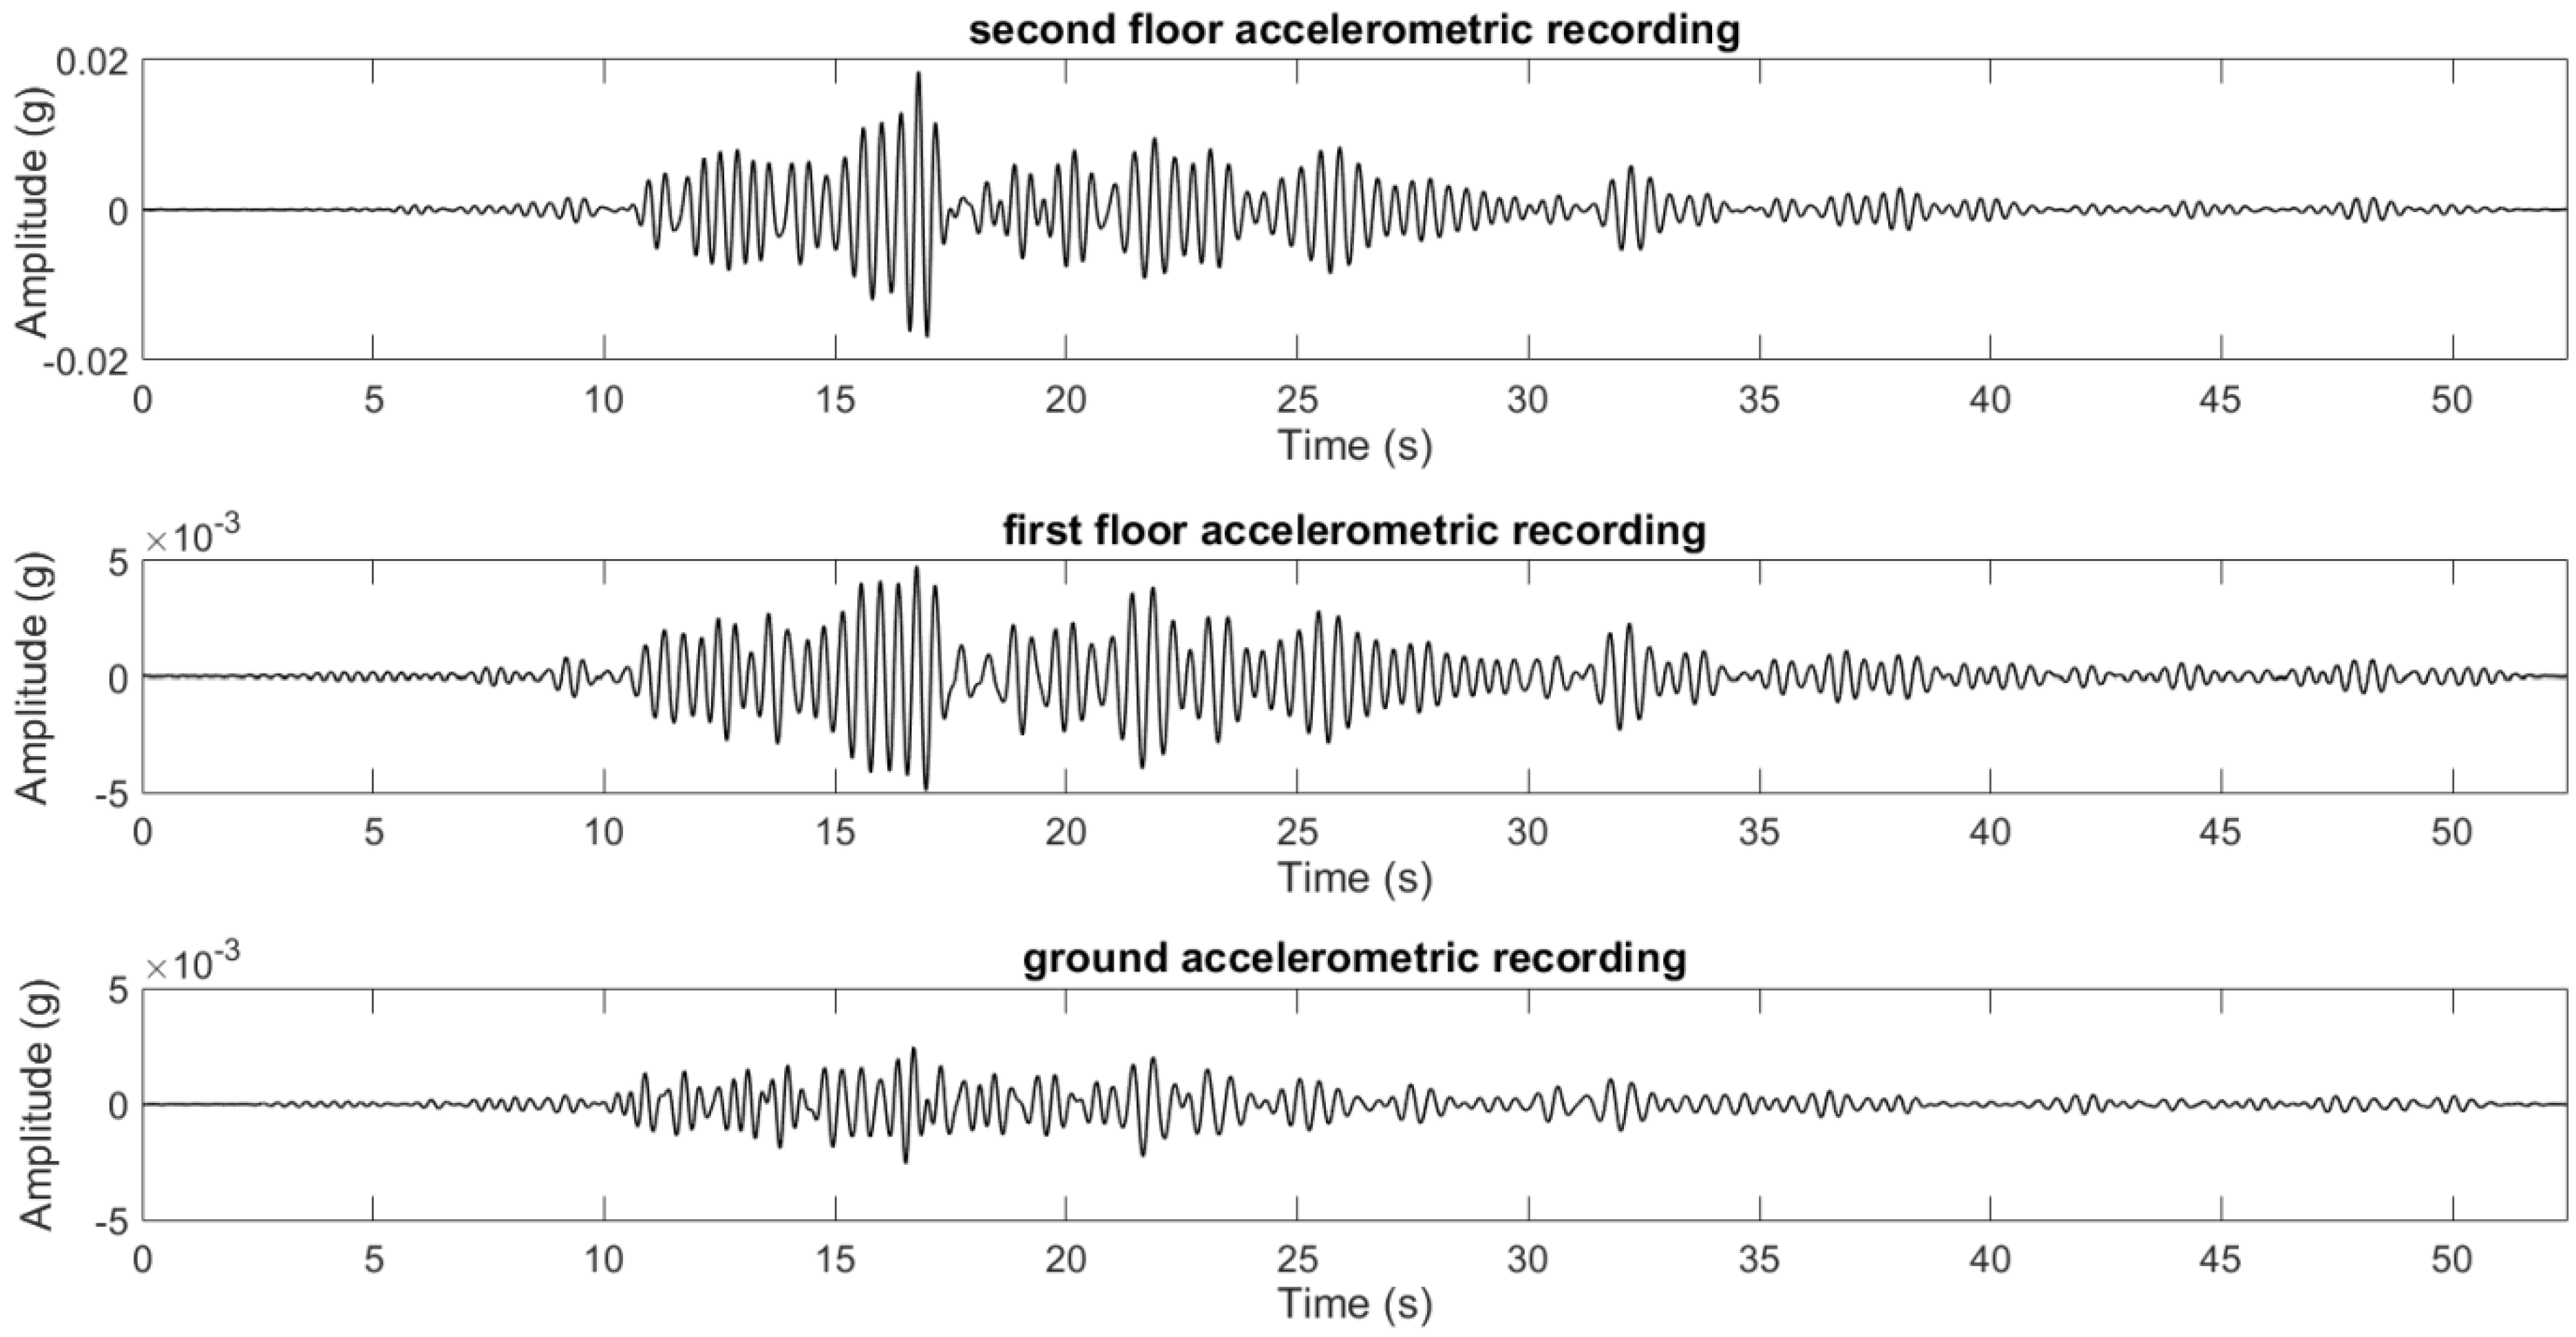
In order to apply the method for damage detection, first of all the structural response acceleration at each floor has been analyzed. Figure 21 shows as an example the accelerometric recordings related to the event recorded on 9 April 2009 at 04:32 (see Table 3).
As for the nonlinear numerical models, the mode shapes and the curvature differences have been evaluated for each seismic recording. Figure 22, Figure 23, Figure 24 and Figure 25 show the results retrieved for the recorded events. In particular, the ground accelerations, the related response spectra and the mode curvature variations between the minimum fundamental frequency time-instant (B) and a general time-instant immediately before the earthquake (A) are plotted.

5. Discussion and Conclusions

Nowadays, many dynamic identification techniques are based on the evaluation of changes of structural parameters (frequency, modal shape, equivalent viscous damping) to localize possible damage that has occurred on a monitored structure during a critical event. Mode curvature variations are strictly associated with structural damage; indeed, mode curvature is used as a control parameter for damage localization after an earthquake. Scientific literature shows that most of the methods for structural damage detection require a large number of sensors placed on the monitored structure. This involves high costs if the monitoring system is extended, continuous, and covers many structures.
Most of the vibration-based procedures and methods for damage detection on existing structures are based on the evaluation of just stationary or “stationarized” structural modal parameters. The band-variable filter allows for the separation of the variable contributions of each mode of vibration within both linear and nonlinear fields. The capability to isolate each individual contribution allows us to better understand how damage propagates through the structure, and which are the main modes involved within the damage process during the nonlinear behavior of each excited structure.
In this paper, the upgrade of an existing procedure for damage detection on framed structures subjected to strong motion earthquakes has been presented. The results show the possibility of localizing structural damage and identifying the most damaged floor(s) after an earthquake through the analysis of the curvature difference between two time-instants (the minimum fundamental frequency time-instant and the reference time-instant before the event).
The revised Curvature Evolution Method has been successfully applied both to numerical models and on a real case study. The results retrieved for all of the analyzed case-studies showed that the curvature difference is systematically able to localize the most damaged floor. Moreover, the correlation between maximum inter-story drift and maximum curvature variation has been defined. With reference to the empirical relationship, further studies are necessary to better understand how it could be possible to generalize results and to define new analytical equations to relate modal curvature and inter-story drift. This last step is important to evolve the method towards a third level, according to the Rytter classification of structural damage. Compared with the original version of the CEM method, by analyzing this correlation it could be possible to obtain more accurate information about both the location and severity of any structural damage.
The capability of the modified CEM for damage detection on framed damaged structures has been validated using accelerometric data acquired from a real structure (Navelli town hall) monitored during the L’Aquila 2009 seismic sequence. With reference to the Navelli accelerometric dataset, it has been demonstrated that the damaged level identified by using the proposed approach agrees with the damage observed at the first floor of the monitored structure using visual inspection.
The proposed method has been applied to structures with a predominantly shear dynamic behavior, representative of European constructions. More detailed analyses are necessary to test the capability of the modified method, to detect and quantify damage on high-rise buildings governed by a flexural behavior. New numerical analyses will be performed considering both new models for infilled panels and non-rigid beam–column joints [54]. In this paper, only the fundamental mode of vibration has been considered, but in the future it would be necessary to apply this approach to also consider the contribution of higher modes to the structural damage process (nonlinear field) during an earthquake.

Author Contributions

Conceptualization, R.D., C.I. and F.C.P.; methodology, R.D., C.I., F.C.P.; formal analysis, R.D., G.A., C.I.; data curation, R.D., C.I. and S.P.; writing—original draft preparation, R.D., C.I., F.C.P. and S.P.; writing—review and editing, R.D., C.I., F.C.P. and S.P.; project administration, F.C.P.; funding acquisition, F.C.P. All authors have read and agreed to the published version of the manuscript.

Funding

This study was partially funded by the Italian Department of Civil Protection within the project DPC-RELUIS 2019-2021. The monitoring system installed in Navelli was supported by the German Earthquake Task Force and installed by GFZ researchers.

Institutional Review Board Statement

Not applicable.

Informed Consent Statement

Not applicable.

Data Availability Statement

The data presented in this study are available on request from the corresponding author.

Acknowledgments

The authors thank the GFZ for sharing accelerometric data related to the Navelli town hall.

Conflicts of Interest

The authors declare no conflict of interest.

Appendix A

Table A1. Values of the main parameters evaluated for the 3-story numerical model in correspondence to the fundamental mode of vibration.
Time Instant ATime Instant B
Accelerogram PGANo. of FloorsInter-Story Drift
(%)
Mode ShapeMode CurvatureCurvature DifferenceMode ShapeMode CurvatureCurvature DifferenceCurvature Difference
B-A
A1 (soil class B)
0.34 g
00.000.000−0.0130.0000.000−0.0670.0000.000
10.820.3510.0260.0510.331−0.0020.1320.080
21.160.7630.0720.0600.7960.0970.1650.105
30.511.0000.0870.0281.0000.1300.1000.072
A2 (soil class B)
0.34 g
00.000.000−0.0250.0000.000−0.0910.0000.000
10.540.3590.0180.0680.281−0.0390.1430.075
20.960.7650.0740.0810.7450.0580.1890.108
30.531.0000.0860.0381.0000.1040.1360.099
A3 (soil class B)
0.13 g
00.000.000−0.0240.0000.000−0.0550.0000.000
10.380.3480.0190.0680.328−0.0040.1060.039
20.570.7590.0750.0800.7670.0750.1340.055
30.271.0000.0870.0361.0000.1030.0830.047
A4 (soil class B)
0.15 g
00.000.000−0.0310.0000.000−0.0530.0000.000
10.500.3410.0110.0720.331−0.0020.1050.034
20.710.7540.0670.0870.7690.0760.1320.045
30.331.0000.0820.0461.0000.1030.0800.034
A5 (soil class B)
0.22 g
00.000.000−0.0580.0000.000−0.0700.0000.000
10.450.308−0.0070.1090.320−0.0160.1250.016
20.730.7470.0720.1380.7370.0740.1600.022
30.451.0000.1010.0871.0000.1090.1050.018
A6 (soil class B)
0.48 g
00.000.000−0.0360.0000.000−0.0490.0000.000
10.510.3580.0060.0770.3400.0050.1030.026
20.810.7710.0650.0950.7780.0830.1280.033
30.491.0000.0830.0531.0000.1080.0740.021
A7 (soil class B)
0.35 g
00.000.000−0.0310.0000.000−0.0720.0000.000
10.510.3630.0120.0740.315−0.0140.1300.056
20.750.7690.0700.0900.7740.0800.1660.076
30.381.0000.0860.0471.0000.1160.1080.061
Table A2. Values of the main parameters evaluated for the 5-story numerical model in correspondence to the fundamental mode of vibration.
Time Instant ATime Instant B
Accelerogram
PGA
No. of FloorInter-Story Drift
(%)
Mode ShapeMode CurvatureCurvature DifferenceMode ShapeMode CurvatureCurvature DifferenceCurvature Difference
B-A
A1 (soil class B)
0.34 g
00.000.000−0.0490.0000.000−0.0560.0000.0000
10.480.189−0.0430.0550.183−0.0490.0620.0071
20.740.4660.0030.0950.4780.0080.1130.0179
30.680.7150.0580.1040.7470.0780.1250.0214
40.470.8990.0570.0480.9240.0730.0510.0028
50.201.0000.0420.0331.0000.0500.032−0.0012
A2 (soil class B)
0.34 g
00.000.000−0.0470.0000.000−0.0610.0000.0000
10.330.186−0.0400.0550.166−0.0570.0640.0093
20.590.4640.0070.0950.452−0.0020.1160.0212
30.580.7140.0610.1010.7240.0710.1330.0322
40.380.8980.0570.0440.9100.0700.0590.0151
50.181.0000.0410.0311.0000.0480.0390.0078
A3 (soil class B)
0.13 g
00.000.000−0.0470.0000.000−0.0540.0000.0000
10.170.193−0.0390.0550.169−0.0490.0590.0043
20.290.4720.0090.0950.4470.0000.1030.0082
30.280.7200.0620.0990.7040.0600.1140.0153
40.210.9010.0570.0420.8940.0590.0530.0109
50.121.0000.0410.0301.0000.0420.0370.0073
A4 (soil class B)
0.15 g
00.000.000−0.0490.0000.000−0.0580.0000.0000
10.320.176−0.0440.0540.176−0.0510.0660.0114
20.500.4500.0010.0950.4690.0070.1160.0215
30.430.7040.0580.1060.7320.0720.1230.0171
40.290.8940.0580.0500.9080.0640.0500.0009
50.151.0000.0420.0341.0000.0430.0370.0032
A5 (soil class B)
0.22 g
00.000.000−0.0490.0000.000−0.0580.0000.0000
10.270.177−0.0440.0550.168−0.0530.0630.0078
20.470.4510.0020.0950.4530.0000.1120.0166
30.470.7040.0580.1060.7180.0670.1250.0191
40.350.8950.0580.0500.9040.0650.0560.0060
50.181.0000.0420.0341.0000.0450.0380.0043
A6 (soil class B)
0.48 g
00.000.000−0.0480.0000.000−0.0520.0000.0000
10.310.179−0.0410.0550.189−0.0420.0620.0069
20.510.4590.0060.0960.4820.0140.1080.0122
30.530.7110.0610.1030.7340.0700.1080.0050
40.380.8970.0580.0460.9070.0600.042−0.0034
50.191.0000.0420.0321.0000.0400.0320.0004
A7 (soil class B)
0.35 g
00.000.000−0.0500.0000.000−0.0590.0000.0000
10.310.172−0.0450.0540.174−0.0530.0650.0112
20.490.444−0.0010.0940.4660.0050.1170.0233
30.480.6970.0550.1060.7330.0730.1270.0216
40.330.8900.0570.0510.9120.0670.0530.0022
50.171.0000.0420.0351.0000.0450.0370.0023
Table A3. Values of the main parameters evaluated for the 5-story numerical model with infill panels in correspondence to the fundamental mode of vibration.
Time Instant ATime Instant B
Accelerogram PGANo. of FloorInter-Story Drift
(%)
Mode ShapeMode CurvatureCurvature DifferenceMode ShapeMode CurvatureCurvature DifferenceCurvature Difference
B-A
A1 (soil class B)
0.34 g
00.000.000−0.0460.00000.000−0.0540.0000.000
10.520.169−0.0450.04670.203−0.0420.0670.020
20.760.430−0.0070.08350.5150.0250.1210.037
30.620.6870.0510.10340.7760.0870.1170.014
40.340.8880.0580.05260.9310.0700.037−0.016
50.151.0000.0440.03161.0000.0430.028−0.004
A5 (soil class B)
0.22 g
00.000.000−0.0460.00000.000−0.0510.0000.000
10.230.167−0.0460.04650.185−0.0430.0590.013
20.320.426−0.0080.08310.4720.0090.1040.021
30.290.6840.0500.10450.7270.0670.1090.005
40.240.8860.0580.05400.9060.0620.046−0.008
50.141.0000.0440.03231.0000.0430.0320.000
A6 (soil class B)
0.48 g
00.000.000−0.0460.00000.000−0.0570.0000.000
10.240.165−0.0470.04560.174−0.0500.0630.017
20.400.422−0.0100.08230.4620.0040.1110.029
30.350.6810.0490.10560.7240.0680.1210.015
40.230.8850.0580.05530.9060.0640.052−0.003
50.121.0000.0450.03251.0000.0440.0370.004
A2 (soil class D)
0.26 g
00.000.0000.0000.00000.000−0.0350.0000.000
10.670.1750.0000.00010.180−0.0300.0390.039
20.900.4400.0000.00030.4760.0060.0700.069
30.710.6950.0000.00030.7390.0450.0740.073
40.340.8910.0000.00020.9140.0400.0300.030
50.161.0000.0000.00011.0000.0270.0210.021
Table A4. Values of the main parameters evaluated for the 8-story numerical model in correspondence to the fundamental mode of vibration.
Time Instant ATime Instant B
Accelerogram PGANo. of FloorInter-Story Drift
(%)
Mode ShapeMode CurvatureCurvature DifferenceMode ShapeMode CurvatureCurvature DifferenceCurvature Difference
B-A
A1 (soil class B)
0.34 g
00.000.000−0.0000360.0000000.000−0.0020.00000.0000
10.330.111−0.0000360.0000360.096−0.0020.00190.0019
20.450.276−0.0000140.0000580.241−0.0010.00250.0024
30.340.4410.0000100.0000600.382−0.0010.00200.0019
40.420.5930.0000160.0000430.534−0.0010.00190.0019
50.540.7420.0000320.0000520.7100.0020.00400.0039
60.590.8640.0000460.0000500.8640.0040.00390.0038
70.410.9510.0000280.0000180.9580.0030.00120.0012
80.201.0000.0000260.0000341.0000.0020.00070.0007
A2 (soil class B)
0.34 g
00.000.000−0.0000220.0000000.000−0.0010.00000.0000
10.730.126−0.0000190.0000240.1850.0000.00240.0024
20.810.303−0.0000020.0000390.4160.0020.00390.0039
30.370.4690.0000110.0000350.5780.0030.00180.0018
40.210.6170.0000120.0000230.6970.0010.00010.0001
50.300.7590.0000200.0000300.8090.0010.00140.0014
60.340.8740.0000280.0000300.9030.0020.00190.0019
70.260.9550.0000220.0000160.9660.0010.00110.0011
80.141.0000.0000150.0000141.0000.0010.00090.0009
A3 (soil class B)
0.13 g
00.000.000−0.0000130.0000000.000−0.0040.00000.0000
11.100.119−0.0000130.0000140.155−0.0040.00460.0046
21.550.289−0.0000040.0000220.3820.0000.00830.0083
31.380.4570.0000050.0000230.5970.0050.00930.0093
40.920.6090.0000080.0000160.7640.0060.00550.0055
50.510.7540.0000130.0000190.8720.0050.00310.0031
60.310.8710.0000170.0000180.9400.0040.00280.0028
70.180.9530.0000140.0000100.9790.0020.00270.0027
80.101.0000.0000090.0000091.0000.0010.00350.0035
A4 (soil class B)
0.15 g
00.000.000−0.0000230.0000000.000−0.0030.00000.0000
10.790.119−0.0000230.0000240.149−0.0030.00380.0038
21.110.290−0.0000060.0000400.3680.0000.00680.0068
30.950.4570.0000090.0000390.5690.0040.00670.0067
40.690.6080.0000120.0000270.7200.0040.00340.0034
50.480.7540.0000220.0000330.8350.0030.00280.0028
60.300.8710.0000300.0000320.9180.0030.00310.0031
70.180.9530.0000240.0000170.9710.0020.00250.0025
80.111.0000.0000160.0000161.0000.0010.00270.0027
A5 (soil class B)
0.22 g
00.000.000−0.0000340.0000000.000−0.0090.00000.0000
13.630.114−0.0000340.0000340.190−0.0070.01110.0111
24.860.2790.0000120.0000800.4830.0040.01960.0195
34.100.4440.0000100.0000320.7220.0140.01840.0184
42.620.5960.0000160.0000400.8660.0120.00690.0069
51.030.7440.0000310.0000490.9300.0060.00320.0032
60.350.8650.0000440.0000480.9680.0030.00540.0054
70.230.9510.0000360.0000260.9900.0020.00740.0074
80.131.0000.0000250.0000231.0000.0010.00810.0081
A6 (soil class B)
0.48 g
00.000.000−0.0000320.0000000.000−0.0030.00000.0000
10.720.122−0.0000300.0000340.173−0.0020.00340.0034
21.020.298−0.0000070.0000550.4080.0020.00590.0058
30.920.4680.0000160.0000550.6040.0040.00500.0049
40.660.6200.0000200.0000360.7450.0030.00200.0020
50.370.7610.0000300.0000420.8510.0030.00190.0019
60.250.8750.0000390.0000410.9250.0020.00220.0022
70.210.9550.0000310.0000240.9730.0020.00190.0019
80.141.0000.0000210.0000221.0000.0010.00200.0020
A7 (soil class B)
0.35 g
00.000.000−0.0000200.0000000.000−0.0060.00000.0000
10.990.121−0.0000180.0000220.159−0.0040.00880.0088
21.430.290−0.0000040.0000350.3890.0010.01090.0109
31.420.4520.0000080.0000320.6010.0060.01150.0115
41.150.5980.0000090.0000210.7620.0070.00730.0073
50.700.7420.0000170.0000280.8710.0050.00520.0052
60.370.8630.0000260.0000290.9390.0040.00490.0049
70.230.9500.0000220.0000160.9790.0020.00480.0048
80.141.0000.0000150.0000131.0000.0010.00550.0055
Table A5. Values of the main parameters evaluated for the 5-story numerical model with irregular plan in correspondence to the fundamental mode of vibration.
Time Instant ATime Instant B
Accelerogram PGANo. of FloorInter-Story Drift
(%)
Mode ShapeMode CurvatureCurvature DifferenceMode ShapeMode CurvatureCurvature DifferenceCurvature Difference
B-A
A1 (soil class B)
0.34 g
00.000.000−0.0320.000000.000−0.0470.0000.000
10.340.146−0.0420.022200.102−0.0640.0300.008
20.650.354−0.0240.050100.298−0.0510.0600.010
30.880.6020.0150.070800.5610.0050.1030.032
40.880.8030.0140.031100.7980.0240.0660.035
50.681.0000.0020.020201.0000.0170.0410.020
A2 (soil class D)
0.26 g
00.000.000−0.0300.000000.000−0.0370.0000.000
11.740.159−0.0380.022800.181−0.0410.0330.010
22.370.378−0.0160.052000.437−0.0060.0730.021
32.540.6250.0230.068900.7080.0590.1010.033
42.140.8170.0190.025800.8960.0630.0410.015
51.421.0000.0040.016101.0000.0420.0160.000

References

  1. Ditommaso, R.; Ponzo, F.C.; Auletta, G. Damage detection on framed structures: Modal curvature evaluation using Stockwell Transform under seismic excitation. Earthq. Eng. Eng. Vib. 2015, 14, 265–274. [Google Scholar] [CrossRef]
  2. Ditommaso, R.; Parolai, S.; Mucciarelli, M.; Eggert, S.; Sobiesiak, M.; Zschau, J. Monitoring the response and the back-radiated energy of a building subjected to ambient vibration and impulsive action: The Falkenhof Tower (Potsdam, Germany). Bull. Earthq. Eng. 2009, 8, 705–722. [Google Scholar] [CrossRef] [Green Version]
  3. Mucciarelli, M.; Bianca, M.; Ditommaso, R.; Gallipoli, M.R.; Masi, A.; Milkereit, C.; Parolai, S.; Picozzi, M.; Vona, M. Far field damage on RC buildings: The case study of Navelli during the L’Aquila (Italy) seismic sequence, 2009. Bull. Earthq. Eng. 2010, 9, 263–283. [Google Scholar] [CrossRef]
  4. Mallat, S. A Wavelet Tour of Signal Processing; Academic Press: New York, NY, USA, 1998. [Google Scholar]
  5. Şafak, E. Wave propagation formulation of seismic response of multi-story buildings. J. Struct. Eng. ASCE 1999, 125, 426–437. [Google Scholar] [CrossRef]
  6. Şafak, E. Propagation of seismic waves in tall buildings. Struct. Des. Tall Build. 1998, 7, 295–306. [Google Scholar] [CrossRef]
  7. Şafak, E. Detection of seismic damage in multi-story buildings by using wave propagation analysis. In Proceedings of the 6th National Conference on Earthquake Engineering, Oakland, CA, USA, 31 May–4 June 1998; p. 12, Paper No. 171. [Google Scholar]
  8. Parolai, S. Denoising of Seismograms Using the S Transform. Bull. Seism. Soc. Am. 2009, 99, 226–234. [Google Scholar] [CrossRef]
  9. Petrovic, B.; Parolai, S.; Pianese, G.; Dikmen, S.U.; Moldobekov, B.; Orunbaev, S.; Paolucci, R. Joint deconvolution of building and downhole seismic recordings: An application to three test cases. Bull. Earthq. Eng. 2017, 16, 613–641. [Google Scholar] [CrossRef]
  10. Ditommaso, R.; Mucciarelli, M.; Ponzo, F.C. Analysis of non-stationary structural systems by using a band-variable filter. Bull. Earthq. Eng. 2012, 10, 895–911. [Google Scholar] [CrossRef]
  11. Iacovino, C.; Ditommaso, R.; Ponzo, F.; Limongelli, M. The Interpolation Evolution Method for damage localization in structures under seismic excitation. Earthq. Eng. Struct. Dyn. 2018, 47, 2117–2136. [Google Scholar] [CrossRef]
  12. Michel, C.; Guéguen, P. Interpretation of the velocity measured in buildings by seismic interferometry based on Timoshenko beam theory under weak and moderate motion. Soil Dyn. Earthq. Eng. 2018, 104, 131–142. [Google Scholar] [CrossRef]
  13. Serra, M.; Festa, G.; Vassallo, M.; Zollo, A.; Quattrone, A.; Ceravolo, R. Damage detection in elastic properties of masonry bridges using coda wave interferometry. Struct. Control. Health Monit. 2016, 24, e1976. [Google Scholar] [CrossRef]
  14. Todorovska, M. Seismic Interferometry of a Soil-Structure Interaction Model with Coupled Horizontal and Rocking Response. Bull. Seism. Soc. Am. 2009, 99, 611–625. [Google Scholar] [CrossRef]
  15. Pinnegar, C.R.; Eaton, D.E. The S-transform with windows of arbitrary and varying shape. Geophysics 2003, 68, 381–385. [Google Scholar] [CrossRef]
  16. Askari, R.; Siahkoohi, H.R. Ground roll attenuation using the S and x-f-k transforms. Geophys. Prospect. 2007, 56, 105–114. [Google Scholar] [CrossRef]
  17. Simon, C.; Ventosa, S.; Schimmel, M.; Heldring, A.; Danobeitia, J.J.; Gallart, J.; Mànuel, A. The S-Transform and Its Inverses: Side Effects of Discretizing and Filtering. IEEE Trans. Signal Process. 2007, 55, 4928–4937. [Google Scholar] [CrossRef] [Green Version]
  18. Snieder, R.; Şafak, E. Extracting the Building Response Using Seismic interferometry: Theory and Application to the Millikan Library in Pasadena. California. Bull. Seism. Soc. Am. 2006, 96, 586–598. [Google Scholar] [CrossRef] [Green Version]
  19. Limongelli, M.P. Seismic health monitoring of an instrumented multistory building using the interpolation method. Earthq. Eng. Struct. Dyn. 2014, 43, 1581–1602. [Google Scholar] [CrossRef]
  20. Gerardi, V.; Ditommaso, R.; Auletta, G.; Ponzo, F.C. Reinforced concrete framed structures: Numerical validation of two physical models capable to consider the stiffness contribution of infill panels on framed structures in operative conditions. Ing. Sismica 2018, 35, 1–21. [Google Scholar]
  21. Serlenga, V.; Gallipoli, M.R.; Ditommaso, R.; Ponzo, C.F.; Tragni, N.; Perrone, A.; Stabile, T.A.; Calamita, G.; Vignola, L.; Carso, R.F.; et al. An integrated approach for structural behavior characterization of the Gravina Bridge (Matera, Southern Italy). Struct. Health Monit. 2021. [Google Scholar] [CrossRef]
  22. Doebling, S.; Farrar, C.; Prime, M.; Shevitz, D. Damage Identification and Health Monitoring of Structural and Mechanical Systems from Changes in Their Vibration Characteristics: A Literature Review; Los Alamos National Laboratory Report; USDOE: Washington, DC, USA, 1996. [Google Scholar]
  23. Dinh, H.M.; Nagayama, T.; Fujino, Y. Structural parameter identification by use of additional known masses and its experimental application. Struct. Control. Health Monit. 2011, 19, 436–450. [Google Scholar] [CrossRef]
  24. Chelidze, D. Identifying Multidimensional Damage in a Hierarchical Dynamical System. Nonlinear Dyn. 2004, 37, 307–322. [Google Scholar] [CrossRef]
  25. Foti, D.; Diaferio, M.; Giannoccaro, N.I.; Mongelli, M. Ambient vibration testing, dynamic identification and model updating of a historic tower. NDT E Int. 2012, 47, 88–95. [Google Scholar] [CrossRef]
  26. Choi, S.; Park, S.; Yoon, S.; Stubbs, N. Nondestructive damage identification in plate structures using changes in modal compliance. NDT E Int. 2005, 38, 529–540. [Google Scholar] [CrossRef]
  27. Rytter, A. Vibrational Based Inspection of Civil Engineering Structures. Ph.D. Thesis, Aalborg University, Aalborg, Denmark, 1993. [Google Scholar]
  28. Pandey, A.; Biswas, M.; Samman, M.; Pandey, A.; Biswas, M.; Samman, M. Damage detection from changes in curvature mode shapes. J. Sound Vib. 1991, 145, 321–332. [Google Scholar] [CrossRef]
  29. Ponzo, F.C.; Iacovino, C.; Ditommaso, R.; Bonano, M.; Lanari, R.; Soldovieri, F.; Cuomo, V.; Bozzano, F.; Ciampi, P.; Rompato, M. Transport Infrastructure SHM Using Integrated SAR Data and on Site Vibrational Acquisitions: “Ponte Della Musica–Armando Trovajoli” Case Study. Appl. Sci. 2021, 11, in press. [Google Scholar]
  30. Pai, P.; Young, L.G. Damage detection of beams using operational deflection shapes. Int. J. Solids Struct. 2001, 38, 3161–3192. [Google Scholar] [CrossRef]
  31. Ponzo, F.C.; DiTommaso, R.; Auletta, G.; Mossucca, A. A fast method for structural health monitoring of Italian reinforced concrete strategic buildings. Bull. Earthq. Eng. 2010, 8, 1421–1434. [Google Scholar] [CrossRef]
  32. Amezquita-Sanchez, J.P.; Adeli, H. Signal Processing Techniques for Vibration-Based Health Monitoring of Smart Structures. Arch. Comput. Methods Eng. 2016, 23, 1–15. [Google Scholar] [CrossRef]
  33. Iacovino, C.; DiTommaso, R.; Limongelli, M.P.; Ponzo, F.C. Experimental damage localization in a full-scale 7 story benchmark building under seismic excitation. In Proceedings of the SPIE—The International Society for Optical Engineering, Conference on Nondestructive Characterization and Monitoring of Advanced Materials, Aerospace, Civil Infrastructure, and Transportation XI 2017, Portland, OR, USA, 26–29 March 2017; Volume 10169, p. 101691B. [Google Scholar]
  34. Limongelli, M. The interpolation damage detection method for frames under seismic excitation. J. Sound Vib. 2011, 330, 5474–5489. [Google Scholar] [CrossRef]
  35. Roy, K.; Ray-Chaudhuri, S. Fundamental mode shape and its derivatives in structural damage localization. J. Sound Vib. 2013, 332, 5584–5593. [Google Scholar] [CrossRef]
  36. Xiang, J.; Matsumoto, T.; Wang, Y.; Jiang, Z. Detect damages in conical shells using curvature mode shape and wavelet finite element method. Int. J. Mech. Sci. 2013, 66, 83–93. [Google Scholar] [CrossRef]
  37. Radzieński, M.; Krawczuk, M.; Palacz, M. Improvement of damage detection methods based on experimental modal parameters. Mech. Syst. Signal Process. 2011, 25, 2169–2190. [Google Scholar] [CrossRef]
  38. Xin, Y.; Li, J.; Hao, H. Damage Detection in Initially Nonlinear Structures Based on Variational Mode Decomposition. Int. J. Struct. Stab. Dyn. 2020, 20. [Google Scholar] [CrossRef]
  39. Quqa, S.; Landi, L.; Diotallevi, P.P. Instantaneous modal identification under varying structural characteristics: A decentralized algorithm. Mech. Syst. Signal Process. 2020, 142. [Google Scholar] [CrossRef]
  40. Hsu, T.Y.; Shih, Y.C.; Pham, Q.-V. Damage detection of a thin plate using modal curvature via macrostrain measurement. Earthq. Engineering and Engineering Vibration 2019, 18, 409–424. [Google Scholar] [CrossRef]
  41. Katunin, A. Identification of structural damage using S-transform from 1D and 2D mode shapes. Meas. J. Int. Meas. Confed. 2021, 173. [Google Scholar] [CrossRef]
  42. Ghahremani, B.; Bitaraf, M.; Ghorbani-Tanha, A.K. Structural damage identification based on fast S-transform and convolutional neural networks. Structures 2021, 29, 1199–1209. [Google Scholar] [CrossRef]
  43. Stockwell, R.G.; Mansinha, L.; Lowe, R.P. Localization of the complex spectrum: The S transform. IEEE Trans. Signal Process. 1996, 44, 998–1001. [Google Scholar] [CrossRef]
  44. Pianese, G.; Petrovic, B.; Parolai, S.; Paolucci, R. Identification of the nonlinear seismic response of buildings by a combined Stockwell Transform and deconvolution interferometry approach. Bull. Earthq. Eng. 2018, 16, 3103–3126. [Google Scholar] [CrossRef]
  45. Ditommaso, R.; Ponzo, F.C. Automatic evaluation of the fundamental frequency variations and related damping factor of reinforced concrete framed structures using the Short Time Impulse Response Function (STIRF). Eng. Struct. 2015, 82, 104–112. [Google Scholar] [CrossRef]
  46. Cao, M.; Xu, W.; Ostachowicz, W.; Su, Z. Damage identification for beams in noisy conditions based on Teager energy operator-wavelet transform modal curvature. J. Sound Vib. 2014, 333, 1543–1553. [Google Scholar] [CrossRef]
  47. SAP2000. Computers & Structures. Available online: https://www.csiamerica.com/products/sap2000 (accessed on 13 July 2021).
  48. Mainstone, R.J. Supplementary Note on the Stiffness and Strength of Infilled Frames, Current Paper CP13/74; Building Research Establishment: London, UK, 1974. [Google Scholar]
  49. Ministero delle Infrastrutture e dei Trasporti. Nuove Norme Tecniche per le Costruzioni (Italian Seismic CODE). Supplemento ordinario alla “Gazzetta Ufficiale, n. 42 del 20 febbraio 2018-Serie generale. 2018. Available online: https://www.studiopetrillo.com/ntc2018.html (accessed on 31 May 2021).
  50. Calvi, G.M. Alternative choices and criteria for seismic strengthening. Progettazione Sismica 2013, 4. [Google Scholar] [CrossRef]
  51. Picozzi, M.; Ditommaso, R.; Parolai, S.; Mucciarelli, M.; Milkereit, C.; Sobiesiak, M.; Di Giacomo, D.; Gallipoli, M.R.; Pilz, M.; Vona, M.; et al. Real time monitoring of structures in task force missions: The example of the Mw = 6.3 Central Italy Earthquake, April 6, 2009. Nat. Hazards 2009, 52, 253–256. [Google Scholar] [CrossRef]
  52. Picozzi, M.; Parolai, S.; Mucciarelli, M.; Milkereit, C.; Bindi, D.; Ditommaso, R.; Vona, M.; Gallipoli, M.; Zschau, J. Interferometric Analysis of Strong Ground Motion for Structural Health Monitoring: The Example of the L’Aquila, Italy, Seismic Sequence of 2009. Bull. Seism. Soc. Am. 2011, 101, 635–651. [Google Scholar] [CrossRef]
  53. Fleming, K.; Picozzi, M.; Milkereit, C.; Kühnlenz, F.; Lichtblau, B.; Fischer, J.; Zulfikar, C.; Özel, O.; The SAFER and EDIM Working Groups. The Self-organizing Seismic Early Warning Information Network (SOSEWIN). Seismol. Res. Lett. 2009, 80, 755–771. [Google Scholar] [CrossRef]
  54. Chris, G.; Maria, J.; Favvataa, D.J. Kakaletsisb Seismic behaviour of infilled and pilotis RC frame structures with beam–column joint degradation effect. Eng. Struct. 2011, 33, 2821–2831. [Google Scholar]
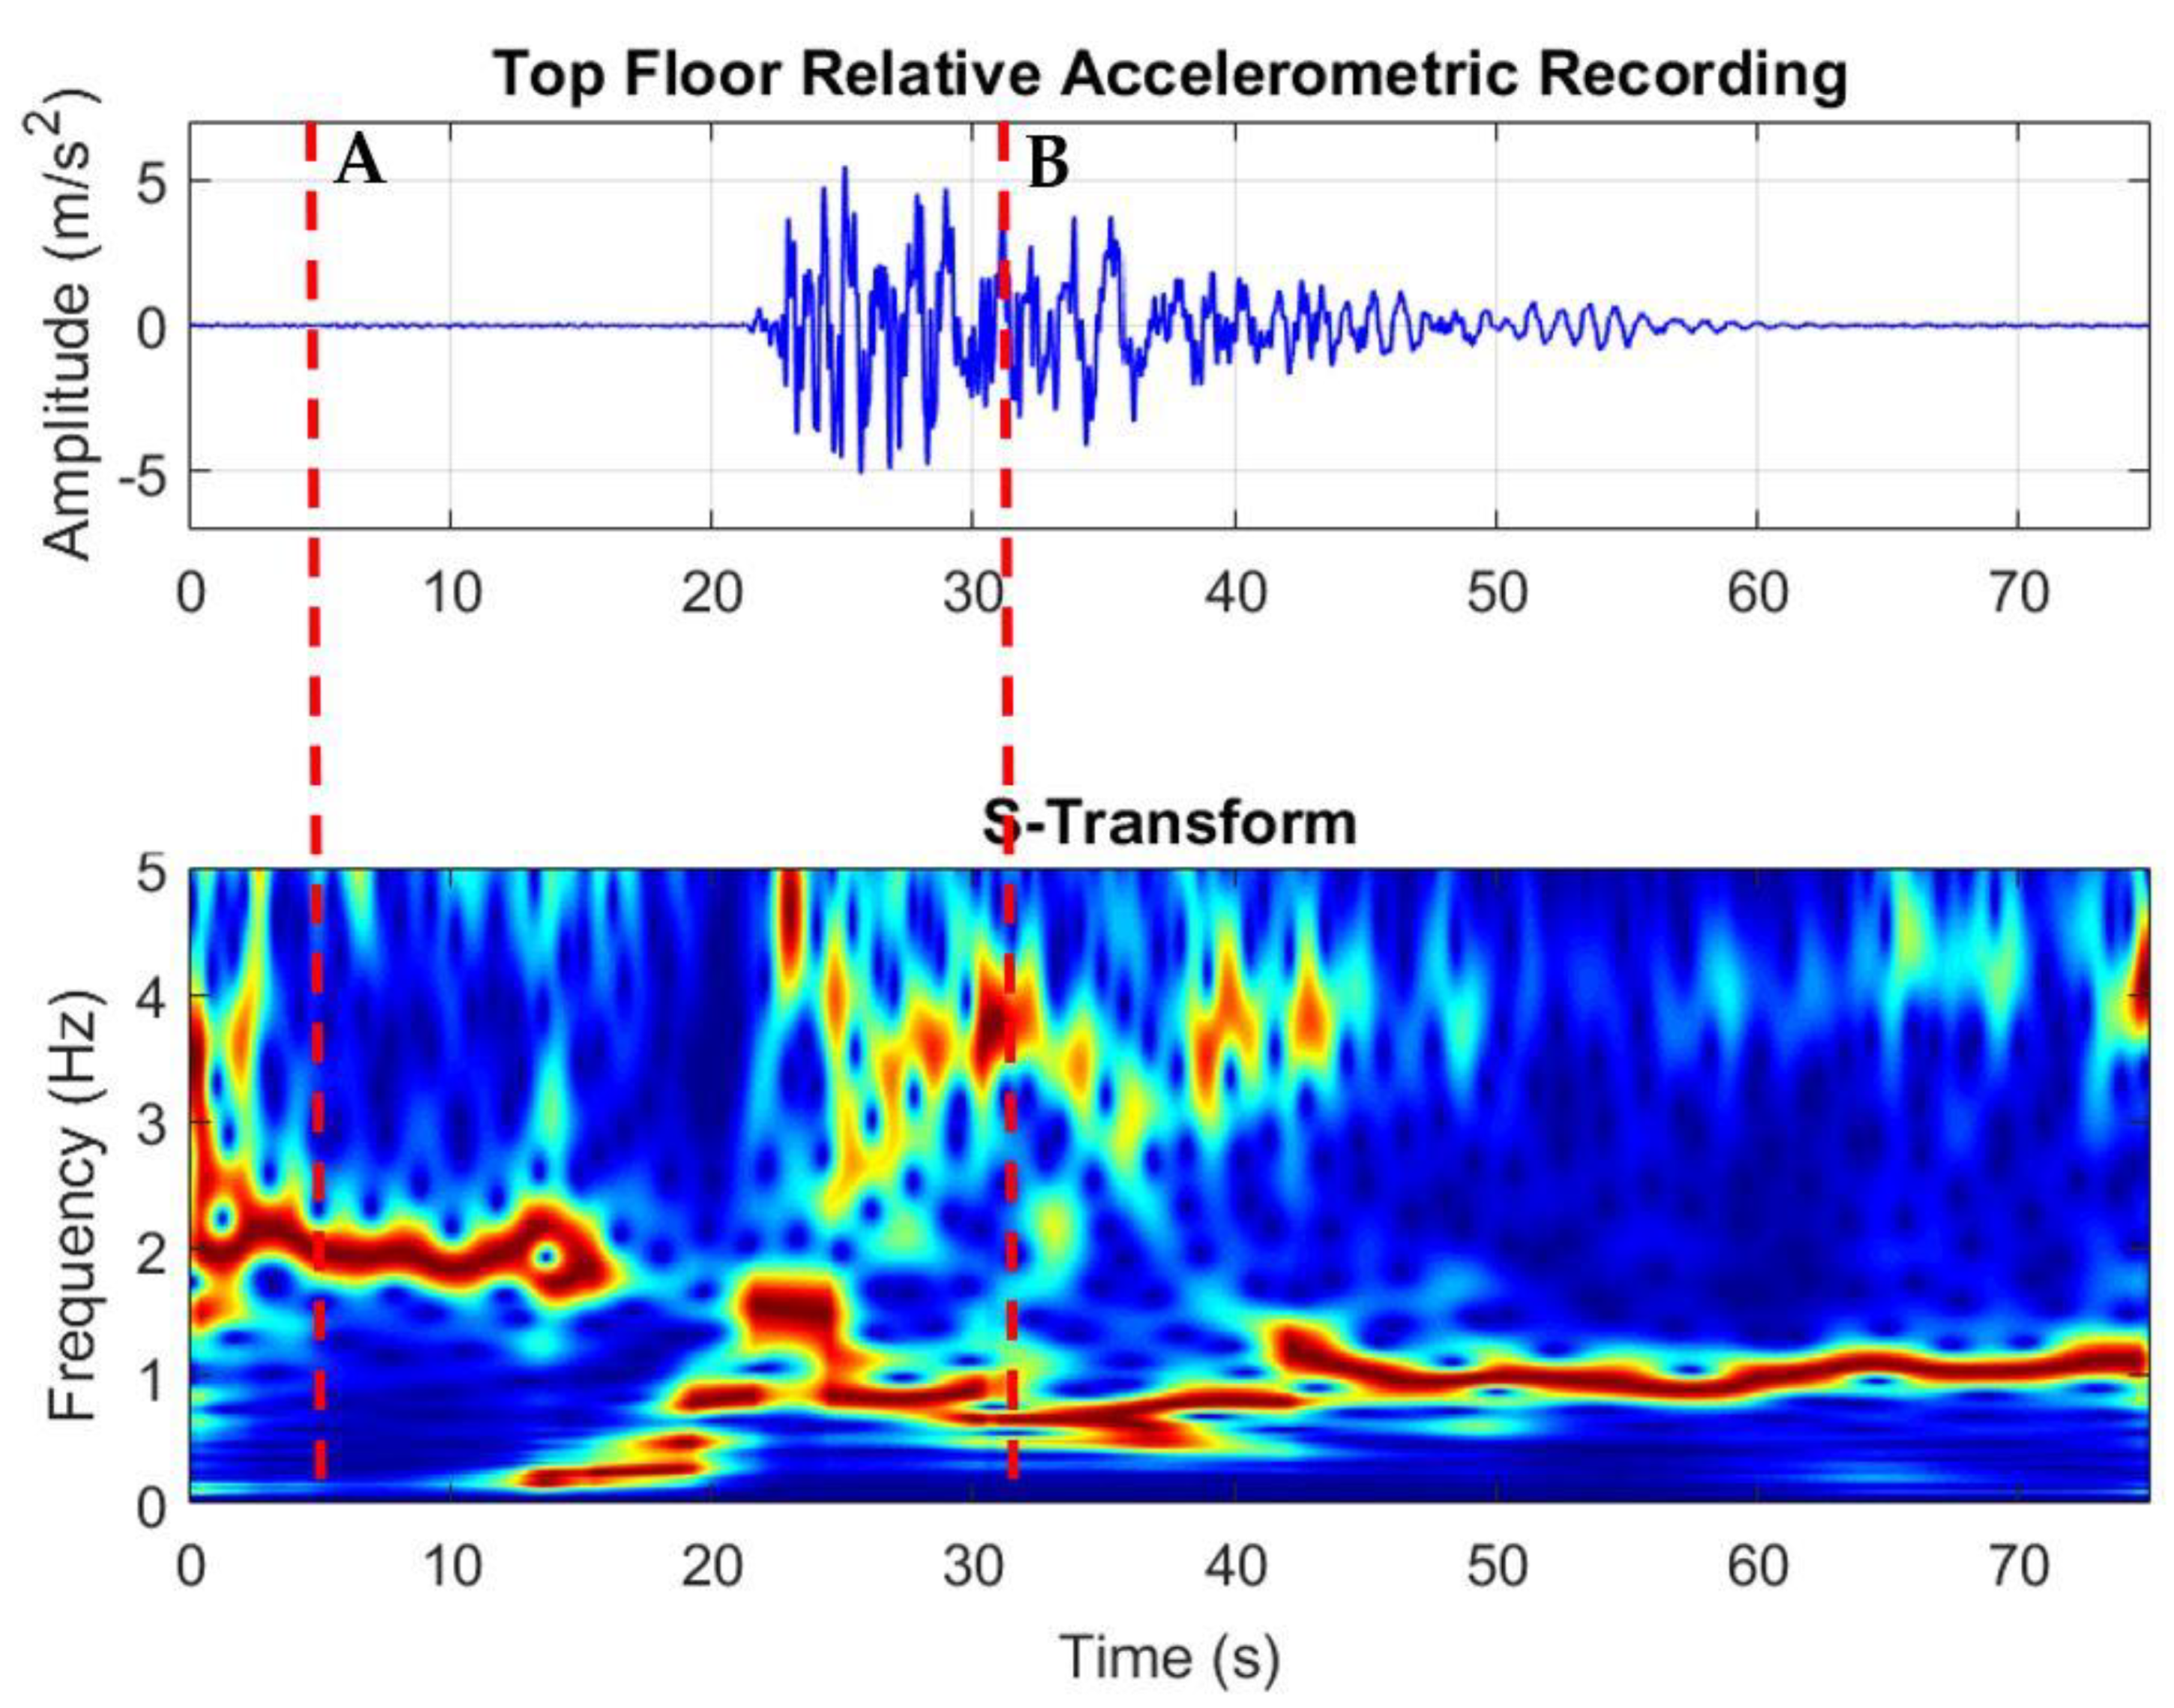
Figure 1. Top: Top floor relative accelerometric recording. Bottom: An example of the Normalized S-Transform of the signals associated with the first mode of vibration of the monitored structure and selection of the time instants (A) and (B).
Applsci 11 06496 g001
Figure 2. Numerical models of structures that are regular in plan: (a) 3 floors, (b) 5 floors, (c) 8 floors.
Applsci 11 06496 g002
Figure 3. Numerical model of a building that has an irregular plan with 5 floors.
Applsci 11 06496 g003
Figure 4. Multilinear plastic link with Pivot hysteretic model used for the nonlinear numerical analyses in SAP2000.
Applsci 11 06496 g004
Figure 5. Numerical model of the infilled framed structure.
Applsci 11 06496 g005
Figure 6. Infill model used for the nonlinear numerical analyses: (a) constitutive model of the infill panel related to Mainstone model (u represents the elastic limit displacement); (b) equivalent diagonal struts scheme.
Applsci 11 06496 g006
Figure 7. Response spectra related to the seven natural accelerograms (A1 to A7, representative of soil class B) used within the numerical analyses.
Applsci 11 06496 g007
Figure 8. Response spectra related to the two artificial accelerograms (A2 and A4, representative of soil class D) used within the numerical analyses.
Applsci 11 06496 g008
Figure 9. Structural damage localization for the numerical models. Results of the 3-story regular in plan structure: (a) curvature difference between the selected time-instants B and A; (b) inter-story drift and damage threshold equal to 0.5% (for non-structural components) valid for reinforced concrete framed structures.
Applsci 11 06496 g009
Figure 10. Structural damage localization on numerical models. Results of the regular in plan 5-story structure: (a) curvature difference between the selected time-instants B and A; (b) inter-story drift and damage threshold equal to 0.5% (for non-structural components) valid for reinforced concrete framed structures.
Applsci 11 06496 g010
Figure 11. Structural damage localization on numerical models. Results of the 5-story regular in plan structure with infill panels: (a) curvature difference between the selected time-instants B and A; (b) inter-story drift and damage threshold equal to 0.5% (for non-structural components) valid for reinforced concrete framed structures.
Applsci 11 06496 g011
Figure 12. Structural damage localization for the numerical models. Results of the 8-story regular in plan structure: (a) curvature difference between the selected time-instants B and A; (b) inter-story drift and damage threshold equal to 0.5% (for non-structural components) valid for reinforced concrete framed structures.
Applsci 11 06496 g012
Figure 13. Structural damage localization for the numerical models. Results of the 5-story irregular in plan structure: (a) curvature difference between the selected time-instants B and A; (b) inter-story drift and damage threshold equal to 0.5% (for non-structural components) valid for reinforced concrete framed structures.
Applsci 11 06496 g013
Figure 14. Structural damage quantification: empirical correlation between the maximum inter-story drift and the maximum curvature difference for the 3-story building.
Applsci 11 06496 g014
Figure 15. Structural damage quantification: empirical correlation between the maximum inter-story drift and the maximum curvature difference for the 5-story building.
Applsci 11 06496 g015
Figure 16. Structural damage quantification: empirical correlation between the maximum inter-story drift and the maximum curvature difference for the 5-story building with infill panels.
Applsci 11 06496 g016
Figure 17. Structural damage quantification: empirical correlation between the maximum inter-story drift and the maximum curvature difference for the 8-story building.
Applsci 11 06496 g017
Figure 18. Picture of the monitored structure (Municipality of Navelli): damage of the infill panels. More details in [3].
Applsci 11 06496 g018
Figure 19. Damage on beam–column joints at the first story of the monitored structure (Municipality of Navelli). More details in [3].
Applsci 11 06496 g019
Figure 20. Map of the selected seismic events used in the analysis, from Google Earth.
Applsci 11 06496 g020
Figure 21. Accelerometric recordings at the different floors of the Navelli municipality building along the transversal direction.
Applsci 11 06496 g021
Figure 22. Accelerometric recordings at the different floors of the Navelli municipality building along the transversal direction.
Applsci 11 06496 g022
Figure 23. Results for the event that occurred on 9 April 2009 at 02:34: (a) ground accelerometric recordings; (b) response spectrum; (c) curvature differences between the selected time-instants B and A.
Applsci 11 06496 g023
Figure 24. Results for the event that occurred on 9 April 2009 at 03:14: (a) ground accelerometric recordings; (b) response spectrum; (c) curvature differences between the selected time-instants B and A.
Applsci 11 06496 g024
Figure 25. Results for the event that occurred on 9 April 2009 at 04:32: (a) ground accelerometric recordings; (b) response spectrum; (c) curvature differences between the selected time-instants B and A.
Applsci 11 06496 g025
Table 1. Fundamental periods of vibration of the numerical models representing the structures under consideration.
3-Story Model5-Story Model5-Story Model with Infill Panel8-Story Model5-Story Model Irregular in Plan
T (s)0.650.840.511.501.28
Table 2. Performance level definition as a function of inter-story drift [50].
Performance LevelInter-Story Drift (%)
Fully Operational (FO)0.2
Operational (DC)0.5
Life Safety (LS)1.5
Near Collapse (NC)2.5
Table 3. Recorded events.
N. EventDate (dd/mm/yyyy)Time (UTC)Magnitude (ML)
18 April 200922:594.3
29 April 200900:535.1
39 April 200902:343.1
49 April 200903:144.2
59 April 200904:324.0
Publisher’s Note: MDPI stays neutral with regard to jurisdictional claims in published maps and institutional affiliations.