Article

Bias Effects on g- and s-Factors in Westcott Convention

Nuclear Human Resource Development Center, Japan Atomic Energy Agency, Tokai-mura, Ibaraki 319-1195, Japan
Appl. Sci. 2021, 11(14), 6558; https://doi.org/10.3390/app11146558
Submission received: 31 May 2021 / Accepted: 13 July 2021 / Published: 16 July 2021
(This article belongs to the Special Issue Research on the Uncertainty of Radionuclide Characterization)

Abstract

:

Featured Application

This paper provides a size of bias on g- and s-factors in Westcott convention, induced by a joining function shape, neutron temperature, and sample temperature, for both 1/v isotopes and non-1/v isotopes. Its impact on neutron activation reaction rate is also discussed. Quantitative results are used for accuracy improvement of neutron activation analysis and neutron capture cross sections.

Abstract

For accuracy improvement of neutron activation analysis and neutron capture cross sections, bias effects are investigated on g- and s-factors in the Westcott convention. As origins of biases, a joining function shape, neutron temperature, and sample temperature have been investigated. Biases are quantitatively deduced for two 1/v isotopes (197Au, 59Co) and six non-1/v isotopes (241Am, 151Eu, 103Rh, 115In, 177Hf, 226Ra). The s-factor calculated with a joining function deduced recently by a detailed Monte Carlo simulation is compared to s-factors calculated with traditional joining functions by Westcott. The results show the bias induced by the sample temperature is small, in the order of 0.1% for the g-factor and in the order of 1% for the s-factor. On the other hand, the bias size induced by a joining function shape for the s-factor depends significantly on both isotopes and neutron temperature. As a result, the reaction rates are also affected significantly. The bias size for the reaction rate is given in the case of an epithermal neutron index r = 0.1, for the eight isotopes.

1. Introduction

Neutron activation analysis (NAA) using well-thermalized neutrons is a powerful tool utilized in various application fields. For NAA, information of neutron capture cross sections for isotopes to be analyzed and a neutron energy spectrum at an irradiation position are required. The energy spectrum of well-thermalized neutrons is approximated to be the sum of two components, a Maxwellian distribution corresponding to neutron temperature T n and an epithermal d E / E flux distribution cut off at a suitable lower limit of energy. This flux notation is known as the Westcott convention [1] and is widely utilized in NAA. The neutron activation reaction rate R x for the isotope x is expressed as
R x =   N x · ϕ 0 · σ x 0 · ( g x + r · s x )
where N x is the number of the isotope x, ϕ 0 is the neutron flux, r is the epithermal index that represents the relative strength of the epithermal component, σ x 0 is the cross section at 0.0253 eV neutrons, and the g- and s-factors are functions of T n . The g- and s-factors depend on the departure of the cross-section law from the 1/v form (for a 1/v law, g = 1 and s = 0).
NAA is also one of the powerful tools determining neutron capture cross sections [2,3,4,5]. In order to improve the accuracy of NAA and/or neutron capture cross sections, a number of improvements have been made. The epithermal d E / E flux distribution was refined as d E / E 1 + α [6], introducing an adjusting parameter α , and the s-factor was revised to reflect the refined form. Recently, finer forms have been proposed by introducing two [7] or three [8] adjusting parameters and were used for accuracy improvement of resonance integrals and s-factor [7].
The cut-off region of the epithermal d E / E flux component is often approximated by a unit step function, which was introduced in Westcott’s report in 1959 [1]. In the revised version of Westcott’s report in 1970 [9], several revised forms of Δ i W ( i = 1 to 4), called now joining functions, were introduced. The joining function expresses not only a sharp cut-off energy of the d E / E flux component but also a rather more gradual cut and an additional bump. The systematic effect on the s-factor induced by a change in a joining function from a unit step function was studied for re-evaluation of neutron capture cross section of 241Am measured by a neutron activation method [10]. Neutron activation analysis for isotopes with a prominent neutron resonance below 0.5 eV as in 241Am needs a careful analysis taking into account the resonance below 0.5 eV; an experimental technique has been developed to eliminate or reduce the low-energy resonance effect [5].
In the study of resonance integrals or s-factor in [7], adjusting parameters in the joining function Δ 4 W was investigated from the neutron energy spectrum obtained by a detailed Monte Carlo simulation. It is expressed as Δ 4 H in this paper, and its formula is given in Section 2. Although a height of a bump in both forms is almost the same, there is a noticeable difference on a high-energy side tail of the bump up to a few eV. Therefore, in the case of the Δ 4 H form, a bias effect on s-factor and reaction rate might be non-negligible for isotopes if there are huge resonances below a few eV. This paper studies in detail the bias on the s-factor and the reaction rate induced by the joining function form Δ 4 H .
As the other bias origins on g- and s-factors, neutron temperature dependence has already been studied in the report by Westcott [9]. Recently, the neutron temperature effect has been investigated by taking into account Westcott’s Δ i W functions [11]. An experimental technique to measure neutron temperature was developed because of its importance [12]. Here, it should be noted that neutron temperature characterizing a Maxwell distribution at sample position is not the same as sample temperature, since neutron absorption reactions distort the neutron energy distribution, and the leakage rate of neutrons through a sample guide hole depends on neutron energy. Therefore, sample temperature should be distinguished from neutron temperature.
Sample temperature affects the shape of a resonance peak, since it is broadened due to Doppler effect. A bias effect by sample temperature might be noticeable for isotopes with resonances around the cut-off energy of the joining function. However, the sample temperature effect has not been quantitatively reported, so far.
In this study, bias effects on Westcott g- and s-factors are investigated. The s-factor calculated by using the joining function based on a full Monte Carlo simulation is compared with those using traditional joining functions in Westcott’s report. The g- and s-factors are calculated for sample temperatures 300 K and 1000 K, for neutron temperatures ranging from 20 K to 1600 K, and for two 1/v isotopes (197Au, 59Co) and six non-1/v isotopes (241Am, 151Eu, 103Rh, 115In, 177Hf, 226Ra). The bias size for the reaction rate is also evaluated in the case of an epithermal neutron index r = 0.1, for these eight isotopes. The formula and calculation methods in this paper can be utilized for any isotope. Although neutron self-absorption correction is known to be an important bias [13], this correction is outside the scope of this work.

2. Formulas and Calculation Methods

The formulas used in this paper are described in this section, together with practical calculation methods.
A neutron energy spectrum for thermalized reactor neutrons by Westcott et al. [9], where the spectrum is approximated by the sum of Maxwellian and 1/E distributions, is expressed as
ϕ ( E ) = ϕ t h ( E ) + ϕ e p i ( E ) = ϕ t h · 2 π · T n T 0 · E ( k T n ) 2 · e E / k T n + ϕ e p i · Δ ( E ) E
where E is the neutron energy, T n the temperature of neutrons defined in the Maxwellian distribution, k the Boltzmann constant, and Δ(E) a joining function. The parameters ϕ t h and ϕ e p i are constants expressing the intensities of thermal and epithermal neutron flux components. As a joining function, several types have been proposed such as Δ 2 W ( E ) and Δ 4 W ( E ) , as shown in Westcott’s reports [9]. Δ 4 W has been recognized as the most appropriate function among various functions reported by Westcott et al. However, the simple Δ 2 W shape or, even more, a sharp cut-off function expressed by a unit step function has been utilized in both NAA and neutron capture cross section measurements, since a bias for reaction rate originating in the joining function is thought to be negligible for ideal 1/v isotopes. Δ 4 H is the joining function adjusted to reproduce a neutron energy spectrum at an irradiation position of a research reactor by using a Monte Carlo simulation with detailed configuration [7]. The formulas of Δ 2 W ( E ) , Δ 4 W ( E ) , and Δ 4 H are given below:
Δ 2 W ( E ) = 1 1 + ( 4.95 k T n E ) 7
Δ 4 W ( E ) = 1 1 0.26 1 + ( E 16.4 k T ) 5 + ( 4.75 k T n E ) 7
Δ 4 H ( E ) = 1 1 0.26 1 + ( E 26.1 k T n ) 1.93 + ( 5.06 k T n E ) 5.88
the joining functions Δ 2 W , Δ 4 W , Δ 4 H for neutron temperature T n = 300 K are plotted in Figure 1a by solid, dotted, and dashed line, respectively. There are bumps at around 0.23 and 0.27 eV for Δ 4 W and Δ 4 H , respectively. The cut-off energy for both Δ 2 W and Δ 4 H is about 0.13 eV, which is a little higher than 0.12 eV for Δ 4 W . The difference of a high-energy side tail of the bump should be noted; there exists a larger component in Δ 4 H compared to Δ 4 W in a neutron energy region from about 0.5 eV to a few eV. The same for neutron temperature 1000 K are plotted in Figure 1b. The cut-off energy and bump peak energy are shifted by a factor 1000/300. It is anticipated that the reaction rates for isotopes with a resonance at around the cut-off energy or bump peak energy will be affected significantly by using different joining functions.
The g factor in Equation (1), defined as the ratio of pure Maxwellian flux-weighted cross section ( σ ^ m ) to the cross section at 0.0253 eV ( σ 0 ) , is expressed as
g ( T n ,   T s ) = σ ^ m σ 0 = 1 σ 0 2 π T n T 0 0 E ( k T n ) 2 · e E k T n · σ ( E ,   T s ) d E
where sample temperatures ( T s ) are explicitly indicated in the cross section σ ( E ,   T s ) .
The s factor in Equation (1), representing the ratio of resonance integral after subtraction of the 1/v component to σ 0 , is expressed as
s ( T n ,   T s ) = 1 σ 0 2 π T n T 0 0 ( σ ( E ,   T s ) g ( T n ,   T s ) · σ 0 · k T 0 E ) · Δ ( E ) E d E
Hereafter, the s-factor calculated using the joining functions Δ 2 W , Δ 4 W , Δ 4 H as Δ ( E ) in Equation (7) are expressed as s 2 W , s 4 W , s 4 H .
Fine-mesh numerical data of the cross section are available in a website of nuclear data center [14] for T s = 0 and 300 K, corresponding to JENDL-4.0 nuclear data library [15]. The Doppler-broadened cross section at any sample temperature can be deduced from the unbroadened cross section σ ( E ,   0 ) at T s = 0 K. The Doppler-broadened cross section for T s is expressed by the next equation based on a free-gas model [16]:
σ ( E ,   T s ) = 1 W D π 0 ( e 4 ( E E · E ) 2 W D 2 e 4 ( E + E · E ) 2 W D 2 ) σ ( E ,   0 ) E E d E
the Doppler width W D in Equation (8) is given by
W D ( E , T S ) = 4 E k T S A
where A is the ratio of the sample mass to the neutron mass.
The capture cross sections of 241Am deduced using Equation (8) for T s = 300 and 1000 K are shown by a black solid line and a red solid line in Figure 2a, and those of 151Eu in Figure 2b. The number of mesh points used for integration of Equation (8) is about 65 k for 241Am and 22 k for 151Eu.

3. Results and Discussions

The sample temperature effect on the g- and s-factors is discussed based on calculations for the non 1/v isotopes 241Am and 151Eu, in which this effect is expected to be shown more clearly than in other isotopes, since they have prominent resonances near about 0.31 eV and 0.46 eV, respectively. Next, a joining function shape effect as a function of neutron temperature is discussed for eight isotopes, 241Am, 151Eu,197Au, 59Co, 103Rh, 115In, 177Hf, and 226Ra. The sample temperature is fixed at T s = 300 K in the discussion of a joining function shape effect. 197Au and 59Co are well known as 1/v isotopes and used for neutron flux determination as monitor samples. 103Rh, 115In, 177Hf, and 226Ra are non 1/v isotopes and have prominent resonances between 0.5 eV and 1.5 eV. The capture cross sections of 197Au, 59Co, 103Rh, 115In, 177Hf, and 226Ra obtained from JENDL-4.0 at T s = 300 K [14] are shown in Figure 3a–f and used in the calculations. At last, biases originated in a joining function shape for the s-factor and the reaction rate are discussed using the calculation results obtained for all eight isotopes.

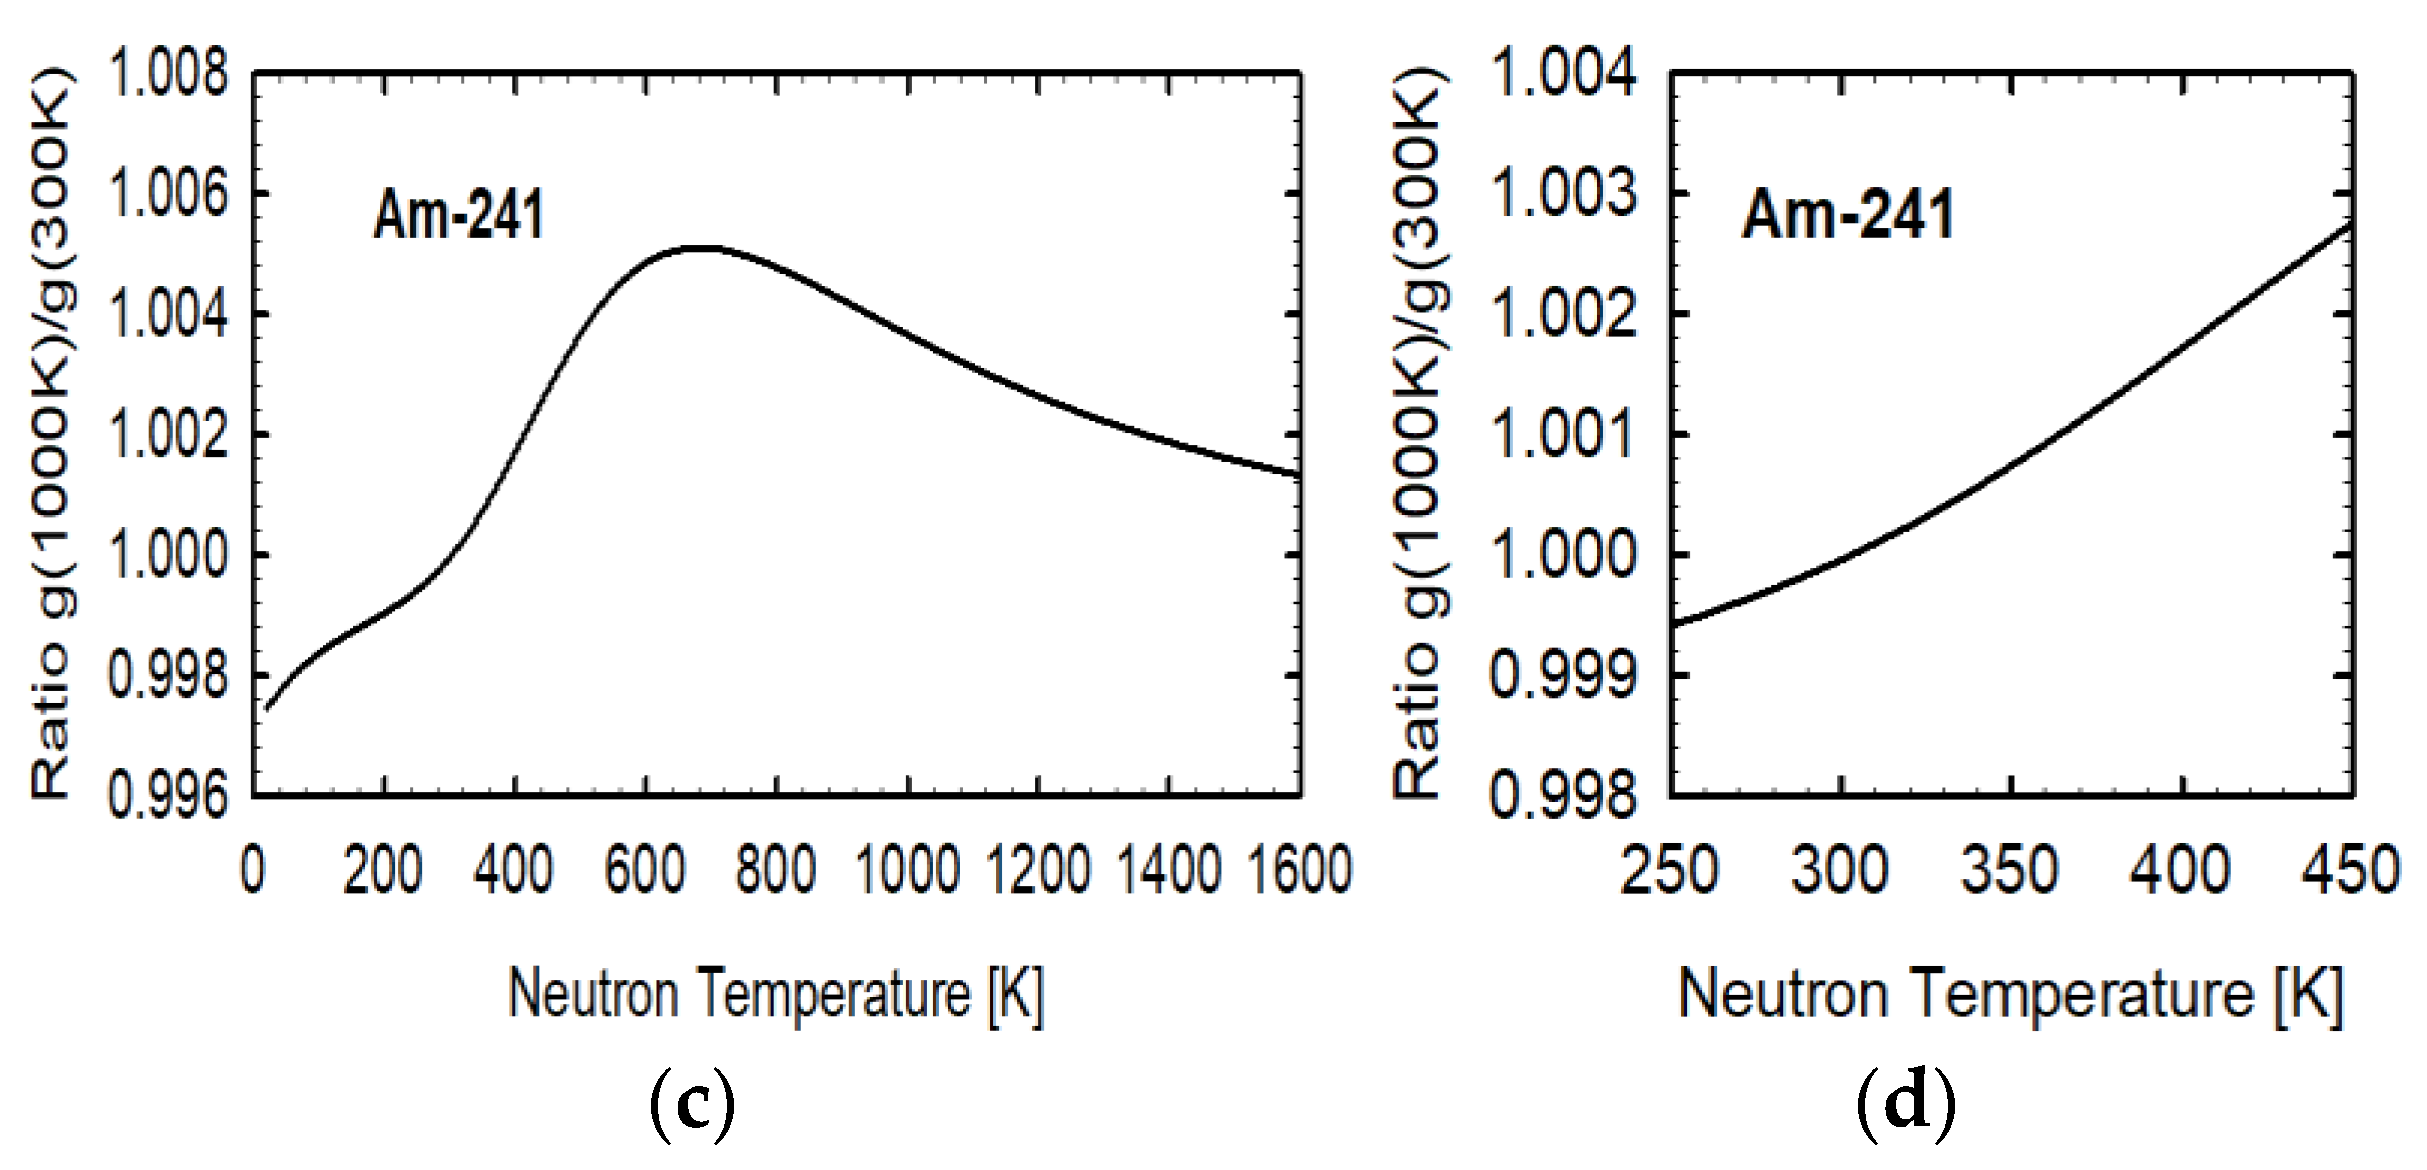
3.1. g-Factors for 241Am and 151Eu for Sample Temperatures of 300 and 1000 K

The g-factor for 241Am is calculated by inserting σ ( E ,   T s ) into Equation (6) as a function of neutron temperature T n , for two sample temperatures, i.e., T s = 300 K (black) and 1000 K (red), and plotted in Figure 4a. Two curves are almost degenerated. The g-factor is almost equal to the unity in the neutron energy region below 400 K and gradually increases as the neutron temperature rises, since the first neutron resonance at 0.31 eV starts to contribute to this increase. Figure 4b is an expanded version of Figure 4a, showing the neutron energy region between 250 and 450 K. In this neutron temperature range, the deviation of the g-factor from unity is from 1% to 9%. If neutron temperature is determined with an uncertainty of 25 K, the g-factor can be estimated with an uncertainty of about 1% using the data shown in this figure.
Figure 4c shows the ratio of g-factor at T s = 1000 K to that at 300 K for 241Am. Figure 4d is the expanded version of Figure 4c. The maximum deviation from the unity is about 0.5% at a neutron temperature near 600 K. It is only 0.3% for a limited region from 250 K to 450 K, as shown in Figure 4d. Therefore, for most applications not requiring accuracy below 1%, the sample temperature effect on the g-factor can be neglected. It should be remembered that this effect needs to be considered for special applications such as neutron standard cross section studies aiming at accuracy in the order of 0.1%.
Figure 5 shows the g-factor calculated for 151Eu. The change of the g-factor as a function of neutron temperature for 151Eu is more moderate compared to the case of 241Am, as shown in Figure 5a. This tendency can be explained by the fact that the first prominent resonance energy of 151Eu is about 1.5 times higher than that of 241Am. By comparing the g-factors of 241Am and 151Eu in a limited region from 250 K to 450 K, it is noticed that the difference of the slopes is significant, and the ratio of these g-factors is sensitive to neutron temperature. Although the effectiveness using a Zr–Au–Lu alloy is known to determine neutron temperature [12], the combinational use of these isotopes would provide additional and independent information on neutron temperature. The sample temperature effect for 151Eu shown in Figure 5c,d is in the same order of that for 241Am, as discussed above.

3.2. s-Factors for 241Am and 151Eu for Sample Temperatures of 300 and 1000 K

The s-factors for 241Am are plotted in Figure 6a as a function of neutron temperature T n , for two sample temperatures, T s = 300 K(black) and 1000 K (red), which are calculated by inserting σ ( E ,   T s ) into Equation (7). The s-factors corresponding to Δ 2 W ( E ) , Δ 4 W ( E ) , and Δ 4 H ( E ) , that is, s 2 W , s 4 W , s 4 H , are shown by solid-, dotted-, and dashed lines, respectively. The difference for two sample temperatures is so small that black and red lines are not separated in Figure 6a. To show the difference between two sample temperatures, the ratios of s-factors are plotted in Figure 6c,d for three kinds of joining functions, indicated by solid-, dotted-, and dashed lines, respectively. The deviation of the ratio from the unity is less than 0.5% for a wide neutron temperature range from 0 K to 1000 K.
Contrary to the sample temperature effect, there are noticeable differences between s-factors corresponding to Δ 2 W ( E ) , Δ 4 W ( E ) , and Δ 4 H ( E ) , as shown in Figure 6a,b. Figure 6e,f shows the ratio of s-factors calculated with Δ 4 W ( E ) or Δ 4 H ( E ) to that calculated with Δ 2 W ( E ) . The deviation of the ratio from the unity is as large as about 20% for a wide neutron temperature range. In Figure 6b, the expanded version of Figure 6a, the difference between s 4 W and s 2 W , and also between s 4 H and s 2 W , is clearly shown. A difference of a few % points is also noticed for the ratios between s 4 W / s 2 W and s 4 H / s 2 W in Figure 6e,f.
The s-factors for 151Eu are plotted in Figure 7a–f, as in Figure 6 for 241Am. As shown in Figure 7a, the s-factor for 151Eu crosses the zero at about 160 K and 1160 K. To show the difference quantitatively between two sample temperatures, the ratios of s-factors are plotted in Figure 7c,d for three kinds of joining functions, indicated by solid-, dotted-, and dashed lines, respectively. The deviation of the ratio from the unity is about 0.5 to 1.5% in the neutron temperature range from 300 K to 400 K. However, for example, in the case of an epithermal index r = 0.1, this sample temperature effect on a reaction rate is limited to the level in the order of 0.1%, since the absolute value of the s-factor for 151Eu is small.
There is a noticeable difference between s-factors, s 4 W / s 2 W , and s 4 H / s 2 W , as shown in Figure 7e,f. The deviation of the ratio from the unity seems to diverge at about 160 K and 1160 K. The reason is that the value of the s-factor crosses the zero point at these neutron temperatures. Since the s-factor is close to zero at these points, the effect induced by the deviations on the reaction rate is limited. However, for the important neutron temperature region at about 300–400 K, the deviation from the unity is about 30% in the case of Δ 4 H ( E ) and strongly varies from 12% to 34% in the case of Δ 4 W ( E ) . This observation demonstrates the importance of a careful determination of the joining function shape.
Hereafter, results are shown corresponding to the sample temperature of 300 K only, since its effect is small, as discussed for 241Am and 151Eu.

3.3. g- and s-Factors for 197Au, 59Co, 103Rh, 115In, 177Hf, and 226Ra

A joining function shape effect on g- and s-factor is discussed for other six isotopes, i.e., 197Au, 59Co, 103Rh, 115In, 177Hf, and 226Ra. The calculated g- and s-factors for these isotopes are plotted in Figure 8, Figure 9, Figure 10, Figure 11, Figure 12 and Figure 13. Figure 8, Figure 9, Figure 10, Figure 11, Figure 12 and Figure 13 (a) show g-factors, and (b) is the enlarged view of (a) in the neutron temperature region from 250 K to 450 K. Figure 8, Figure 9, Figure 10, Figure 11, Figure 12 and Figure 13 (c) show s-factors, and (d) is the enlarged view of (c). Figure 8, Figure 9, Figure 10, Figure 11, Figure 12 and Figure 13 (e) show the ratio of s-factors, that is, s 4 W / s 2 W and s 4 H / s 2 W , and (f) is the enlarged view of (e).
The capture cross section of 197Au is used as the neutron cross section standard at 0.0253 eV, and the 1/v law can be applied well, as shown in Figure 3a. The deviation from the unity of the g-factor is only 0.6% at 0.0253 eV. The absolute value of the s-factor of 197Au shown in Figure 8c is relatively large compared to that of the other 1/v law isotope 59Co, since a prominent neutron resonance exists at 4.91 eV. The deviation of s 4 H from s 2 W increases from 0% to 10% as the neutron temperature increases from 0 K to 1600 K. This deviation observed in the case of s 4 H is prominent compared to the case of s 4 W . The deviation in the case of s 4 W is only about 0.6% at a neutron temperature of 300 K. Considering the large size of the s-factor of 197Au, a bias induced by a joining function ambiguity exceeds 1%. Since the s-factor of 197Au is sometimes used as the standard nuclear value to determine other isotopes s-factor or resonance integrals, the bias of about 1% cannot be neglected. It should be noted that the bias increases furthermore as neutron temperature increases.
Figure 9a–f show results for 59Co. The capture cross section of 59Co is also used as the standard for thermal neutron capture cross sections and resonance integrals. The capture cross section of 59Co obeys the 1/v raw well, as shown in Figure 3b. Since there is no resonance below 10 eV, the deviation of the g-factor from the unity is extremely small, as shown in Figure 9a,b. The s-factors shown in Figure 9c,d for three joining functions are almost degenerating. As shown in Figure 9e,f, the deviation originating in a joining function ambiguity is less than 0.1% for a wide neutron temperature range. From the results for 59Co, it is expected that the bias effect originating in a joining function shape is negligible for isotopes obeying the 1/v law well. The order of the bias for isotopes obeying the 1/v law would be roughly estimated from the results of 197Au and 59Co.
Figure 10a–f show the results for 103Rh. There is a huge resonance at 1.26 eV in 103Rh. Therefore, the g-factor increases as neutron temperature increases, as shown in Figure 10a,b. The s-factor also monotonically increases as a function of neutron temperature, as for 197Au. However, the differences among s 2 W , s 4 W , and s 4 H are more notable compared to those for 197Au, as shown in Figure 10c,d. The deviation of s 4 W and s 4 H from s 2 W increases from 0% to about 30% as neutron temperature increases from 0 K to 1600 K. A prominent deviation is observed in the case of s 4 W for a neutron temperature less than about 1100 K. The deviation is about 7% at a neutron temperature of 300 K. Considering the large size of the s-factor of 103Rh, a bias induced by a joining function ambiguity exceeds 3%, even in the case of epithermal neutron index r = 0.1.
Figure 11a–f shows the results for 115In. There is a huge resonance at 1.46 eV in 115In. The neutron temperature dependence of the g- and s-factor is close to that observed for 103Rh. At the neutron temperature of 300 K, the bias induced by a joining function ambiguity reaches also about 3% in the case of epithermal neutron index r = 0.1.
Figure 12a–f shows the results for 177Hf. There are huge resonances at 1.10 eV and 2.39 eV in 177Hf. The neutron temperature dependence of the g- and s-factors is similar to those for 103Rh and 115In. At the neutron temperature of 300 K, the bias induced by a joining function ambiguity exceeds 3% as for 103Rh and 115In.
Figure 13a–f shows the results for 226Ra. There is a huge resonance at 0.54 eV in 226Ra. The neutron temperature dependence of the g-factor is similar to that for 241Am, although the absolute value for 226Ra increases more rapidly as neutron temperature increases. On the other hand, the neutron temperature dependence of the s-factor is similar to that for 151Eu. The differences among s 2 W , s 4 W , and s 4 H are more notable compared to those for 103Rh, 115In, and 177Hf at the neutron temperature of 300 K, as shown in Figure 13e,f. Therefore, a huge bias effect originating in a joining function ambiguity is expected at the neutron temperature at 300 K.

3.4. Bias on the s-Factor by the Joining Function

Biases on s-factor originating in a joining function are compared among 241Am, 151Eu, 197Au, 59Co, 103Rh, 115In, 177Hf, and 226Ra in Figure 14. The ratios s 4 W / s 2 W and s 4 H / s 2 W are shown by black bars and red-hatched bars. The results for neutron temperature of 300 K, 600 K, and 1000 K are shown in Figure 14a–c, respectively.
As shown in Figure 14a, large biases exceeding 10% occur in the cases of 241Am, 151Eu, and 226Ra at the neutron temperature of 300 K. The largest deviation from the unity is observed in the case of 151Eu for s 4 H / s 2 W , corresponding to about 29%. In the case of the neutron temperature of 600 K, the largest deviation from the unity is also observed for 151Eu, though for s 4 W / s 2 W , corresponding to about 37%. In the case of the neutron temperature of 1000 K, the largest deviation from the unity is again observed for 151Eu, for s 4 W / s 2 W , exceeding 50%.

3.5. Bias on the Reaction Rate by the Joining Function

In order to estimate the bias on the reaction rate originating in a joining function, Equation (1) is used. The size of the bias on the reaction rate depends on the value of the epithermal index r. Figure 15 shows biases on the reaction rate originating in a joining function in the case of r = 0.1; the value of r depends on the irradiation facility and irradiation position and ranges typically from 0 to 0.2. The ratios R ( s 4 W ) / R ( s 2 W ) and R ( s 4 H ) / R ( s 2 W ) are shown by black bars and red-hatched bars. The results in the cases of neutron temperatures of 300 K, 600 K, and 1000 K are shown in Figure 15a–c, respectively.
As shown in Figure 15a, large biases exceeding 10% occur only in the cases of 226Ra at the neutron temperature of 300 K, for R ( s 4 H ) / R ( s 2 W ) . At the neutron temperature of 600 K, the largest deviation from the unity is also observed in 226Ra, but for R ( s 4 W ) / R ( s 2 W ) , that exceeds 20%. In the case of the neutron temperature of 1000 K, the largest deviation from the unity is again observed in 226Ra for s 4 W / s 2 W and it is about 26%.
The reason that the largest bias is not observed in 151Eu but in 226Ra is explained as follows: for the reaction rate, the bias is moderate due to the opposite effect exerted by the g-factor and s-factor on the reaction rate. This is demonstrated for 151Eu, by comparing Figure 5a and Figure 7a.
The height of a bump in a joining function at its peak position is about 26–31%, as shown in Figure 1. The peak position of the bump increases as neutron temperature increases. When an energy of a first huge resonance is close to the peak position, a large bias is anticipated in the s-factor.
In this work, a bias originating in neutron nuclear data is not considered. It should be noted here that there is sometimes an uncertainty in the order of 10% even in well-investigated neutron nuclear data, as demonstrated in recent works on 241Am [10,17,18].

4. Conclusions

Bias effects have been investigated on the g- and s-factors in the Westcott convention. As origins of biases, a joining function shape, neutron temperature, and sample temperature, have been investigated. The quantitative results are given for 8 isotopes, i.e., 241Am, 151Eu, 197Au, 59Co, 103Rh, 115In, 177Hf, and 226Ra. The results show the bias induced by sample temperature is small, in the order of 0.1% for the g-factor and in the order of 1% for the s-factor. Biases induced by a joining function shape for the s-factor are shown to be in the order of 10% for many non-1/v isotopes. The bias size for the reaction rate in the case of an epithermal neutron index r = 0.1 is also shown. The largest bias is obtained for 226Ra among the eight isotopes. The order of bias size for the s-factor or reaction rate can be grasped from the results given for the eight isotopes in the figures. For non-1/v isotopes, the bias effect originating in a joining function shape needs to be carefully investigated. The formulas to calculate g- and s-factors in this paper enable bias calculation without a special code. If the size of the calculated bias is close to the required accuracy of NAA, a more careful study on neutron energy spectrum at the irradiation position and energy-dependent nuclear data is recommended.

Funding

This research received no external funding.

Data Availability Statement

Not applicable.

Conflicts of Interest

The authors declare no conflict of interest.

References

  1. Westcott, C.H.; Walker, W.H.; Alexander, T.K. Effective Cross Sections and Cadmium Ratios for the Neutron Spectra of Thermal Reactors; A/CONF.15/P/202; AECL-612 202 1–16; U.S. Department of Energy, Office of Scientific and Technical Information: Oak Ridge, TN, USA, 1959; Available online: https://osti.gov/servlets/purl/4279663 (accessed on 15 July 2021).
  2. Harada, H.; Sekine, T.; Hatsukawa, Y.; Shigeta, N.; Kobayashi, K.; Ohtsuki, T.; Katoh, T. Measurement of the Thermal Neutron Cross Section of the 90Sr(n,γ)91Sr Reaction. J. Nucl. Sci. Technol. 1994, 31, 173–179. [Google Scholar] [CrossRef]
  3. Harada, H.; Nakamura, S.; Katoh, T.; Ogata, Y. Measurement of Thermal Neutron Cross Section and Resonance Integral of the Reaction 99Tc(n,γ)100Tc. J. Nucl. Sci. Technol. 1995, 32, 395–403. [Google Scholar] [CrossRef]
  4. Ohta, M.; Nakamura, S.; Harada, H.; Fujii, T.; Yamana, H. Measurement of Effective Capture Cross Section of Americium-243 for Thermal Neutrons. J. Nucl. Sci. Technol. 2006, 43, 1441–1445. [Google Scholar] [CrossRef]
  5. Nakamura, S.; Ohta, M.; Harada, H.; Fujii, T.; Yamana, H. Thermal-Neutron Capture Cross Section and Resonance Integral of Americium-241. J. Nucl. Sci. Technol. 2007, 44, 1500–1508. [Google Scholar] [CrossRef]
  6. Ryves, T.B. A new thermal neutron flux convention. Metrologia 1969, 3, 205–215. [Google Scholar] [CrossRef]
  7. Harada, H.; Takayama, N.; Komeda, M. A new convention for the epithermal neutron spectrum for improving accuracy of resonance integrals. J. Phys. Commun. 2020, 4, 085004. [Google Scholar] [CrossRef]
  8. Trkov, A.; Radulović, V. Nuclear reactions and physical models for neutron activation analysis. J. Rad. Nucl. Chem. 2015, 304, 763–778. [Google Scholar] [CrossRef]
  9. Westcott, C.H. Effective Cross Section Values for Well-Moderated Thermal Reactor Spectra, 3rd ed.; CRRP-960; Atomic Energy of Canada Ltd.: Chalk River, ON, Canada, 1970; pp. 1–37. [Google Scholar]
  10. Žerovnik, G.; Schillebeeckx, P.; Becker, B.; Fiorito, L.; Harada, H.; Kopecky, S.; Radulović, V.; Sano, T. Systematic effects on cross section data derived from reaction rates in reactor spectra and a re-analysis of 241Am reactor activation measurements. Nucl. Inst. Method 2018, A877, 300–313. [Google Scholar] [CrossRef]
  11. Van Sluijs, R. The Westcott convention converted in the extended version of the modified Hogdahl convention. J. Rad. Nucl. Chem. 2019, 319, 1277–1282. [Google Scholar] [CrossRef]
  12. De Corte, F.; De Wispelaere, A. The use of a Zr–Au–Lu alloy for calibrating the irradiation facility in k0-NAA and for general neutron spectrum monitoring. J. Rad. Nucl. Chem. 2005, 263, 653–657. [Google Scholar] [CrossRef]
  13. Shcherbakov, O.; Harada, H. Resonance Self-Shielding Corrections for Activation Cross Section Measurements. J. Nucl. Sci. Technol. 2002, 39, 548–553. [Google Scholar] [CrossRef]
  14. ENDF Graph. Available online: https://wwwndc.jaea.go.jp/ENDF_Graph/ (accessed on 28 May 2021).
  15. Shibata, K.; Iwamoto, O.; Nakagawa, T.; Iwamoto, N.; Ichihara, A.; Kunieda, S.; Chiba, S.; Furutaka, K.; Otuka, N.; Ohsawa, T.; et al. JENDL-4.0: A new library for nuclear science and engineering. J. Nucl. Sci. Technol. 2011, 48, 1–30. [Google Scholar] [CrossRef]
  16. Fröhner, F.H. Applied Neutron Resonance Theory; Reprinted from Nuclear Theory for Applications, p. 59 ff.; International Centre for Theoretical Physics: Trieste, Italy, 1980. [Google Scholar]
  17. OECD/NEA/WPEC/SG-41 Report in Nuclear Science. Improving Nuclear Data Accuracy of 241Am Capture cross Section. 2020. NEA/NSC/R(2020)2 1–45. Available online: https://www.oecd.org/officialdocuments/publicdisplaydocumentpdf/?cote=NEA/NSC/R(2020)2&docLanguage=En (accessed on 15 July 2021).
  18. Terada, K.; Kimura, A.; Nakao, T.; Nakamura, S.; Mizuyama, K.; Iwamoto, N.; Iwamoto, O.; Harada, H.; Katabuchi, T.; Igashira, M.; et al. Measurements of neutron total and capture cross sections of 241Am with ANNRI at J-PARC. J. Nucl. Sci. Technol. 2018, 55, 1198–1211. [Google Scholar] [CrossRef]
Figure 1. Joining functions Δ 2 W (solid line), Δ 4 W (dotted line), Δ 4 H (dashed line) for neutron temperatures (a) T n = 300 K; (b) T n = 1000 K.
Applsci 11 06558 g001
Figure 2. (a) Capture cross section of 241Am for sample temperatures T s = 300 K (black solid line) and T s = 1000 K (red solid line) calculated with a free-gas model and JENDL-4.0 data at T s = 0 K; (b) the same with (a) for 151Eu.
Applsci 11 06558 g002aApplsci 11 06558 g002b
Figure 3. (a) Capture cross sections for T s = 300 K of 197Au; (b) 59Co; (c) 103Rh; (d) 115In; (e) 177Hf; (f) 226Ra.
Applsci 11 06558 g003aApplsci 11 06558 g003b
Figure 4. (a) Westcott g-factor for 241Am as a function of neutron temperature T n , for two sample temperatures, T s = 300 K (black) and 1000 K (red); (b) Expanded figure of (a); (c) Ratio of Westcott g-factor for T s = 1000 K to that for 300 K; (d) Expanded figure of (c).
Applsci 11 06558 g004aApplsci 11 06558 g004b
Figure 5. (a) Westcott g-factor for 151Eu as a function of neutron temperature T n , for two sample temperatures, T s = 300 K(black) and 1000 K (red); (b) Expanded figure of (a); (c) Ratio of Westcott g-factor for T s = 1000 K to that for 300 K; (d) Expanded figure of (c).
Applsci 11 06558 g005aApplsci 11 06558 g005b
Figure 6. (a) s-factors, s 2 W (solid line), s 4 W (dotted line), s 4 H (dashed line) for 241Am as a function of neutron temperature T n , for sample temperatures T s = 300 K (black) and 1000 K (red); (b) Expanded figure of (a); (c) Ratios of s 2 W (solid line), s 4 W (dotted line), s 4 H (dashed line) between T s = 300 K and 1000 K; (d) Expanded figure of (c); (e) Ratios of s-factors, s 4 W / s 2 W (dotted line) and s 4 H / s 2 W (dashed line) for T s = 300 K; (f) Expanded figure of (e).
Applsci 11 06558 g006aApplsci 11 06558 g006b
Figure 7. (a) s-factors, s 2 W (solid line), s 4 W (dotted line), s 4 H (dashed line) for 151Eu as a function of neutron temperature T n , for sample temperatures T s = 300 K (black) and 1000 K (red); (b) Expanded figure of (a); (c) Ratios of s 2 W (solid line), s 4 W (dotted line), s 4 H (dashed line) between T s = 300 K and 1000 K; (d) Expanded figure of (c); (e) Ratios of s-factors, s 4 W / s 2 W (dotted line) and s 4 H / s 2 W (dashed line) for T s = 300 K; (f) Expanded figure of (e).
Applsci 11 06558 g007
Figure 8. (a) Westcott g-factor for 197Au as a function of neutron temperature Tn; (b) Expanded figure of (a); (c) s-factors, s 2 W (solid line), s 4 W (dotted line), s 4 H (dashed line) for 197Au as a function of neutron temperature T n ; (d) Expanded figure of (c); (e) Ratios of s-factor s 4 W / s 2 W (dotted line) and s 4 H / s 2 W (dashed line) for 197Au; (f) Expanded figure of (e).
Applsci 11 06558 g008
Figure 9. (a) Westcott g-factor for 59Co as a function of neutron temperature T n ; (b) Expanded figure of (a); (c) s-factors, s 2 W (solid line), s 4 W (dotted line), s 4 H (dashed line) for 59Co as a function of neutron temperature T n ; (d) Expanded figure of (c); (e) Ratios of s-factors, s 4 W / s 2 W (dotted line) and s 4 H / s 2 W (dashed line) for 59Co; (f) Expanded figure of (e).
Applsci 11 06558 g009
Figure 10. (a) Westcott g-factor for 103Rh as a function of neutron temperature T n ; (b) Expanded figure of (a); (c) s-factors, s 2 W (solid line), s 4 W (dotted line), s 4 H (dashed line) for 103Rh as a function of neutron temperature T n ; (d) Expanded figure of (c); (e) Ratios of s-factors, s 4 W / s 2 W (dotted line) and s 4 H / s 2 W (dashed line) for 103Rh; (f) Expanded figure of (e).
Applsci 11 06558 g010
Figure 11. (a) Westcott g-factor for 115In as a function of neutron temperature T n ; (b) Expanded figure of (a); (c) s-factors, s 2 W (solid line), s 4 W (dotted line), s 4 H (dashed line) for 115In as a function of neutron temperature T n ; (d) Expanded figure of (c); (e) Ratios of s-factors, s 4 W / s 2 W (dotted line) and s 4 H / s 2 W (dashed line) for 115In; (f) Expanded figure of (e).
Applsci 11 06558 g011
Figure 12. (a) Westcott g-factor for 177Hf as a function of neutron temperature T n ; (b) Expanded figure of (a); (c) s-factors, s 2 W (solid line), s 4 W (dotted line), s 4 H (dashed line) for 177Hf as a function of neutron temperature T n ; (d) Expanded figure of (c); (e) Ratios of s-factors, s 4 W / s 2 W (dotted line) and s 4 H / s 2 W (dashed line) for 177Hf; (f) Expanded figure of (e).
Applsci 11 06558 g012
Figure 13. (a) Westcott g-factor for 226Ra as a function of neutron temperature T n ; (b) Expanded figure of (a); (c) s-factors, s 2 W (solid line), s 4 W (dotted line), s 4 H (dashed line) for 226Ra as a function of neutron temperature T n ; (d) Expanded figure of (c); (e) Ratios of s-factors, s 4 W / s 2 W (dotted line) and s 4 H / s 2 W (dashed line) for 226Ra; (f) Expanded figure of (e).
Applsci 11 06558 g013
Figure 14. (a) Ratios of s-factors, s 4 W / s 2 W (black bar), and s 4 H / s 2 W (red dashed bar) for 241Am, 151Eu, 197Au, 59Co, 103Rh, 115In, 177Hf, and 226Ra at the neutron temperature of 300 K; (b) Same as (a) at the neutron temperature of 600 K; (c) Same as (a) at the neutron temperature of 1000 K.
Applsci 11 06558 g014
Figure 15. (a) Ratios of reaction rates in the case of r = 0.1, R ( s 4 W ) / R ( s 2 W ) (black bar) and R ( s 4 H ) / R ( s 2 W ) (red dashed bar) for 241Am, 151Eu, 197Au, 59Co, 103Rh, 115In, 177Hf, and 226Ra at the neutron temperature of 300 K; (b) Same as (a) at the neutron temperature of 600 K; (c) Same as (a) at the neutron temperature of 1000 K.
Applsci 11 06558 g015aApplsci 11 06558 g015b
Publisher’s Note: MDPI stays neutral with regard to jurisdictional claims in published maps and institutional affiliations.

