Article

Improvement of Recycled Aggregates Properties by Means of CO2 Uptake

1
Materials and Structures Department—FM2D, IFSTTAR, Gustave Eiffel University, F-77454 Marne-la-Vallée, France
2
Navier Laboratory, Gustave Eiffel University, National Center for Scientific Research (CNRS), Ecole des Ponts, F-77454 Marne-la-Vallée, France
*
Author to whom correspondence should be addressed.
Appl. Sci. 2021, 11(14), 6571; https://doi.org/10.3390/app11146571
Submission received: 11 June 2021 / Revised: 12 July 2021 / Accepted: 13 July 2021 / Published: 16 July 2021
(This article belongs to the Special Issue Advances in Recycling of Construction Materials)

Abstract

:
Concrete from deconstruction can have a second life in the form of recycled concrete aggregates (RCAs). They unfortunately have poor properties (high porosity and water absorption coefficient (WAC)) with respect to natural aggregates. Accelerated carbonation was implemented to improve the RCA properties and to increase their use by storing carbon dioxide (CO2) in the cement matrix and thereby reduce their environmental impact. This paper aims to perform a parametric study of a process for accelerated carbonation of RCAs to store the largest possible amount of CO2 and improve their properties. This study highlights the fact that each of these parameters affects CO2 storage, with an optimum water content for the maximum CO2 uptake depending on the nature and the source of the RCAs. This optimum is related to the RCA water absorption coefficient by a linear relationship. The results show that accelerated carbonation reduces the water absorption coefficient by as much as 67%. Finally, carbonation also decreases porosity, as observed by mercury intrusion porosimetry, by filling the capillary pores.

1. Introduction

Increasing urban growth worldwide consumes natural resources and increases the amount of deconstruction waste. According to the literature, the European Union and China produced 860 million tons and 1.5 billion tons of deconstruction waste in 2015, respectively [1]. Recycling concrete in the form of recycled concrete aggregates (RCAs) is described as the most effective way of reducing global demand for natural aggregates. Each country has its own recommendations for their use. In France, the rate of RCA substitution in concrete is currently governed by the standard NF EN 206/CN. It depends on the exposure conditions [2], and the fine fraction (sand) of the RCAs is not used. The stated values were determined by studying the properties of RCAs, considered to be weaker than the ones in natural aggregates due to the presence of bonded cement paste. In particular, RCAs do exhibit high porosity and a high water absorption coefficient [3,4,5,6,7,8]. Their use in new concrete is therefore limited, because this old cement paste affects the properties of the new concrete in both the fresh and hardened states [5,6,7,8,9,10,11,12,13,14,15,16,17,18,19,20,21]. To increase the substitution rate, the properties of RCA must therefore be improved by mechanical, thermal or chemical treatments. Such treatments have two aims: to separate the cement paste from the RCA or to strengthen this cement paste [22,23].
In addition, the production of cement is responsible for 5–7% of global carbon dioxide (CO2) emissions [24], with up to 540 kg of CO2 emitted per ton of clinker as a result of the decarbonation of limestone. The 2016 Paris Agreement, which is a universal agreement on climate change, committed the world’s countries to limiting global warming to between 1.5 °C and 2 °C by reducing their emissions of greenhouse gases, including CO2 [25]. To reduce the ecological impact of concrete, the storage of CO2 is a possible option to contribute to the goal of carbon neutrality. Some techniques in the cement industry are used to remove CO2 from CH4 in membranes or to capture CO2 in mesoporous silica materials [26,27].
In the literature, the uptake of CO2 is also achieved by accelerated carbonation of RCAs. With regard to the parametric study of the storage of CO2 in RCAs, an optimum water content was found in [28,29,30,31], which led to a maximum level of carbonation. This optimum amount occurs due to a balance between a lack of water, which limits the dissolution of CO2, and an excess of water that limits its diffusion. This optimum amount is not described in the literature for RCAs. Moreover, this optimum amount is not applied by a process of impregnation and drying to obtain the saturated surface dry state of RCA, as described for the measure of the water absorption coefficient in [32]. The experimental results also showed that the initial carbonation status can affect the diffusion of CO2 due to the formation of calcium carbonates [33], but no data has been presented about CO2 uptake. CO2 uptake can also be affected by the type and size of the RCA, by a high cement paste content and by the diffusion of CO2 in the total volume of the RCA. Fine RCA can take up more CO2 than coarse RCA [29,34,35,36]. An increase in the concentration of CO2 increases its uptake, but this increase is limited by the quantity of calcium carbonates that are formed during the carbonation tests [37]. The accelerated carbonation of old cement pastes is also increased by the temperature, as described in [38,39]. A higher temperature affects the solubility of the hydrates and the diffusion of CO2, which increases the contact between the gas and the cement matrix and enhances CO2 uptake. With regard to the improvement of the properties of RCAs by accelerated carbonation, it has been found that the storage of CO2 reduces the water absorption coefficient (WAC) [37], but these values are affected by the size and source of the RCAs. However, there is no information about the impact of natural carbonation on the decrease of the WAC and the influence of accelerated carbonation. The total porosity, obtained by mercury intrusion porosimetry (MIP), is also affected by carbonation due to the total disappearance of pores of more than 300 nm and the increased presence of pores less than 30 nm only in concretes or in cement pastes [37,40].

2. Research Significance

This work is part of the FastCarb National project, which investigates the optimization of CO2 uptake of RCAs from laboratory to industrial scales. The main objective of this research is to study all the parameters which impact accelerated carbonation and CO2 uptake and to study the effect of accelerated RCA carbonation to improve their properties.
The main contributions of this paper are as follows:
  • The new calculation of CO2 uptake, taking into account the water generated by the carbonation of portlandite;
  • The identification of a relationship between the RCA’s optimum water content and their WAC for a maximum CO2 uptake. This study shows the range of optimum water content related to the WAC of RCAs, with many of them being from laboratory concretes or from old demolition concretes. This data are important for industrial applications. This interval is known in the literature in concretes (around 65% and 80% in relative humidity), but these values are not transposable to RCAs. This study proposes a process of imposing the optimum water content by impregnation and drying. This process generates the saturated surface dry state of RCAs and good filling of the pores by water for an optimal diffusion of CO2;
  • The contribution of accelerated carbonation compared to natural carbonation for RCAs from recycling platforms, which has not been shown in the literature;
  • The range of pores clogged by CaCO3 and the range of pores formed after carbonation, derived to be essential data for the durability of carbonated RCAs. These tests with mercury intrusion porosimetry are related to the decrease of the WAC on the same RCA (RB 1–4 C).

3. Materials and Methods

3.1. Materials

The materials used during the tests came from three sources. The first was from old demolition concrete in French recycling centers (RB). These RCAs were studied in the RecyBéton French national project [5,22]. Two fractions were used in the present study: a small fraction (1–4 mm) and a coarse fraction (10–20 mm). The selected RCAs had the following carbonation characteristics:
  • RB 1–4, which was the 1–4 mm fraction, was naturally carbonated after crushing and 6 years of storage under natural conditions. The thermogravimetric analysis (TGA), therefore, did not reveal the presence of portlandite (Table 1);
  • RB 10–20, which was the 10–20 mm fraction, was naturally carbonated only on the surface;
  • RB 1–4 C, which was a 1–4 mm fraction obtained by crushing RB 10–20, was used to study the effect of the initial natural carbonation status of RB 1–4 on the CO2 uptake.
The second type, referred to as CB, consisted of recent crushed concrete from a French recycling center. Their source was concrete beams under 2 years of age, so they had undergone little natural carbonation. Only the 1–4 mm fraction was studied (CB 1–4).
For all these RCAs, no information was known about the original concrete or their composition because of their origin.
The third type of RCA came from concretes that were prepared in the French laboratory. They consisted of OC (ordinary concrete) and HPC (high-performance concrete). These RCAs were used in the BHP2000 project [41]. The composition of their constituent concretes was known, as was that of the French CEM I cement used to manufacture them (Table 1 and Table 2).
For the last two RCAs, two fractions were studied: 1–4 mm (OC 1–4 and HPC 1–4) and 12–20 mm (OC 12–20 and HPC 12–20).
Table 3 presents the properties of all the studied non-carbonated RCAs (NC + −–RCA reference). For the 10–20 mm and 12–20 mm RCAs, the water absorption coefficient was determined according to the French version of the European Standard NF EN 1097-6 [42], and for the 1–4 RCA, the coefficient was determined by an evaporimetric method [43]. The porosity of this RCA was determined by the French standard for concretes (NF P 18-459), as studied Omary et al. [5]. Table 3 also presents the portlandite rate and the calcium carbonate (CaCO3) rate of the studied RCA, as determined by thermogravimetric analysis (TGA) (NETZSCH STA 449 F5 Jupiter, over an ambient 1250 °C temperature range (10 °C/min)).
The 1–4 mm fraction was selected because a loss of fines could occur during immersion of the 0–4 mm fraction that could affect the measurements.
The soluble fraction in salicylic acid (SFSA), which describes the cement paste content, was evaluated by immersing the crushed RCA in salicylic acid and methanol followed by filtering to separate the solid residue [44]. This technique was applied because of the insolubility of calcium carbonates and the solubility of portlandite and C–S–H in salicylic acid.

3.2. Accelerated Carbonation Test on RCAs

The water content is an essential parameter in the carbonation process. If the water content of the RCA is low, little CO2 is dissolved in the water, while a high water content slows down CO2 diffusion since the diffusion rate in water is slower than in air. To improve the accelerated carbonation test and increase the capacity of an RCA to store CO2, it was necessary to obtain the optimum water content for each RCA.
The accelerated carbonation test on the RCAs (Figure 1) was carried out after the imposition of a certain water content by immersing 100 g of a dry RCA in water for 5 min. The desired water content was then obtained by using a balance placed in a desiccator. The relative humidity in the desiccator was measured with a humidity sensor, but only the water content was imposed upon the RCA.
A layer of this RCA was placed in contact with an atmosphere containing CO2 at a concentration of 15% or 100% for 24 h (Figure 1). The concentration of 100% CO2 was chosen to obtain the maximum CO2 uptake during the accelerated carbonation test. The concentration of 15% is the same concentration as in cement kiln gases. The aim was to simulate the concentration of an industrial application.
Once the carbonation process was completed, the RCA was dried to a constant mass at 80 °C to preserve its microstructure, remove the free water and measure the mass gain due to CaCO3 formation [45].

3.3. Effect of the Temperature on the Accelerated Carbonation of RCAs

Recent studies showed that the temperature affects accelerated carbonation. A temperature below 100 °C is recommended to obtain maximum carbonation [38,39].
A quantity of OC 12–20 was placed in a closed environment—a Panasonic MCO-5AC-PE CO2 incubator—where the temperature and the CO2 concentration (15%) were set before beginning accelerated carbonation, forming an aggregate bed in the incubator. The effect of the temperature was studied at 20 °C and 40 °C.

3.4. Determination of CO2 Uptake by the RCAs

To determine the CO2 uptake, mass monitoring was carried out to identify the mass gain after the accelerated carbonation test. The RCA was thus dried at 80 °C. The CO2 uptake (in g/kg) was determined by subtracting the mass of the dry sample before the carbonation test mini dried from the mass of the sample after the carbonation test and drying at 80 °C mfinal dried [45]. The factor Mgw was added to this quantity to take into account the water released by the carbonation of portlandite (Equations (1) and (2)). Portlandite was assumed to be the only hydrate generating water during carbonation. Morandeau et al. have shown that the hypothesis that C–S–H carbonation does not release water is acceptable [46]. The value of the portlandite was estimated by TGA measurements and the stoichiometric equation, where the carbonation of one mole of portlandite produces one mole of water, which is converted to mass to obtain Mgw:
CO 2   uptake = m final   dried   m ini   dried +   M gw m ini   dried
M gw =   m Δ Ca OH 2 TGA × M H 2 O M Ca OH 2
where mΔCa(OH)2-TGA is the mass loss due to the dehydroxylation of the portlandite (determined by TGA) and MH2O and MCa(OH)2 are the molar masses of the water and portlandite, respectively.

3.5. Determination of the Water Absorption Coefficient of the RCAs

The water absorption coefficient, along with the porosity, is the main property of an RCA. It was measured by a simple test during which the dry RCA was saturated under a vacuum in water for 24 h.
For the 10–20 mm water-saturated RCA, the aggregate was dried with absorbent paper to achieve the saturated surface dry state (SSD), when the aggregate was dry on the surface but saturated at the core due to absorbed water [42]. The RCA was then dried to a constant mass at 80 °C.
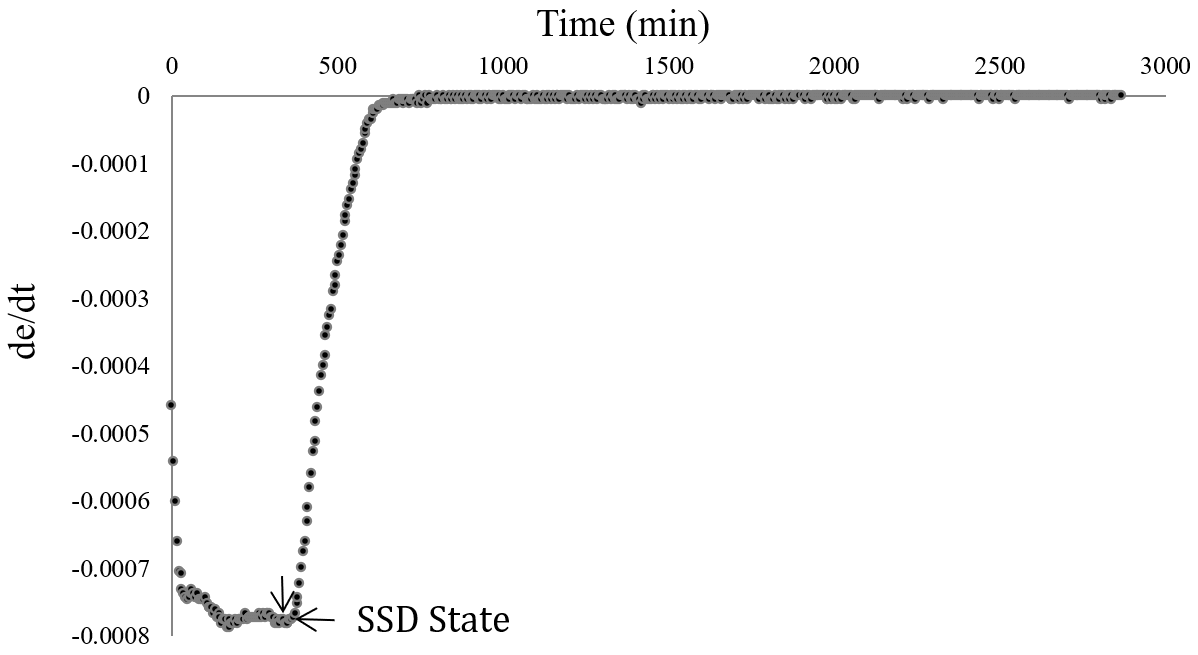
For the 1–4 mm water-saturated RCA, the SSD state was obtained by continuous monitoring of the mass. The reason for this is that drying with absorbent paper, as specified in Standard NF EN 1097-6, can remove some of the cement paste responsible for the high water absorption of the aggregates. The plot obtained at the end of the test allowed us to determine the SSD status of the RCA, which corresponded to the transition point between the constant phase of evaporable water loss and the decreasing phase of the loss of adsorbed water [43,47]. Figure 2 presents an example of a drying curve of an RCA to obtain the SSD state. In the case of the 1–4 mm RCA, after total evaporation of the water, the RCA was dried to a constant mass at 80 °C in an oven.
The choice of a drying temperature of 80 °C was based on the study conducted by Yacoub et al., which showed that a drying temperature above 80 °C damages the microstructure of an RCA [48]. The WAC (in %) was determined by Equation (3):
WAC = m SSD   m dried m dried × 100
where mSSD is the mass of the RCA at the SSD state and mdried is the mass of the RCA after drying at 80 °C.

3.6. Evaluation of the Pore Size Distributions of the RCAs

Mercury intrusion porosimetry (MIP) tests were carried out on RB 1–4 C in order to study the filling of its pores after accelerated carbonation with CO2 concentrations of 15% and 100%. This approach was chosen to supplement the existing data on the effect of accelerated carbonation on the WAC, as this only gave qualitative values for the effect of accelerated carbonation on the clogging of the porous structures of RCAs. The study of pore filling based on the pore size distribution provided additional information on the microstructure of each RCA after carbonation. The pore size distribution was obtained with an Autopore IV 9500 Micromeritics mercury porosimeter. Non-carbonated and carbonated RCAs were subjected to mercury porosimetry at low and high pressure. Three samples of each RCA were tested to ensure repeatability.

4. Results and Discussions

4.1. Parametric Study of the Accelerated Carbonation Test on RCAs

4.1.1. Effect of the Initial Natural Carbonation of an RCA on the CO2 Uptake

The initial natural carbonation affects the potential CO2 uptake of an RCA. This state can be determined based on the color change after spraying phenolphthalein over the RCA. A non-carbonated RCA has a pH of between 12 and 13, and a pink color is obtained. A carbonated RCA has a pH of less than 9, and the phenolphthalein indicator is colorless. The effect of the initial natural carbonation of an RCA was confirmed by the color change after phenolphthalein was sprayed over the RCA (Figure 3). CB 1–4 had low natural carbonation, as almost all the aggregate turned pink after being sprayed with phenolphthalein. RB 1–4 C had partial natural carbonation because it was sourced from RB 10–20, only the surface of which had been naturally carbonated. RB 1–4, which had been stored for 6 years, remained colorless, indicating that this material was already naturally fully carbonated.
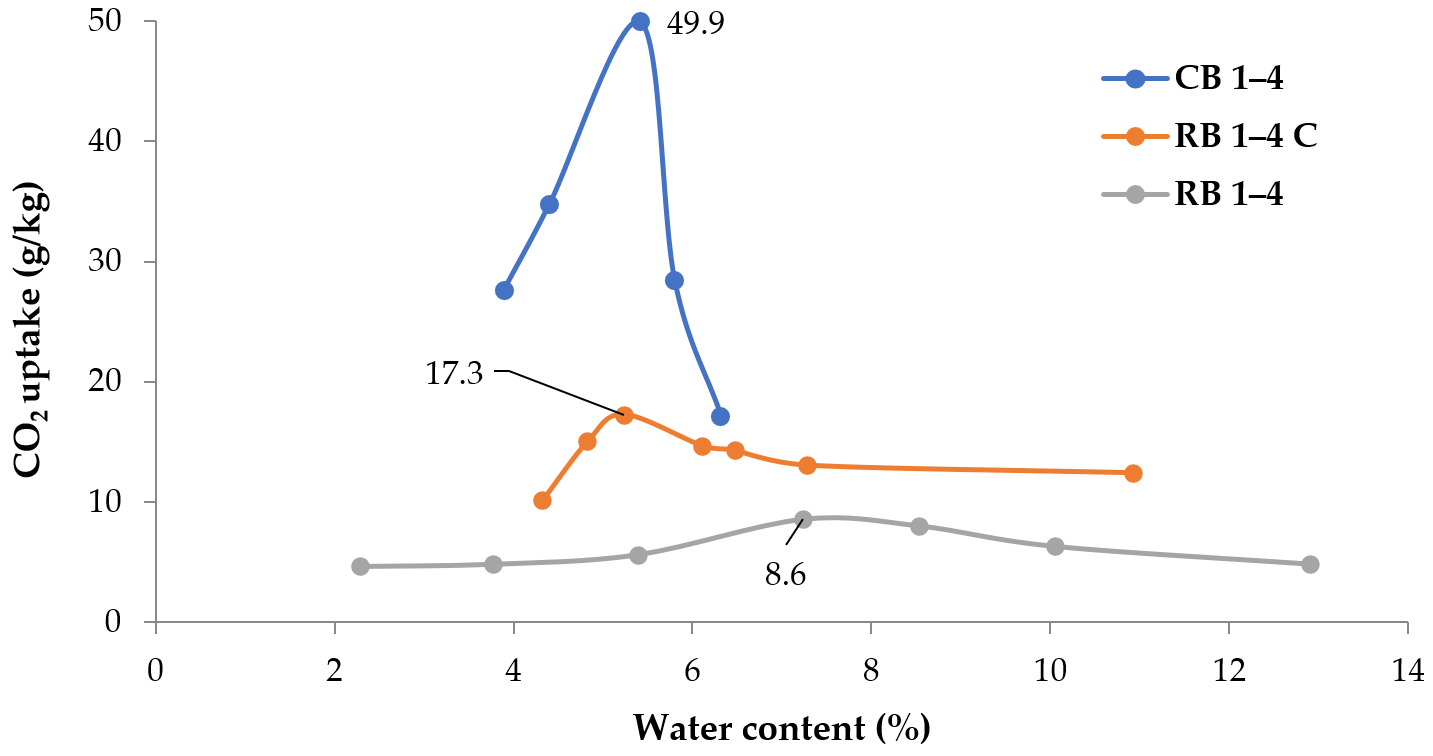
Figure 4 presents the effect of the initial natural carbonation and the water content on the CO2 uptake after an accelerated carbonation test.
First of all, the water content had a marked effect on the CO2 uptake. In addition, the shape of the plot was similar for each type of RCA, regardless of its initial natural carbonation status or source. As expected, and as was mentioned above, a high water content slowed the diffusion of CO2 because of the presence of water in the pores, while a low water content limited the dissolution of CO2 because of a lack of water. The maximum CO2 uptakes were obtained for optimum water contents of 5.2, 5.4 and 7.2% for RB 1–4 C, CB 1–4 and RB 1–4, respectively (see Table 4). On both sides of the CO2 uptake maxima, there were CO2 uptake minima for the low and high water contents. Similar shapes of plots were also found by Zhan et al. [28], who also reported that there is an optimum water content for a maximum CO2 uptake.
CB 1–4 was not naturally carbonated and therefore exhibited the highest CO2 uptake (49.9 g/kg). For RB 1–4 C, which was partially naturally carbonated, the value of the CO2 uptake was 17.3 g/kg. RB 1–4, after 6 years of storage, had the lowest CO2 uptake (8.6 g/kg). The values we obtained were in line with the portlandite rates of the RCAs (Table 3).
The effect of the initial natural carbonation status on the CO2 uptake was also demonstrated by Xuan et al. [33], who found that in the case of an RCA that has been stored for a long time, partial carbonation can affect the potential CO2 uptake, rendering it lower compared with those sourced from recently deconstructed concrete. This partial carbonation depends on the duration of storage.
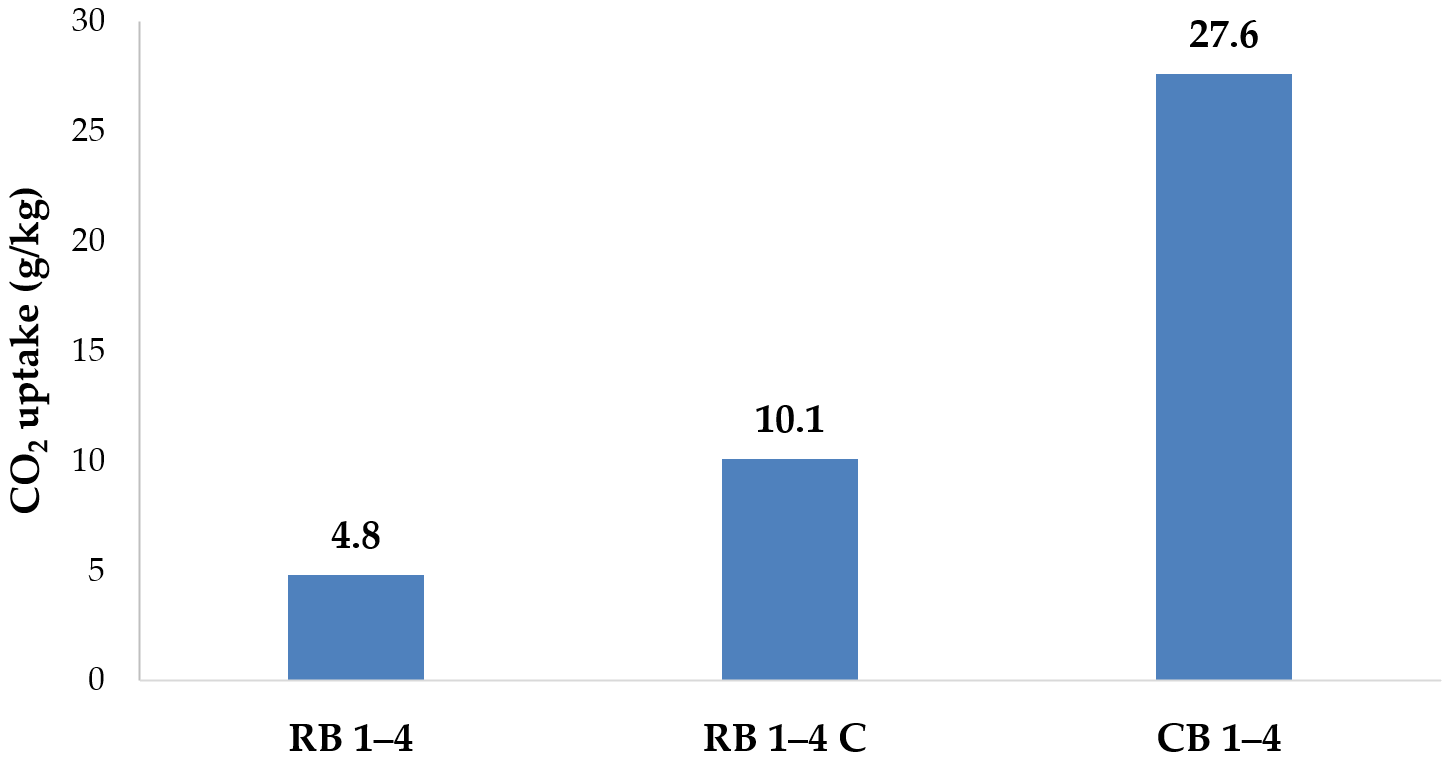
In addition, it was possible to evaluate the potential CO2 uptake of an RCA even with a low water content (around 4%). Figure 5 shows the rate of CO2 uptake with a 4% water content for each RCA shown in Figure 4.
In the case of this water content, the maximum potential carbonation of CB 1–4 was also demonstrated because these RCAs could store more CO2. The histograms present the effect of the initial natural carbonation on the qualitative potential carbonation of an RCA, based on the results in Figure 5. These results illustrate that it is possible to predict the qualitative potential CO2 uptake at a low water content (4%).

4.1.2. Effect of the CO2 Concentration on the CO2 Uptake

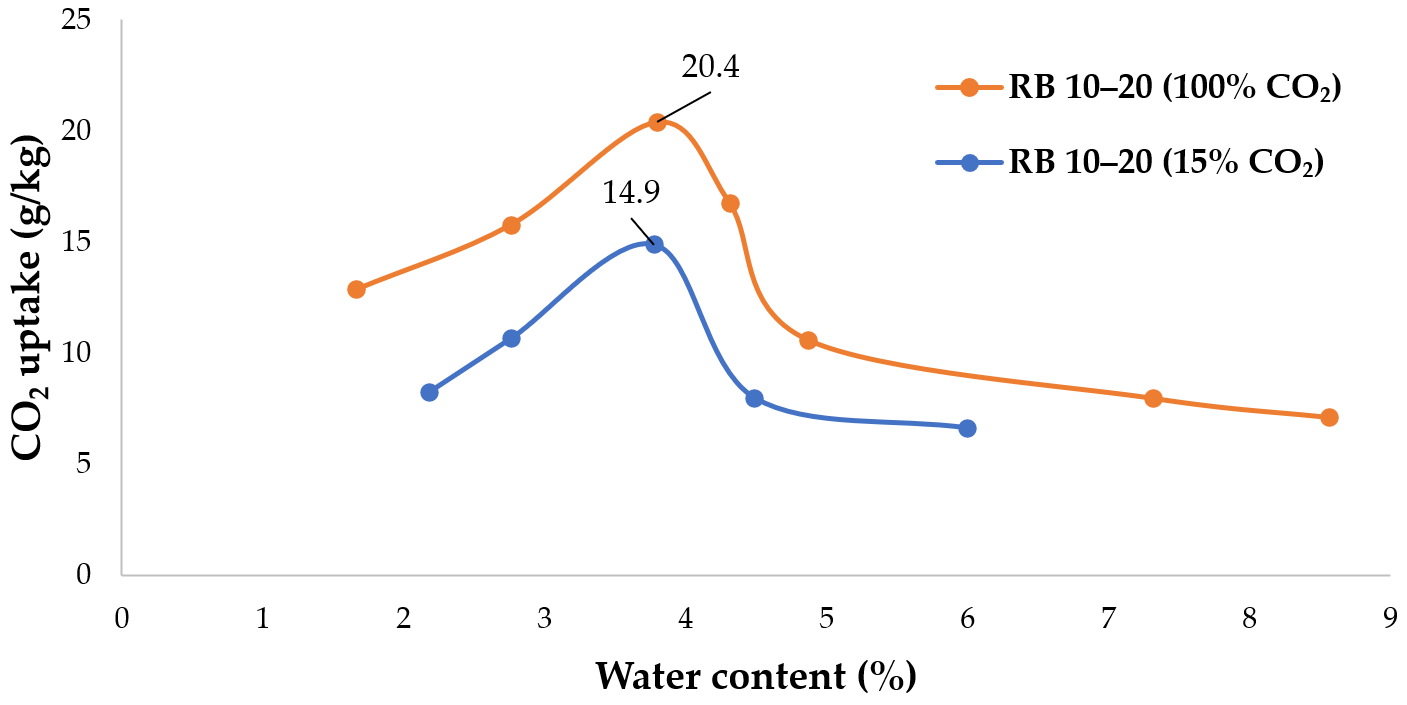
Figure 6 presents the effect of the CO2 concentration on the CO2 uptake in the case of RB 10–20, whose surface exhibits natural carbonation. The tests were carried out with CO2 concentrations of 15 and 100%.
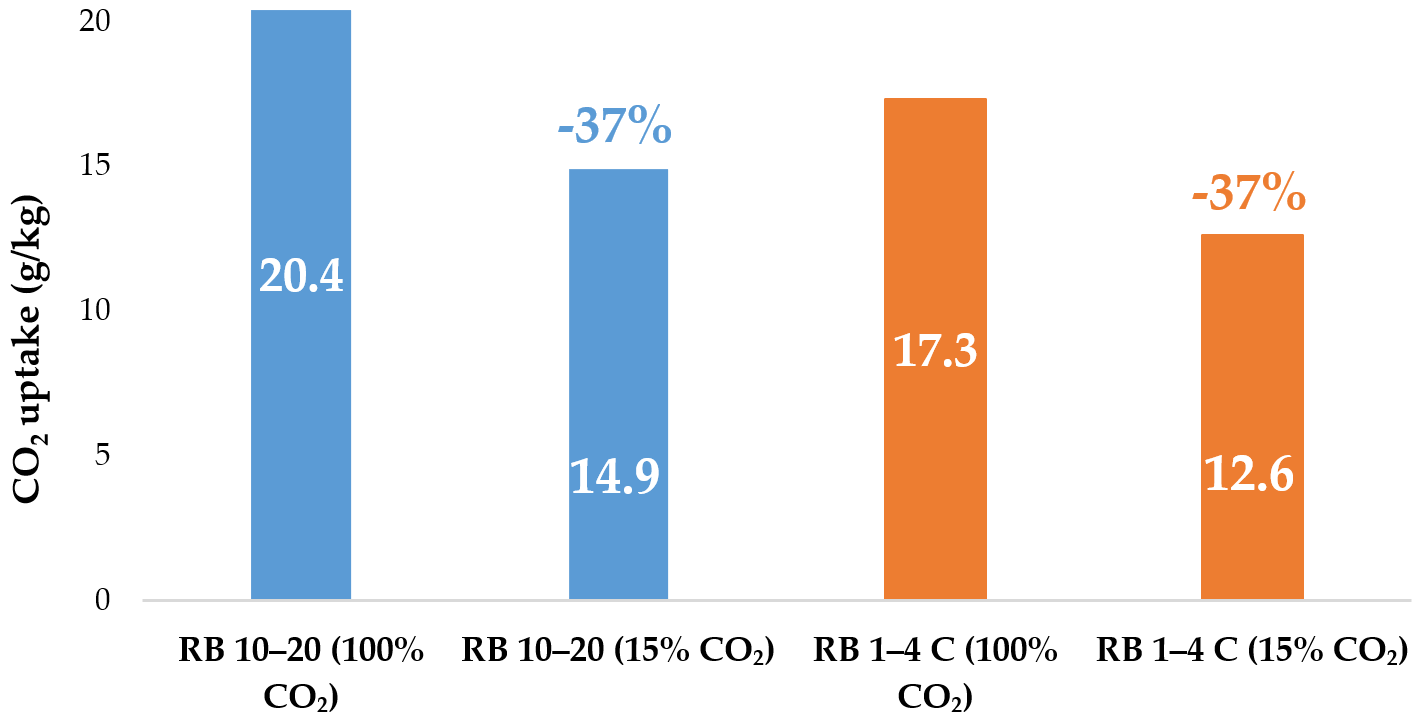
The maximum CO2 uptake was achieved with the same optimum water content of 3.8% at 15% CO2 and 100% CO2 concentration. The maximum CO2 uptake was 20.4 g/kg with a CO2 concentration of 100% and 14.9 g/kg with a concentration of 15%. At the same optimum water content, the maximum CO2 uptake increased by 37%, depending on the increase of the concentration of CO2. Thus, the optimum water content was independent with the effect of the CO2 concentration on the CO2 uptake. The increase in CO2 uptake in the context of accelerated carbonation between CO2 concentrations of 15% and 100% can be explained by the decalcification or the total disappearance of C–S–H with 100% CO2. However, the increase between the two concentrations was not large. Indeed, in the literature, Fang et al. [29] showed that the CO2 concentration affects CO2 uptake; the higher the CO2 concentration, the greater the CO2 uptake. They concluded that any further increase above a concentration of 20% does not affect the CO2 uptake because of the formation of calcium carbonates, which limit the penetration of CO2 into the RCA particles. It is also possible that the dissolution–precipitation rates of cement hydrates could be a limiting factor on the increase of the CO2 uptake.
For the same water content (around 2.8%), with 100% CO2, RB 10–20 had a maximum CO2 uptake of 15.8 g/kg, which fell to 10.7 g/kg with a CO2 concentration of 15%. At this water content, the carbonation potential of the RCA was estimated, and the results confirmed the effect of the CO2 concentration on the CO2 uptake. It is possible to state, in qualitative terms, that there is potential for RCA carbonation to occur at low water contents.
The effect of the CO2 concentration was also demonstrated on RB 1–4 C. Figure 7 shows this effect for RB 10–20 and RB 1–4 C at CO2 concentrations of 15% and 100%.
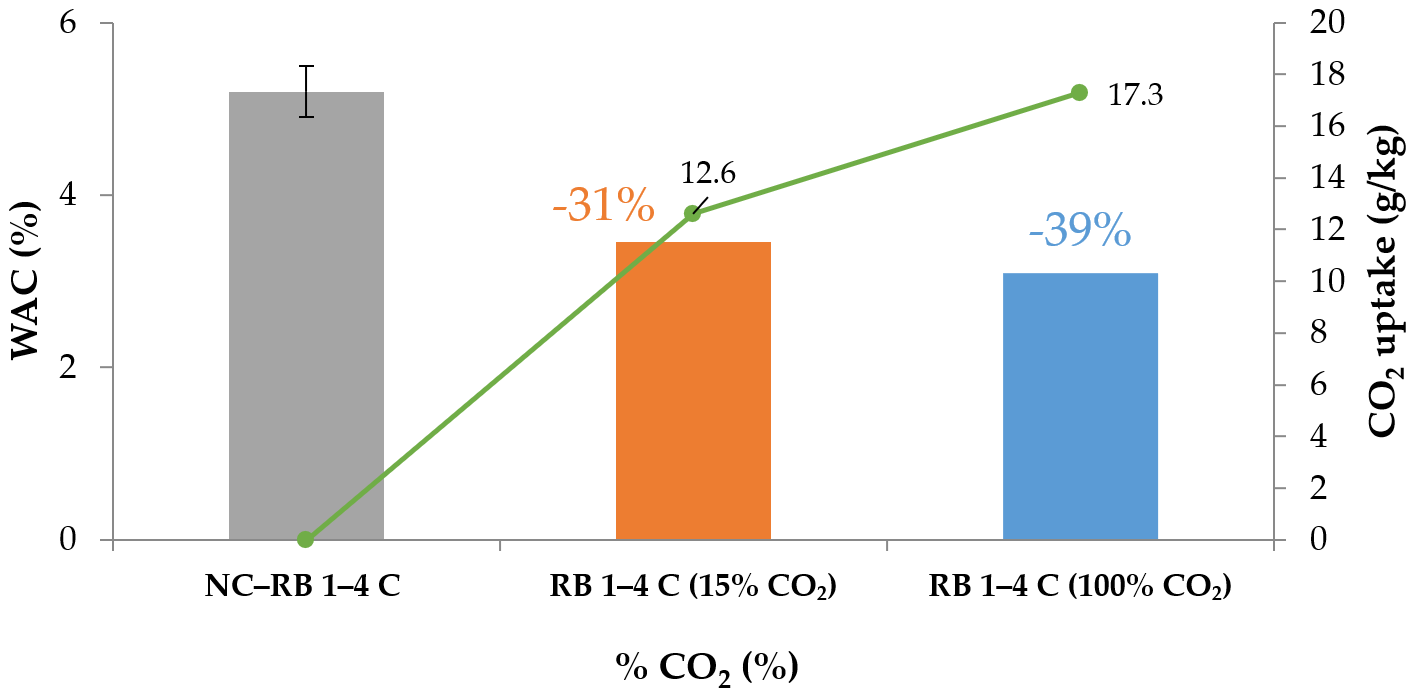
RB 1–4 C had a CO2 uptake of 17.3 g/kg at 100% CO2, compared with 12.6 g/kg with a CO2 concentration of 15%, with the same water content of 5.2%. As for RB 10–20, the difference between the two concentrations was similar (around 37%).

4.1.3. Effect of the RCA Type on CO2 Uptake

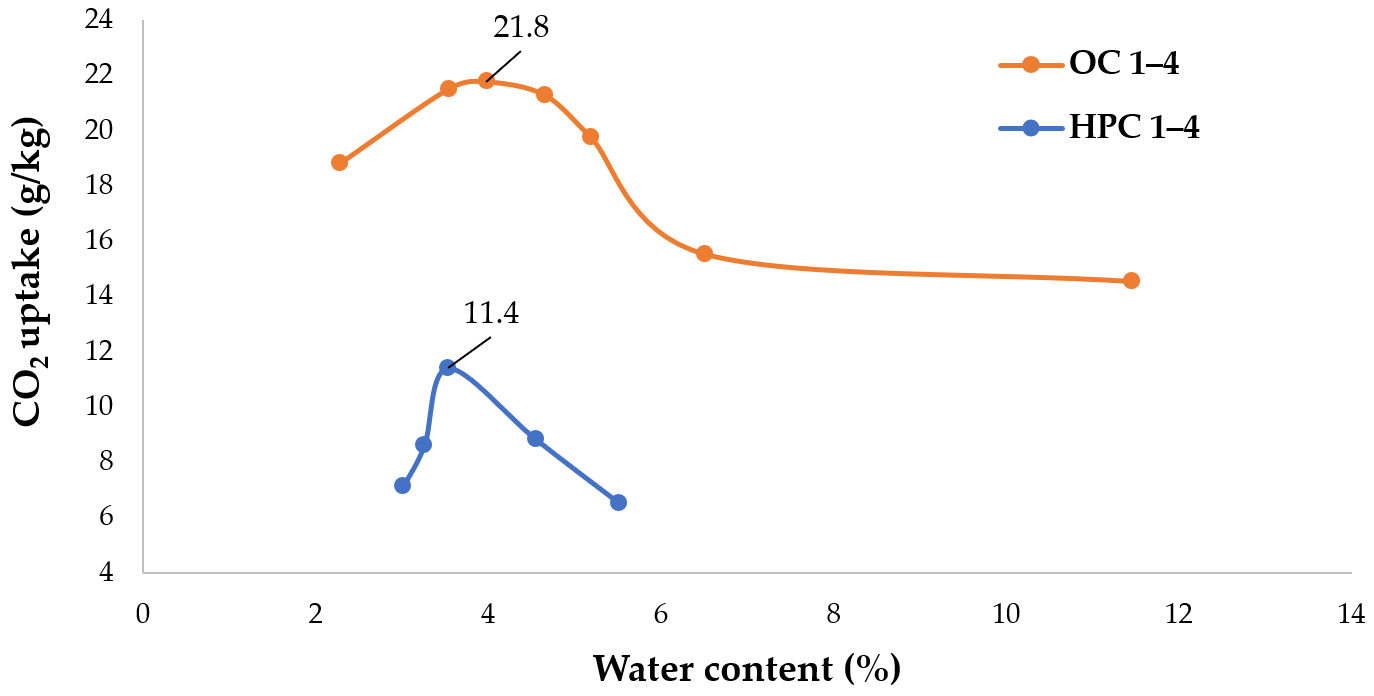
For further testing, we chose a CO2 concentration of 15%, as this is the concentration observed at cement kiln outlets, with the objective of transferring this laboratory study to the industrial scale. As in Figure 8, the maximum CO2 uptake was obtained at an optimum water content. This last parameter depended on the type of RCA and its initial natural carbonation.
The difference in the CO2 uptake of OC 1–4 and HPC 1–4 can be explained by their portlandite content (Table 3). NC–OC 1–4 had a portlandite content of 4%, compared with 2.3% for NC–HPC 1–4, and thus contained more phases able to be carbonated. This explains the CO2 uptake of 21.8 g/kg for OC 1–4 and 11.4 g/kg for HPC 1–4. Furthermore, NC–OC 1–4 was sourced from concrete with a water-to-cement ratio of 0.49, in contrast to NC–HPC 1–4, which was sourced from concrete with a water-to-cement ratio of 0.32. Liang et al. [37] concluded in their study that the paste is more dense in the case of an RCA sourced from concrete with high mechanical strength like HPC 1–4. This reduces the diffusion of CO2 and the effectiveness of accelerated carbonation and thus the CO2 uptake. The higher water porosity of 10.9% of NC–OC 1–4, compared with 8.5% for NC–HPC 1–4, also increased the diffusion of gas through the pores of the RCA.
If the source of the RCA, and hence the composition of the concrete (Table 1), is known, it is possible to determine the theoretical maximum CO2 uptake (by Portland cement) as a percentage by applying Steinour’s theoretical formula (Equation (4)) [28] in kg of CO2 per kg of solid residue on a dry basis [49]:
CO 2   max   % = 0.785 CaO 0.7 SO 3 + 1.091 MgO + 1.420 Na 2 O + 0.935 K 2 O
According to this formula, the cement in OC concrete can store a maximum of 52.1% of CO2, and the cement in HPC concrete can store a maximum of 51.3%. On the basis of a cement content of 45% for NC–OC 1–4 and 35% for NC–HPC 1–4, the CO2 uptake could be calculated, giving a theoretical maximum (CO2 max) of 23 g of CO2/kg of RCA (or 51 g of CO2/kg of cement paste) for OC 1–4 and 18 g/kg of RCA (40 g CO2/kg of cement paste) for HPC 1–4. This result can be compared to the plot of CO2 uptake of the two RCAs, where OC 1–4 could take up more CO2, both theoretically and experimentally, than HPC 1–4. It is possible to calculate the carbonation percentage ε as described by Zhan et al. [25]. This is the ratio (Equation (5)) between the experimental CO2 uptake (Equation (1)) and the theoretical CO2 uptake CO2 max of an RCA after accelerated carbonation (Equation (4)):
ε = CO 2   uptake   CO 2   max   × 100 %
The percentage carbonation ε was equal to 94% for OC 1–4 and 63% for HPC 1–4. This difference demonstrates that in the case of OC 1–4, all the RCA was almost totally carbonated, but for HPC 1–4, the RCA had not been totally carbonated by accelerated carbonation. Increasing the carbonation treatment time can be an option to enhance the uptake of CO2.

4.1.4. Effect of the RCA Size on the CO2 Uptake

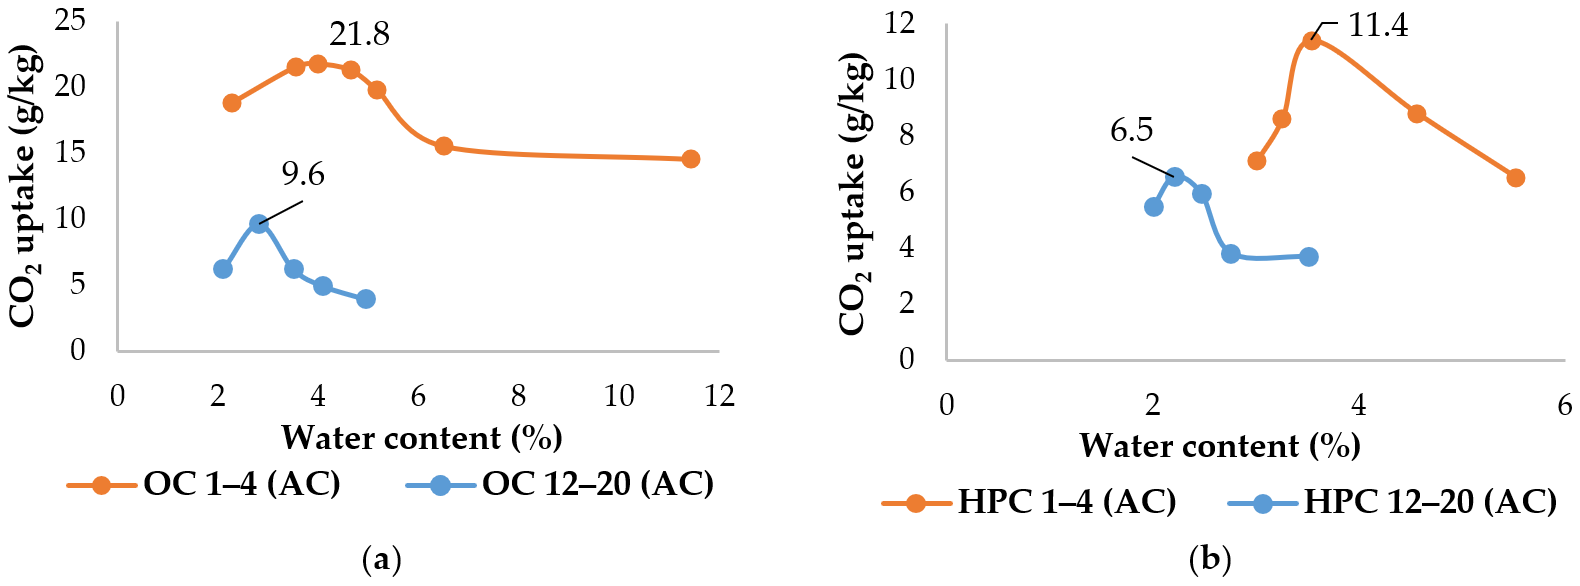
Figure 9a,b presents the effect of the RCA size on the CO2 uptake (with 15% CO2). The plots also show the effect of the water content. For OC 1–4 (Figure 9a), the optimum water content to achieve the maximum CO2 uptake of 21.8 g/kg was about 4.0%. For OC 12–20, the maximum CO2 uptake of 9.6 g/kg was achieved with a water content of about 2.8%. For HPC 1–4 (Figure 9b), the optimum water content to achieve the maximum CO2 uptake of 11.4 g/kg was about 3.5%, compared with an optimum water content of about 2.2% to achieve the maximum CO2 uptake of 6.5 g/kg for HPC 12–20.
Furthermore, we observed that the 1–4 mm RCA had a greater capacity to store CO2 than the 12–20 mm RCA for both types of RCAs. First, this difference can be explained by the physical effect of CO2 diffusion in the 1–4 mm RCA, which depends on the diameter of the RCA particles. The diffusion time of CO2 in a fine RCA is lower than in a coarse RCA. Moreover, the distribution of the phases able to be carbonated differs in the two fractions. The formation of calcium carbonates at the surface of a coarse RCA can hinder the diffusion of CO2 more than in a fine RCA, where the total volume is carbonated uniformly. Regardless of the granular fraction, the OC RCA had the highest CO2 uptake. This result may be correlated with the porosity of the OC concrete. Secondly, the portlandite rates of the RCAs differed according to the granular fraction, due to the chemical compositions of the RCAs. The difference in the portlandite rate is explained by the cement paste content, as estimated by the soluble fraction in salicylic acid (SFSA). For the OC RCA, OC 1–4 had the highest capacity for CO2 uptake because it had a higher cement paste content (45%) and a higher portlandite rate (4%) than OC 12–20, whose cement paste content was equal to 32% and portlandite rate was 2.3%. The cement paste content and the chemical composition of the RCA have a chemical effect on the CO2 uptake. In conclusion, the physical and chemical effects combined to alter the effect of the RCA particle size on the CO2 uptake. However, for the HPC RCA, the two fractions had a similar portlandite rate and the same cement paste content as estimated by SFAS, so the difference in their CO2 uptakes was low. The hypothesis of C–S–H carbonation is difficult to confirm by TGA. Although the chemical effect had less influence on the CO2 uptake for these RCAs, the physical effect of the diameter of the RCA had an influence on the difference of the CO2 uptakes between HPC 1–4 and HPC 12–20.
In the literature, Kikuchi et al. [35] suggested that fine RCAs have a higher potential CO2 uptake than coarse ones. Fang et al. [29] showed that the maximum CO2 uptake is achieved with fine RCAs rather than coarse RCAs. They concluded that the difference is related to the cement content of the RCA. Our results are consistent with this conclusion.

4.1.5. Effect of the Temperature on the CO2 Uptake

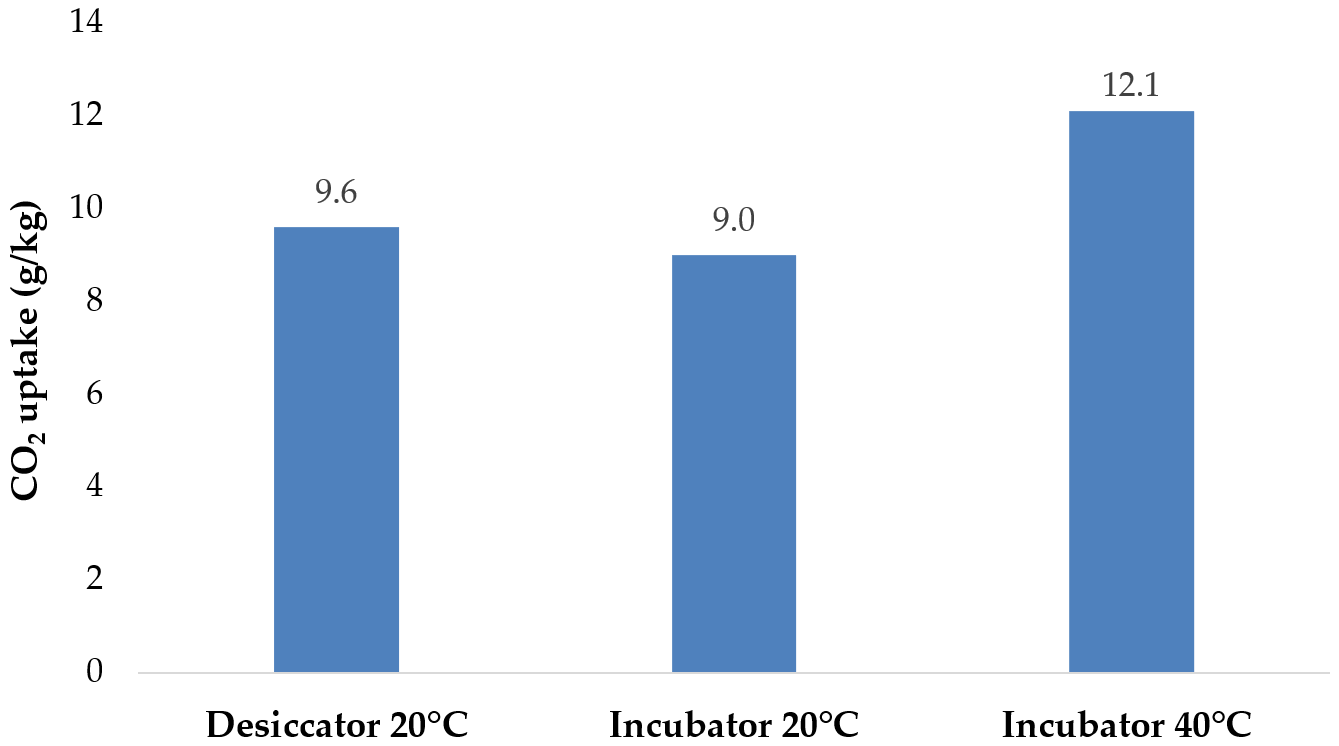
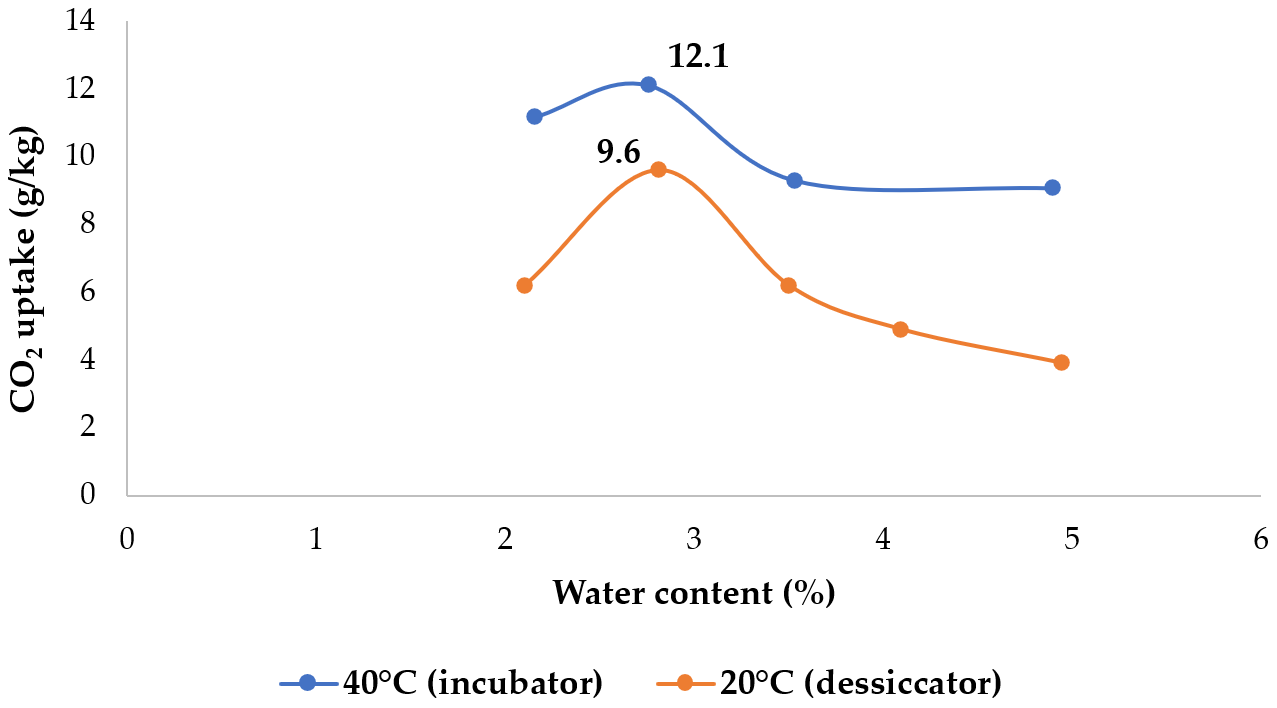
Figure 10 shows the effect of the temperature on the CO2 uptake at the same optimum water content (2.8%) that was obtained for OC 12–20 in the accelerated process in a desiccator.
The values for the process in the desiccator at 20 °C and in the incubator at 20 °C were similar. The passage from the desiccator to the incubator indicated the repeatability of the carbonation tests within the same temperature range. A maximum CO2 uptake of 12.1 g/kg was obtained at 40 °C, with an increase of around 34% in the CO2 uptake. An increase in temperature increased the diffusion of CO2 in the pores of the RCA, impacting the diffusion coefficient of the gas through a thermoactivated effect. Conversely, the dissolution of portlandite decreased with the temperature. The fact that the temperature increased the carbonation potential indicates that the diffusion of CO2 is the dominant factor, compared with the dissolution of portlandite, as described by Drouet et al. [39]. In their study, Drouet et al. determined the effect of the temperature on the depth of carbonation for a CEM I cement paste. An increase in temperature from 20 °C to 80 °C increased the depth of carbonation.
Wang et al. [38] suggested that for a cement paste with a water-to-cement ratio of 0.7 in an SSD state, increasing the temperature to 100 °C results in an increase in the CO2 uptake. These results are consistent with ours.
The effect of the water content on the CO2 uptake was studied at 40 °C. The plot in Figure 11 shows a comparative analysis for OC 12–20 of the effect of the water content on the CO2 uptake between the process of carbonation at 20 °C in the desiccator and the test at 40 °C in the incubator.
As can be seen in Figure 11, the optimum water content was 2.8% for both temperatures, and the maximum CO2 uptake was 9.6 g/kg in the desiccator and 12.1 g/kg in the incubator. Between 20 °C and 40 °C, the temperature sped up carbonation without shifting the optimum water content. The temperature can affect the water content of the RCA. Thus, as Wang et al. [38] concluded in their study, an optimum temperature below 100 °C can improve the maximum CO2 uptake, and after this optimum temperature, an excessively high temperature inhibits the carbonation process by complete evaporation of the water in the pores of cement-based materials.
With regard to the effect of the temperature on the optimum relative humidity, Drouet et al. [39] observed, for an ordinary cement paste, that an increase in temperature did not have a significant impact on the optimum relative humidity. The modification in the relative humidity as a result of the temperature had a small impact on carbonation. This conclusion is consistent with our results: the CO2 uptake for OC 12–20, sourced from ordinary concrete, achieved its maximum value at the same water content, regardless of the temperature.
In Figure 11, the plot showing the rates of CO2 uptake at 40° C exhibits less difference between the highest and lowest values as the water content changes than the plot for 20 °C. For example, the increase in CO2 uptake between a water content of 2.1% and 2.8% was about 55% at 20 °C and about 8% at 40 °C. At a water content of 5%, the reduction in CO2 uptake attained 59% at 20 °C, but it was only about 25% at 40 °C. The effect of the water content on carbonation was thus most apparent at 20 °C, because the RCA with this water content dried less at this temperature.

4.1.6. Correlation between the Optimum Water Content and the Water Absorption Coefficient of the RCA

The physicochemical properties of RCAs, such as water absorption, are responsible for a mode of saturation which is specific to each material. The relationship between the water content and the water absorption coefficient is indeed known. The pore size distribution of the material or its chemistry can also affect the optimum water content in other applications, as is described in [50] for soot aerosols and their water uptake properties.
However, several interests require determination of the relationship between the optimum water content and the WAC of an RCA.
Thus, based on the values obtained for the optimum water content, which differed for each RCA, Figure 12 shows the relationship between the optimum water content and the water absorption coefficient of an RCA.
The relationship between the optimum water contents and water absorption coefficients could be approximated with a linear relation. Based on the equation of the linear regression, the two factors differed by a factor of 0.83, with a standard deviation of 12%.
The optimum water content is related to the maximum CO2 uptake, as was demonstrated in Section 4.1. Thus, this relationship between the optimum water content and the WAC of an RCA gives information on the maximum CO2 uptake. In the literature on concretes, the optimum water content is described globally to be between 65 and 80% in relative humidity. This relation is important data for research and could be used in several applications because of the important number of RCAs from different origins, types and sizes tested to obtain these values.
The value of this relationship lies in its potential use in an industrial context. For reasons of efficiency and time, the optimum water content cannot be determined by accelerated carbonation tests. However, if the water absorption coefficient is known, the above relationship can be used to determine the optimum water content to be applied to an RCA in an industrial environment and if it is possible to correct the water content of the RCA before treatment.

4.2. Impact of Accelerated Carbonation on the Properties of RCAs

Accelerated carbonation has an impact on an RCA’s properties. In fact, after accelerated carbonation, the phases of portlandite are consumed and CaCO3 is formed, as is presented in Table 5 and Table 6. This consumption affected the decrease in the SFSA, because the SFSA represents phases that can be carbonated.
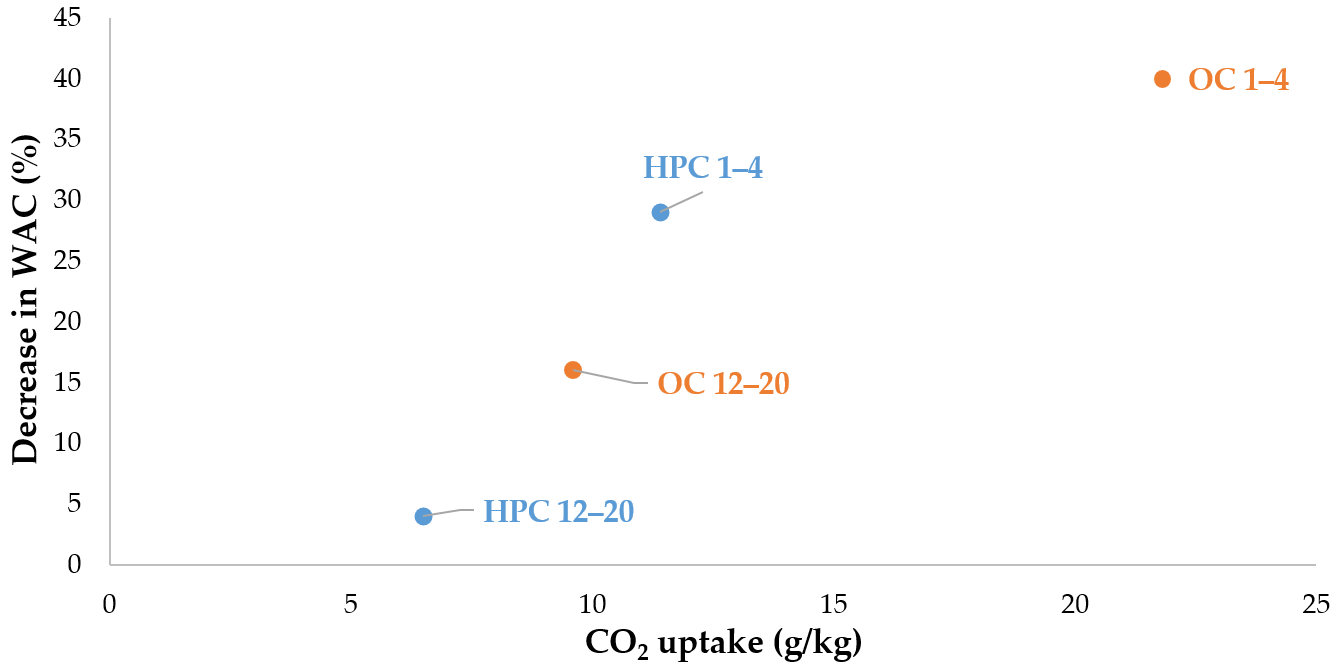
Table 5 and Table 6 also present the porosity and the WAC of RCAs after carbonation. The uptake of CO2 enhanced the two properties by the filling of pores with CaCO3, and there was a relation between the increase in the CO2 uptake and the decrease in porosity and the WAC. For OC 1–4, after 21.8 g/kg of CO2 uptake, the porosity decreased by 35%, and the WAC decreased by 40%. For OC 12–20, the porosity decreased by 30%, and the WAC decreased by 15%. Thus, the CO2 uptake, influenced by the different parameters of carbonation, had an impact on the RCA properties.

4.2.1. Impact of Natural and Accelerated Carbonation on the Water Absorption Coefficient

Figure 13 shows the effect of carbonation on the WAC. For RB 1–4, the WAC of the non-carbonated RCA (RB 1–4 (reference)) was equal to 8.9% [22]. After natural carbonation from 6 years of storage, the WAC of the NC–RB 1–4 decreased by 48% compared with the reference. After accelerated carbonation with a CO2 uptake of 8.9 g/kg, the WAC of RB 1–4 decreased by 69% compared with the reference.
Moreover, for RB 1–4 C, because of accelerated carbonation with a CO2 uptake of 17.3 g/kg (at 100% CO2), the WAC of RB 1–4 C decreased by 39% compared with NC–RB 1–4. This decrease in the WAC was due to the clogging of the pores by calcium carbonates that were formed during accelerated carbonation. In the literature, Zhang et al. and Li also observed a reduction in the WAC after accelerated carbonation [51,52].
Natural carbonation had an effect on the WAC; 6 years of storage reduced the WAC to around 50%. This process also had an effect on accelerated carbonation and the WAC. Indeed, a CO2 uptake of 8.6 g/kg for NC–RB 1–4 during natural carbonation led to a 39% reduction in the WAC after accelerated carbonation. However, the greatest effect of carbonation on the WAC was attributed to accelerated carbonation, with a reduction of up to 69%.
On the other hand, in the case of RB 1–4 C, which had undergone partial natural carbonation and was then subjected to the accelerated carbonation process (17.3 g/kg CO2 uptake), accelerated carbonation improved water absorption, with a decrease in the WAC of 39%. This was equivalent to the decrease in the WAC after 6 years of natural carbonation.
In conclusion, as shown in Figure 13, natural and accelerated carbonation improved the water absorption of the RCAs by decreasing the WAC. However, accelerated carbonation decreased the WAC more. The effect of natural carbonation combined with accelerated carbonation was substantially the same as that of accelerated carbonation on its own.
For CB 1–4, after accelerated carbonation with storage of 49.9 g/kg of CO2, the WAC was equal to 3.0%. With respect to the reference, the decrease in the WAC was around 52%. The correlation between the decrease in the WAC and the CO2 uptake for RCAs sourced from demolition concretes is presented in Figure 14.
For RCAs obtained from laboratory concretes, the trend was similar (Figure 15). This shows that carbonation has a repeatable effect on the WAC, regardless of the type and fraction of the RCA, as a result of the formation of calcium carbonates in the pores in the RCA.
The decrease in the WAC was also correlated with the formation of calcium carbonates during carbonation tests (Figure 16).
Due to the effect of accelerated carbonation and a CO2 uptake of 8.6 g/kg (Figure 13), the WAC of RB 1–4 decreased by 39% compared with NC–RB 1–4 because of the formation of 1.7% CaCO3. In the same way, for RB 1–4 C, the CO2 uptake was equal to 12.6 g/kg (with 15% CO2), and the decrease in the WAC was around 31% because of the formation of 15% CaCO3 due to accelerated carbonation. Compared with RB 1–4, the CO2 uptake of RB 1–4 C was doubled, and the increase in CaCO3 was higher than for RCA-RB 1–4. One can conclude that the formation of CaCO3 was correlated with the CO2 uptake and the quantity of available cement hydrates. In fact, the quantity of portlandite was around 0.4% for NC–RB 1–4 C, compared with around 0% for NC–RB 1–4. Thus, the formation of CaCO3 in RB 1–4 C was related to the consumption of portlandite, but for RB 1–4, the formation of CaCO3 may have been due to the carbonation of C–S–H, which could not be determined by TGA analysis. Moreover, the natural carbonation of NC–RB 1–4 could affect its porosity, slowing the diffusion of CO2 and limiting the formation of CaCO3. However, the decrease in the WAC did not vary in a linear manner with the quantity of CaCO3 formed, because for RB 1–4, the decrease in the WAC was around 31%, compared with 39% for RB 1–4 C. The formation of calcium carbonates by accelerated carbonation decreased the water absorption coefficient of the RCA by filling the pores, but the quantity of CaCO3 formed did not have a simple correlation with the CO2 uptake.

4.2.2. Effect of the CO2 Concentration on the CO2 Uptake and Water Absorption Coefficient

Figure 17 also shows the effect of the CO2 concentration on the CO2 uptake. Tests were carried out on RB 1–4 C with CO2 concentrations of 15% and 100% and the same water content (5.2%). The maximum CO2 uptake increased by around 37% with the concentration between 15% and 100%. For RB 10–20, the difference in CO2 uptake between the two concentrations was the same as this, as was shown in Section 4.1.2.
The CO2 uptake affected the WAC, as the pores in the RCA were clogged as a result of accelerated carbonation. For NC–RB 1–4 C, the WAC was about 5.2%. After accelerated carbonation, the WAC decreased by 31% and 39% at CO2 concentrations of 15% and 100%, respectively. The difference between the decrease at 15% and 100% was around 11%.
The WAC decreased at CO2 concentrations of 20% for RCAs sourced from demolition concretes. The WAC decreased as the CO2 concentration rose and due to the CO2 uptake, but between CO2 concentrations of 20% and 100%, the decrease in the WAC after carbonation became stable.

4.2.3. Changes in the Pore Size Distribution of an RCA by Mercury Intrusion Porosimetry

Figure 18 shows the change in the pore size distribution of RB 1–4 C that had undergone various treatments: before carbonation (NC–RB 1–4 C), after accelerated carbonation with a CO2 concentration of 15% (RB 1–4 C (15% CO2)) and 100% CO2 (RB 1–4 C (100% CO2)).
As expected, carbonation affected the porous structure of the RCA, decreasing its total porosity. The total porosity of NC–RB 1–4 C was about 17% and fell after accelerated carbonation to 15% and 14% for RB 1–4 C (15% CO2) and RB 1–4 C (100% CO2), respectively. The total decrease in porosity was around 20%. As for the pore size distribution, for NC–RB 1–4, the plot has a monomodal distribution with a wide peak between 30 and 220 nm, which corresponds with the capillary pores. After accelerated carbonation with 15% CO2 (and a CO2 uptake of 16.7 g/kg), this plot has a bimodal distribution, and the peak decreases. The porosity in this range also decreased when the CO2 concentration was increased to 100% (CO2 uptake of 17.3 g/kg). This decrease was undoubtedly due to the clogging of pores by the formation of calcium carbonates during carbonation, which has been observed in both cement pastes [40,53,54] and RCAs [55]. The calcium carbonates that are formed accumulate and fill large pores. They improve the porous structure and reduce the range of size of the capillary pores. Zhan et al. and Xuan et al. [53,55] observed that carbonation reduced the number of pores over 200 nm or eliminated them. In our case, carbonation did not have a significant effect on the range of pore sizes because NC–RB 1–4 C was partially carbonated. Moreover, Figure 18 shows that carbonation led to an increase of pores of under 30 nm. Wang et al. and Fang et al. [40,54] reported the same finding. This is the range of pore sizes, in particular those under 10 nm, which made up the pores in the C–S–H gel. The decalcification of C–S–H due to carbonation occurred in these pores, producing a coarse poral structure. This decalcification was greater with a CO2 concentration of 100%, leading to a CO2 uptake of 17.3 g/kg (Figure 18). This suggests that the increase in the number of pores of under 30 nm was greater with a CO2 concentration of 100% than 15%. This conclusion is consistent with an optimum of concentration of CO2.
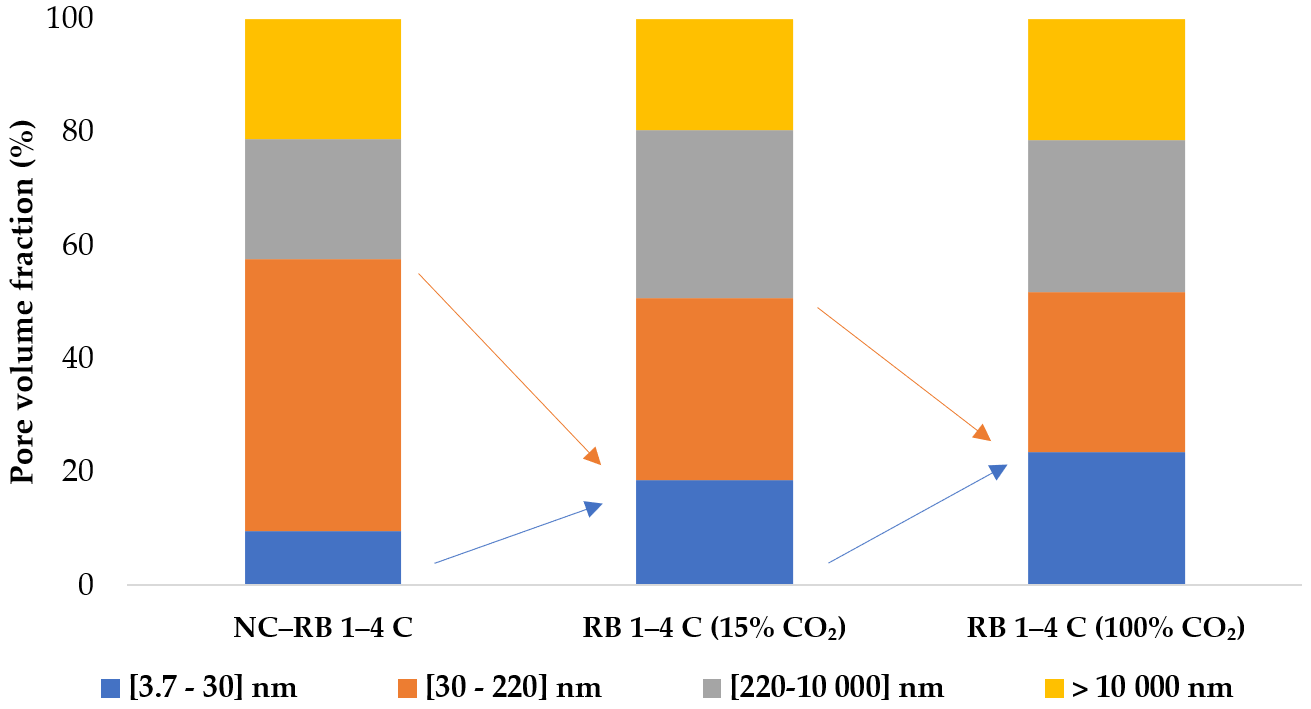
The pore volume fraction is presented in Figure 19. Four ranges of pores were identified:
  • 3.7–30 nm: micropores (pores between C–S–H gels and capillary micropores);
  • 30–220 nm: capillary pores;
  • 220–10,000 nm: macropores;
  • Pores >10,000 nm: large pores (air bubbles due to production of the concrete).
As we can see in Figure 19, carbonation increased the number of pores with a diameter of less than 30 nm due to decalcification of the C–S–H. At a CO2 concentration of 100%, there were 2.5 times more of such pores in the carbonated RCA than in the reference RCA. The number of capillary pores was reduced by 33% at 15% CO2 and 40% with 100% CO2 due to CO2 uptake and the formation of calcium carbonates. In both cases, these values were consistent with the decrease in the water absorption coefficient. In the case of RB 1–4 C, carbonation did not have a significant effect on the macropores or the large pores. The CO2 concentration and CO2 uptake also had an impact on the pore volume fraction, leading to a significant increase in the presence of micropores and a significant decrease in the volume of capillary pores with a CO2 concentration of 100%.
In our study, microcracks were not observed on our RCAs after carbonation, unlike the observations of some authors on larger samples [56,57,58,59]. The effect of carbonation on an RCA’s microstructure can be affected by microcracks, which can be explained by carbonation shrinkage, as described by Houst [60], Auroy et al. [61] and Wu et al. [62].
The CO2 concentration of 100% produced the maximum CO2 uptake within the microstructure. This conclusion allows us to link the effect of the CO2 uptake on the water absorption coefficient and the microstructure. In fact, the decrease in the WAC with 15% CO2 was lower than with 100% CO2 (by 36% and 43%, respectively), and the capillary pores decreased by a factor of about 2.5 with 15% CO2 compared with 2.5 times with 100% CO2.

5. Conclusions

This parametric study of accelerated carbonation of RCAs has highlighted that carbonation is affected by several parameters, which influence the uptake of CO2 and improve the properties of RCAs. We can draw a number of conclusions from this study:
  • For each carbonation test, water content is the most important parameter for reaching an effective rate of CO2 uptake, whatever the studied parameter;
  • The maximum CO2 uptake is 50 g/kg for CB 1–4 because they are not carbonated at the initial state, and the minimum is for RB 1–4 (8.6 g/kg) because of the initial natural carbonation. The mean of CO2 uptake was around 15–20 g/kg for the studied RCAs;
  • The correlation between the optimum water content and the water absorption coefficient is important for effective carbonation. To obtain the maximum CO2 uptake, it is necessary to have an optimum water content equal to 80% of the RCA’s water absorption coefficient. This conclusion is important for industrial applications;
  • Carbonation decreases the WAC by filling pores due to the formation of calcium carbonates. CO2 uptake during treatment could decrease the WAC by up to 39% in the case of RB 1–4 C (AC), while natural carbonation could decrease the WAC by up to 48% after 6 years of storage, as was observed for NC–RB 1–4;
  • Finally, carbonation leads to the formation of calcium carbonates and to a decrease in total porosity. The capillary porosity is decreased due to clogging of the pores. In addition, carbonation increases the microporosity of an RCA, especially the porosity of the C–S–H gel, as a result of decalcification.

Author Contributions

Conceptualization, M.S., A.D., O.O.M. and J.-M.T.; methodology, M.S.; formal analysis, M.S.; investigation, M.S.; data curation, M.S.; writing—original draft, M.S.; writing—review and editing, M.S., A.D., O.O.M., P.D. and J.-M.T.; supervision, A.D., O.O.M. and J.-M.T.; project administration, A.D. and J.-M.T.; funding acquisition, J.-M.T. All authors have read and agreed to the published version of the manuscript.

Funding

This research received external funding from the French Ministry for the Ecological Transition (through IREX) in the framework of the FastCarb National Project.

Acknowledgments

The investigations and results reported in this paper have the support of the French Ministry for the Ecological Transition in the framework of the FastCarb National Project.

Conflicts of Interest

The authors declare no conflict of interest.

References

  1. Yap, S.P.; Goh, Y.; Mo, K.H.; Ibrahim, H.A. Recycling of construction and demolition wastes into renewable construction materials. Ency. Ren. Sust. Mat. 2019, 2, 520–526. [Google Scholar] [CrossRef]
  2. Afnor. NF EN 206/CN: Concrete–Specification, Performance, Production and Conformity–National Addition to the Standard NF EN 206; Afnor: Kent, UK, 2014. [Google Scholar]
  3. De Brito, J.; Saikia, N. Recycled Aggregate in Concrete-Use of Industrial, Construction and Demolition Waste; Springer: Berlin/Heidelberg, Germany, 2013. [Google Scholar]
  4. De Juan, M.S.; Gutiérrez, P.A. Study on the influence of attached mortar content on the properties of recycled concrete aggregate. Constr. Build. Mat. 2009, 23, 872–877. [Google Scholar] [CrossRef]
  5. Omary, S.; Ghorbel, E.; Wardeh, G. Relationships between recycled concrete aggregates characteristics and recycled aggregates concretes properties. Constr. Build. Mat. 2016, 108, 163–174. [Google Scholar] [CrossRef]
  6. Verian, K.P.; Ashraf, W.; Cao, Y. Properties of recycled concrete aggregate and their influence in new concrete production. Res. Cons. Recycl. 2018, 133, 30–49. [Google Scholar] [CrossRef]
  7. Barra, M.; Vasquez, E. Properties of concretes with recycled aggregates: Influence of properties of the aggregats and their interpretation. In Proceedings of the International Symposium on Sustainable Construction: Use of Recycled Concrete Aggregate, London, UK, 11–12 November 1998; ICE Publishing: London, UK, 2015; pp. 558–563. [Google Scholar]
  8. De Brito, J.; Ferreira, J.; Pacheco, J.; Soares, D.; Guerreiro, M. Structural, material, mechanical and durability properties and behaviour of recycled aggregates concrete. J. Build. Eng. 2016, 6, 1–16. [Google Scholar] [CrossRef]
  9. Zega, C.J.; Di Maio, A.A. Use of recycled fine aggregate in concretes with durable requirements. Waste Manag. 2011, 31, 2336–2340. [Google Scholar] [CrossRef] [PubMed] [Green Version]
  10. Duan, Z.H.; Poon, C.S. Properties of recycled aggregate concrete made with recycled aggregates with different amounts of old adhered mortars. Mat. Design 2014, 58, 19–29. [Google Scholar] [CrossRef]
  11. Dimitriou, G.; Savva, P.; Petrou, M.F. Enhancing mechanical and durability properties of recycled aggregate concrete. Constr. Build. Mat. 2018, 158, 228–235. [Google Scholar] [CrossRef]
  12. Gholampour, A.; Ozbakkaloglu, T. Time-dependent and long-term mechanical properties of concretes incorporating different grades of coarse recycled concrete aggregates. Eng. Struct. 2018, 157, 224–234. [Google Scholar] [CrossRef]
  13. Ozbakkaloglu, T.; Gholampour, A.; Xie, T. Mechanical and Durability Properties of Recycled Aggregate Concrete: Effect of Recycled Aggregate Properties and Content. J. Mat. Civil Eng. 2017, 30, 1–13. [Google Scholar] [CrossRef]
  14. Kumar, R.; Gurram, S.C.B.; Minocha, A.K. Influence of recycled fine aggregate on microstructure and hardened properties of concrete. Mag. Concr. Res. 2017, 69, 1288–1295. [Google Scholar] [CrossRef]
  15. Etxeberria, M.; Vasquez, E.; Mari, A.; Barra, M. Influence of amount of recycled coarse aggregates and production process on properties of recycled aggregate concrete. Cem. Concr. Res. 2007, 37, 735–742. [Google Scholar] [CrossRef]
  16. Evangelista, L.; De Brito, J. Mechanical behaviour of concrete made with fine recycled concrete aggregates. Cem. Concr. Comp. 2007, 29, 397–401. [Google Scholar] [CrossRef]
  17. Ismail, S.; Kwan, W.H.; Ramli, M. Mechanical strength and durability properties of concrete containing treated recycled concrete aggregates under different curing conditions. Constr. Build. Mat. 2017, 155, 296–306. [Google Scholar] [CrossRef]
  18. Thomas, C.; Setién, J.; Polanco, J.A.; Alaejos, P.; De Juan, M.S. Durability of recycled aggregate concrete. Constr. Build. Mat. 2013, 40, 1054–1065. [Google Scholar] [CrossRef]
  19. Xiao, J.; Li, W.; Poon, C. Recent studies on mechanical properties of recycled aggregate concrete in China-A review. Sci. China Tech. Sci. 2012, 55, 1463–1480. [Google Scholar] [CrossRef]
  20. Kwan, W.H.; Ramli, M.; Kam, K.J.; Sulieman, M.Z. Influence of the amount of recycled coarse aggregate in concrete design and durability properties. Constr. Build. Mat. 2012, 26, 565–573. [Google Scholar] [CrossRef]
  21. Erdem, S.; Blankson, M.A. Environmental performance and mechanical analysis of concrete containing recycled asphalt pavement (RAP) and waste precast concrete as aggregate. J. Hazard. Mat. 2014, 264, 403–410. [Google Scholar] [CrossRef]
  22. De Larrard, F.; Colina, H. Concrete Recycling: Research and Practice (Ouvrage de synthèse du PN RecyBéton); CRC Press: Boca Raton, FL, USA, 2018. [Google Scholar]
  23. Shi, C.; Li, Y.; Zhang, J.; Li, W.; Chong, L.; Xie, Z. Performance enhancement of recycled concrete aggregate–A review. J. Clean. Prod. 2016, 112, 466–472. [Google Scholar] [CrossRef]
  24. Zhang, D.; Cai, X.; Shao, Y. Carbonation curing of precast fly ash concrete. J. Mat. Civil Eng. 2016, 28. [Google Scholar] [CrossRef]
  25. United Nations. Report of the Conference of the Parties on Its Twenty-First Session, Held in Paris from 30 November to 13 December 2015-Part Two: Action Taken by the Conference of the Parties at Its Twenty-First Session; Report n°FCCC/CP/2015/10/Add.1; United Nations: New York, NY, USA, 2016. [Google Scholar]
  26. Miricioiu, M.G.; Niculescu, V.-C.; Filote, C.; Raboaca, M.; Nechifor, G. Coal fly ash derived silica nanomaterial for MMMS–Application in CO2/CH4 Separation. Membranes 2021, 11, 78. [Google Scholar] [CrossRef] [PubMed]
  27. Miricioiu, M.G.; Niculescu, V.-C. Fly ash, from recycling to potential raw material for mesoporous silica synthesis. Nanomaterials 2020, 10, 474. [Google Scholar] [CrossRef] [Green Version]
  28. Zhan, B.; Poon, C.S.; Liu, Q.; Kou, S.C.; Shi, C. Experimental study on CO2 curing for enhancement of recycled aggregate properties. Constr. Build. Mat. 2014, 67, 3–7. [Google Scholar] [CrossRef]
  29. Fang, X.; Xuan, D.; Poon, C.S. Empirical modelling of CO2 uptake by recycled concrete aggregates under accelerated carbonation conditions. Mat. Struct. 2017, 50, 200–212. [Google Scholar] [CrossRef]
  30. Pan, G.; Zhan, M.; Fu, M.; Wang, Y.; Lu, X. Effect of CO2 curing on demolition recycled fine aggregates enhanced by calcium hydroxide pre-soaking. Constr. Build. Mat. 2017, 154, 810–818. [Google Scholar] [CrossRef]
  31. Pu, Y.; Li, L.; Wang, Q.; Shi, X.; Luan, C.; Zhang, G.; Fu, L.; El-Fatah Abomohra, A. Accelerated carbonation technology for enhanced treatment of recycled concrete aggregates: A state-of-the-art review. Constr. Build. Mat. 2021, 282, 122671. [Google Scholar] [CrossRef]
  32. Quattrone, M.; Cazacliu, B.; Angulo, S.C.; Hamard, E.; Cothenet, A. Measuring the water absorption of recycled aggregates, what is the best practice for concrete production? Constr. Build. Mat. 2016, 123, 690–703. [Google Scholar] [CrossRef]
  33. Xuan, D.; Zhan, B.; Poon, C.S. Assessment of mechanical properties of concrete incorporating carbonated recycled concrete aggregates. Cem. Concr. Compos. 2016, 65, 67–74. [Google Scholar] [CrossRef]
  34. Xuan, D.; Zhan, B.; Poon, C.S. Development of a new generation of eco-friendly concrete blocks by accelerated mineral carbonation. J. Clean. Prod. 2016, 133, 1235–1241. [Google Scholar] [CrossRef]
  35. Kikuchi, T.; Kuroda, Y. Carbon dioxide uptake in demolished and crushed concrete. J. Adv. Concr. Tech. 2011, 9, 115–124. [Google Scholar] [CrossRef] [Green Version]
  36. Kaliyavaradhan, S.K.; Ling, T.-C. Potential of CO2 sequestration through construction and demolition (C&D) waste—An overview. J. CO2 Util. 2017, 20, 234–242. [Google Scholar] [CrossRef]
  37. Liang, C.; Pan, B.; Ma, Z.; He, Z.; Duan, Z. Utilization of CO2 curing to enhance the properties of recycled aggregate and prepared concrete: A review. Cem. Concr. Comp. 2020, 105, 103446. [Google Scholar] [CrossRef]
  38. Wang, D.; Noguchi, T.; Nozaki, T. Increasing efficiency of carbon dioxide sequestration through high temperature carbonation of cement-based materials. J. Clean. Prod. 2019, 238, 117980. [Google Scholar] [CrossRef]
  39. Drouet, E.; Poyet, S.; Le Bescop, P.; Torrenti, J.-M.; Bourbon, X. Carbonation of hardened cement pastes: Influence of temperature. Cem. Concr. Res. 2019, 115, 445–459. [Google Scholar] [CrossRef] [Green Version]
  40. Wang, J.; Xu, H.; Xu, D.; Du, P.; Zhou, Z.; Yuan, L.; Cheng, X. Accelerated carbonation of hardened cement pastes: Influence of porosity. Constr. Build. Mat. 2019, 225, 159–169. [Google Scholar] [CrossRef]
  41. Collectif Presses de l’école nationale des ponts et chaussées. In Synthèse des Travaux du Projet National BHP 2000 sur les Bétons à Hautes Performances; Presses de l’école nationale des ponts et chaussées: Paris, France, 2005. (In French)
  42. Afnor. NF 1097-6: Tests for Mechanical and Physical Properties of Aggregates-Part 6: Determination of Particle Density and Water Absorption; Afnor: Kent, UK, 2014. [Google Scholar]
  43. Yacoub, A.; Djerbi, A.; Fen-Chong, T. Water absorption in recycled sand: New experimental methods to estimate the water saturation degree and kinetic filling during mortar mixing. Constr. Build. Mat. 2018, 158, 464–471. [Google Scholar] [CrossRef]
  44. Zhao, Z.; Remond, S.; Damidot, D.; Xu, W. Influence of hardened cement paste content on the water absorption of fine recycled concrete aggregates. J. Sust. Cement-Based Mat. 2013, 2, 186–203. [Google Scholar] [CrossRef]
  45. Sereng, M. Amélioration des propriétés des granulats recyclés par stockage de CO2: Étude de la faisabilité préindustrielle. Ph.D. Thesis, University Paris-Est, Paris, France, 2020. (In French). [Google Scholar]
  46. Morandeau, A.; Thiéry, M.; Dangla, P. Investigation of the carbonation mechanism of CH and C–S–H in terms of kinetics, microstructure changes and moisture properties. Cem. Concr. Res. 2014, 56, 153–170. [Google Scholar] [CrossRef] [Green Version]
  47. Djerbi Tegguer, A. Determining the water absorption of recycled aggregates utilizing hydrostatic weighing approach. Constr. Build. Mat. 2012, 27, 112–116. [Google Scholar] [CrossRef]
  48. Yacoub, A.; Djerbi, A.; Fen-Chong, T. The effect of the drying temperature on water porosity and gas permeability of recycled sand mortar. Constr. Build. Mat. 2019, 214, 677–684. [Google Scholar] [CrossRef]
  49. Zhang, Z.; Pan, S.-Y.; Li, H.; Cai, J.; Olabi, A.; Anthony, E.J.; Manovic, V. Recent advances in carbon dioxide utilization. Ren. Sustain. Energy Rev. 2020, 125, 109799. [Google Scholar] [CrossRef]
  50. Baldelli, A.; Esmeryan, K.D.; Popovicheva, O. Turning a negative into a positive: Trends, guidelines and challenges of developing multifunctional non-wettable coatings based on industrial soot wastes. Fuel 2021, 301, 121068. [Google Scholar] [CrossRef]
  51. Zhang, J.; Shi, C.; Li, Y.; Pan, X.; Poon, C.S.; Xie, Z. Influence of carbonated recycled concrete aggregate on properties of cement mortar. Constr. Build. Mat. 2015, 98, 1–7. [Google Scholar] [CrossRef]
  52. Li, Y.K. Improvement of Recycled Concrete Aggregate Properties by CO2 Curing. Ph.D. Thesis, Hunan University, Changsha, China, 2014. [Google Scholar]
  53. Zhan, B.J.; Xuan, D.X.; Poon, C.S.; Shi, C.J. Mechanism for rapid hardening of cement pastes under coupled CO2-water curing regime. Cem. Concr. Comp. 2019, 97, 78–88. [Google Scholar] [CrossRef]
  54. Fang, X.; Zhan, B.; Poon, C.S. Enhancing the accelerated carbonation of recycled concrete aggregates by using reclaimed wastewater from concrete batching plants. Constr. Build. Mat. 2020, 239, 117810. [Google Scholar] [CrossRef]
  55. Xuan, D.; Zhan, B.; Poon, C.S. Durability of recycled aggregate concrete prepared with carbonated recycled concrete aggregates. Cem. Concr. Comp. 2017, 84, 214–221. [Google Scholar] [CrossRef]
  56. Li, Y.; Fu, T.; Wang, R.; Li, Y. An assessment of microcracks in the interfacial transition zone of recycled concrete aggregates cured by CO2. Constr. Build. Mat. 2020, 236, 117543. [Google Scholar] [CrossRef]
  57. Fernandez Bertos, M.; Simons, S.J.R.; Hills, C.D.; Carey, P.J. A review of accelerated carbonation technology in the treatment of cement-based materials and sequestration of CO2. J. Hazard. Mat. 2004, 112, 193–205. [Google Scholar] [CrossRef]
  58. Goñi, S.; Gaztañaga, M.T.; Guerrero, A. Role of cement type on carbonation attack. J. Mat. Sci. 2002, 17, 1834–1842. [Google Scholar] [CrossRef]
  59. Saillio, M.; Baroghel-Bouny, V.; Pradelle, S. Effect of carbonation on durability indicators and microstructure in cement pastes and concretes with supplementary cementitious materials. In Proceedings of the Fib Symposium, Cape Town, South Africa, 21–23 November 2016. [Google Scholar]
  60. Houst, Y.F. Carbonation shrinkage of hydrated cement paste. In Proceedings of the 4th CANMET/ACI International Conference on Durability of Concrete, 1997; American Concrete Institute: Farmington Hills, MI, USA, 1997; pp. 481–491. [Google Scholar]
  61. Auroy, M.; Poyet, S.; Le Bescop, P.; Torrenti, J.-M.; Charpentier, T.; Moskura, M.; Bourbon, X. Impact of carbonation on unsaturated water transport properties of cement-based materials. Cem. Concr. Res. 2015, 74, 44–58. [Google Scholar] [CrossRef]
  62. Wu, B.; Ye, G. Development of porosity of cement paste blended with supplementary cementitious materials after carbonation. Constr. Build. Mat. 2017, 145, 52–61. [Google Scholar] [CrossRef] [Green Version]
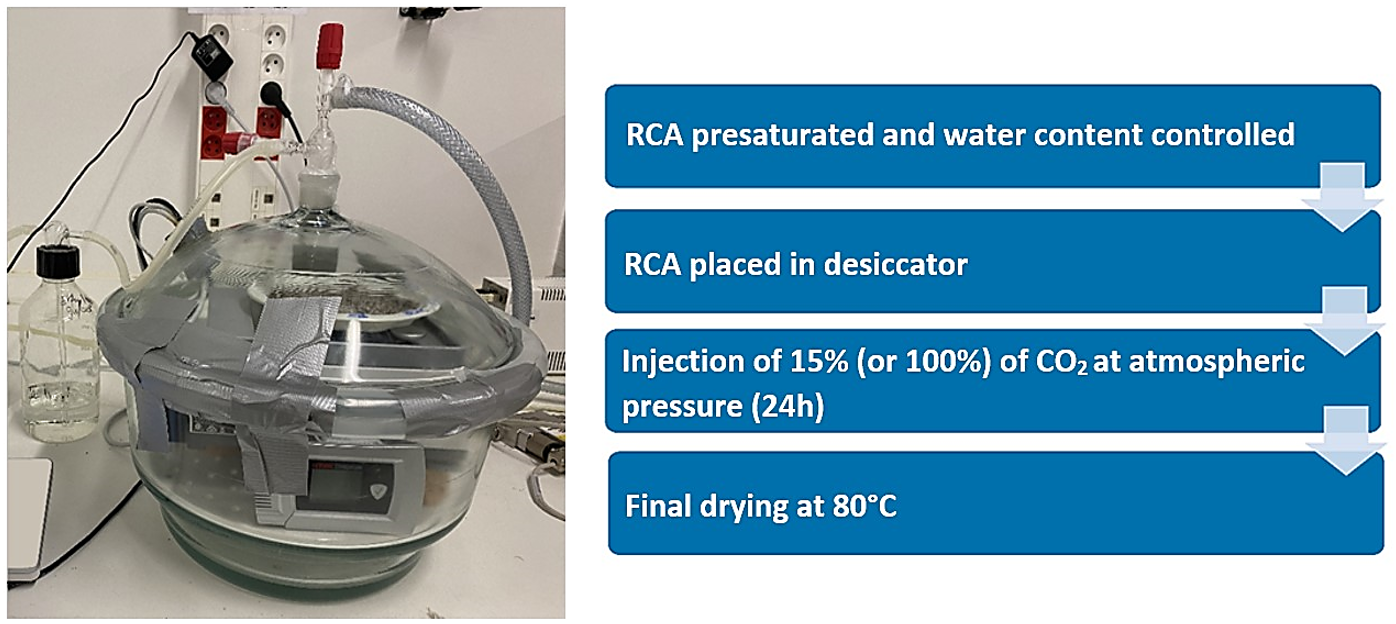
Figure 1. Experimental setup for the accelerated carbonation test.
Applsci 11 06571 g001
Figure 2. Drying curve of an RCA with respect to time to obtain the SSD state.
Applsci 11 06571 g002
Figure 3. Phenolphtalein spray on RCA (A) CB 1–4, (B) RB 1–4 C and (C) RB 1–4.
Applsci 11 06571 g003
Figure 4. Effect of the initial natural carbonation of an RCA on CO2 uptake as a function of the water content (one accelerated carbonation test for these RCAs at these water contents).
Applsci 11 06571 g004
Figure 5. Rate of CO2 uptake for each RCA with the same water content (4%) (one accelerated carbonation test for these RCAs at the same water content).
Applsci 11 06571 g005
Figure 6. Effect of the CO2 concentration on CO2 uptake as a function of the water content (one accelerated carbonation test for these RCAs at the same water content).
Applsci 11 06571 g006
Figure 7. Effect of the CO2 concentration on the CO2 uptake (RB 10–20 and RB 1–4 C) (one accelerated carbonation test for these RCAs at these water contents).
Applsci 11 06571 g007
Figure 8. Effect of the RCA type on CO2 uptake as a function of the water content (one accelerated carbonation test for these RCAs at these water contents).
Applsci 11 06571 g008
Figure 9. Effect of the RCA size on the CO2 uptake (a) for OC and (b) for HPC (one accelerated carbonation test for these RCAs at these water contents).
Applsci 11 06571 g009
Figure 10. Effect of the temperature on CO2 uptake (water content of 2.8%) (one accelerated carbonation test for these RCAs at this same water content).
Applsci 11 06571 g010
Figure 11. Effect of the water content on the CO2 uptake (at 20 °C and 40 °C) for OC 12–20 (one accelerated carbonation test for these RCAs at these water contents).
Applsci 11 06571 g011
Figure 12. Correlation between optimum water content and water absorption coefficient of an RCA.
Applsci 11 06571 g012
Figure 13. Effect of carbonation (natural and accelerated) on the WAC (one WAC measurement for each RCA after carbonation).
Applsci 11 06571 g013
Figure 14. Relationship between the decrease in the WAC and the CO2 uptake of RCAs sourced from demolition concretes.
Applsci 11 06571 g014
Figure 15. Relationship between the decrease of the WAC and the CO2 uptake of RCAs obtained from laboratory concretes.
Applsci 11 06571 g015
Figure 16. Correlation between the WAC and the formation of CaCO3 (one WAC measurement for RCAs after carbonation).
Applsci 11 06571 g016
Figure 17. Effect of the CO2 concentration on the CO2 uptake and WAC (one WAC measurement for RCAs after carbonation).
Applsci 11 06571 g017
Figure 18. Pore size distribution.
Applsci 11 06571 g018
Figure 19. Pore volume fraction.
Applsci 11 06571 g019
Table 1. The composition and characteristics of the concrete sources of OC and HPC.
Constituents (kg/m3)OCHPC
Limestone gravels, 12.5–20 mm777550
Limestone gravels, 4–12.5 mm415475
Sand (Boulonnais), 0–5 mm372407
Sand (Seine), 0–4 mm372401
Cement353461
Superplasticizer-12.4
Set retarder-3.3
Water172146
Water-to-cement ratio0.490.32
28 d compressive strength (MPa)44.575
Water porosity (%)10.98.5
Table 2. The composition of the cement in OC and HPC.
In %CaOSiO2Fe2O3Al2O3TiO2MgONa2OK2OMnOSO3CO2Loss in IgnitionFree CaO
OC66.3921.171.962.69-0.650.300.22-2.431.562.260.84
HPC65.3820.544.133.590.190.860.180.290.072.670.881.24-
Table 3. Properties of the non-carbonated RCAs.
RCASFSA (%)Portlandite Rate (%)CaCO3 Rate (%)Porosity (%)WAC (%)
NC–RB 1–421.3 ± 8.4≈040.8 ± 0.211.5 ± 0.54.6 ± 0.5
NC–RB 10–2019.3 ± 7.71.0 ± 0.136.1 ± 0.515.5 ± 0.27.1 ± 0.1
NC–RB 1–4 C26.0 ± 60.4 ± 0.135.3 ± 0.311.4 ± 0.55.1 ± 0.3
NC–CB 1–434.0 ± 1.43.4 ± 0.346.3 ± 0.513.8 ± 1.16.3 ± 0.6
NC–OC 1–4 44.9 ± 3.94.0 ± 0.261.9 ± 0.411.7 ± 0.14.8 ± 0.1
NC–OC 12–2032.1 ± 5.42.3 ± 0.266.8 ± 2.19.20 ± 0.24.0 ± 0.2
NC–HPC 1–434.8 ± 5.62.3 ± 0.262.0 ± 0.310.4 ± 0.14.0 ± 0.4
NC–HPC 12–2033.9 ± 1.22.1 ± 0.162.1 ± 3.68.6 ± 0.23.6 ± 0.3
Table 4. Effect of initial natural carbonation of an RCA on CO2 uptake.
CB 1–4RB 1–4 CRB 1–4
CO2 concentration (%)100%100%100%
Initial natural carbonation- 1+ 1++ 1
Optimum water content (%)5.45.27.2
CO2 uptake (g/kg)49.917.38.6
1 No natural carbonation. + Partial carbonation. ++ Total natural carbonation.
Table 5. Properties of carbonated RCAs (RCAs from demolition concretes).
RB 1–4RB 10–20
(15% CO2)
RB 10–20
(100% CO2)
RB 1–4 C
(15% CO2)
RB 1–4 C
(100% CO2)
CB 1–4
CO2 uptake (g/kg)8.614.920.412.617.349.9
SFSA (%)17.1 ± 7.117.9 ± 2.912.8 ± 8.220.3 ± 6.414.8 ± 5.923.1 ± 3.8
Portlandite rate (%)≈0≈0≈00.4 ± 0.1≈00.7 ± 0.1
CaCO3 rate (%)41.5 ± 0.237.2 ± 0.147.0 ± 0.340.4 ± 0.534.5 ± 0.437.2 ± 0.4
Porosity (%)6.713.214.7---
WAC (%)2.86.76.63.53.13.0
Table 6. Properties of carbonated RCAs (RCAs from laboratory concretes).
OC 1–4 OC 12–20 HPC 1–4 HPC 12–20
CO2 uptake (g/kg)21.89.611.46.5
SFSA (%)29.8 ± 4.024.8 ± 4.627.1 ± 6.928.8 ± 9.7
Portlandite rate (%)1.3 ± 0.11.7 ± 0.11.2 ± 0.11.4 ± 0.1
CaCO3 rate (%)67.9 ± 0.567.4 ± 0.364.9 ± 0.364.0 ± 0.1
Porosity (%)7.66.37.28.4
WAC (%)2.93.42.93.5
Publisher’s Note: MDPI stays neutral with regard to jurisdictional claims in published maps and institutional affiliations.