Article

Investigation into the Influence of Division Pier on the Internal Flow and Pulsation in the Outlet Conduit of an Axial-Flow Pump

1
College of Hydraulic Science and Engineering, Yangzhou University, Yangzhou 225009, China
2
Key Laboratory of Fluid and Power Machinery, Ministry of Education, Chengdu 610039, China
3
Jiangsu Surveying and Design Institute of Water Resources Co., Ltd., Yangzhou 225127, China
4
Nanjing Hydraulic Research Institute, Nanjing 210029, China
*
Author to whom correspondence should be addressed.
Appl. Sci. 2021, 11(15), 6774; https://doi.org/10.3390/app11156774
Submission received: 26 May 2021 / Revised: 21 July 2021 / Accepted: 22 July 2021 / Published: 23 July 2021
(This article belongs to the Section Mechanical Engineering)

Abstract

:
The outlet conduit is an important construction connecting the outlet of the pump guide vane and the outlet pool; in order to study the hydraulic performance of the straight outlet conduit of the axial-flow pump device, this paper adopts the method of numerical simulation and analyzes the influence of the division pier on the pressure and velocity distribution inside and near the wall of the straight outlet conduit based on three design schemes. Four pressure pulsation measuring points were arranged in the straight outlet conduit, and the low-frequency pulsation characteristic information inside the straight outlet conduit with and without the division pier was extracted by wavelet packet reconstruction. The results show that the addition of a division pier has an effect on the hydraulic loss, near-wall pressure and velocity distribution in the straight outlet conduit. A small high-pressure zone is formed near the wall at the starting position of the division pier, and a large high-speed zone is formed on the left side at the starting position of the division pier. The length of the division pier has no significant effect on the flow distribution of the straight outlet conduit and the pressure and velocity distribution near the wall. Under different working conditions, each monitoring point has the maximum energy in the sub-band (0~31.25 Hz). With the increase of the flow rate, the total pressure energy of the straight outlet conduit decreases gradually. Under each condition, the difference of the energy proportion of the horizontal monitoring points of the straight outlet conduit is small, and the difference of the energy proportion of the two monitoring points at the top and bottom of the outlet channel is relatively large. The energy of the two monitoring points in the straight outlet conduit with a division pier is smaller than that of the two monitoring points in the straight outlet conduit without a division pier. There are differences in the main frequency and the power spectrum corresponding to the main frequency of the monitoring points in the straight outlet conduit, and the reasonable setting of the division pier is conducive to reducing the pressure pulsation of the flow in the straight outlet conduit and is beneficial to the safe and stable operation of the pump device.

1. Introduction

A pumping station is the most common technical means to solve the imbalance of water resources in the world, especially for agricultural irrigation and drainage, water transfer and urban and rural construction. To date, China has more than 500,000 large, medium and small pumping stations; the total installed power exceeds 11.4 million kW [1,2], and quite a few of these pumping stations are large low head pumping stations. The axial-flow pump is the main pump type applied to low-lift pumping stations and is featured by a simple structure, flexible installation and various forms. Nearly 300 large axial-flow pumps are needed for the third phase of South-to-North Water Diversion Project in China alone, while the demand for small and medium-sized axial-flow pumps is larger, indicating that the demand for axial-flow pumps is very large [3,4].
The outlet conduit is the transition section between the outlet of the guide vane and the outlet pool, and its main role is to guide the orderly and smooth diffusion of water into the outlet pool and recover the kinetic energy of water as much as possible. According to previous studies, the hydraulic performance of the outlet conduit has an important influence on the efficiency of the axial-flow pump device, and its head loss accounts for a large proportion of the total loss of the pumping station; in particular, for the large low-lift axial-flow pump pumping stations, it accounts for about 15~25% of the total [5,6]. The width of the cross section of the outlet conduit of a large low head axial-flow pump station is more than 3 m [7]; thus, considering the structure, it is necessary to set the division pier in the outlet conduit to support it and reduce the span of the roof of the outlet conduit so as to reduce the investment of the civil construction of the pumping station. This division pier structure has been widely used in the outlet conduits of some large low-lift pumping stations in China, Japan and the United States. However, the location, length and other factors of the division pier arrangement often affect the hydraulic performance of the outlet conduit, such as affecting the flow pattern of the outlet conduit, increasing the hydraulic loss in the conduit and inducing the vortex to cause severe vibration; this poses hidden dangers to the safety of the outlet conduit [8]. However, at present, we still lack a deep understanding of the quantitative results of these impacts.
Previous studies have shown [8,9] that there is an obvious phenomenon of flow deviation in the outlet conduit of the division pier, and the hydraulic performance of the conduit has a great influence, such as causing flow pattern disorder and serious vibration and generating a large amount of noise. Pi et al. [10] used a model test to compare the multi-parameter analyses of different types of outlet conduits and found that, due to the improper setting of the division pier, the hydraulic loss in the straight outlet conduit was significantly higher than that in the siphon outlet conduit, which failed to reflect the superiority of some hydraulic properties of the straight outlet conduit. In the work by Zhu et al. [11,12], in order to obtain a suitable large low head vertical axial-flow pump outlet conduit and its design scheme, a model test was carried out on the outlet conduit of a pumping station; it was found that the water flowing out of the pump easily impacted the water surface of the division pier of the outlet conduit and easily formed vortex on the back of the division pier, resulting in increased hydraulic loss in the outlet conduit. The above research mainly analyzed the influence of the division pier in the outlet conduit through the model test; in recent years, with the rapid development of Computational Fluid Dynamics (CFD), numerical calculation has become an important development direction in the field of pump device research [13,14,15], and scholars and engineers in this field have conducted a large amount of research work on the phenomenon of flow deviation in the outlet conduit. In the work by Zhu et al. [16], in order to analyze the hydraulic characteristics in the siphon outlet conduit, the numerical simulation method was used to calculate the three-dimensional turbulent flow domain in the siphon outlet conduit under different working conditions. It was found that the outlet flow domain of the guide vane behind the axial-flow pump had an effect on the flow distribution on both sides of the siphon outlet conduit, and the right flow was always greater than the left flow. Yang et al. [7,17] analyzed the outlet conduit and the pump device as a whole system; the CFD method was used to calculate the outlet conduit, and the time domain and frequency spectrum characteristics of velocity fluctuation in the outlet conduit under different working conditions were quantitatively analyzed. It was found that the division pier in the outlet conduit had a great influence on the energy performance of the pump device, reducing the hydraulic performance of the pump device, and the main frequency of velocity fluctuation at each monitoring point of the inlet surface of the outlet conduit under different working conditions was 0.5 times the frequency conversion. In order to study the hydraulic characteristics of the inclined outlet conduit of a large low head pumping station, Xu et al. [18] set up water pressure pulsation measuring points on the left and right sides of the outlet conduit to obtain the pressure of the left and right sides of the flow deviation; combined with a numerical simulation, the causes of the internal flow deviation in the inclined outlet conduit of a 20° inclined axial extension pump device were analyzed, and it was found that a large range of vortices were generated in the lower part of the right side of the division pier. When the length of the division pier is 23.35 m, the flow rate on the left and right sides of the inclined outlet conduit is basically the same, the vortex range on the right side of the division pier is gradually reduced, and the pressure values on the left and right sides of the outlet conduit become very close. By means of a model test and numerical simulation, Wang et al. [19,20] studied the problem of serious flow deviation in the outlet conduit of an inclined axial-flow pump and found that the flow on the left side of the outlet conduit along the flow direction is higher than that on the right side, and the residual circulation has an effect on the flow deviation. It can be seen from the above that a division pier will lead to flow deviation in the outlet conduit, and a certain vortex area will often appear on both sides of the pier [18]; the vortex in the conduit is the main cause of vibration [21]. In the existing research, some scholars have used a Fourier transform to analyze the time domain and frequency domain of pressure fluctuation signals for the phenomenon of flow deviation in the outlet conduit and found that there were a large number of low-frequency signal components on both sides of the division pier in the outlet conduit [22,23]. However, the most commonly used Fourier transform cannot effectively process the low-frequency signal, and further research on this part of the results to obtain the energy characteristics of the low-frequency signal is of great significance to understand the vibration characteristics of the deflected flow near the division pier or to improve the damage of the flow deviation to the outlet conduit in the future.
In order to further explore the influence of the division pier on the hydraulic performance of the outlet conduit, this paper takes the straight outlet conduit of the axial-flow pump as the research object, uses the physical model test combined with the numerical simulation technology to analyze the influence of the division pier on the hydraulic performance of the outlet conduit and follows the steps in [24,25,26] to analyze the low-frequency signals on both sides of the division pier through the wavelet packet method. Furthermore, the energy and frequency spectrum characteristics of the pressure fluctuation signal in the outlet conduit with or without a division pier are explored, which can provide some reference for the design of the same type of outlet conduit structure. The main analysis methods and steps are shown in Figure 1.

2. Numerical Simulation Method

2.1. Model Parameter

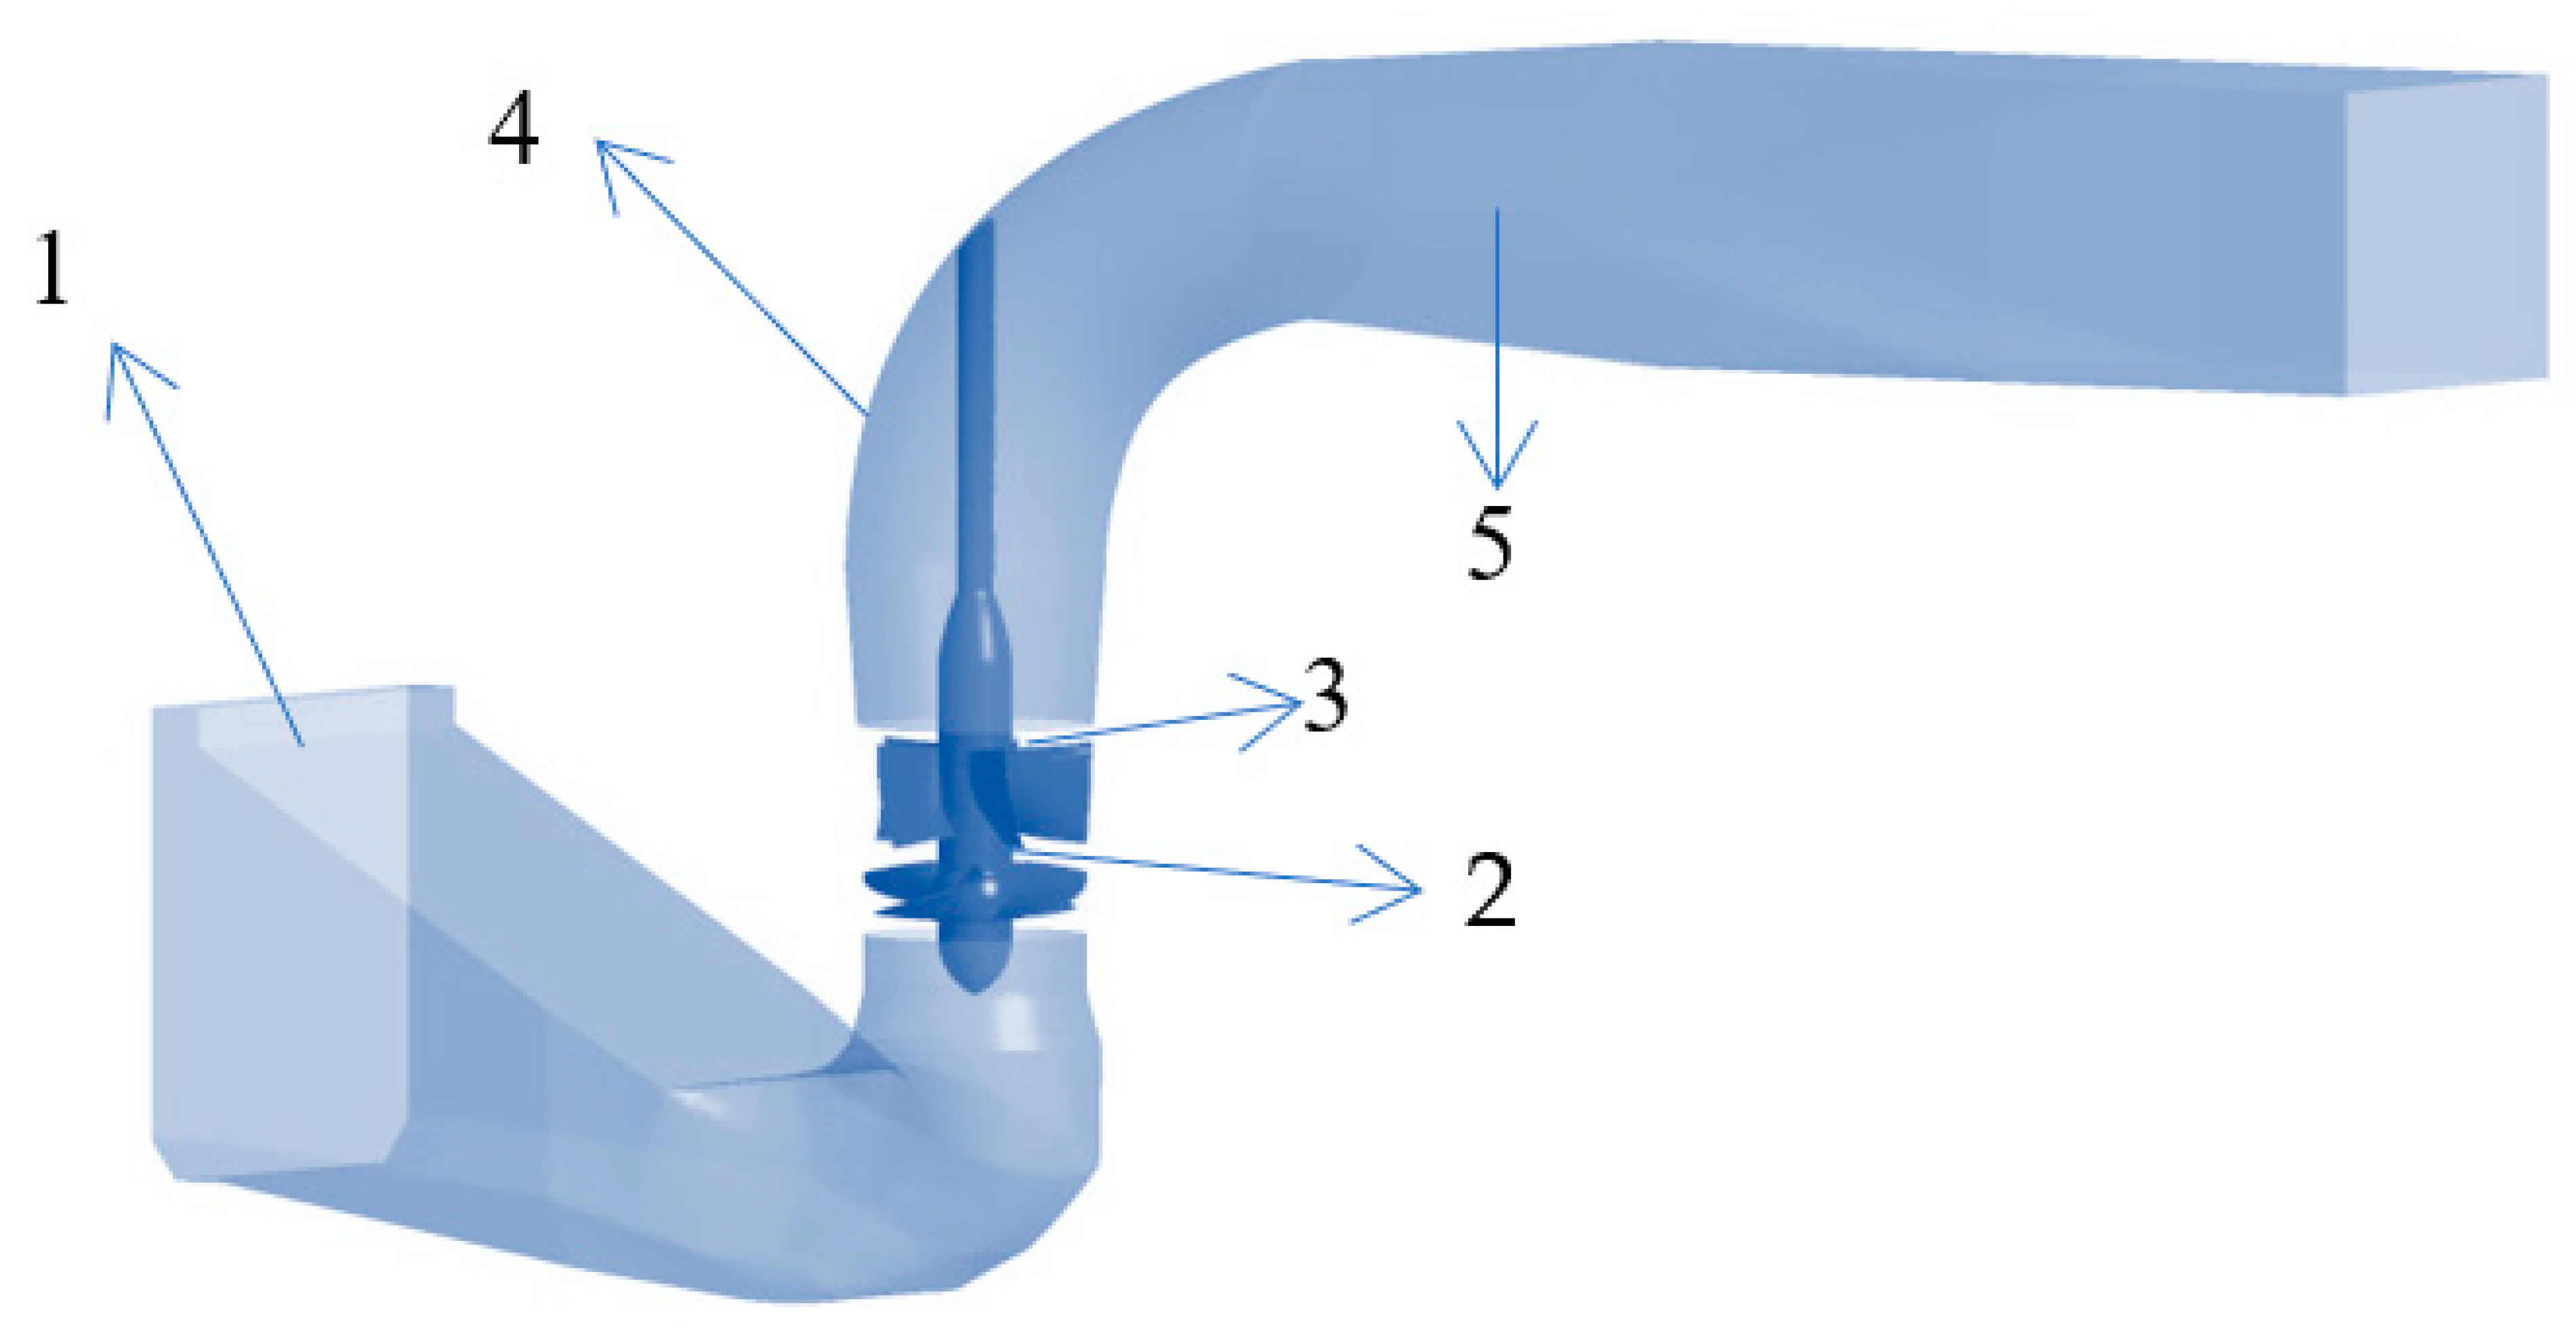
Taking the whole flow conduit of the axial-flow pump as the research object, as shown in Figure 2, the axial-flow pump device includes an elbow inlet conduit, impeller, guide vane and straight outlet conduit. The impeller diameter D is 120 mm, the hub ratio is 0.40, the number of blades is 4, the blade placement angle is 0°, the rated speed is 2200 r/min, the average blade tip clearance is 0.2 m and the number of blades in the guide vane is 5. The equivalent diffusion angle of the straight outlet conduit is 2.41°, the diameter of the inlet surface is 1.17 times that of the impeller diameter, the outlet area is 2.06 times that of the inlet area and the horizontal distance between the inlet surface of the test section and the pump shaft is 1.87 times of the impeller diameter. Figure 3a is the single line diagram of the elbow inlet conduit, Figure 3b is the single line diagram of the straight outlet conduit and D means the impeller diameter.

2.2. Grid Scheme and Boundary Conditions

2.2.1. Grid Scheme and Interface Setting

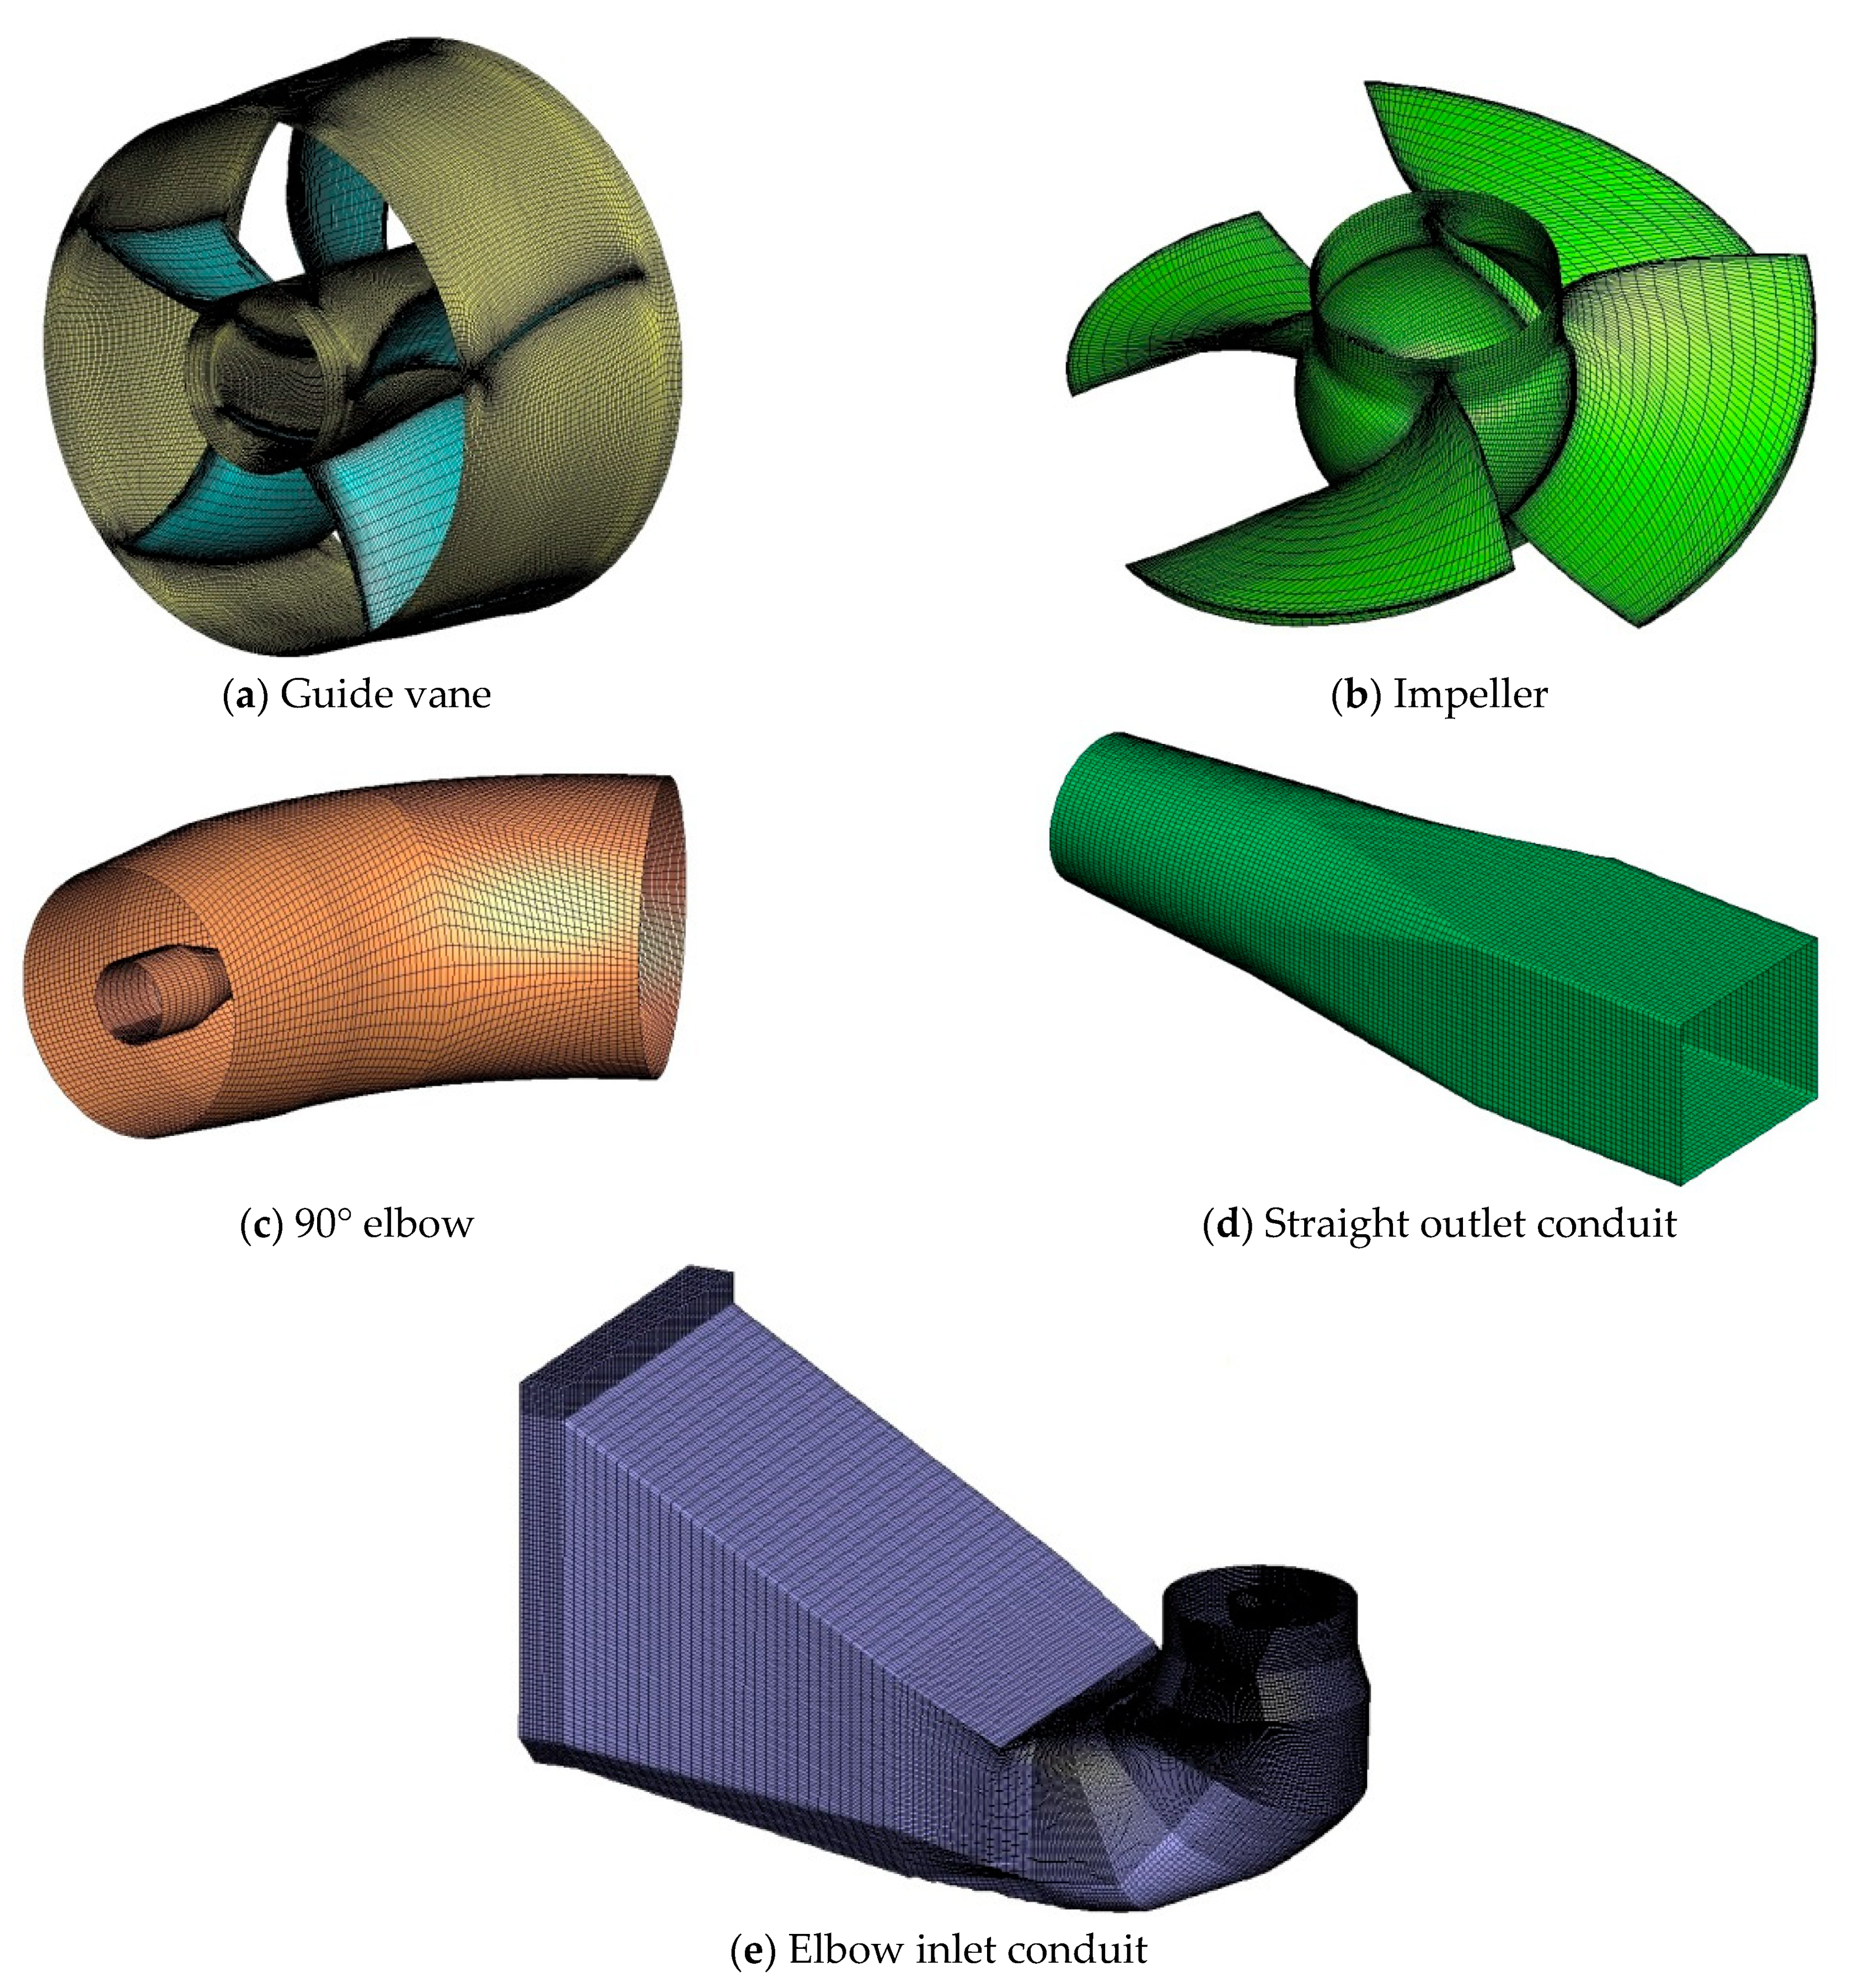
The structural grid of each flow passage component of the vertical axial-flow pump device is divided, and the grid quality of the impeller and the guide vane have an important influence on the accuracy of the numerical simulation of the internal flow of the pump device; the H/J/L-Grid topology structure is adopted for the impeller and the H-Grid topology structure is adopted for the guide vane. The grid is densified around the blade, and the wall grid of the impeller and the guide vane is shown in Figure 4. The impeller grid orthogonality angle is between 21~161°, and the guide vane grid orthogonality angle is 37~158°, meeting the requirement of a grid orthogonality angle between 15~165° [27]. The determinant 2 × 2 × 2 values of the straight outlet conduit and the 90° elbow of the axial-flow pump device are all above 0.7, which meets the requirements of a value greater than 0.4; furthermore, the angle values are all greater than 40° and the grid quality is good, which meets the calculation requirements, and the grid y+ value of each flow component of the axial-flow pump device is shown in Table 1, which meets the requirement of 30 < y+ < 500 [27].
The physical quantities between the rotating area and the static area are transferred through the interface, the dynamic and static interfaces between the elbow inlet conduit and the impeller, and the impeller and the guide vane are of the Stage type. The interfaces between the guide vane and the 90° elbow, the 90° elbow and the straight outlet conduit are of the None type.
The straight outlet conduit of the axial-flow pump device was analyzed for the independence of the number of grids, and the influence curve of the number of grids on the efficiency of the axial-flow pump device under the optimal working conditions was drawn as shown in Figure 5. It can be clearly seen that the efficiency of the axial-flow pump device in the straight outlet conduit increases with the increase in the number of grids. When the number of grids increases from 3.9 million to 5.1 million, the efficiency of the axial-flow pump device changes to be significantly less than 1%, and the efficiency of the pump device tends to stabilize after the number of grids reaches 5.1 million; therefore, a value of 5.4 million grids for the axial-flow pump device model under grid combing is selected as the final numerical calculation model.
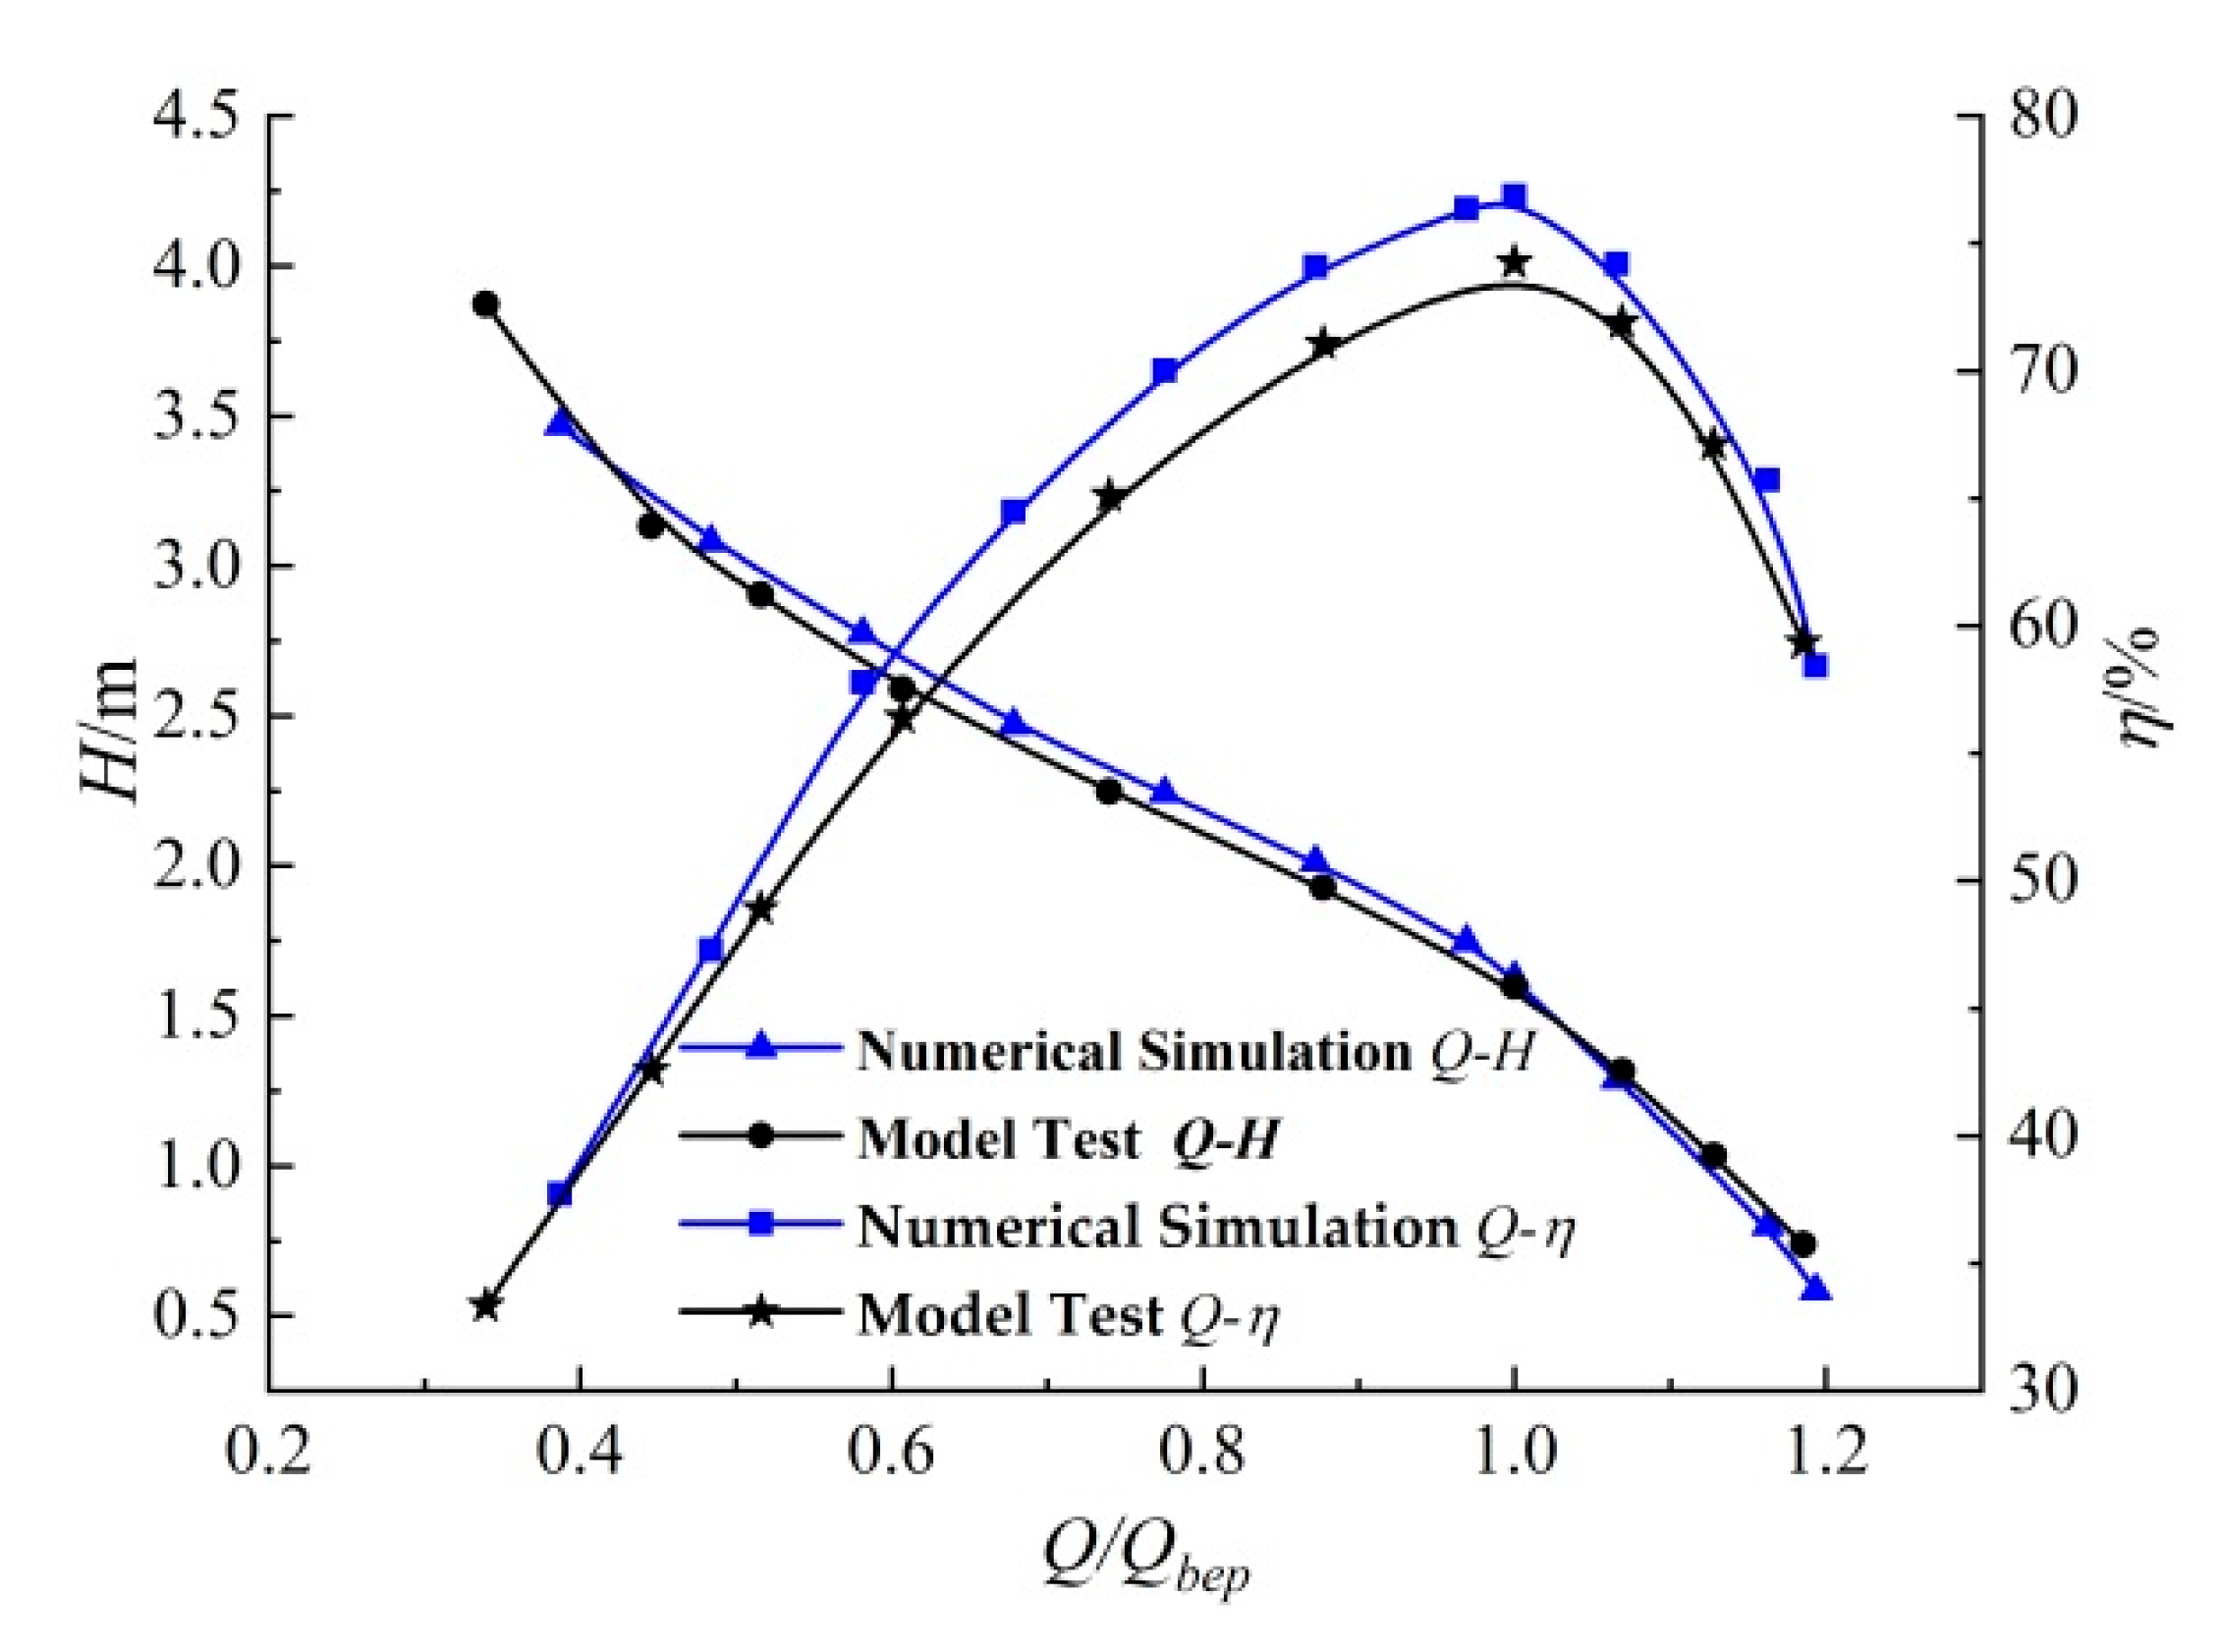
At the speed of 2200 r/min, as shown in Figure 6, the results of the model test and numerical calculation of the pump device and straight outlet conduit are compared and analyzed. Under the condition of a low flow rate, the Q~H curve of the numerical calculation is slightly higher than that of the model test; near the optimal operating point, the Q~H curve of the numerical calculation coincides with that of the model test. The results show that the Q~η curve of the numerical calculation is higher than that of the model test, the absolute error of efficiency between the numerical calculation and model test is 2.6% and the absolute error of each point is less than 3%. It can be seen that the change trend of the predicted performance curve of the pump device and straight outlet conduit is basically consistent with the experimental curve, and the curves are in good agreement; the numerical results are slightly larger than the experimental results, which is due to physical factors such as rough blade performance, so it is difficult for the numerical calculation to be completely consistent with the experimental results.

2.2.2. Boundary Conditions, Governing Equations and Turbulence Model

The inlet boundary condition of the vertical axial-flow pump is the total pressure, which is set on the inlet surface of the elbow inlet conduit; the total pressure is set at 1 atm. The numerical simulation results of the flow field in the axial-flow pump are not sensitive to the selection of the inlet turbulent kinetic energy parameters, so the medium turbulence intensity Tu = 5% is used on the inlet surface of the elbow inlet conduit; the outlet boundary condition is mass flow, which is set on the outlet surface of the outlet extension of the straight outlet conduit. In the near wall region, the retractable wall function is used, and each solid wall is set as a non-slip boundary condition without considering the influence of wall roughness; the convergence accuracy is set as 1.0 × 10⁻⁵.
Based on the Reynolds time average equation Navier–Stokes (RANS) and the RNG k-ε turbulence model, the vertical axial-flow pump was numerically solved. The RNG k-ε turbulence model modified the turbulent viscosity and considered the rotation and rotation in the average flow; furthermore, the turbulence model can better deal with flow with a high strain rate and a large curvature of the streamline. The RNG k-ε turbulence model was verified in [28,29,30] and can well simulate the internal flow field of the pump and the pump device. The fluid in the pump device can be approximately considered as an incompressible three-dimensional viscous turbulence, and the fluid motion follows the laws of mass conservation, momentum conservation and energy conservation; the fluid is liquid water at room temperature, and the heat exchange between the fluids is not considered.
The continuity equation can be simplified as [28]
u i x i = 0
with the momentum equation [28]
( ρ u i ) t + x j ( ρ u i u j ) = p x i + x j ( μ ( u i x j + u j x i ) ) + F i
where ρ is the density of fluid, ui and uj are the components of the fluid velocity along i and j directions, respectively, xi is the coordinate component, t is time, p is the pressure on the fluid micro element body, μ is the kinematic viscosity coefficient of the fluid and Fi is the volume force component along direction i.
The RNG k-ε model takes into account the influence of a high strain rate or large curvature flow surface so as to improve the accuracy of the model in the case of a swirling flow and large curvature. The RNG k-ε model is used to simulate the axial-flow pump, and the governing equations of the RNG k-ε model are as follows:
( ρ k ) t + ( ρ ku i ) ( x i ) = x j [ α k μ e f f k x j ] + μ t ( u i x j + u j x i ) u i x j ρ ε ( ρ ε ) t + ( ρ ε u i ) ( x i ) = x j [ α ε μ e f f ε x j ] + C 1 ε k μ t ( u i x j + u j x i ) u i x j C 2 ε ρ ε 2 K R
where μ e f f   = μ + μ t , μ t   = ρ C μ k 2 ε , C μ = 0.0845 , α k   = α ε = 1.39 , C 1 ε = 1.39 , C 2 ε   = 1.68 , R   = C μ ρ η 3 ( 1 η / η 0 ) 1 + β η 3 , η = ( 2 E i j · E i j ) 1 2 k ε , E i j = 1 2 ( u i x j + u j x i ) , η 0 = 4.377 and β = 0.012 .
Because the fluid movement is obviously affected by the wall flow conditions, the flow Reynolds number in the near wall area is low and the turbulence development is not sufficient, it is necessary to treat the near wall flow of the solid wall of the pump device as a function; the tangential velocity of the water near the wall and the wall shear force can be obtained through the pairwise expression [28]
u + = 1 k l n ( y + ) + C u + = u u τ = ρ u τ y μ y + = ρ Δ y u τ μ u τ = ( τ w ρ ) 1 2
where y + is the dimensionless distance, τ w is the wall shear stress, u is the velocity tangent to the wall, Δ y is the actual distance from the wall, k is the Von Karman constant and C is the constant related to the wall roughness (C = 5.2).

3. Test Equipment and Analysis Method

3.1. Test Equipment

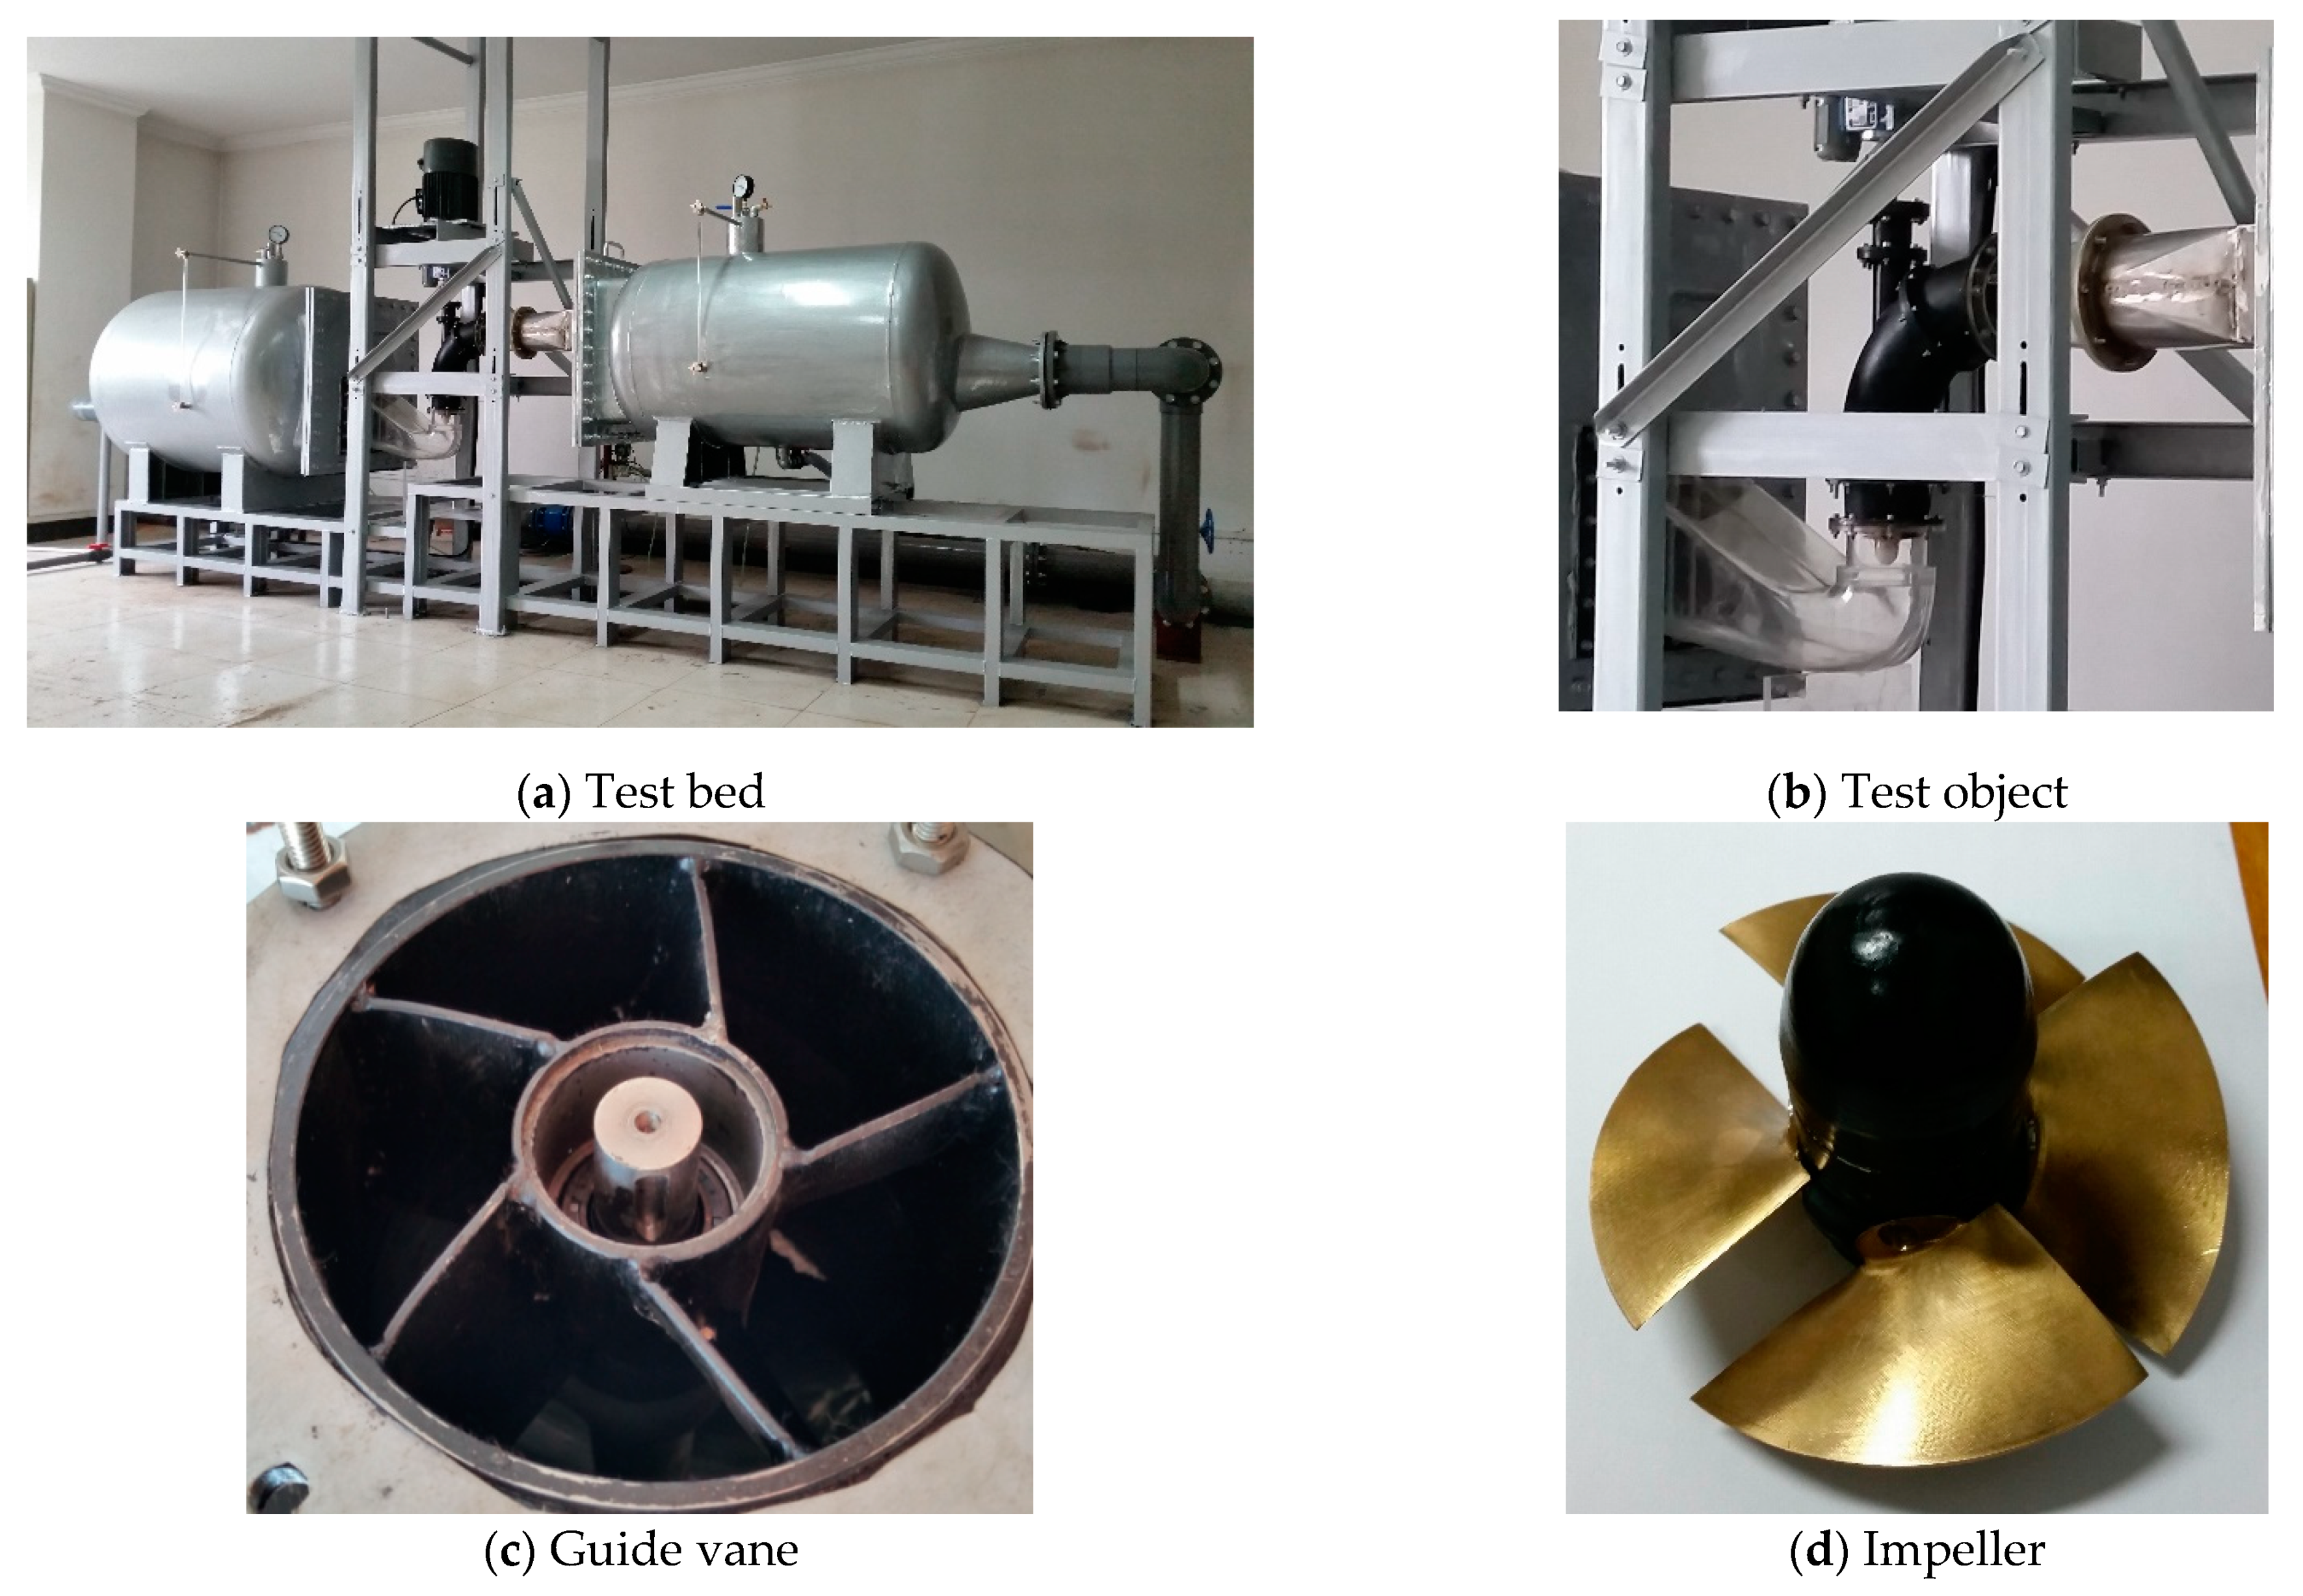
The pulsation test and analysis of the straight outlet conduit of the axial-flow pump device with or without a division pier were carried out. The pulsation test of the straight outlet conduit was tested on the Φ120 hydraulic mechanical closed-loop test bench, as shown in Figure 7. The physical model of the axial-flow pump device includes four parts: an elbow inlet conduit, an impeller, a guide vane and a straight outlet conduit. The impeller model is ZM55, the nominal diameter of the impeller is 120 mm, the hub ratio is 0.40, the number of blades is 4, the blade placement angle is 0°, the average blade tip clearance is 0.2 mm, the number of blades of the guide vane is 5 and the rated speed is 2200 r/min. The unilateral equivalent diffusion angle of the straight outlet conduit is 2.41°, the inlet diameter is 1.17 times the nominal diameter of the impeller, the outlet area is 2.06 times that of the inlet area and the horizontal distance between the inlet face of the test section and the pump shaft is 1.87 times the nominal diameter of the impeller. The impeller is made of brass material, the guide vane is made of stainless-steel metal material and the elbow inlet conduit and the straight outlet conduit are made of transparent organic glass. The flow measurement used the LDG-125S-92 electromagnetic flowmeter produced by Shanghai Smooth Instrument Co., Ltd. (Shanghai, China), the head measurement used the EJA intelligent differential pressure transmitter and the torque and speed were measured by the JCO type 0.1 speed torque sensor. The CY302 high precision digital pressure sensor produced by Chengdu ShengYing measurement and Control Co., Ltd. (Chengdu, China) was used in the pressure fluctuation characteristic test, the pressure sensor probe size was Φ5 mm, the sampling rate was 1000 times/s, the accuracy was 0.1% and the test range was 0–30 kPa. The output terminals of each sensor were connected to the Powerlink JW-3 display. The synchronous collection of the data of the four pressure sensors was realized through the 485 hub and the data collection software, and the water and air temperature during the laboratory experiment were kept unchanged, respectively.

3.2. Total Uncertainty Analysis

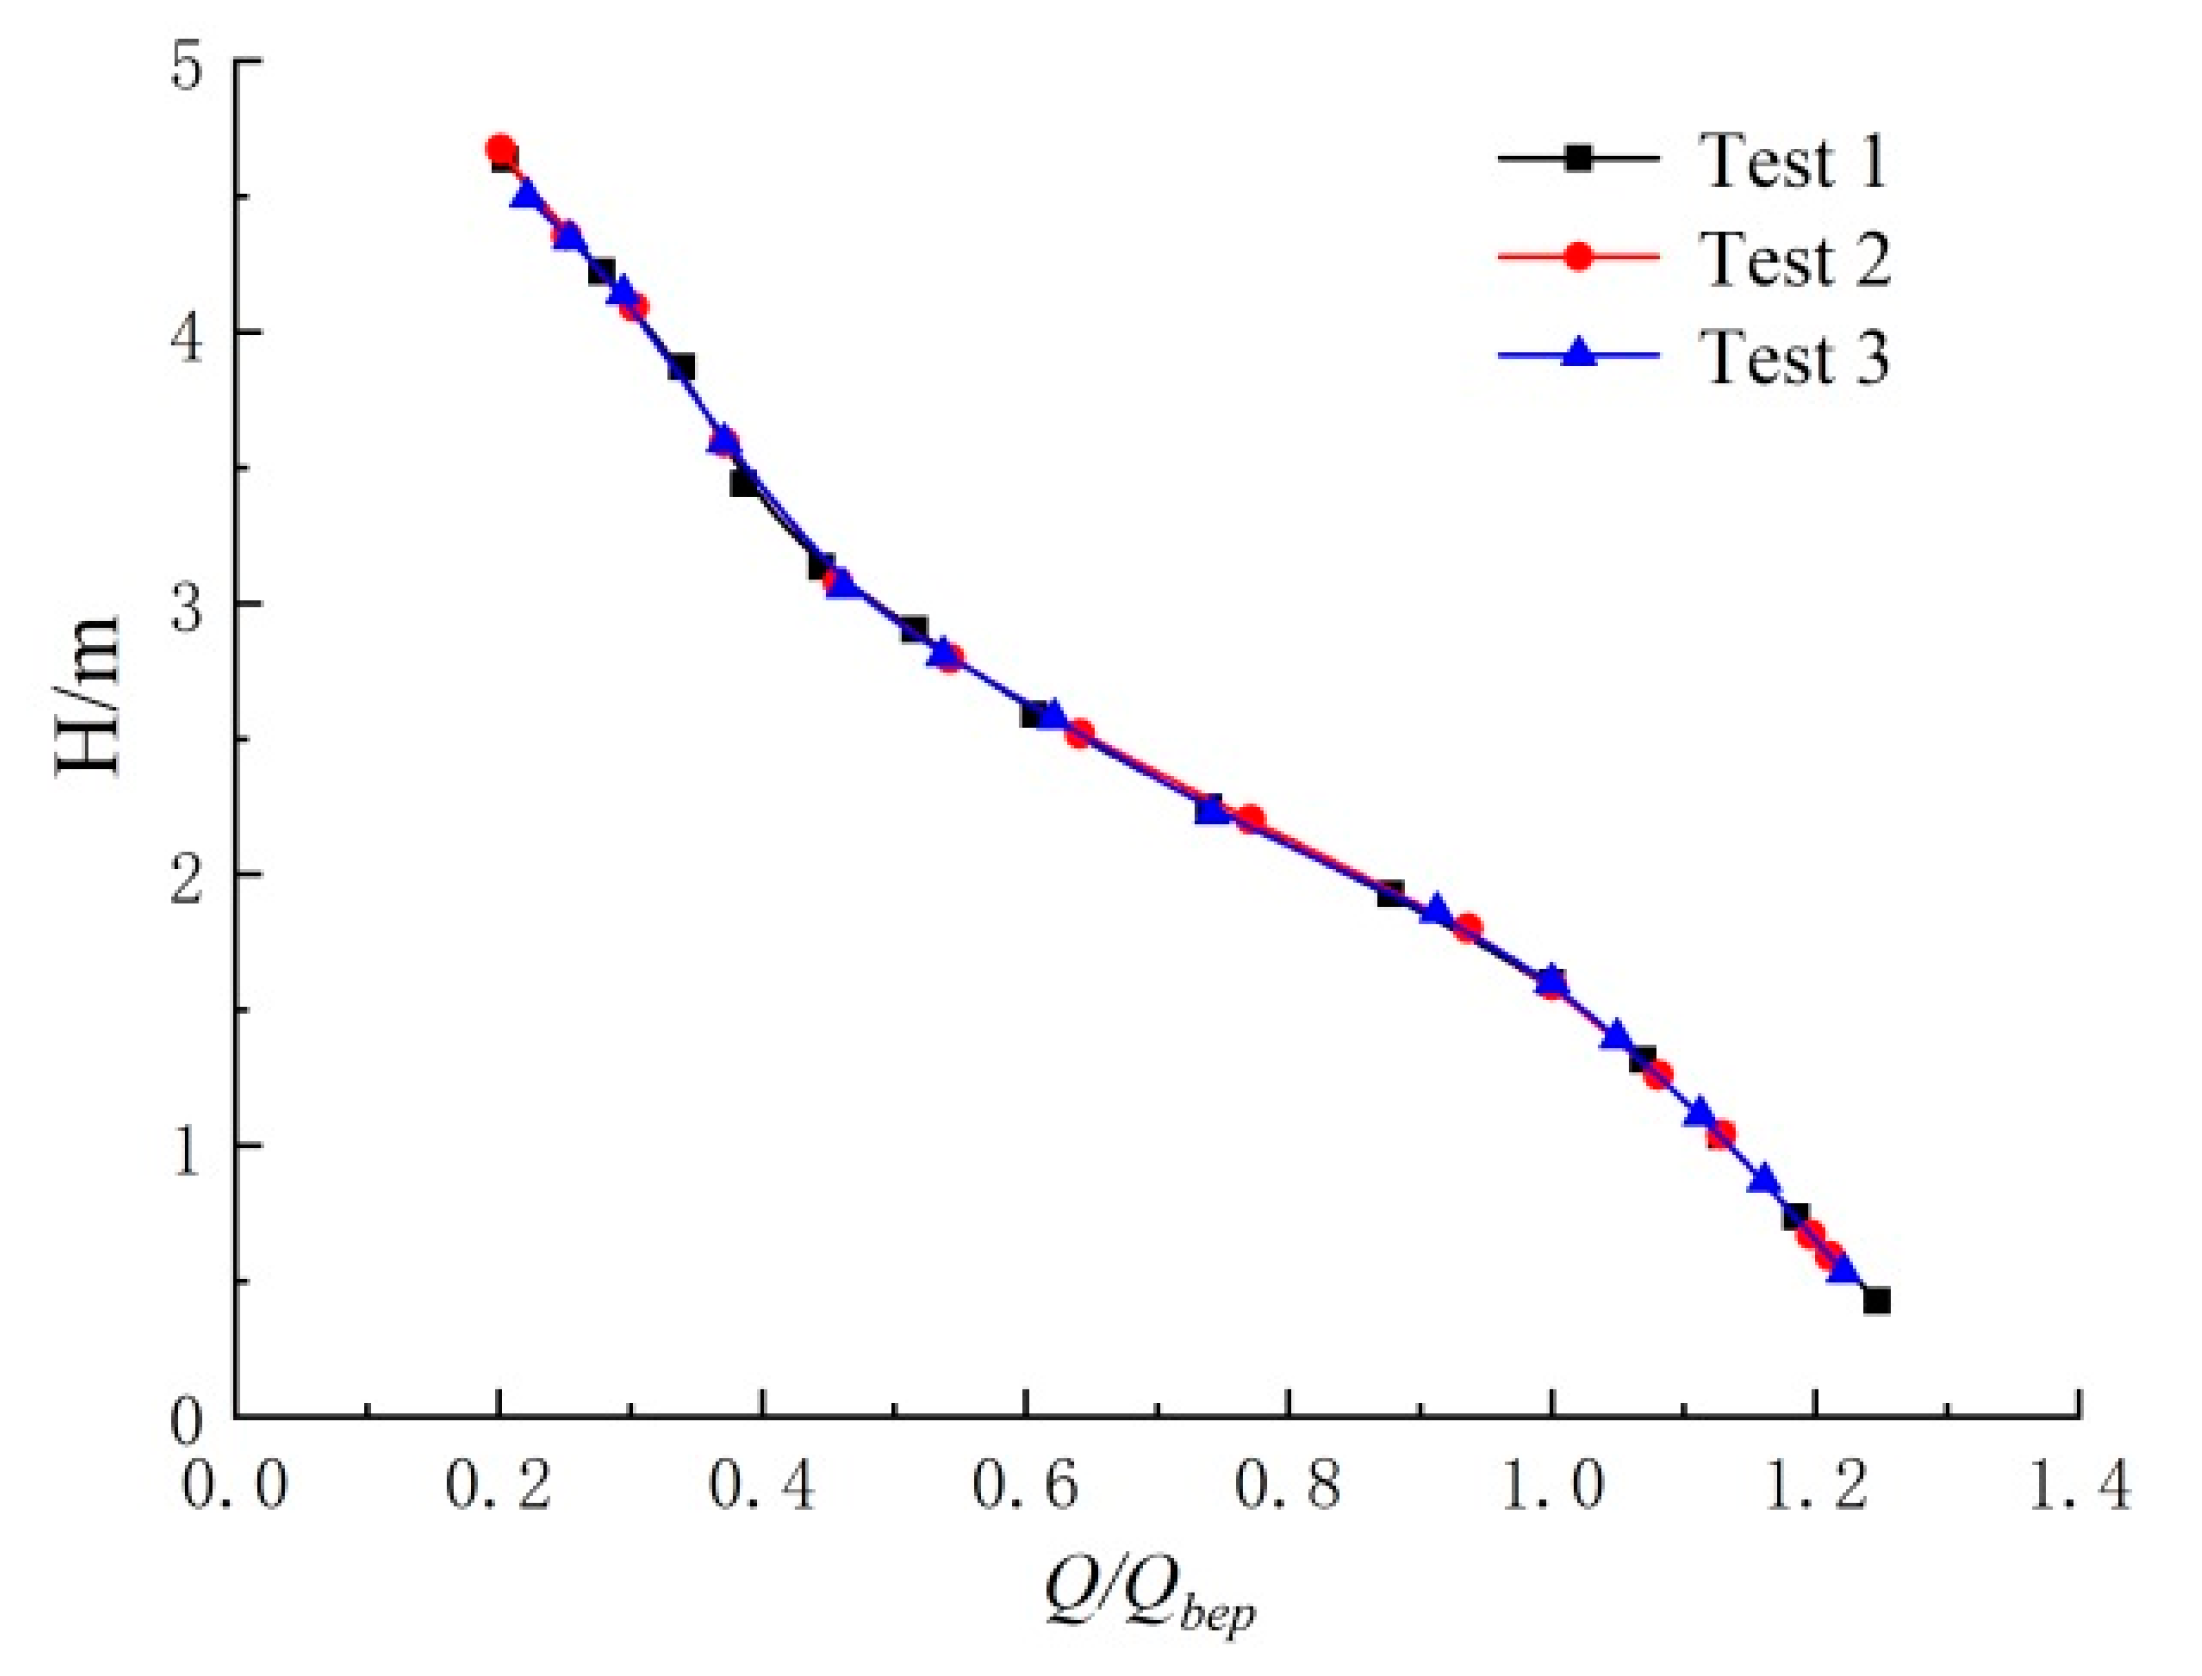
To verify the reliability of the test bed and the test method of the axial-flow pump device under the same test method and operating conditions, the repeatability test of the energy performance of the pump device with a straight outlet conduit at a speed of 2200 r/min was carried out, and the test results are shown in Figure 8. Obviously, when the rotational speed was 2200 r/min, the external characteristic trend of the axial-flow pump with a straight outlet conduit was completely consistent in the three tests, and the data results under similar working conditions were very close, indicating the stability of the test bed and the reliability of the test results.
The comprehensive uncertainty of the axial-flow pump was analyzed, and the calculation results were better than the requirements of the standard of the Code of Practice for a Model Pump and Its Installation Acceptance Tests (SL140-2006) for the comprehensive uncertainty of efficiency:
E η , s = ± E Q 2 + E H 2 + E N 2 + E M 2 = ± 0.173 %
E η = ± E η , s 2 + E η , r 2 = ± ( 0.173 % ) 2 + ( 0.162 % ) 2 = ± 0.237 %  
where Eη is the comprehensive uncertainty of the test bed, Eη,s is the total system uncertainty of the test bed, Eη,r is the random uncertainty of the test bed, EQ is the systematic error of flow measurement and the full range measurement error is ±0.1%, EH is the systematic error of head measurement and the full range measurement error is ±0.01%. EM is the systematic error of torque measurement and the full range measurement error is ±0.1%. EN is the system error of speed measurement and the full range measurement error is ±0.1%.

3.3. Measurement and Analysis of Pressure Fluctuation

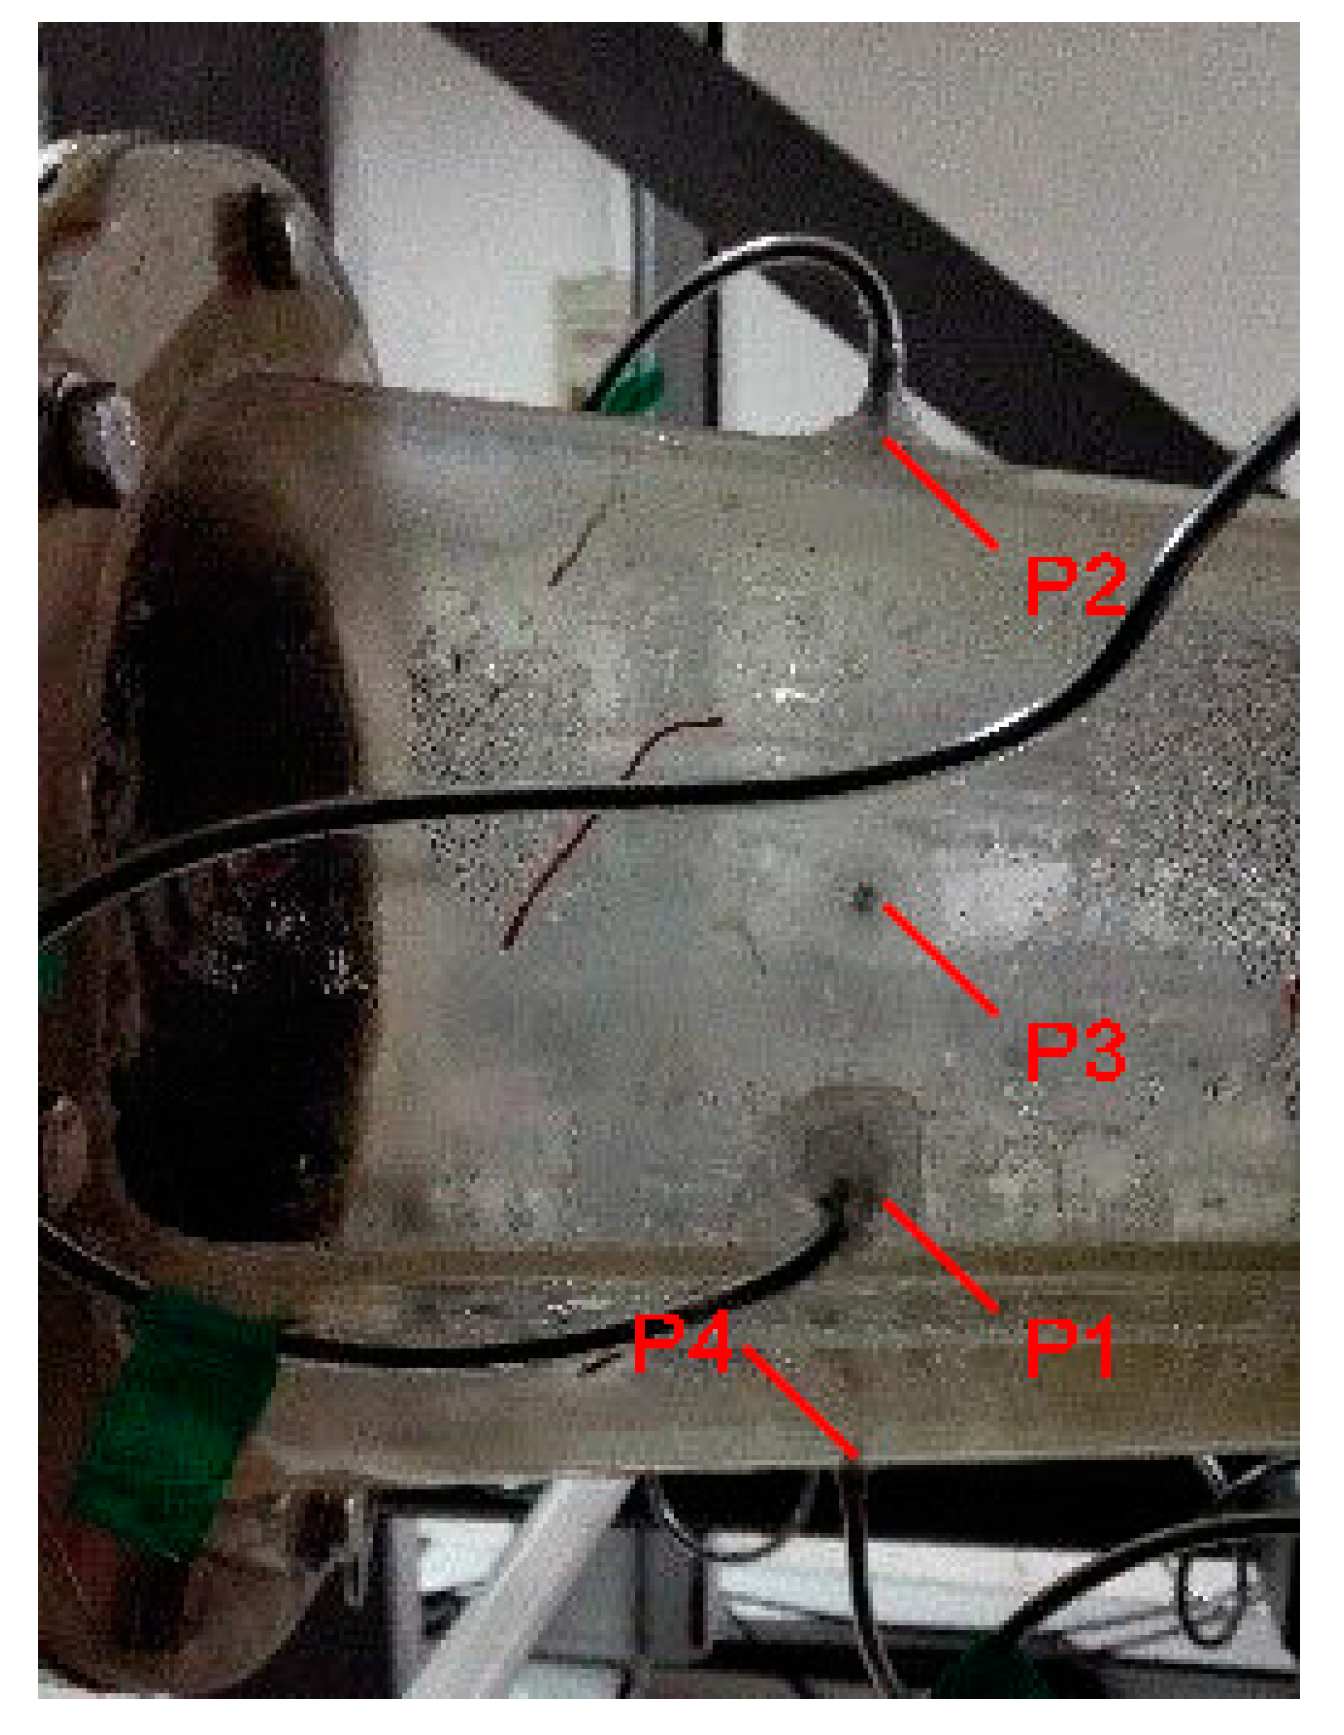
As shown in Figure 9, the pressure pulsation characteristics of a straight outlet conduit without a division pier were tested; four CY302 high-precision digital pressure sensors were set on the wall of a straight outlet conduit, which were distributed in the vertical and horizontal directions of the straight outlet conduit. The angle of the two adjacent pressure sensors was 90°, and the pressure pulsation test was conducted at the impeller speed of 2200 r/min.
Generally, a Fourier transform is used to analyze pressure fluctuation signals, which has the disadvantages of being non-stationary, of short duration and with time domain and frequency domain localization. The wavelet packet method is a more detailed decomposition and reconstruction method of signals based on wavelet analysis; the high and low-frequency parts are decomposed by high and low-pass filters, respectively, and wavelet packet decomposition can adaptively select the corresponding frequency band according to the signal characteristics and analysis requirements and match with the signal spectrum. The sampling frequency of the pressure fluctuation test is fs = 1000 Hz; according to the Nyquist sampling theorem, the highest analysis frequency is f = fs/2 = 500 Hz, which is divided into 16 sub bands. The frequency bandwidth of each wavelet packet is d = f/24 = 31.25 Hz, and the wavelet packet energy spectrum analysis uses the mother wavelet to decompose the signal to a specified number of layers and then solve the energy of each node decomposition coefficient. The solution steps and corresponding calculation formula are described in [30,31,32], and the four-level decomposition tree of the pulsating wavelet packet of each measuring point in a straight outlet conduit is shown in Figure 10.

4. Results and Discussion

4.1. Flow Field Analysis of Straight Outlet Conduit

To explore the influence of a division pier on the hydraulic performance of the straight outlet conduit, according to the idea in [18], three kinds of division pier design schemes were designed as shown in Figure 11, which were all placed at the inlet of the conduit and continuously extended to the inside of the conduit, to analyze the flow characteristics of a straight outlet conduit with different lengths of division pier. The length of the division pier in design scheme 1 was the length of the round pipe section of the straight outlet conduit, the length of the division pier in design scheme 2 was extended to half of the round square diffusion section of the straight outlet conduit based on design scheme 1, and the length of the division pier in design scheme 3 was the diffusion section of the straight outlet conduit.
The three-dimensional numerical simulation of the straight outlet conduit under the three schemes was carried out, and the three-dimensional streamline diagram of the straight outlet conduit under the three kinds of division pier length under the optimal working condition was drawn. It can be seen from Figure 12 that the streamline at the starting position of the division pier under the three schemes was relatively smooth, but there was a large range of unstable flow on both sides of the middle and rear position of the division pier; the unstable flow gradually improved with the increase of the division pier length. This is because the main flow in the straight outlet conduit changed direction after passing through the 90° elbow; under the action of circulation and flow inertia, the main flow deviated to the upper left side of the division pier, and there was a low-speed zone below the path.
Table 2 shows the flow distribution on both sides of the division pier under the three schemes; when there was no division pier, the hydraulic loss of straight outlet conduit was 0.027 m under the optimal condition. It can be seen from Table 2 that the hydraulic loss of the straight outlet conduit was increased by adding the division pier; with the increase of the length of the division pier, the hydraulic loss gradually decreased, and in the process from scheme 1 to scheme 3, the hydraulic loss decreased by 7.4% compared with that in scheme 1. The main flow deviations of the three division piers with the same starting position but different lengths to the straight outlet conduit were concentrated on the left side, and the flow distribution ratios were 1.46, 1.45 and 1.48, respectively. It can be seen that the main flow deviation in the straight outlet conduit was mainly concentrated on the left side of the division pier, and there was only a small difference between the left and right sides of the division pier with the same starting position but different lengths. Combined with the previous research results, the division pier mainly caused the flow to deviate to the left side of the division pier, and the length of the division pier extending backward had an impact on the hydraulic loss of the straight outlet conduit, but the different lengths of the division pier had little impact on the flow distribution on the left and right sides of the straight outlet conduit.

4.2. Analysis of Static Pressure and Velocity

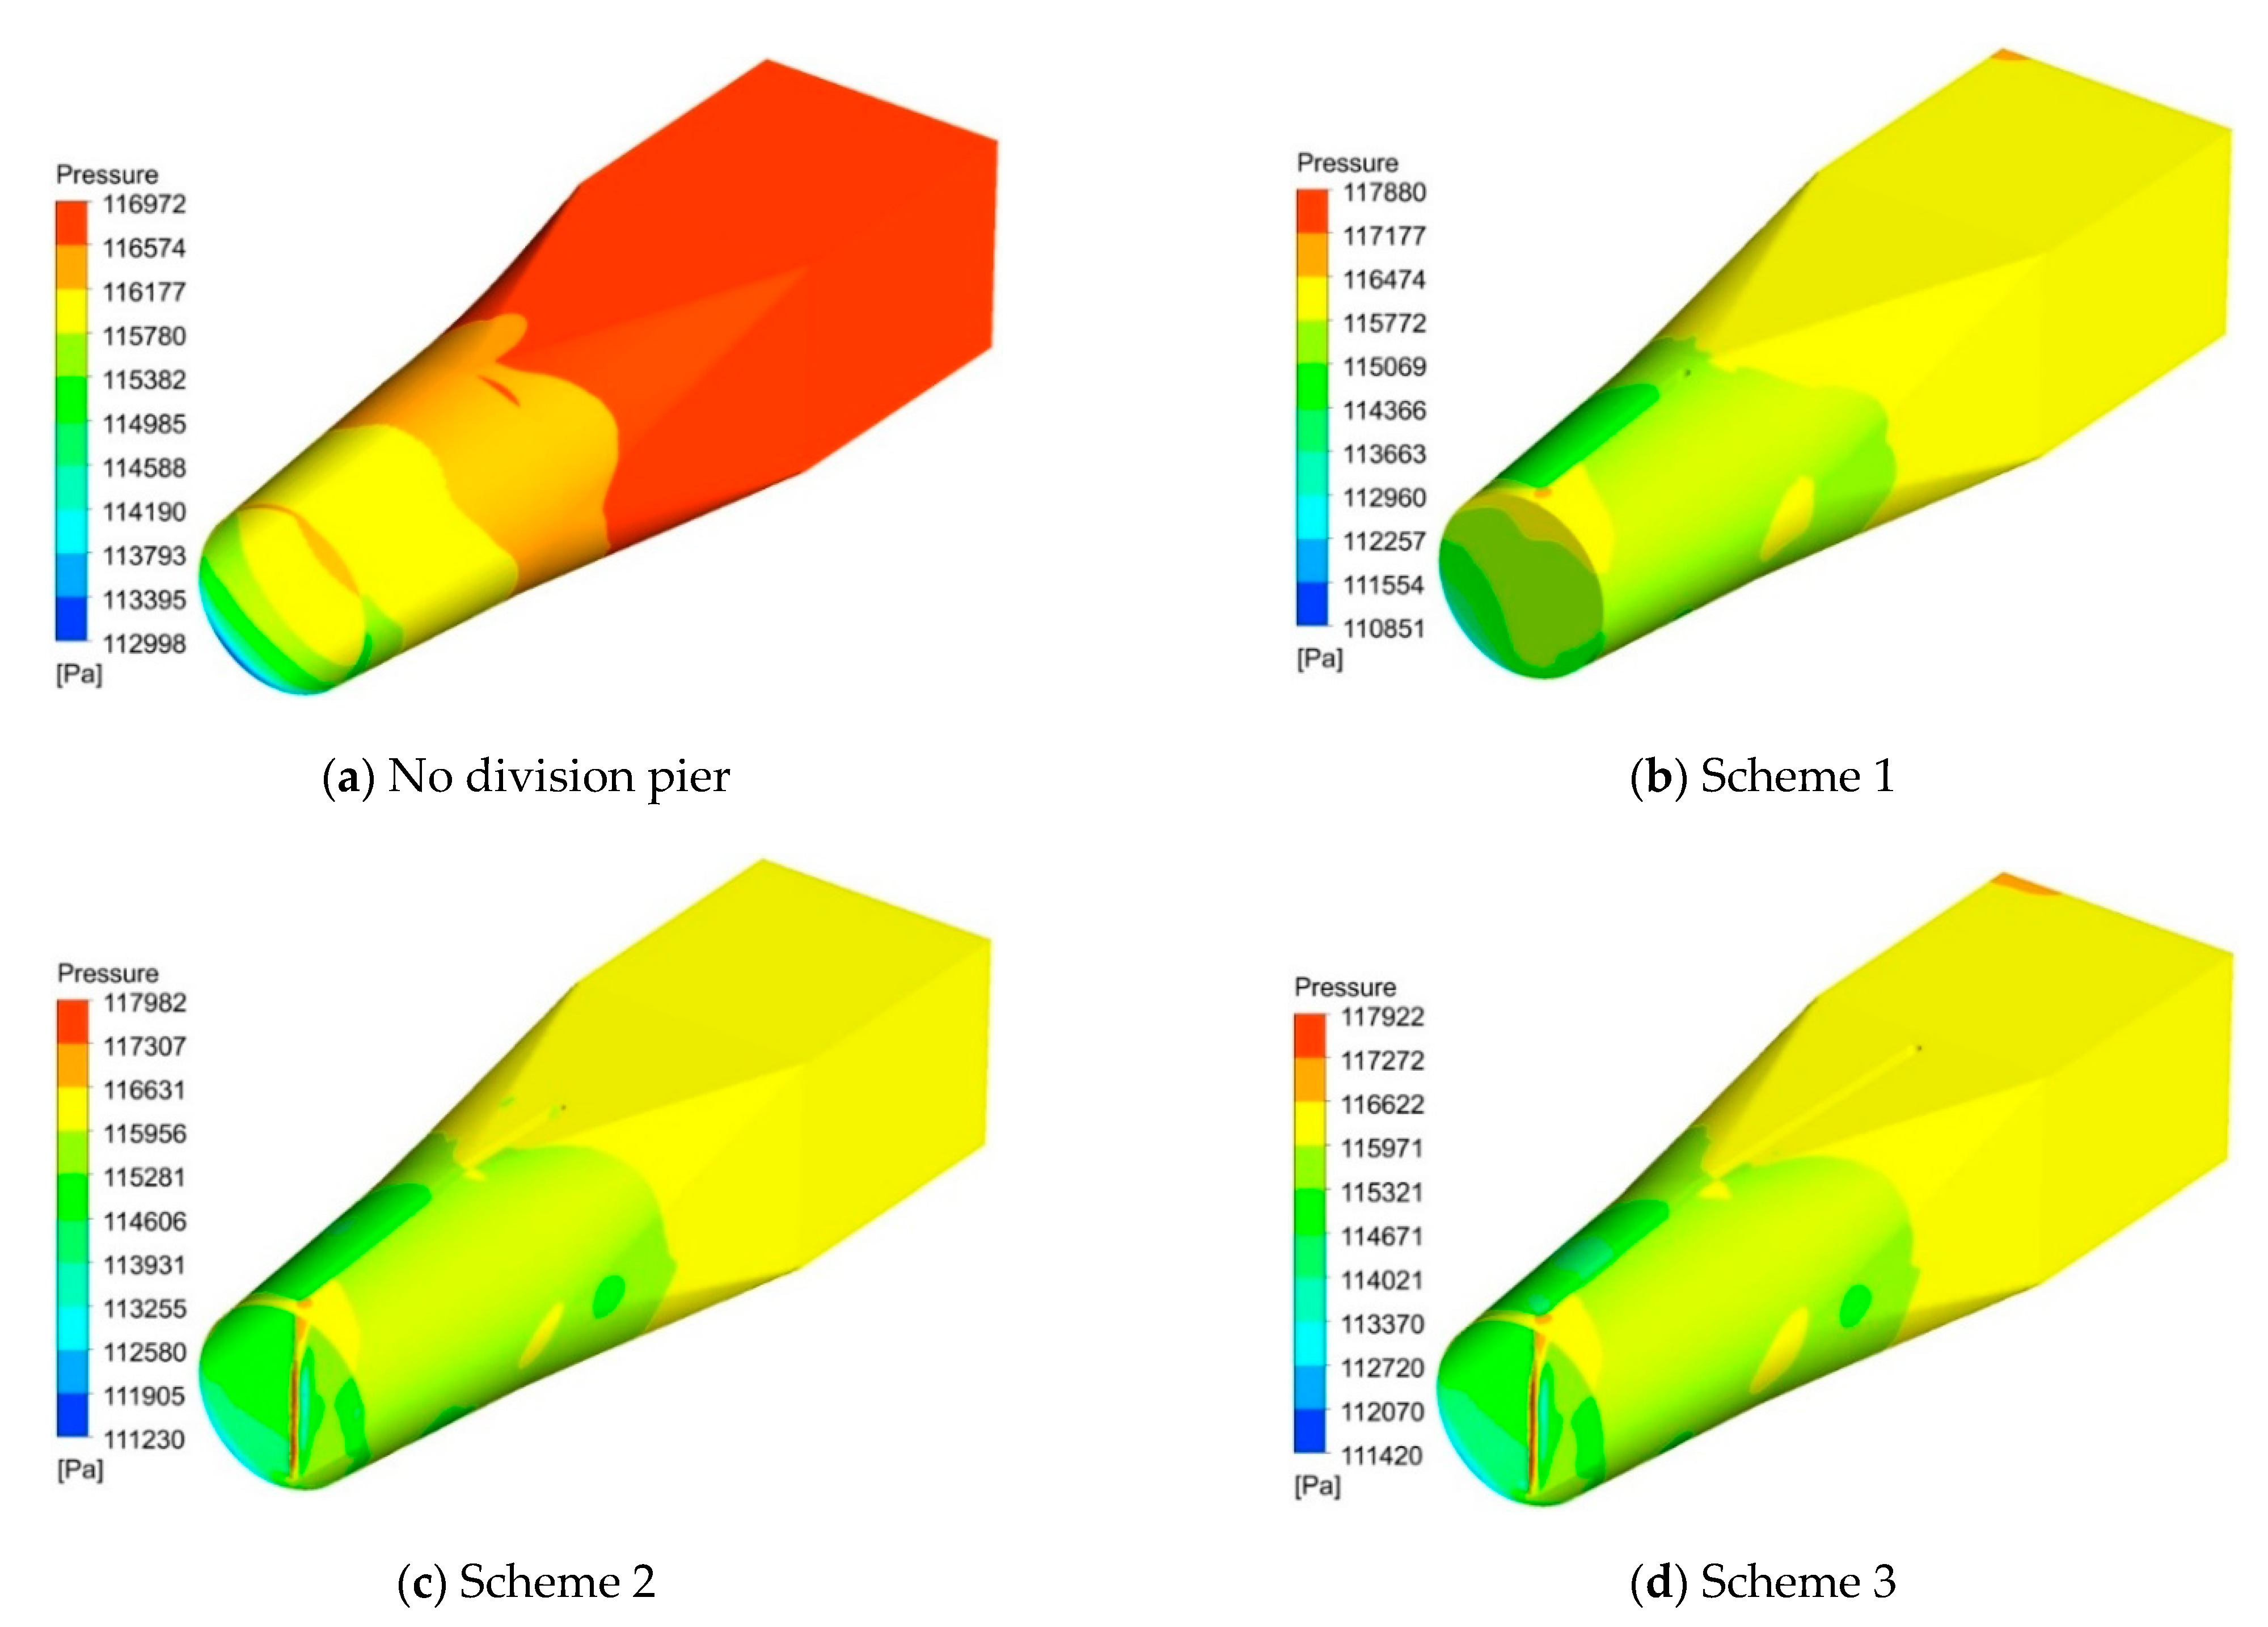
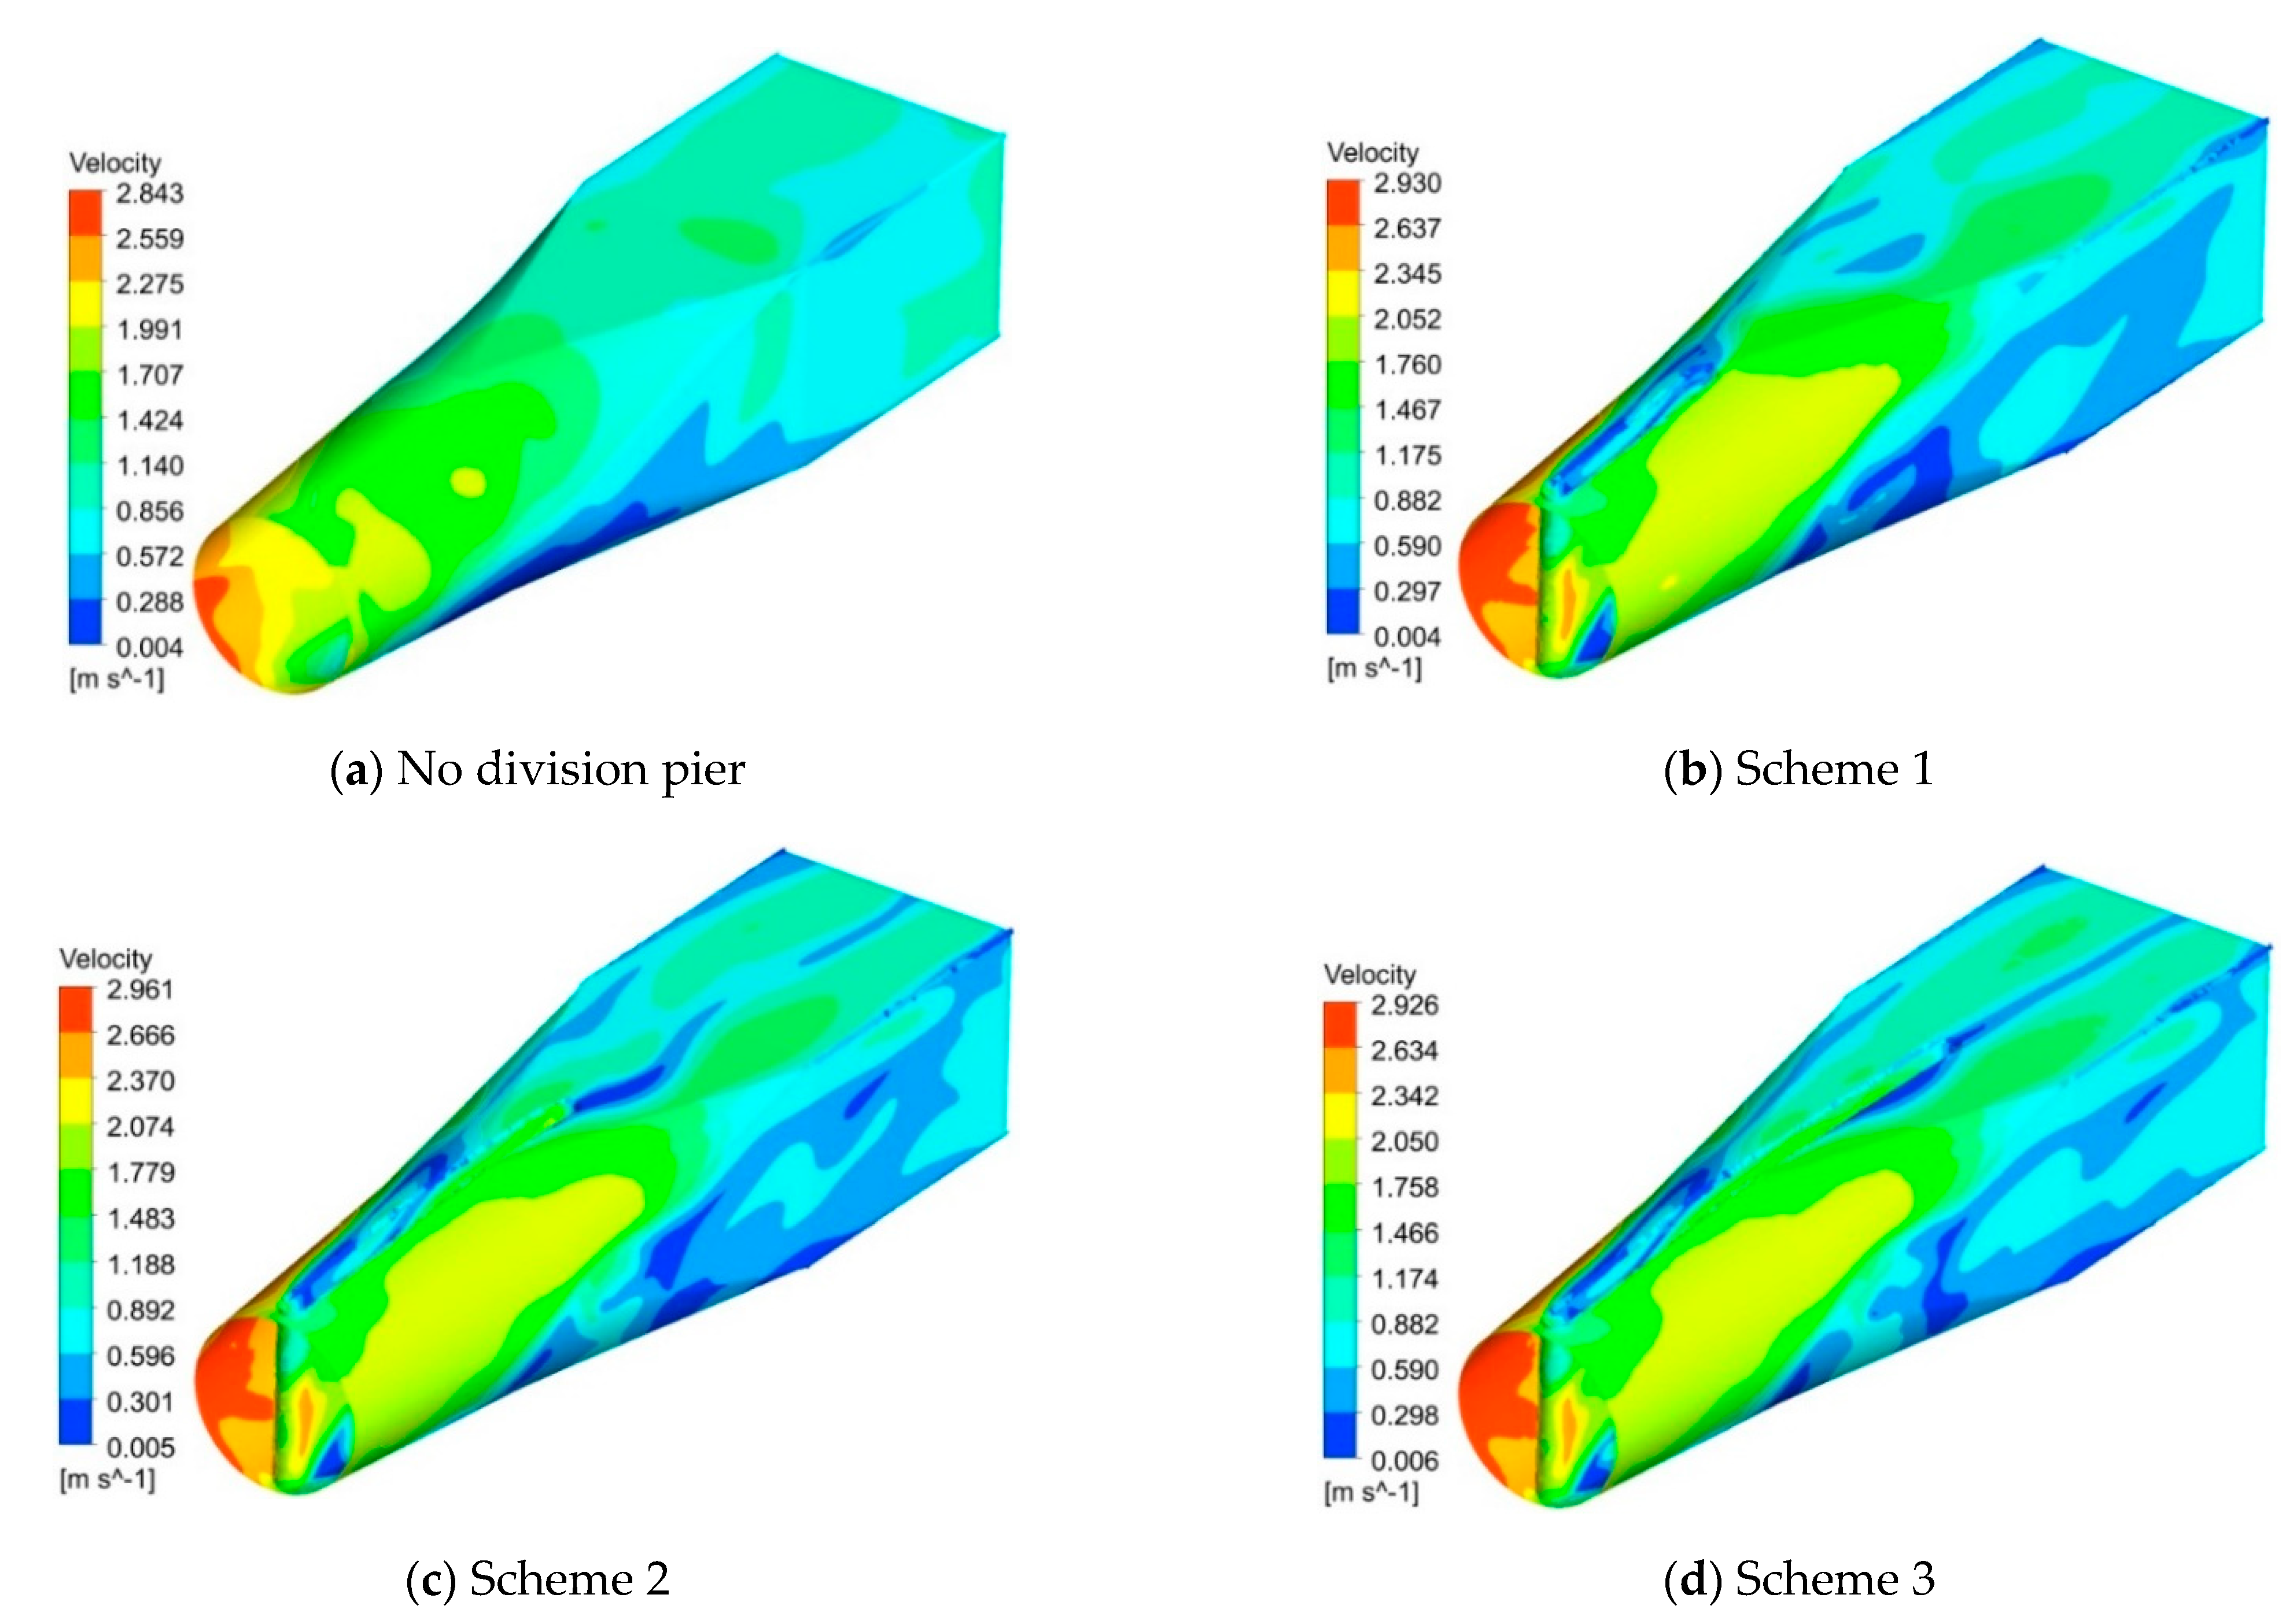
To analyze the influence of different division pier lengths on the pressure and velocity distribution near the wall of the straight outlet conduit, three design schemes and a straight outlet conduit without a division pier were analyzed; the pressure distribution and velocity nephogram as shown in Figure 13 and Figure 14 were then drawn.
It can be seen from Figure 13 that the pressure near the wall of the straight outlet conduit increased gradually along the flow direction when the division pier was not set, there was a large high-pressure area in the circular square diffusion section and the straight pipe section of the conduit, and the pressure near the wall of the straight outlet conduit without the division pier was evenly distributed. From scheme 1 to scheme 3, the pressure near the wall in the straight outlet conduit of the division pier with different lengths decreased as a whole, and the pressure increased gradually along the flow direction. The flow was affected by the division pier, and there was an obvious deviation phenomenon on the left side of the division pier; from scheme 1 to scheme 3, it can be seen that a certain low-pressure area formed on the left side of the division pier, indicating that the near-wall pressure on the left and right sides of the division pier was easily affected by the division pier in the straight outlet conduit, resulting in uneven pressure distribution. From scheme 1 to scheme 3, there was a small high-pressure area near the wall at the starting position of the division pier, which was due to the diversion effect on the flow at the starting position of the division pier, resulting in the disorder of the local streamline; for the flow deviation, there may have been a small range of vortices at the deviant position, resulting in the increase of the pressure near the wall at the starting position of the division pier. However, there was no high-pressure area in the round to square diffusion section and straight pipe section, according to Figure 12; the flow pattern here was good and the vortex could not easily create a high-pressure area. The results show that the pressure near the wall of the straight outlet conduit decreased as a whole and the stress condition of the straight outlet conduit improved, but the division pier with different lengths had no obvious effect on the pressure distribution near the wall of the straight outlet conduit.
Figure 14 shows the velocity distribution of the straight outlet conduit without a division pier and three design schemes. It can be seen from Figure 14 that the velocity of the straight outlet conduit decreased from the flow direction as a whole due to the effect of the residual circulation and inertia of the flow at the outlet of the guide vane. When there was no division pier, there was a wide low-velocity zone at the bottom of the straight outlet conduit, and the velocity increased gradually from the bottom to the top. From scheme 1 to scheme 3, a large high-speed zone appeared on the left side of the starting position of the division pier due to the influence of the division pier; after adding the division pier, the near-wall velocity at the top and bottom of the division pier decreased. Compared with the case without the division pier, a large low-speed zone appeared at the top of the straight outlet conduit with the division pier, and the low-speed zone at the bottom became larger. Generally speaking, the division pier had a great influence on the near-wall velocity of the straight outlet conduit, leading to an overall decrease of the near-wall velocity along the flow direction; however, a large high-speed zone formed on the left side of the initial position of the division pier, which was one of the reasons for the main flow to the left side of the division pier, but there was no obvious difference in the near-wall velocity distribution of the straight outlet conduit with different lengths of the division pier.
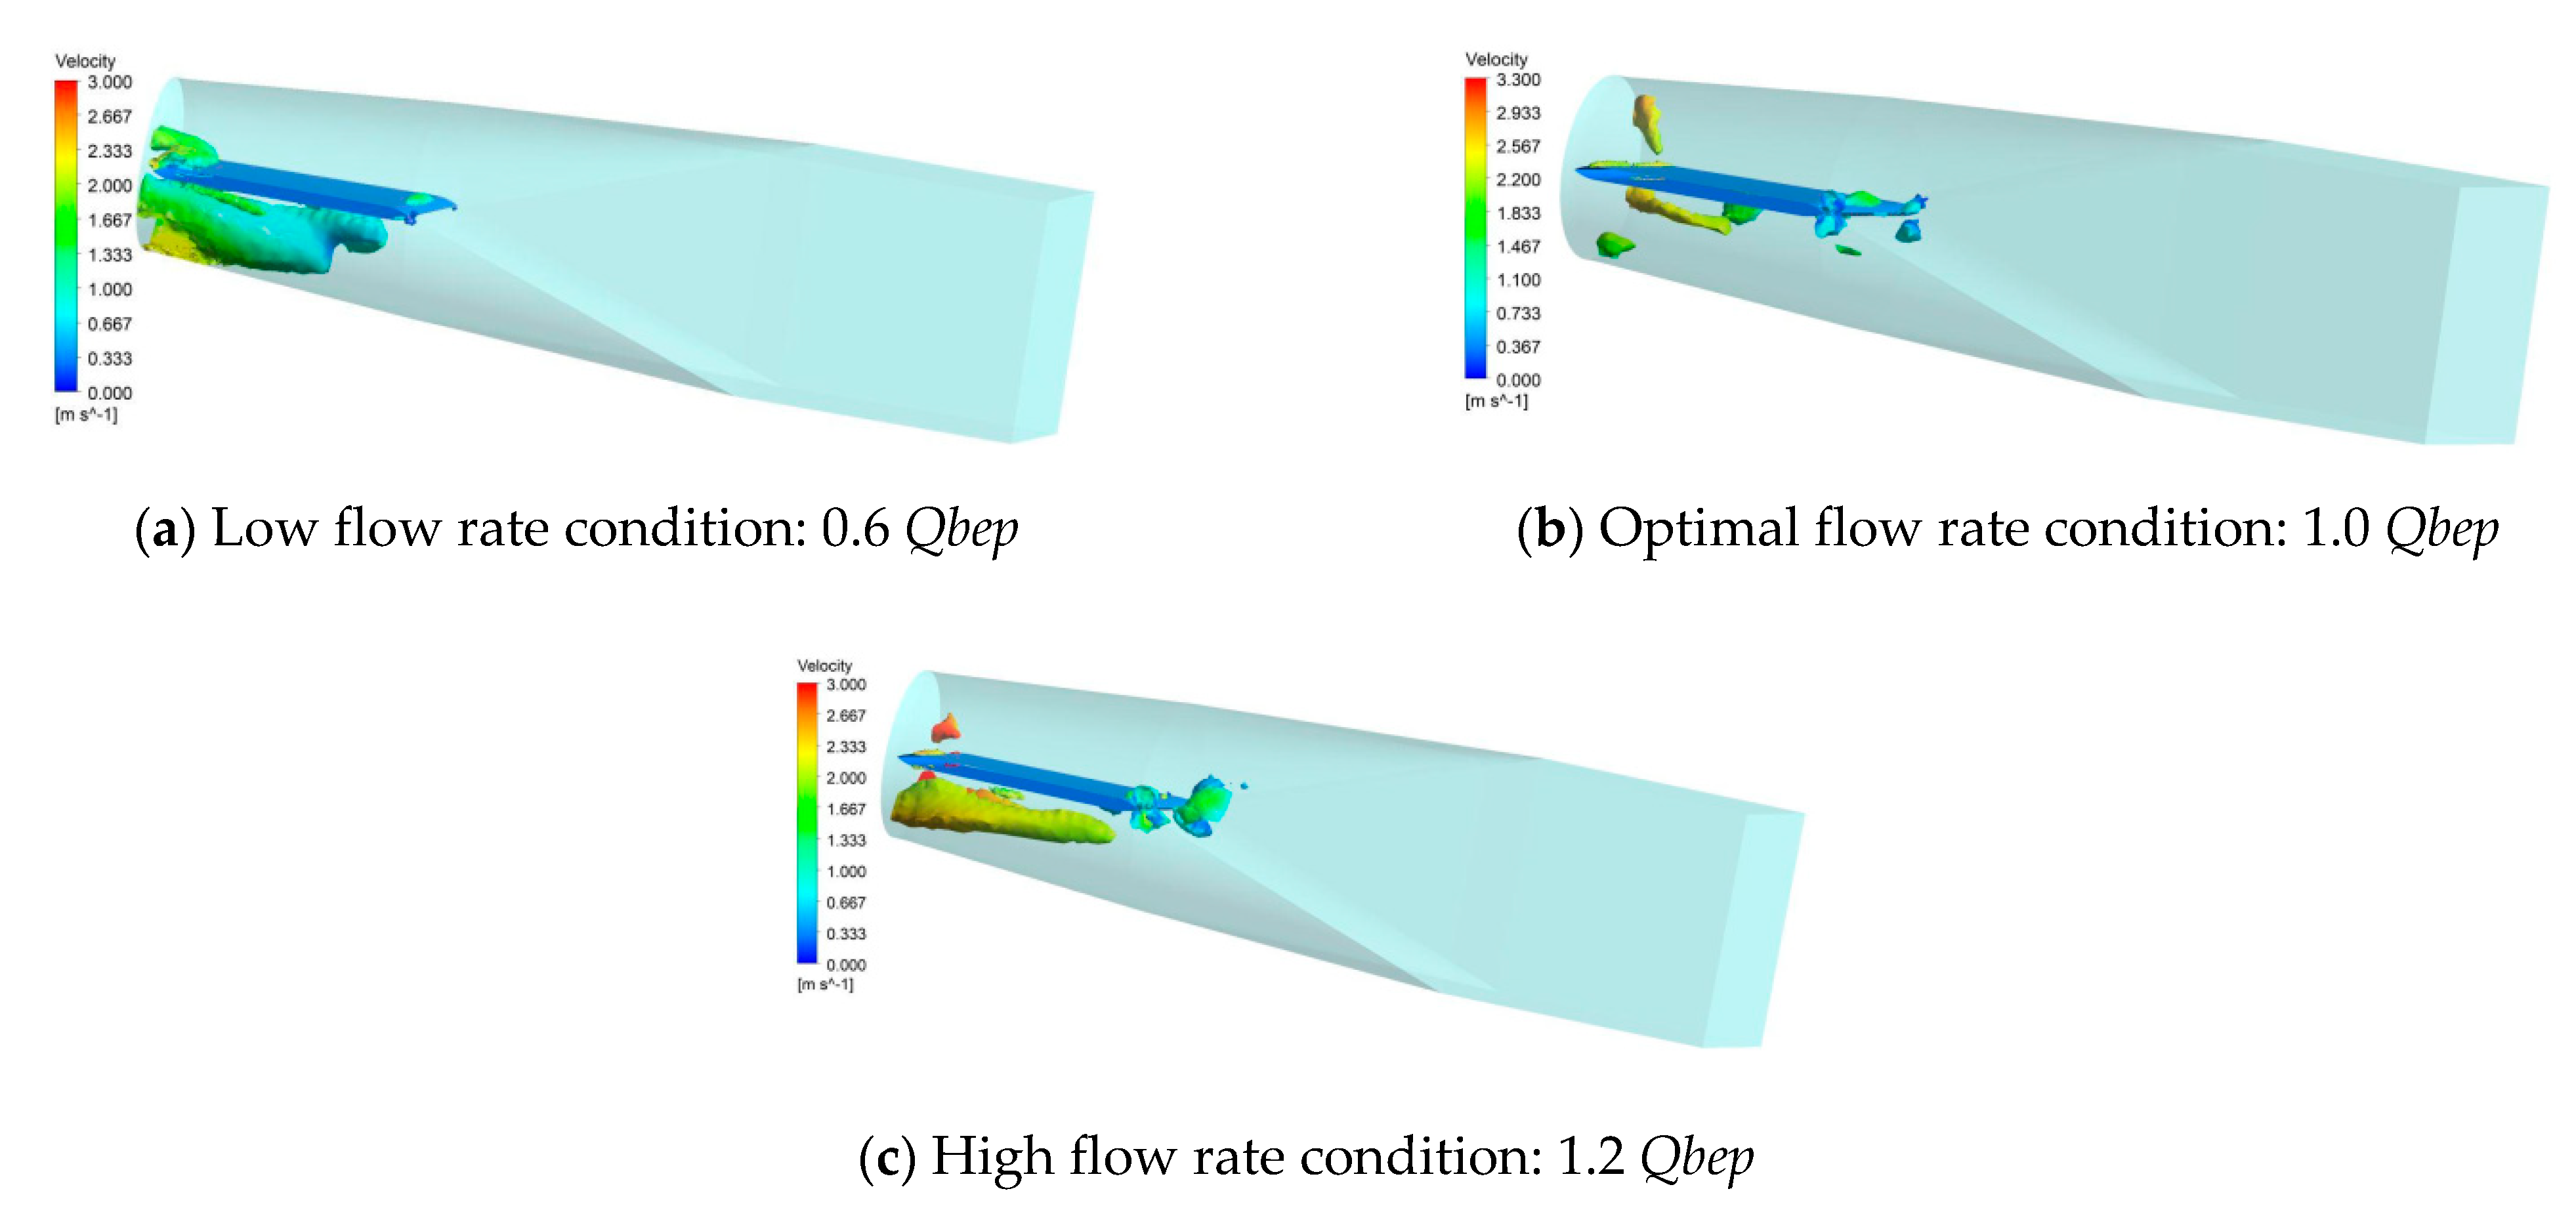
To further analyze the influence of the division pier on the internal vortex structure of outlet conduit, referring to the identification method of the vortex structure in [33,34,35], we used the Q criterion to analyze the internal vortex structure of the straight outlet conduit in scheme 1; when the threshold value Q = 300 s−2, the internal vortex structures of the straight outlet conduit under three different flow conditions are shown in Figure 15.
When the threshold value Q = 300 s−2, along the flow direction, vortex structures with different sizes appeared on the right side of the division pier: under the condition of a low flow rate, there was a large vortex structure on the right side of the division pier; under the optimal flow rate condition, the size of the vortex structure on the right side of the division pier decreased greatly; and under the condition of a large flow rate, the vortex structure on the right side of the division pier became larger, but the range was smaller than that under the condition of a low flow rate condition. Under the three flow rate conditions, there was a small vortex structure on the left side and the end of the division pier, and the range of the vortex structure was little affected by the flow rate condition, indicating that the division pier in the outlet conduit only affected the vortex structure on the right side of the division pier but had little effect on the vortex structure on the left side of the division pier.

4.3. Analysis Results of Pressure Fluctuation Signal without Division Pier

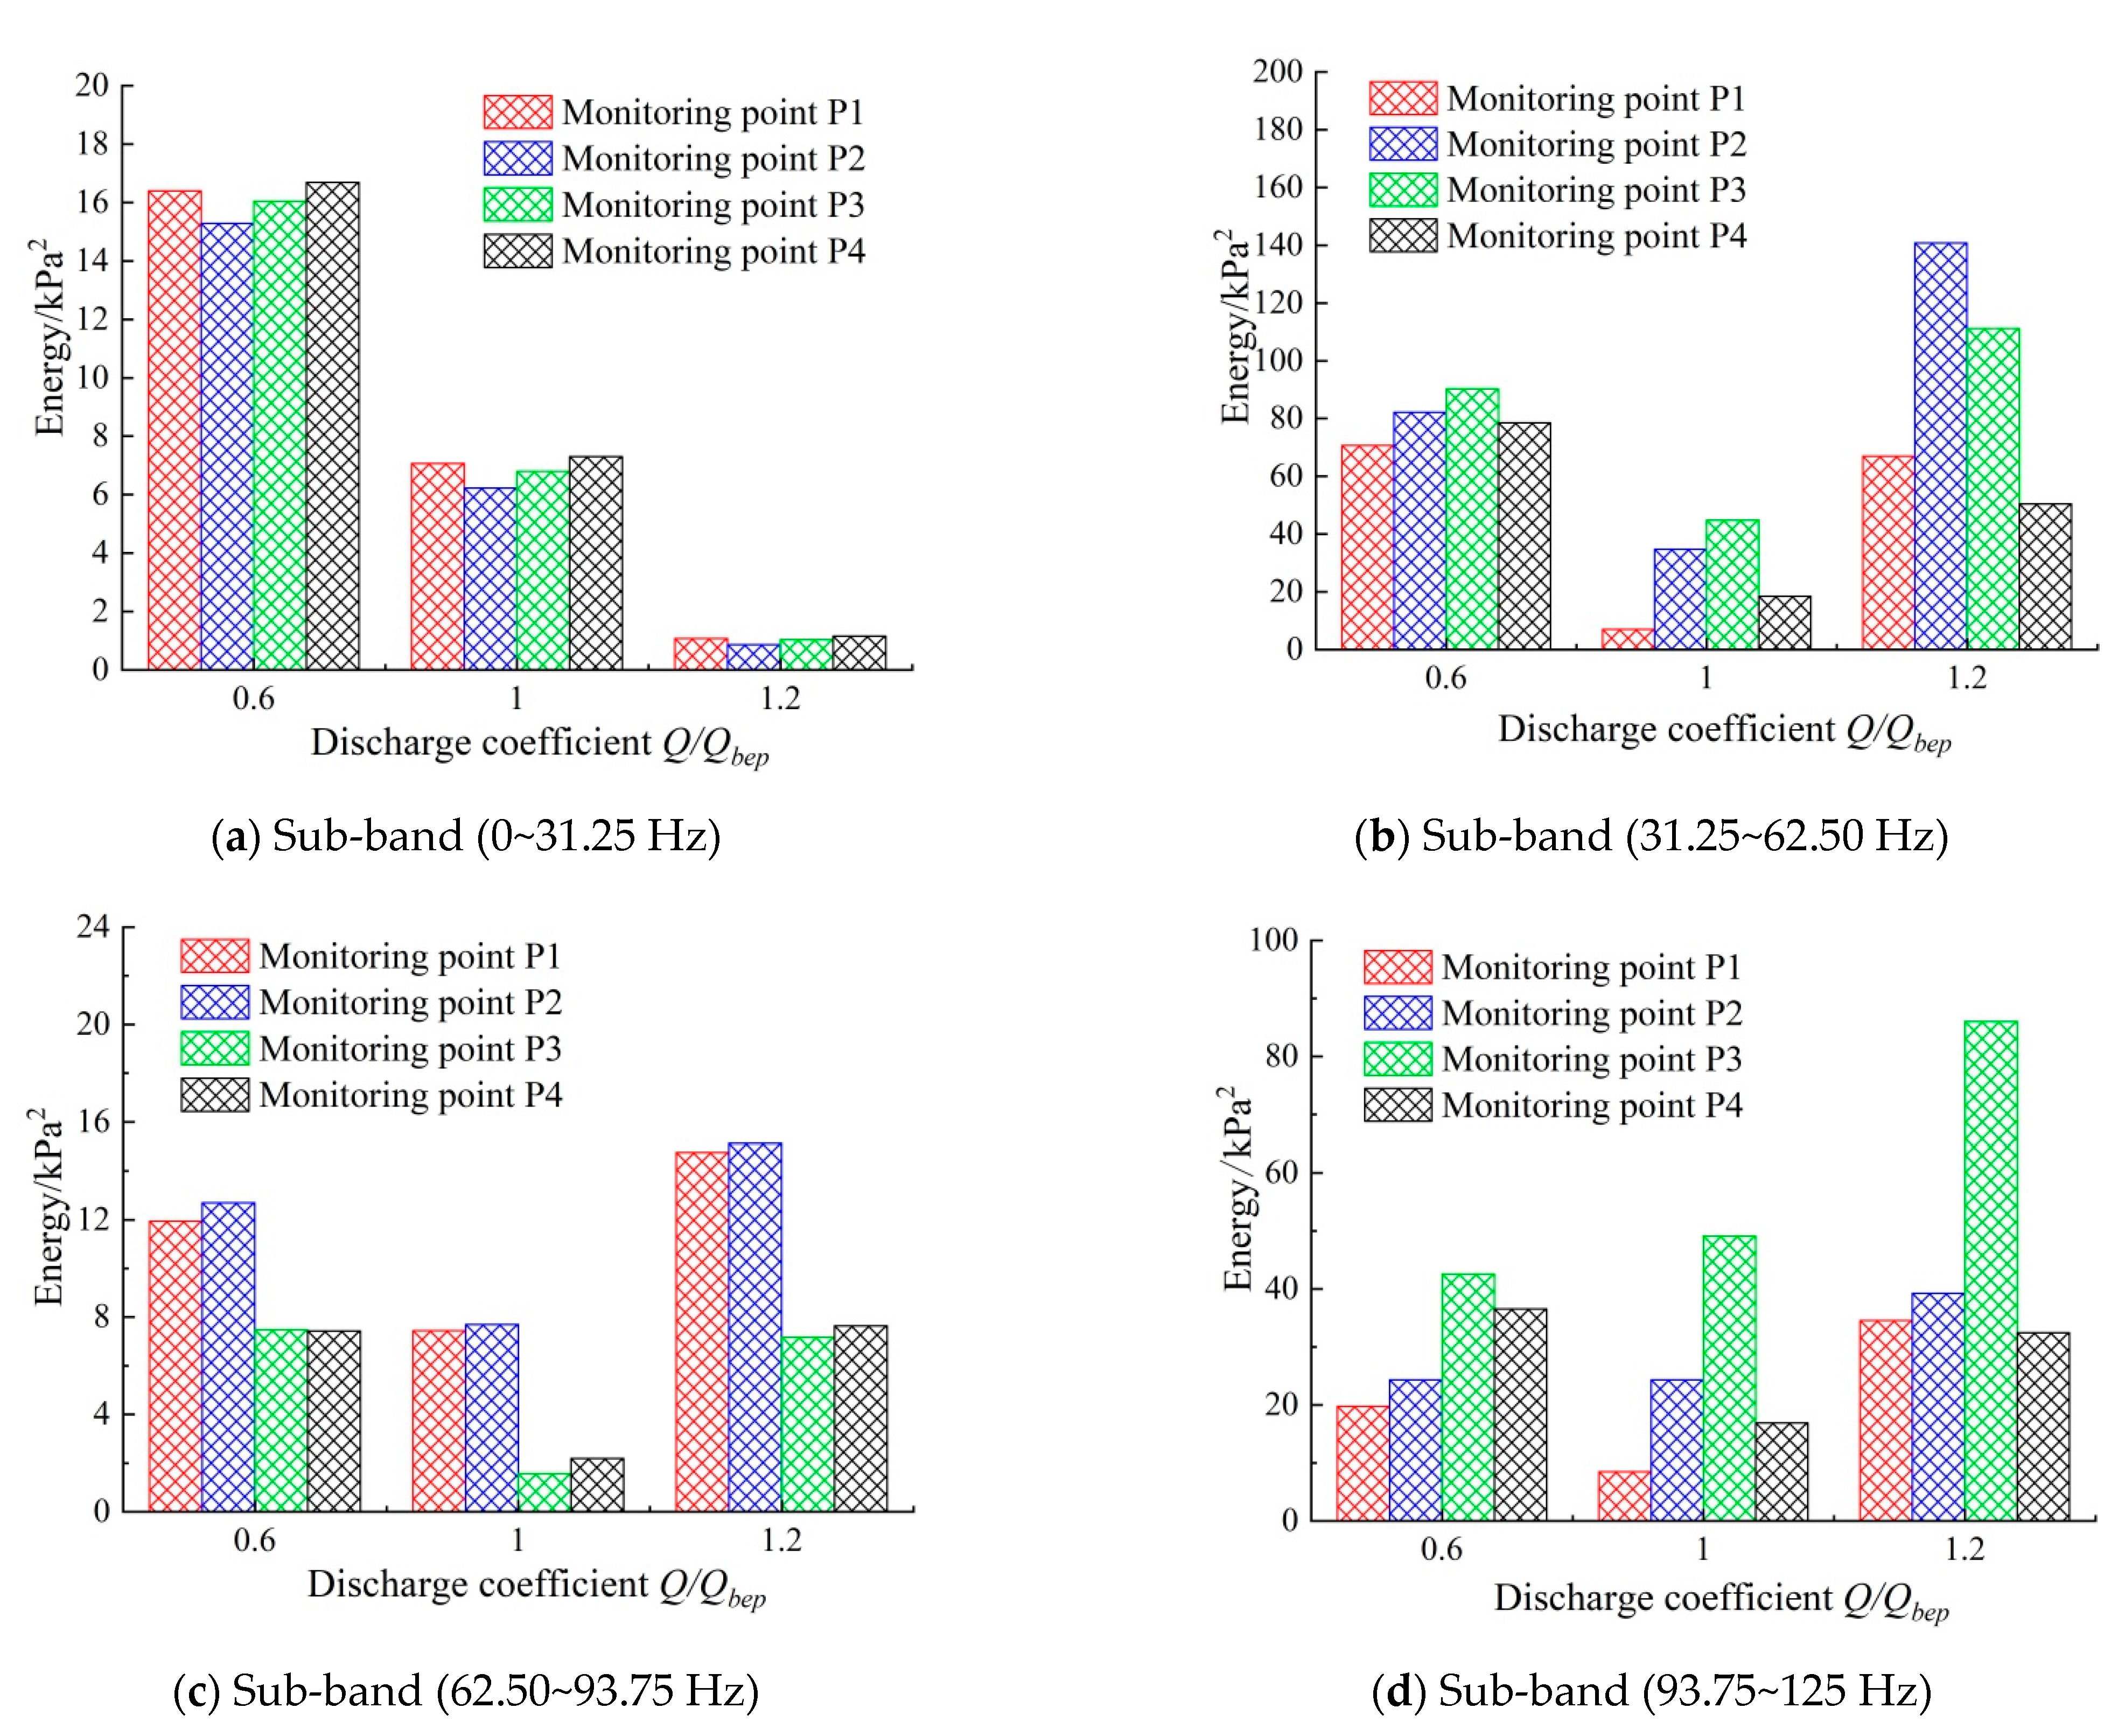
We selected the first four sub-bands—0~31.25 Hz, 31.25~62.50 Hz, 62.50~93.72 Hz and 93.72~125 Hz—after the fourth layer wavelet packet decomposition to analyze the relationship between the energy and flow of each sub-band, as shown in Figure 16. The energy value of each monitoring point in the sub-band 0~31.25 Hz was the largest, accounting for more than 99% of the total energy, indicating that the energy of the straight outlet conduit test section was mainly concentrated in the sub-band, and the energy fluctuation in the low-frequency band easily had a great impact on the safe and stable operation of the pump device. With the increase of the flow rate, the total energy value of the pressure in the test section of the straight outlet conduit decreased gradually and the average energy value of each monitoring point at 0.6 Qbep in the low flow rate condition was 3.76 times that at the optimal flow rate condition and 24.73 times that at the high flow rate condition; furthermore, the rotational intensity of the spiral flow in the straight outlet conduit was larger and the turbulent irregular motion increased the kinetic energy of the flow. However, the velocity circulation at the outlet of the guide vane became smaller under the condition of a high flow rate, and the intensity of the spiral flow in the straight outlet conduit was relatively weak. Under the same working condition, the energy values of different monitoring points in the same sub-band were different, which was mainly due to the inconsistency of the distribution of water pressure and velocity when the flow at the outlet of the guide vane spiraled into the straight outlet conduit.
To analyze the energy difference of each monitoring point, the energy proportion was defined as the percentage of the total energy value of each monitoring point and the sum of the total energy values of four monitoring points. The results show that the difference in the energy ratios of P1 and P3 was small, and the difference as less than 1%. The energy ratio difference of P2 and P4 at the top and bottom of the straight outlet conduit was larger than 2%. Under the optimal flow rate condition, the energy proportion difference between P1 and P3 was the largest, and the energy proportion difference between P1 and P3 was 0.97%. Under the condition of a high flow rate, the energy proportion difference of P2 and P4 at the top and bottom of the straight outlet conduit was the largest, and the energy proportion difference of P2 and P4 was 6.95%. Under the same flow rate condition, the energy values of P1 and P3 on both sides of the straight outlet conduit along the flow direction showed little difference, and the energy values of P2 and P4 on the top and bottom of the straight outlet conduit showed the great difference; the total energy value of P4 at the bottom of the straight outlet conduit test section was the largest, and the total energy value of P2 at the left side of the straight outlet conduit along the flow direction was the smallest.
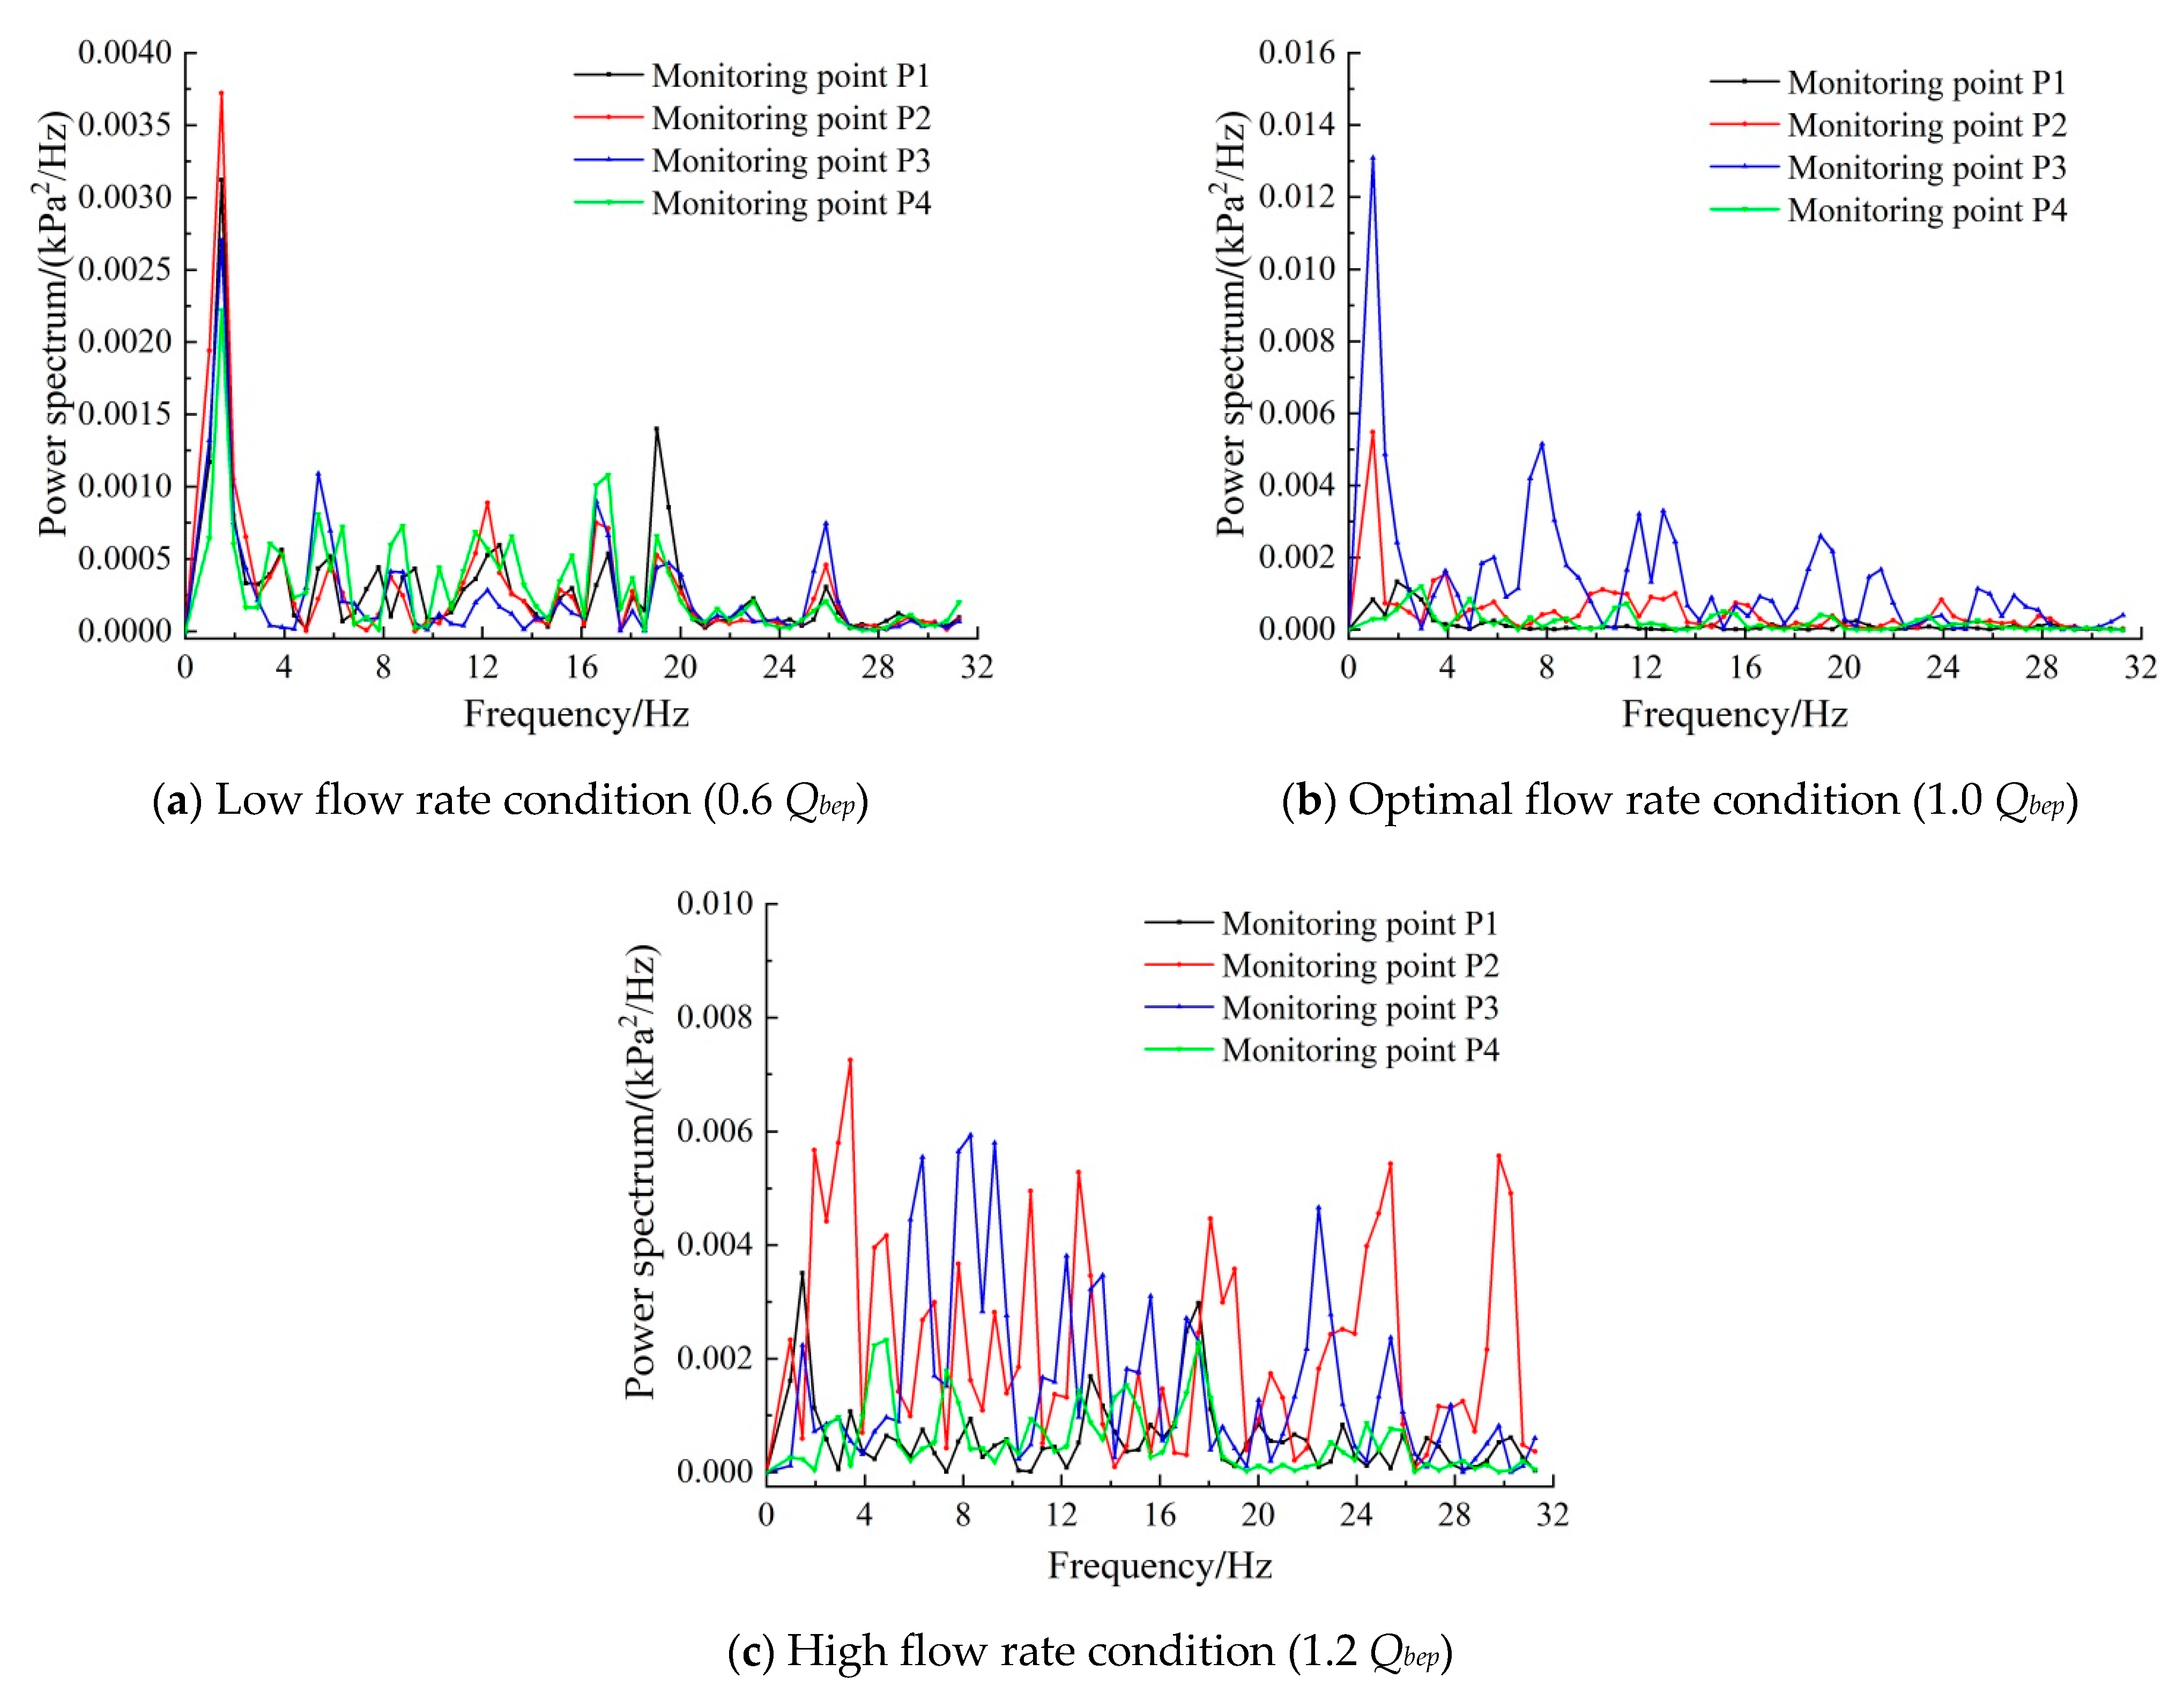
The energy value of each monitoring point in the sub-band 0~31.25 Hz was the largest; thus, we selected this sub-band for power spectrum analysis, and the results are shown in Figure 17. Under low flow rate conditions, the dominant frequency of the power spectrum of each monitoring point in the sub-band 0~31.25 Hz was 1.46 Hz. Under the optimal flow rate condition, the dominant frequency of the power spectrum of P1 was 1.95 Hz, while that of P2 and P3 was 0.98 Hz and that of P4 was 2.93 Hz. Under high flow rate conditions, the dominant frequencies of the power spectrum of P1, P2, P3 and P4 were 1.46 Hz, 3.42 Hz, 8.30 Hz and 4.88 Hz, respectively.

4.4. Analysis Results of Pressure Fluctuation with Division Pier

From the results of numerical analysis, it can be seen that the different lengths of the division pier only had an impact on the hydraulic loss of the straight outlet conduit but had no obvious impact on the velocity distribution and pressure distribution near the wall of the straight outlet conduit; from the perspective of economy and construction difficulty, the length of the division pier should not be excessive. In order to explore the energy and power spectrum characteristics of the straight outlet conduit with the division pier, the pressure fluctuation signal of scheme 1 was analyzed. As shown in Figure 18, a division pier made of acrylic material was set in the test section of the straight outlet conduit; after setting the division pier in the test section of the straight outlet conduit, the original flow field structure of the water flow would inevitably change, and the change of the flow field would have a certain impact on the pressure pulsation near the wall of the straight outlet conduit. Thus, the difference in the energy and power spectrum of P1 and P3 in the test section of the straight outlet conduit with or without a division pier was analyzed.
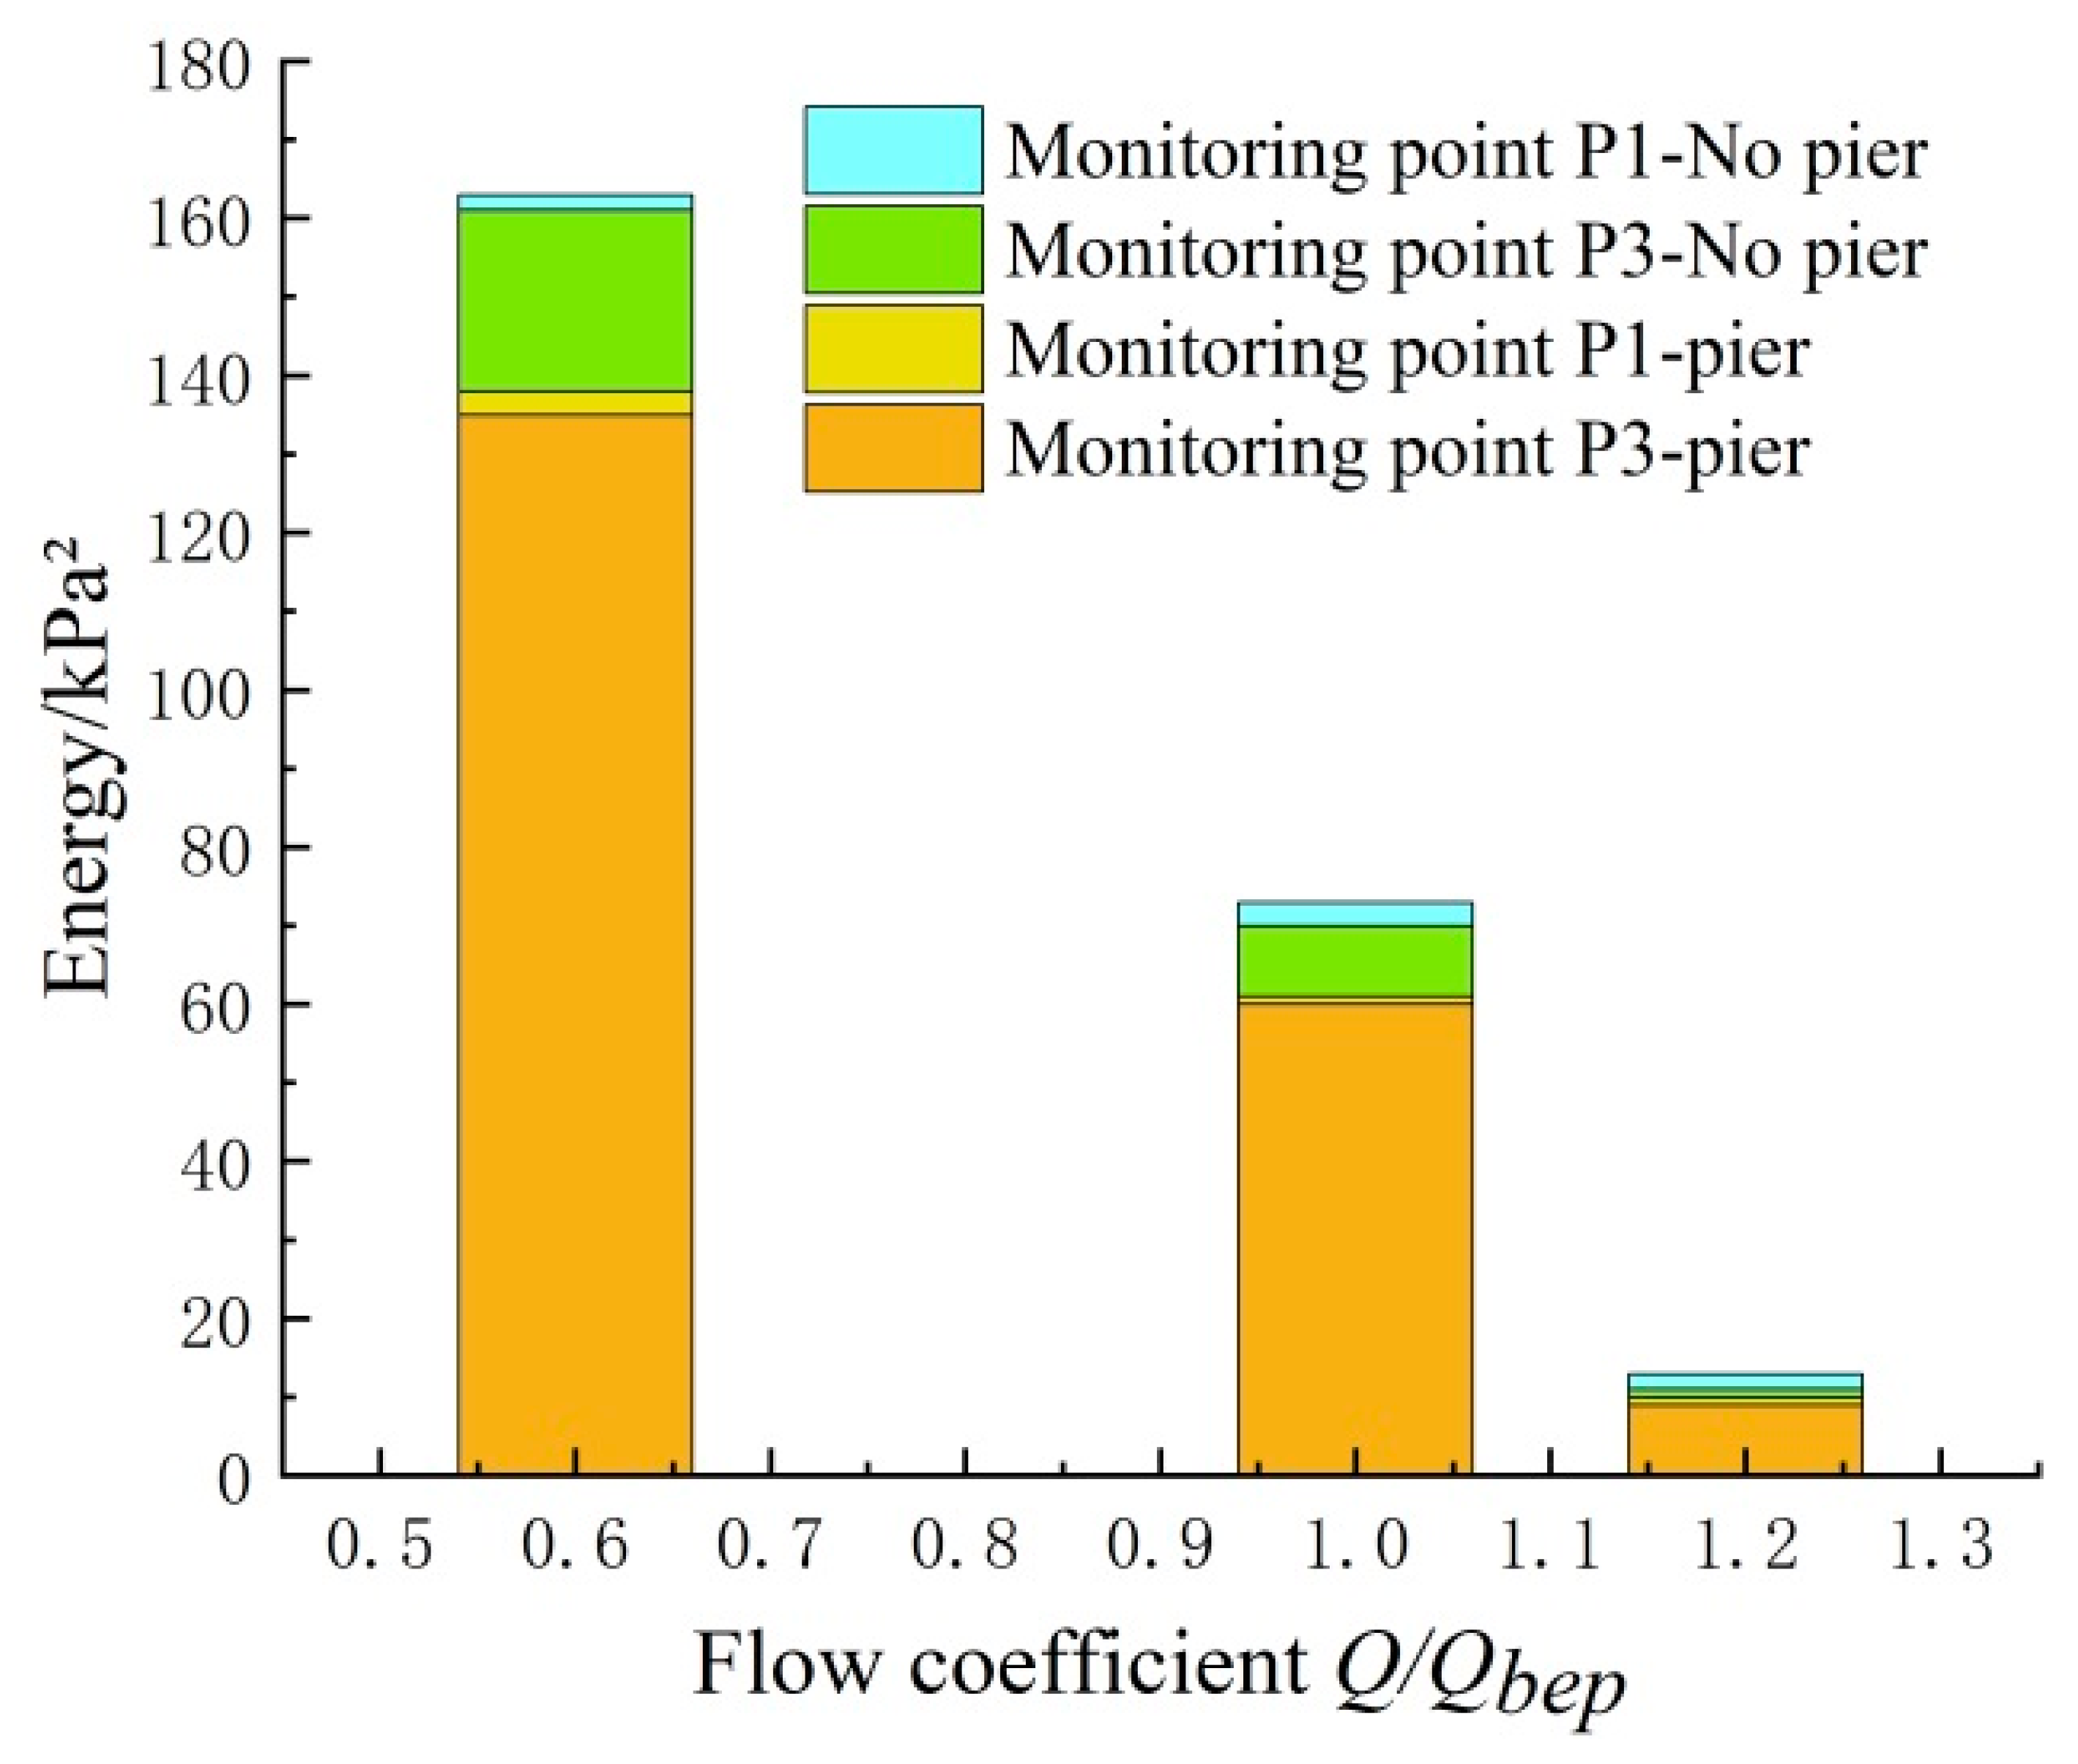
The comparison results of the energy values of the two monitoring points with and without a division pier are shown in Figure 19. The results show that the energy values of the two monitoring points in the straight outlet conduit decreased with the decrease of the flow rate with or without the division pier, and the energy values of the two monitoring points in the straight outlet conduit with the division pier were less than those without the division pier. When the flow coefficient was less than 1.0, the smaller the flow coefficient, the more obvious the influence of the division pier on the energy value of the monitoring point in the straight outlet conduit test section. When the flow coefficient was greater than 1.0, the greater the flow coefficient, the smaller the influence of the division pier on the energy value of the monitoring point in the straight outlet conduit test section. The reasonable setting of the division pier is conducive to reducing the pressure pulsation in the straight outlet conduit and to the safe and stable operation of the pump device. According to the energy analysis results of the wavelet packet decomposition of the flow pulsation measuring points in the straight outlet conduit without a division pier, the energy proportion of the sub-band 0~31.25 Hz was the largest, and thus the power spectrum of the time domain signal of the sub-band was analyzed after reconstruction; the comparison of the power spectrum of the reconstructed time domain signal of the two monitoring points in the straight outlet conduit with and without a division pier is shown in Table 3.
The division pier has a certain effect on the change of the flow field in the straight outlet conduit, and the change of the flow field must result in a change of pressure; there were differences in the power spectrum of the main frequency and the corresponding main frequency of the two monitoring points P1 and P3 in the straight outlet conduit after setting the division pier, and the power spectrum values corresponding to the main frequency of the two monitoring points at the straight outlet conduit level were different with or without the division pier. After the division pier was set, the power spectrum values corresponding to the main frequency of the two monitoring points were reduced, but the degree of reduction had a direct impact on the operating conditions of the pump device. This indirectly shows that the influence degree of the division pier on the flow pulsation in the straight outlet conduit is also directly related to the flow rate of the pump device and the residual circulation at the outlet of the guide vane.

5. Conclusions

(1) The addition of a division pier reduces the pressure near the wall of the straight outlet conduit and forms a certain low pressure area on the left side of the division pier. Due to the influence of the diversion at the starting position of the division pier, the local flow pattern is disordered and easily forms vortices, resulting in a small high-pressure area near the wall at the starting position of the division pier. The results show that the installation of a division pier has a great influence on the velocity near the wall of the straight outlet conduit, which leads to an overall decrease of the velocity near the wall of the straight outlet conduit along the flow direction; furthermore, large low-speed areas appear at the top and bottom of the straight outlet conduit, but large high-speed areas appear at the left side of the initial position of the division pier, which is one of the reasons that the main flow tends towards the left side of the division pier. However, the length of the division pier has no obvious effect on the pressure and velocity distribution near the wall of the straight outlet conduit; to save money and reduce the difficulty of construction, the length of the division pier should not be excessive.
(2) Under different working conditions, the energy value of each monitoring point in the sub-band 0~31.25 Hz is the largest, and the energy value is mainly concentrated in this sub-band. With the increase of the flow rate, the total energy value of the pressure in the straight outlet conduit decreases gradually. Under the same working condition, the energy values of different monitoring points in the same sub-band are different. Under each working condition, the difference of the energy proportion between the two monitoring points at the straight outlet conduit level is small, and the difference is within 1%. The energy ratio difference between the two monitoring points at the top and bottom of the straight outlet conduit is relatively large, at more than 2%.
(3) The results show that the energy values of the two monitoring points in the straight outlet conduit decrease with the decrease of the flow rate with or without the division pier, and the energy values of the two monitoring points in the straight outlet conduit with the division pier are lower than those without the division pier. There are differences in the main frequency and power spectrum of the two monitoring points in the straight outlet conduit after setting the division pier. The reasonable setting of the division pier is beneficial to reduce the pressure pulsation in the straight outlet conduit and ensure the safe and stable operation of the pump device; the influence of the division pier on the flow pulsation in the straight outlet conduit is also affected by the flow and the residual circulation at the outlet of the guide vane.

Author Contributions

Methodology, F.Y. and D.J. Experiment, P.C. and T.W. Data analysis, D.J. and F.Y. Writing and editing, D.J. and D.L. Review, C.L. Funding acquisition and validation, F.Y. All authors have read and agreed to the published version of the manuscript.

Funding

This research work was supported by the National Natural Science Foundation of China (Grant No.51609210), the Natural Science Foundation of the Jiangsu Higher Education Institutions of China (Grant No.20KJA570001), the open research subject of Key Laboratory of Fluid and Power Machinery, Ministry of Education (szjj2016-078), the Science and Technology Plan Project of Yangzhou City (Grant No.YZU201901), Technology Project of Water Resources Department of Jiangsu Province (Grant No.2020029), Scientific Research Program of Jiangsu Hydraulic Research Institute (2020z026), Postgraduate Research and Practice Innovation Program of Jiangsu Province (KYCX21_3226) and Priority Academic Program Development of Jiangsu Higher Education Institutions (PAPD).

Institutional Review Board Statement

Not applicable.

Informed Consent Statement

Not applicable.

Data Availability Statement

All data necessary to carry out the work in this paper are included in the figures, tables or are available in the cited references.

Conflicts of Interest

The authors declare that they have no known competing financial interests or personal relationships that could have appeared to influence the work reported in this paper.

Nomenclature

QFlow rate
QbepOptimal flow rate
HHead
DImpeller diameter
ηEfficiency
E η Total system error of test
fHighest analysis frequency
fsSampling frequency of pressure fluctuation test
EqSystematic error of flow measurement
E η , s Total system uncertainty of the test bed
E η , r Random uncertainty of the test bed
EhSystematic error of head measurement
EmSystematic error of torque measurement
EnSystem error of speed measurement
DWavelet packet

References

  1. Zhang, Y.; Zhang, Z.; Zhang, J. Experimental Study on the Influence of Different Water Depth on Tidal Turbine Hydrodynamic Characteristics. Proc. CSEE 2020, 40, 6973–6982. [Google Scholar]
  2. Kan, K.; Chen, H.; Zheng, Y.; Zhou, D.; Binama, M.; Dai, J. Transient characteristics during power-off process in a shaft extension tubular pump by using a suitable numerical model. Renew. Energy 2021, 164, 109–121. [Google Scholar] [CrossRef]
  3. Kan, K.; Zheng, Y.; Chen, H.; Cheng, J.; Gao, J.; Yang, C. Study into the Improvement of Dynamic Stress Characteristics and Prototype Test of an Impeller Blade of an Axial-Flow Pump Based on Bidirectional Fluid–Structure Interaction. J. Appl. Sci. 2019, 9, 3601. [Google Scholar] [CrossRef] [Green Version]
  4. Liu, C. Analysis on technological innovation and development of axial flow pump system. Trans. Chin. Soc. Agric. Mach. 2015, 46, 49–59. [Google Scholar]
  5. Xie, L.; Wang, F.; He, C. Experimental study on hydrodynamic characteristics of 15 degree inclined axial flow pump device. Hydraul. Eng. 2019, 50, 798–805. [Google Scholar]
  6. Xu, L.; Yan, S.; Shi, W. Applicability of turbulence model for numerical calculation of hydraulic performance of siphon outlet channel. Hydro Sci. Eng. 2019, 42–49. [Google Scholar] [CrossRef]
  7. Yang, F.; Liu, C.; Tang, F. Analysis on hydraulic characteristics of outlet channel of pump device based on full channel simulation. Trans. Chin. Soc. Agric. Mach. 2014, 45, 83–89. [Google Scholar]
  8. Liang, J.; Lu, L.; Liu, R. The influence of middle pier on the hydraulic performance of outlet channel of large pumping station. Drain. Irrig. Mach. Eng. 2011, 29, 77–81. [Google Scholar]
  9. Duan, Y.; Zhou, R. Simulation analysis on temperature change effect of spillway tunnel lining during construction period of Xiaolangdi project. Hydroelectr. Eng. 2005, 49–54. [Google Scholar] [CrossRef]
  10. PI, J.; Qiu, C.; Yu, B. Test and Research on inlet and outlet channel type of large vertical axial flow pump station. Eng. J. Wuhan Univ. 1981, 55–64. [Google Scholar]
  11. Zhu, J.; He, Z.; Liu, D. Design and model test verification of bidirectional outlet channel of large axial flow pumping station. Eng. J. Wuhan Univ. 2005, 13–16. [Google Scholar] [CrossRef]
  12. Zhu, J.; He, Z.; Liu, D. Experimental study on two way inlet and outlet flow channel model. Pump Technol. 2005, 18–21. [Google Scholar]
  13. Kan, K.; Zixuan, Y.; Pin, L.; Yuan, Z.; Lian, S. Numerical Study of Turbulent Flow past a Rotating Axial-Flow Pump Based on a Level-set Immersed Boundary Method. Renew. Energy 2020, 168, 960–971. [Google Scholar] [CrossRef]
  14. Ramadhan, A.A. Investigation of the influence of various numbers of impeller blades on internal flow field analysis and the pressure pulsation of an axial pump based on transient flow behavior. Heat Transfer. 2020, 49. [Google Scholar] [CrossRef]
  15. Yu, I.; Yuhei, S.; Takao, N. Theoretical Analyses of the Number of Backflow Vortices on an Axial Pump or Compressor. Fluids Eng. 2020, 142. [Google Scholar] [CrossRef] [Green Version]
  16. Zhu, H.; Yuan, S. Influence of inlet flow field on the performance of siphon outlet passage. Trans. Chin. Soc. Agric. Mach. 2006, 193–196. [Google Scholar] [CrossRef]
  17. Yang, F.; Hu, W.; Liu, C. Numerical simulation and PIV test of flow field in straight pipe outlet passage of axial flow pump. Chin. J. Hydrodyn. 2019, 34, 795–802. [Google Scholar]
  18. Xu, L.; Xia, B.; Shi, W. The influence of the length of the middle pier on the hydraulic characteristics of the outlet channel of the inclined axial extension pump device. Trans. Chin. Soc. Agric. Eng. 2020, 36, 74–81. [Google Scholar]
  19. Chaoyue, W.; Fujun, W.; Yuan, T.; Dan, Z.; Lihua, X.; Chenglian, H.; Quanrong, Z.; Congbing, H. Investigation Into the Phenomenon of Flow Deviation in the S-Shaped Discharge Passage of a Slanted Axial-Flow Pumping System. Fluids Eng. 2020, 142. [Google Scholar] [CrossRef]
  20. Wangben, H.; Wangfu, J.; Xie, L. Study on the bias flow characteristics of outlet passage of inclined axial flow pump device. Water Conserv. 2021, 1–12. [Google Scholar] [CrossRef]
  21. Song, X.; Liu, C. Experimental investigation of floor-attached vortex effects on the pressure pulsation at the bottom of the axial flow pump sump. Renew. Energy 2020, 145, 2327–2336. [Google Scholar] [CrossRef]
  22. Wudong, L.; Zheng, Y.; Xue, H. Pressure fluctuation characteristics of axial extension tubular pump under multiple working conditions. Drain. Irrig. Mach. Eng. 2021, 39, 244–250. [Google Scholar]
  23. Zou, F.; Zou, D.; Rao, Z. Analysis of pressure fluctuation characteristics of sodium pump. Eng. Therm. Energy Power 2019, 34, 71–76. [Google Scholar]
  24. Jacob, S.L.K.; Madhu, R. An efficient interference mitigation approach for NavIC receivers using improved variational mode decomposition and wavelet packet decomposition. Trans. Emerg. Telecommun. Technol. 2021, 32. [Google Scholar] [CrossRef]
  25. Ni, D.; Zhang, N.; Gao, B.; Li, Z.; Yang, M. Dynamic measurements on unsteady pressure pulsations and flow distributions in a nuclear reactor coolant pump. Energy 2020, 198. [Google Scholar] [CrossRef]
  26. Sangho, C.; Jeonghwa, Y. Wavelet Packet Transform Modulus-Based Feature Detection of Stochastic Power Quality Disturbance Signals. Appl. Sci. 2021, 11, 2825. [Google Scholar] [CrossRef]
  27. Zi, D.; Wangfu, J.; Tao, R. Study on the influence of boundary layer grid scale on the calculation results of pumping station flow field. Hydraul. Eng. 2016, 47, 139–149. [Google Scholar]
  28. Li, J.; Wang, X.; Wang, W.; Wang, Y. Performance improvement of a high-speed aero-fuel centrifugal pump through active inlet injector. Proc. Inst. Mech. Eng. 2021, 235. [Google Scholar] [CrossRef]
  29. Desheng, Z.; Guangjian, Z.; Weidong, S.; Tongtong, L. Performance prediction and experimental verification of axial flow pump based on CFD. Appl. Mech. Mater. 2012, 1620. [Google Scholar] [CrossRef]
  30. Ramirez, R.; Avila, E.; Lopez, L.; Bula, A.; Forero, J.D. CFD characterization and optimization of the cavitation phenomenon in dredging centrifugal pumps. Alex. Eng. J. 2020, 59. [Google Scholar] [CrossRef]
  31. Shrifan, N.H.M.M.; Firdaus, A.M.; Ashidi, M.I.N. Maximal overlap discrete wavelet-packet transform aided microwave nondestructive testing. NDT E Int. 2021, 119. [Google Scholar] [CrossRef]
  32. Habbouche, H.; Benkedjouh, T.; Zerhouni, N. Intelligent prognostics of bearings based on bidirectional long short-term memory and wavelet packet decomposition. Int. J. Adv. Manuf. Technol. 2021, 114, 145–157. [Google Scholar] [CrossRef]
  33. Galletti, C.; Mariotti, A.; Siconolfi, L.; Mauri, R.; Brunazzi, E. Numerical investigation of flow regimes in T-shaped micromixers: Benchmark between finite volume and spectral element methods. Can. J. Chem. Eng. 2019, 97. [Google Scholar] [CrossRef]
  34. Jeong, J.; Mechanics, F. On the identification of a vortex. J. Fluid Mech. 1995, 285, 69–94. [Google Scholar] [CrossRef]
  35. Mariotti, A.; Galletti, C.; Salvetti, M.V.; Brunazzi, E. Unsteady Flow Regimes in a T-Shaped Micromixer: Mixing and Characteristic Frequencies. Ind. Eng. Chem. Res. 2019. [Google Scholar] [CrossRef]
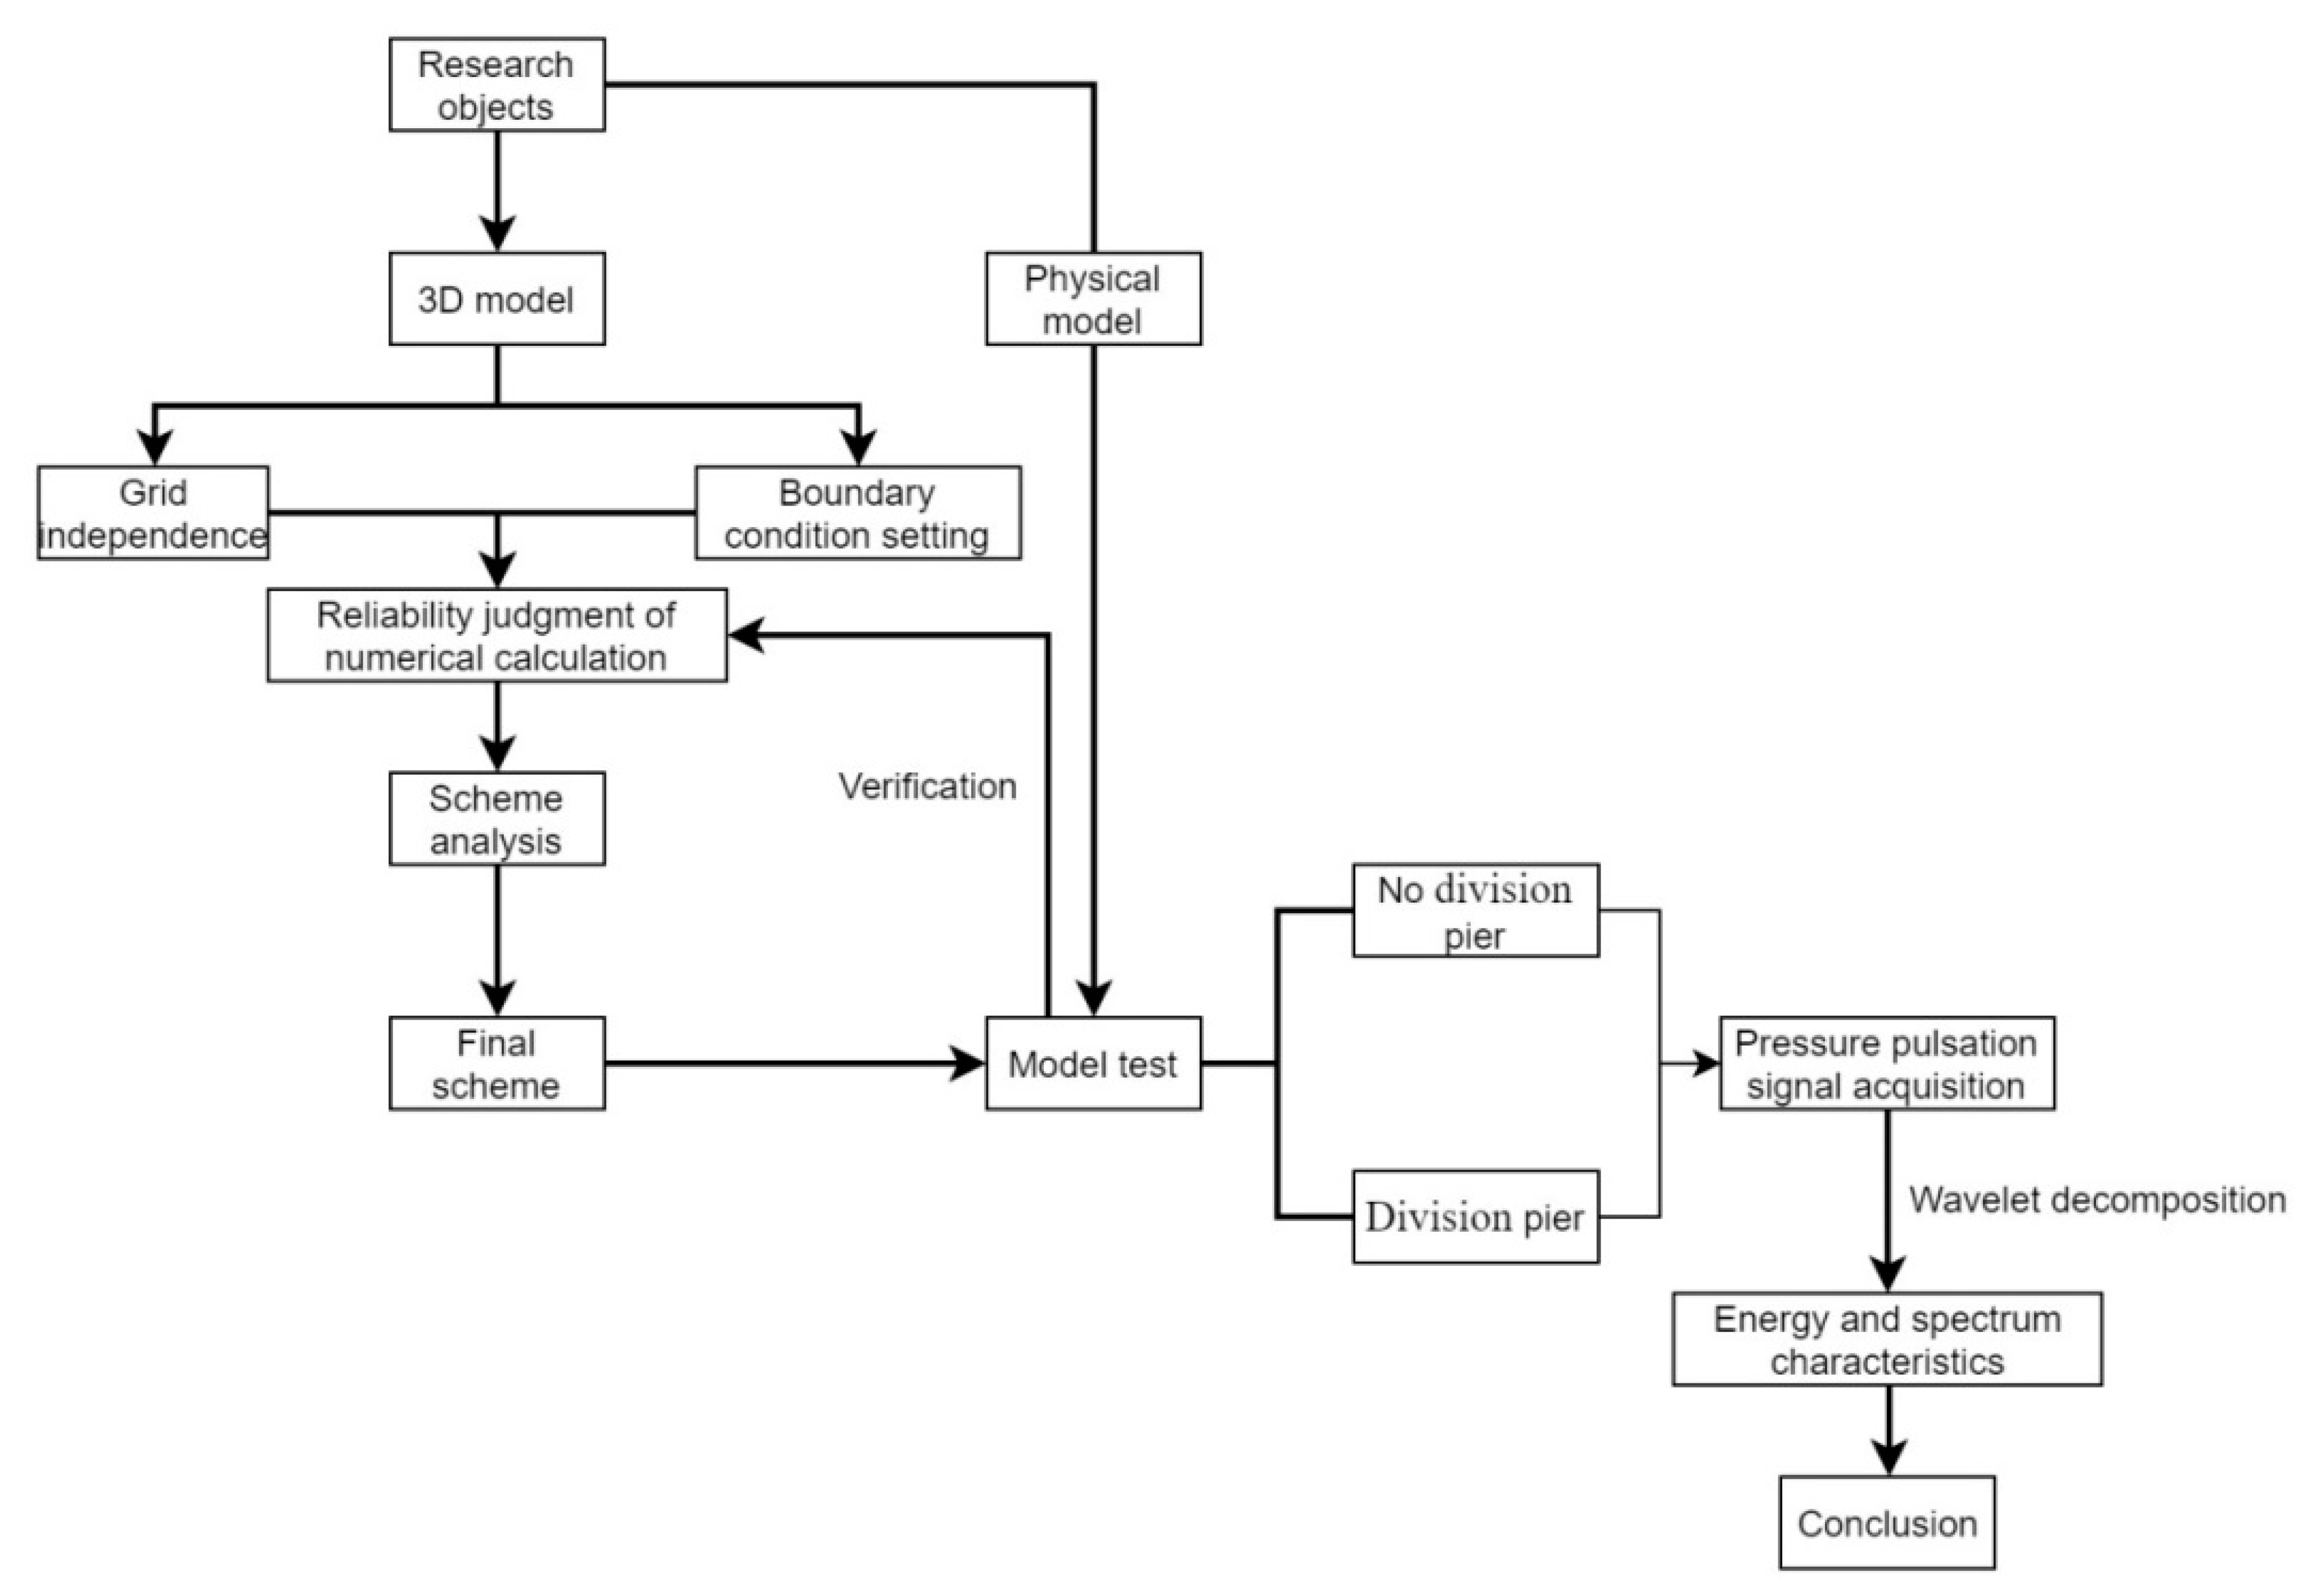
Figure 1. Analysis flow chart.
Applsci 11 06774 g001
Figure 2. Three-dimensional model of the axial-flow pump device. 1. Elbow inlet conduit, 2. impeller, 3. guide vane, 4. 90° elbow, 5. straight outlet conduit.
Applsci 11 06774 g002
Figure 3. Single line diagram of the inlet and straight outlet conduit.
Applsci 11 06774 g003
Figure 4. Grid diagram of the flow components of the axial-flow pump device.
Applsci 11 06774 g004
Figure 5. Influence curve of grid number on pump efficiency.
Applsci 11 06774 g005
Figure 6. Comparison between numerical simulation and model test of axial-flow pump device.
Applsci 11 06774 g006
Figure 7. Physical model of test bed and pump device.
Applsci 11 06774 g007
Figure 8. Energy performance repeatability test of axial-flow pump device.
Applsci 11 06774 g008
Figure 9. Installation positions of pressure sensor.
Applsci 11 06774 g009
Figure 10. Decomposition tree of wavelet packet in four layers.
Applsci 11 06774 g010
Figure 11. Design scheme of straight outlet conduit.
Applsci 11 06774 g011
Figure 12. Internal streamline diagram of straight outlet conduit under different design schemes.
Applsci 11 06774 g012
Figure 13. Pressure nephogram of the near-wall area of the straight outlet conduit.
Applsci 11 06774 g013
Figure 14. Velocity nephogram of the near–wall area of the straight outlet conduit.
Applsci 11 06774 g014
Figure 15. Vortex structure of the straight outlet conduit under different flow rate conditions (Q = 300 s−2).
Applsci 11 06774 g015
Figure 16. Energy value of each sub-band decomposed by wavelet packets at different monitoring points.
Applsci 11 06774 g016
Figure 17. Power spectrum of each monitoring point in sub-band 0~31.25 Hz under different working conditions.
Applsci 11 06774 g017
Figure 18. The physical picture of the test section of the straight outlet conduit with division pier.
Applsci 11 06774 g018
Figure 19. Energy comparison of two monitoring points with and without division pier.
Applsci 11 06774 g019
Table 1. Grid y+ value of each flow component of the axial-flow pump device.
Overcurrent PartsElbow Inlet ConduitImpellerGuide Vane90° ElbowStraight Outlet Conduit
y+268.08390.24471.627249.616193.776
Table 2. Flow distribution on both sides of division pier in three schemes.
SchemeHead Loss (m)Left (Q/Qbep)Right (Q/Qbep)Flow Distribution Ratio
10.0810.5950.4071.46
20.0780.5920.4081.45
30.0750.5970.4031.48
Table 3. Power spectrum of each monitoring point after reconstruction of the signal of sub-band 0~31.25 Hz under each working condition.
CategoryNo Division PierWith Division Pier
Monitoring Point P1Monitoring Point P3Monitoring Point P1Monitoring Point P3
Main Frequency/HzPower Spectrum/kPa2·Hz−1Main Frequency/HzPower Spectrum/kPa2·Hz−1Main Frequency/HzPower Spectrum/kPa2·Hz−1Main Frequency/HzPower Spectrum/kPa2·Hz−1
0.6 Qbep1.460.00311.460.00271.950.002816.600.0022
Qbep1.950.00130.980.013125.880.00120.980.0033
1.2 Qbep1.460.00358.300.00591.460.00262.440.0045
Publisher’s Note: MDPI stays neutral with regard to jurisdictional claims in published maps and institutional affiliations.