
Revisiting Low-Resolution Images Retrieval with Attention Mechanism and Contrastive Learning

Abstract
:1. Introduction
- We adapted the Visual Transformer to the image retrieval task when the embedded vectors were calculated using attention weights. The main advantage of this method is that the attention mechanism of the ViT model helps to focus more on an object of interest when comparing two images.
- We addressed the problem of retrieval with degraded samples such as low-resolution. We proposed using a contrastive learning framework to learn an embedded space where the same samples are close together with respect to Euclidean distance.
- We conducted extensive experiments on CARS196, Stanford Online Products, and CUB200-2011 datasets under various circumstances. Both quantitative and qualitative results show that the proposed framework is efficient.
2. Materials and Methods
2.1. Feature Extractor
2.2. Contrastive Learning Framework
2.3. Auxiliary Module: Classification Loss and Triplet Loss
3. Results
3.1. Datasets
3.2. Implementations
3.3. Quantitative Results
3.3.1. Experimental Results of Different Datasets
3.3.2. The Effectiveness of Backbone Network
3.3.3. The Effectiveness of the Number of Embedding Dimensions
3.3.4. The Effectiveness of Loss Components
3.3.5. The Effectiveness of Attention Mechanism
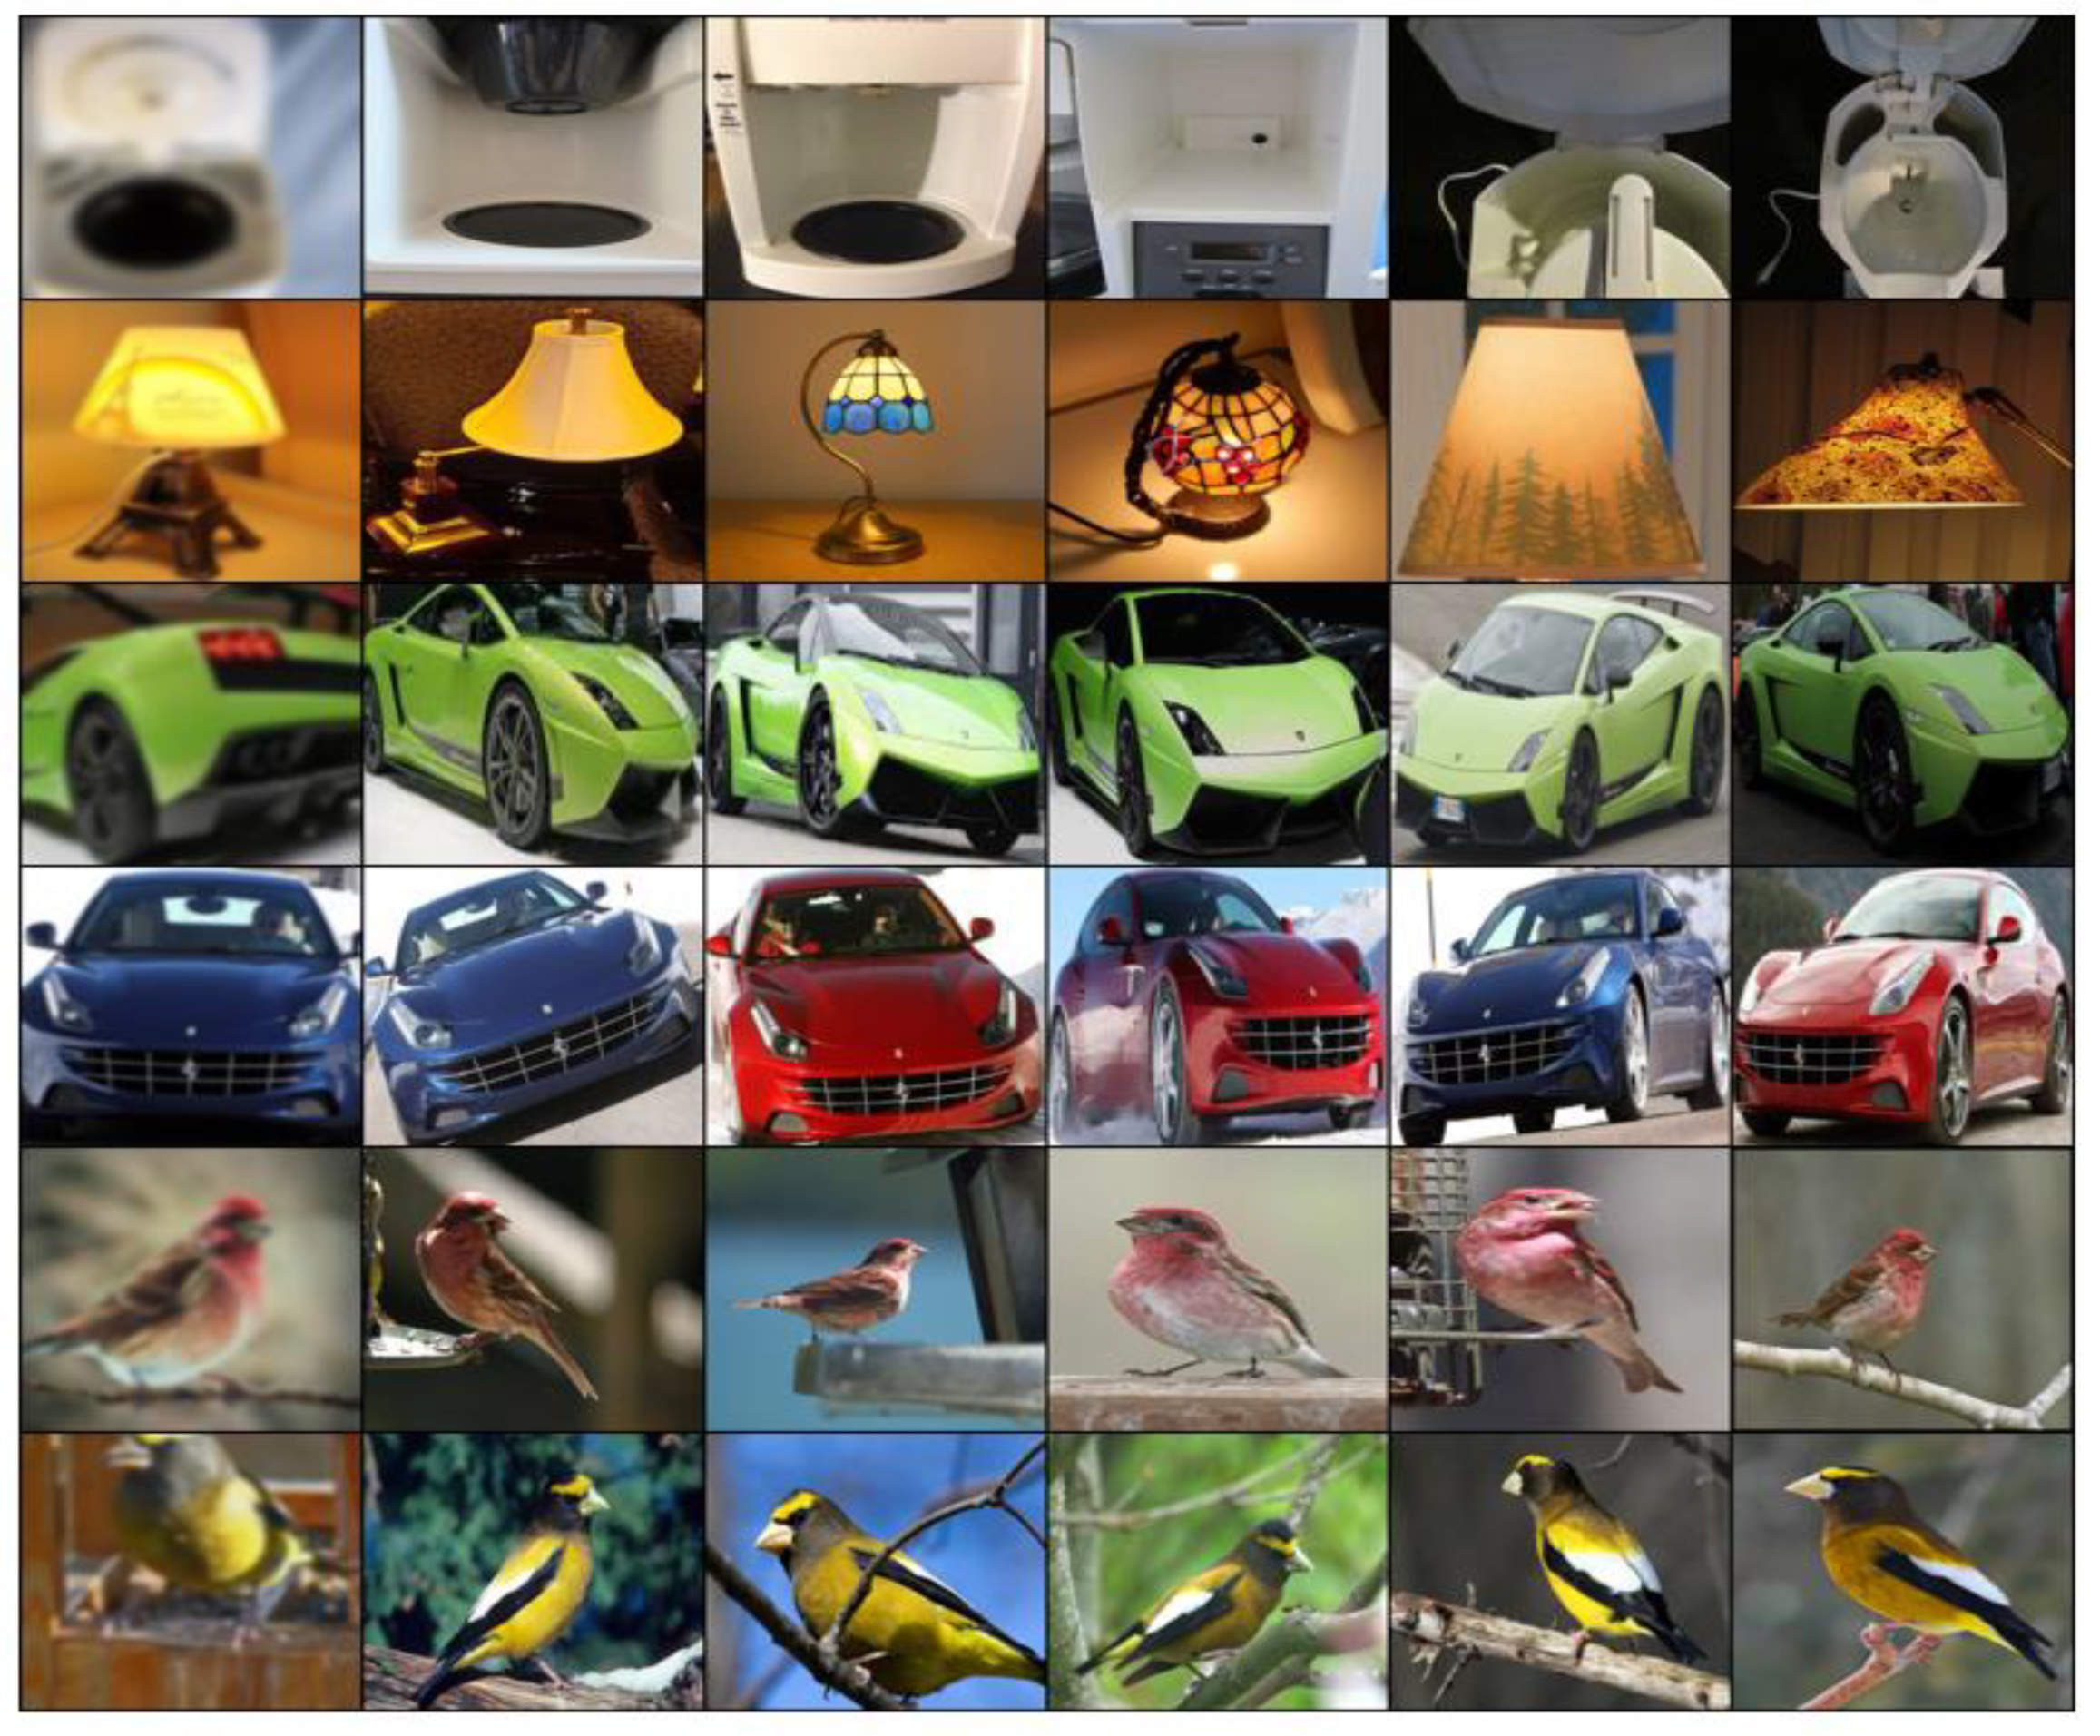
3.4. Qualitative Analysis
4. Conclusions
Author Contributions
Funding
Institutional Review Board Statement
Informed Consent Statement
Data Availability Statement
Conflicts of Interest
References
- Babenko, A.; Slesarev, A.; Chigorin, A.; Lempitsky, V. Neural Codes for Image Retrieval. In Proceedings of the European Conference on Computer Vision, Zurich, Switzerland, 6–12 September 2014; pp. 584–599. [Google Scholar]
- Tolias, G.; Sicre, R.; Jégou, H. Particular object retrieval with integral max-pooling of CNN activations. arXiv 2015, arXiv:1511.05879. [Google Scholar]
- Albert, G.; Almazán, J.; Revaud, J.; Larlus, D. Deep Image Retrieval: Learning Global Representations for Image Search. In Proceedings of the European Conference on Computer Vision, Amsterdam, The Netherlands, 11–14 October 2016; pp. 241–257. [Google Scholar]
- Artem, B.; Lempitsky, V. Aggregating deep convolutional features for image retrieval. arXiv 2015, arXiv:1510.07493. [Google Scholar]
- Filip, R.; Tolias, G.; Chum, O. Fine-tuning CNN Image Retrieval with no Human Annotation. In IEEE Transactions on Pattern Analysis and Machine Intelligence; IEEE: Piscataway, NJ, USA, 2019; Volume 41, pp. 1655–1668. [Google Scholar]
- Jun, H.; Ko, B.; Kim, Y.; Kim, I.; Kim, J. Combination of multiple global descriptors for image retrieval. arXiv 2019, arXiv:1903.10663. [Google Scholar]
- Revaud, J.; Almazán, J.; Rezende, R.; Souza, C.R. Learning with average precision: Training image retrieval with a listwise loss. In Proceedings of the IEEE/CVF International Conference on Computer Vision, Seoul, Korea, 27 October–2 November 2019. [Google Scholar]
- Albert, G.; Almazan, J.; Revaud, J.; Larlus, D. End-to-end learning of deep visual representations for image retrieval. Int. J. Comput. Vis. 2017, 124, 237–254. [Google Scholar]
- Dzmitry, B.; Cho, K.; Bengio, Y. Neural machine translation by jointly learning to align and translate. arXiv 2014, arXiv:1409.0473. [Google Scholar]
- Ashish, V.; Shazeer, N.; Parmar, N.; Uszkoreit, J.; Jones, L.; Gomez, A.; Kaiser, L.; Polosukhin, I. Attention is all you need. arXiv 2017, arXiv:1706.03762. [Google Scholar]
- Alexey, D.; Beyer, L.; Kolesnikov, A.; Weissenborn, D.; Zhai, X.; Unterthiner, T.; Dehghani, M. An image is worth 16x16 words: Transformers for image recognition at scale. In Proceedings of the International Conference on Learning Representations, Lisbon, Portuagal, 7–8 October 2021. [Google Scholar]
- El-Nouby, A.; Neverova, N.; Laptev, I.; Jégou, H. Training Vision Transformers for Image Retrieval. arXiv 2021, arXiv:2102.05644. [Google Scholar]
- Kim, W.; Goyal, B.; Chawla, K.; Lee, J.; Kwon, K. Attention-based ensemble for deep metric learning. In Proceedings of the European Conference on Computer Vision, Munich, Germany, 8–14 September 2018; pp. 736–751. [Google Scholar]
- Chen, B.; Deng, W. Hybrid-attention based decoupled metric learning for zero-shot image retrieval. In Proceedings of the IEEE/CVF Conference on Computer Vision and Pattern Recognition, Long Beach, CA, USA, 15–20 June 2019. [Google Scholar]
- Socratis, G.; Boutalis, Y.; Chatzichristofis, S. Investigating the Vision Transformer Model for Image Retrieval Tasks. arXiv 2021, arXiv:2101.03771. [Google Scholar]
- Chen, T.; Kornblith, S.; Norouzi, M.; Hinton, G. A simple framework for contrastive learning of visual representations. In Proceedings of the International Conference on Machine Learning, Vienna, Austria, 13–18 July 2020. [Google Scholar]
- Wang, X.; Girshick, R.; Gupta, A.; He, K. Non-Local Neural Networks. In Proceedings of the IEEE Conference on Computer Vision and Pattern Recognition (CVPR), Salt Lake City, UT, USA, 18–23 June 2018. [Google Scholar]
- Nicolas, C.; Massa, F.; Synnaeve, G.; Usunier, N.; Kirillov, A.; Zagoruyko, S. End-to-end object detection with transformers. In Proceedings of the European Conference on Computer Vision, Glasgow, UK, 23–28 August 2020. [Google Scholar]
- Ramachandran, P.; Parmar, N.; Vaswani, A.; Bello, I.; Levskaya, A.; Shlens, J. Stand-Alone Self-Attention in Vision Models. arXiv 2019, arXiv:2010.11929. [Google Scholar]
- Kolesnikov, A.; Beyer, L.; Zhai, X.; Puigcerver, J.; Yung, J.; Gelly, S.; Houlsby, N. Big Transfer (BiT): General Visual Representation Learning. In Proceedings of the European Conference on Computer Vision, Glasgow, UK, 23–28 August 2020. [Google Scholar]
- Tan, M.; Le, Q. Efficientnet: Rethinking model scaling for convolutional neural networks. In Proceedings of the International Conference on Machine Learning, Long Beach, CA, USA, 9–15 June 2019. [Google Scholar]
- Alexander, K.; Zhai, X.; Beyer, L. Revisiting self-supervised visual representation learning. In Proceedings of the IEEE/CVF Conference on Computer Vision and Pattern Recognition, Long Beach, CA, USA, 15–20 June 2019. [Google Scholar]
- Pham, H.; Dai, Z.; Xie, Q.; Luong, M.-T.; Le, Q. Meta pseudo labels. arXiv 2020, arXiv:2003.10580. [Google Scholar]
- Zoph, B.; Ghiasi, G.; Lin, T.-Y.; Cui, Y.; Liu, H.; Cubuk, E.; Le, Q. Rethinking Pre-training and Self-training. arXiv 2020, arXiv:2006.06882. [Google Scholar]
- Tian, Y.; Krishnan, D.; Isola, P. Contrastive multiview coding. arXiv 2019, arXiv:1906.05849. [Google Scholar]
- Oord, A.v.d.; Li, Y.; Vinyals, O. Representation Learning with Contrastive Predictive Coding. arXiv 2018, arXiv:1807.03748. [Google Scholar]
- Phuc, L.-K.; Healy, G.; Smeaton, A. Contrastive representation learning: A framework and review. IEEE Access 2020, 8, 193907–193934. [Google Scholar]
- Spyros, G.; Singh, P.; Komodakis, N. Unsupervised representation learning by predicting image rotations. arXiv 2018, arXiv:1803.07728. [Google Scholar]
- Phillip, I.; Zoran, D.; Krishnan, D.; Adelson, E. Learning visual groups from co-occurrences in space and time. arXiv 2015, arXiv:1511.06811. [Google Scholar]
- Mehdi, N.; Favaro, P. Unsupervised learning of visual representations by solving jigsaw puzzles. In Proceedings of the European Conference on Computer Vision, Amsterdam, The Netherlands, 11–14 October 2016; pp. 69–84. [Google Scholar]
- Hjelm, D.; Fedorov, A.; Lavoie-Marchildon, S.; Grewal, K.; Bachman, P.; Trischler, A.; Bengio, Y. Learning deep representations by mutual information estimation and maximization. arXiv 2018, arXiv:1808.06670. [Google Scholar]
- Michael, T.; Djolonga, J.; Rubenstein, P.; Gelly, S.; Lucic, M. On mutual information maximization for representation learning. arXiv 2019, arXiv:1907.13625. [Google Scholar]
- Wang, T.; Isola, P. Understanding contrastive representation learning through alignment and uniformity on the hypersphere. In Proceedings of the International Conference on Machine Learning, Vienna, Austria, 13–18 July 2020. [Google Scholar]
- Chen, T.; Li, L. Intriguing Properties of Contrastive Losses. arXiv 2020, arXiv:2011.02803. [Google Scholar]
- Tian, Y.; Sun, C.; Poole, B.; Krishnan, D.; Schmid, C.; Isola, P. What makes for good views for contrastive learning. arXiv 2020, arXiv:2005.10243. [Google Scholar]
- Senthil, P.; Gupta, A. Demystifying contrastive self-supervised learning: Invariances. arXiv 2020, arXiv:2007.13916. [Google Scholar]
- Prannay, K.; Teterwak, P.; Wang, C.; Sarna, A.; Tian, Y.; Isola, P.; Maschinot, A.; Liu, C.; Krishna, D. Supervised contrastive learning. arXiv 2020, arXiv:2004.11362. [Google Scholar]
- Yang, Y.; Gitman, I.; Ginsburg, B. Large batch training of convolutional networks. arXiv 2017, arXiv:1708.03888. [Google Scholar]
- Shirish, K.N.; Mudigere, D.; Nocedal, J.; Smelyanskiy, M.; Tang, P.T.P. On large-batch training for deep learning: Generalization gap and sharp minima. In Proceedings of the International Conference on Learning Representations, Toulon, France, 24–26 April 2017. [Google Scholar]
- Christian, S.; Vanhoucke, V.; Ioffe, S.; Shlens, J.; Wojna, Z. Rethinking the inception architecture for computer vision. In Proceedings of the IEEE Conference on Computer Vision and Pattern Recognition, Las Vegas, NV, USA, 27–30 June 2016. [Google Scholar]
- Chuan, G.; Pleiss, G.; Sun, Y.; Weinberger, K. On Calibration of Modern Neural Networks. In Proceedings of the International Conference on Machine Learning, Sydney, Australia, 6–11 August 2017. [Google Scholar]
- Hermans, A.; Leibe, B.; Beyer, L. In Defense of the Triplet Loss for Person Re-Identification. arXiv 2017, arXiv:1703.07737. [Google Scholar]
- Peter, W.; Branson, S.; Mita, T.; Wah, C.; Schroff, F.; Belongie, S.; Perona, P. Caltech-UCSD Birds 200; California Institute of Technology: Pasadena, CA, USA, 2010. [Google Scholar]
- Krause, J.; Stark, M.; Deng, J.; Li, F.-F. 3D Object Representations for Fine-Grained Categorization. In Proceedings of the 4th IEEE Workshop on 3D Representation and Recognition, Sydney, NSW, Australia, 2–8 December 2013. [Google Scholar]
- Song, H.O.; Xiang, Y.; Jegelka, S.; Savarese, S. Deep Metric Learning via Lifted Structured Feature Embedding. In Proceedings of the IEEE Conference on Computer Vision and Pattern Recognition, Las Vegas, NV, USA, 27–30 June 2016. [Google Scholar]
- Loshchilov, I.; Hutter, F. Decoupled weight decay regularization. In Proceedings of the International Conference on Learning Representations, New Orleans, LA, USA, 6 May 2019. [Google Scholar]


| Model Name | Params | FLOPS | Top-1 (%) |
|---|---|---|---|
| ViT-B-16 | 86 M | 16.85 G | 84.15 |
| BiT-M-R152x4 | 68 M | 68.59 M | 85.39 |
| Efficient-B7 | 66 M | 87.07 M | 84.3 |
| Dataset | Recall@k | mAP | ||||
|---|---|---|---|---|---|---|
| 1 | 2 | 3 | 4 | 5 | ||
| CAR196 | 0.8541 | 0.9218 | 0.9661 | 0.9739 | 0.9817 | 0.8804 |
| CUB200-2011 | 0.9414 | 0.9687 | 0.9765 | 0.9765 | 0.9765 | 0.9379 |
| SOP super-class | 0.9806 | 0.9891 | 0.9932 | 0.9952 | 0.9966 | 0.9141 |
| 1 | 10 | 100 | 500 | 1000 | ||
| SOP class | 0.9470 | 0.9867 | 0.9962 | 0.9986 | 0.9986 | |
| Model Name | Recall@k | mAP | ||||
|---|---|---|---|---|---|---|
| 1 | 2 | 3 | 4 | 5 | ||
| ViT-B-16 | 0.9414 | 0.9687 | 0.9765 | 0.9765 | 0.9765 | 0.9379 |
| BiT-M-R152x4 | 0.9296 | 0.9648 | 0.9726 | 0.9765 | 0.9804 | 0.9040 |
| Efficient-B7 | 0.7226 | 0.8242 | 0.8828 | 0.9062 | 0.9257 | 0.7906 |
| Dimensions | Recall@k | mAP | ||||
|---|---|---|---|---|---|---|
| 1 | 2 | 3 | 4 | 5 | ||
| 64 | 0.9296 | 0.9843 | 0.9843 | 0.9843 | 0.9843 | 0.9507 |
| 128 | 0.9414 | 0.9648 | 0.9765 | 0.9765 | 0.9804 | 0.9438 |
| 256 | 0.9453 | 0.9726 | 0.9843 | 0.9843 | 0.9882 | 0.9555 |
| 512 | 0.9101 | 0.9687 | 0.9882 | 0.9882 | 0.9960 | 0.9339 |
| 1024 | 0.9257 | 0.9570 | 0.9726 | 0.9726 | 0.9765 | 0.9336 |
| Loss Components | Recall@k | mAP | ||||
|---|---|---|---|---|---|---|
| 1 | 2 | 3 | 4 | 5 | ||
| 0.6210 | 0.7070 | 0.7382 | 0.7890 | 0.8164 | 0.6026 | |
| 0.6484 | 0.7265 | 0.7773 | 0.7890 | 0.8046 | 0.6214 | |
| 0.8437 | 0.8984 | 0.9375 | 0.9492 | 0.9570 | 0.8445 | |
| 0.8789 | 0.9531 | 0.9726 | 0.9726 | 0.9726 | 0.8929 | |
| 0.9023 | 0.9531 | 0.9726 | 0.9765 | 0.9765 | 0.9120 | |
| 0.9414 | 0.9687 | 0.9765 | 0.9765 | 0.9765 | 0.9379 | |
| 0.9296 | 0.9804 | 0.9804 | 0.9843 | 0.9882 | 0.9268 | |
| 0.8867 | 0.9296 | 0.9531 | 0.9531 | 0.9531 | 0.8910 | |
| Model Name | Recall@k | mAP | ||||
|---|---|---|---|---|---|---|
| 1 | 2 | 3 | 4 | 5 | ||
| ViT-class | 0.94140625 | 0.96875 | 0.976563 | 0.976563 | 0.976563 | 0.937995 |
| ViT-1 | 0.8984375 | 0.949219 | 0.960938 | 0.972656 | 0.976563 | 0.897331 |
| ViT-128 | 0.92578125 | 0.96875 | 0.980469 | 0.992188 | 0.992188 | 0.918958 |
| ViT-25 | 0.94921875 | 0.988281 | 0.992188 | 0.992188 | 0.996094 | 0.947578 |
| CGD | 0.875 | 0.923611 | 0.947917 | 0.958333 | 0.96875 | 0.857604 |
| No fine-tuning | 0.55078125 | 0.648438 | 0.6875 | 0.726563 | 0.757813 | 0.540013 |
Publisher’s Note: MDPI stays neutral with regard to jurisdictional claims in published maps and institutional affiliations. |
© 2021 by the authors. Licensee MDPI, Basel, Switzerland. This article is an open access article distributed under the terms and conditions of the Creative Commons Attribution (CC BY) license (https://creativecommons.org/licenses/by/4.0/).
Share and Cite
Dang, T.-V.; Yu, G.-H.; Kim, J.-Y. Revisiting Low-Resolution Images Retrieval with Attention Mechanism and Contrastive Learning. Appl. Sci. 2021, 11, 6783. https://doi.org/10.3390/app11156783
Dang T-V, Yu G-H, Kim J-Y. Revisiting Low-Resolution Images Retrieval with Attention Mechanism and Contrastive Learning. Applied Sciences. 2021; 11(15):6783. https://doi.org/10.3390/app11156783
Chicago/Turabian StyleDang, Thanh-Vu, Gwang-Hyun Yu, and Jin-Young Kim. 2021. "Revisiting Low-Resolution Images Retrieval with Attention Mechanism and Contrastive Learning" Applied Sciences 11, no. 15: 6783. https://doi.org/10.3390/app11156783
APA StyleDang, T.-V., Yu, G.-H., & Kim, J.-Y. (2021). Revisiting Low-Resolution Images Retrieval with Attention Mechanism and Contrastive Learning. Applied Sciences, 11(15), 6783. https://doi.org/10.3390/app11156783