Article

The Effect of Oxygen Admixture with Argon Discharges on the Impact Parameters of Atmospheric Pressure Plasma Jet Characteristics

by
Atif H. Asghar
1 and
Ahmed Rida Galaly
2,3,*
1
Department of Environmental and Health Research, The Custodian of the Two Holy Mosques Institute for Hajj and Umrah Research, Umm Al-Qura University, Makkah 24381, Saudi Arabia
2
Department of Engineering Science, Faculty of Community, Umm Al-Qura University, Makkah 24381, Saudi Arabia
3
Department of Physics, Faculty of Science, Beni-Suef University, Beni-Suef 62521, Egypt
*
Author to whom correspondence should be addressed.
Appl. Sci. 2021, 11(15), 6870; https://doi.org/10.3390/app11156870
Submission received: 10 May 2021 / Revised: 9 July 2021 / Accepted: 12 July 2021 / Published: 26 July 2021
(This article belongs to the Special Issue Recent Advances in Atmospheric-Pressure Plasma Technology)

Abstract

:
Dry argon (Ar) discharge and wet oxygen/argon (O2/Ar) admixture discharge for alternating current atmospheric pressure plasma jets (APPJs) were studied for Ar discharges with flow rates ranging from 0.2 to 4 slm and for O2/Ar discharges with different O2 ratios and flow rates ranging from 2.5 to 15 mslm. The voltage–current waveform signals of APPJ discharge, gas flow rate, photo-imaging of the plasma jet length and width, discharge plasma power, axial temperature distribution, optical emission spectra, and irradiance were investigated. Different behavior for varying oxygen content in the admixture discharge was observed. The temperature recognizably decreased, axially, far away from the nozzle of the jet as the flow rate of dry argon decreased. Similar behavior was observed for wet argon but with a lower temperature than for dry argon. The optical emission spectra and the dose rate of irradiance of a plasma jet discharge were investigated as a function of plasma jet length, for dry and wet Ar discharges, to determine the data compatible with the International Commission on Non-Ionizing Radiation Protection (ICNIRP) data for irradiance exposure limits of the skin, which are suitable for the disinfection of microbes on the skin without harmful effects, equivalent to 30 μJ/mm2.

1. Introduction

Plasma, in physical science, is the fourth state of matter. In technological applications, plasma can exist in different forms and can be created as thermal and non-thermal plasma. Plasma technology is improving in many applications such as medical, industrial, and environmental applications [1].
The deposition of thin films, the treatment of organic and inorganic surfaces, the surface modification of polymer films, and the processing of materials are commonly conducted using plasma. Using plasma in such applications is considered to provide the most uniform and controlled treatment [2].
Plasma technology is very rich in its applications, especially in the killing of microorganisms on rigid or smooth surfaces [3]. Many researchers have studied glow discharge plasma at atmospheric pressure because of its technological simplicity; no vacuum system is needed, a greater choice of supply gases is available, and the technology is inexpensive [4].
Cold plasma applications are acceptable from an ecological and economical point of view. The physical application of cold plasma as a modern disinfection method is of great importance because of increasingly strict environmental demands [5].
Low-temperature gas plasma applications dealing with the protocols of killing microorganisms have opened new fields in biotechnology applications. Recently, glow discharge plasma at atmospheric pressure has attracted significant attention, leading to many evaluations of the disinfection of bacteria by air plasmas at atmospheric pressure such as medical, environmental, and industrial evaluations [6].
The configurations, characteristics, and applications of a cold plasma jet emerging by APPJ have attracted much attention: (i) configurations [7,8], such as electrode design, gas type, emerging plasma frequency, and flow rate; (ii) characteristics of the jet [9,10], such as length, width, temperature, emission spectra, irradiance, direct and indirect exposure, consumed energy, and consumed power; (iii) applications [11,12], such as the inactivation of microbes (water purification, sterilization, and wound healing), coating and etching (polymeric surface modification and synthesis of nanostructures), and medical applications (teeth bleaching, skin treatments, and cancer treatment).
Moreover, there are important factors that affect the APPJ performance, such as tube dimensions and powering characteristics: (i) tube dimensions include material, shape, length, and the outer and inner diameter of the tube [13]; (ii) powering characteristics include power source, applied voltage, and frequency [14].
Many publications have discussed the various applications of APPJs, such as the effect of the antimicrobial agent ratio on Escherichia coli and its application in fresh-cut cucumbers by studying the survival curve shapes of different microbes, using the effects of different impact parameters on the characteristics of the plume emerging from the APPJ [15,16,17].
The present work represents the characteristics of the cold plasma plume emerging from the APPJ under an alternating current (AC); these characteristics were studied by measuring the optical and electrical properties of the APPJ. These properties included the discharge voltage and current, output plasma power, axial distribution of temperature, flow rate, jet length, jet width, emission intensity of the plume, emission spectra, and the amount of energy emitted at each wavelength per unit area from the plasma jet using different gases, such as pure argon and an admixture of oxygen and argon at different ratios.

2. Experimental Set-Up and Procedures

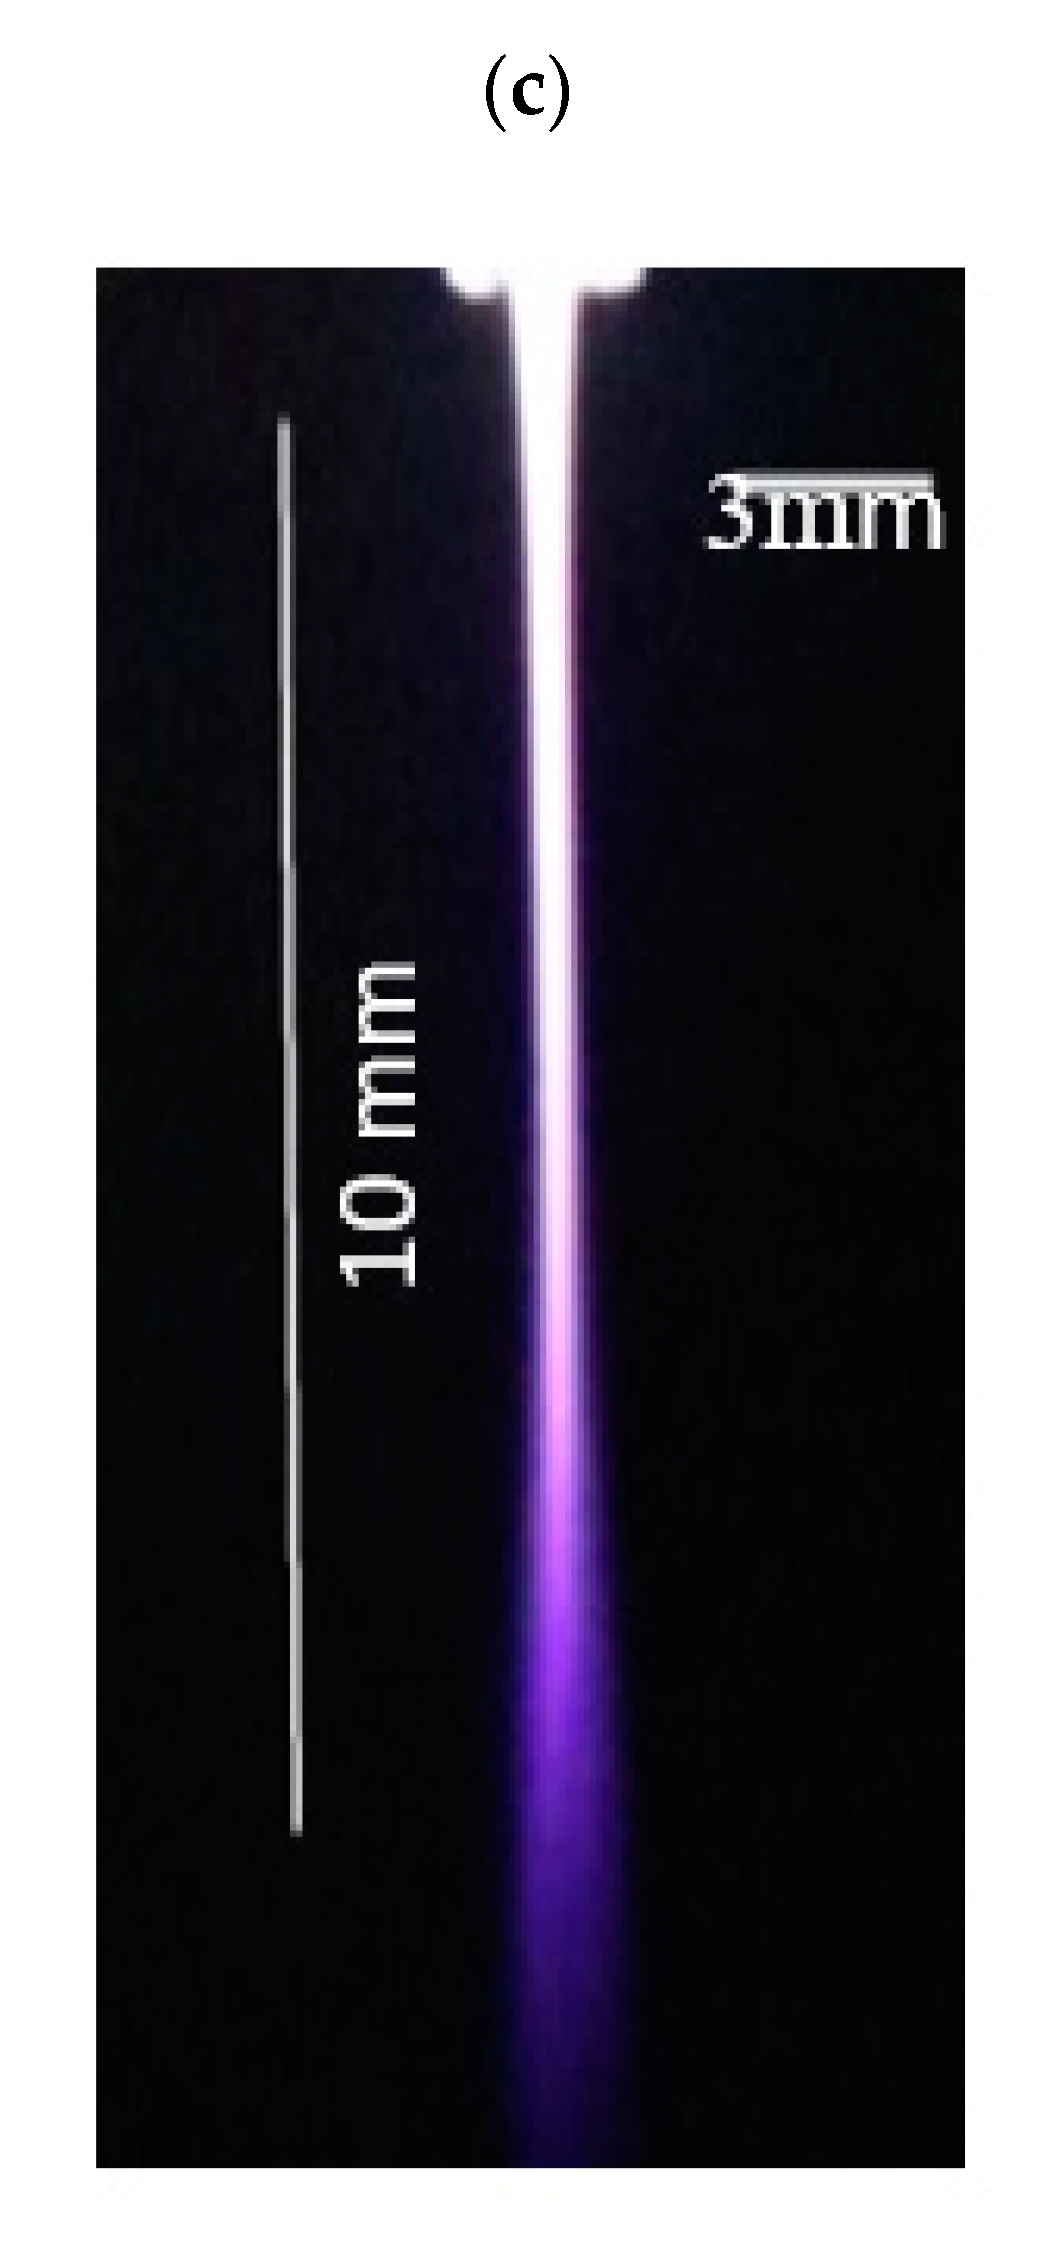
Figure 1a shows a systematic diagram of a non-thermal APPJ using Ar and O2/Ar admixture discharges. The ceramic tube is the main part in the APPJ, with 2 mm and 1.5 mm for the outer and inner diameters, respectively. The APPJ dimensions and powering characteristics are given in Table 1. The APPJ consists of three electrodes: two isolated hollow cylindrical copper electrodes around the ceramic tube, with 20 mm separation from each other, one electrode powered by an AC high-voltage power source with a voltage ranging from 2.5 to 25 kV and a variable frequency of up to 60 kHz, and another electrode grounded at 40 mm away from the nozzle and 20 mm from the high voltage electrode. Moreover, the aluminum inner capillary with a 1.5 mm diameter represents the third electrode of the discharge, with the whole ceramic tube length ended with the nozzle and described in Figure 1a with the dotted line inside the tube, also described briefly in our previous work [18]. Gas flows into the ceramic tube from two gas inlets, one for argon gas and the other for oxygen to admix inside the aluminum capillary tube, which is maintained in a floating potential.
The flow rates were measured using a volumetric flow meter connected to a needle valve to control the flow rates. The APPJ system creates discharges using: (i) flow rates ranging from 0.2 to 4 slm for Ar discharges (dry argon); (ii) O2/Ar admixture discharges (wet argon) with different O2 ratio admixtures, as shown in Table 2.
The thermal, electrical, spectroscopical, and photographical characteristics of plasmas generated by the APPJ were measured: (i) measurements used a digital Canon camera (Ota City, Tokyo, Japan) with an exposure time of 40 ms for fast-imaging the emerging jet afterglow discharge in a darkened laboratory. The length and width of the jet measurements can be accurately measured relative to the ground electrode as a reference (the ground electrode with length and width 10 and 3 mm, respectively), as shown in Figure 1b. (ii) Jet dimensions can be calculated from APPJ images according to the dimensions of the ground electrode, as a calibration scale, using Microsoft Paint, as shown in Figure 1c. The calibrations and measurements are discussed briefly in our previous work, ref. [18]. (iii) An avaspec-2048 spectrometer (Louisville, CO, USA) with a charge coupled device (CCD) detector was used to measure the axial distribution emission spectra of the APPJ, from the nozzle to far away. The spectral range of the spectrometer was 200 to 1100 nm with a spectral resolution of 1.4 nm. A Fiber Optics Cable (FOC) was connected to the spectrometer and collected emitted light from the APPJ via a lens at the end of the FOC. (iv) A Fluoroptic thermometer (Model No.604, Luxtron Corporation, Santa Clara, CA, USA) was used to measure the average plasma temperature for Ar and O2/Ar discharges. (v) A Tektronix P6015A probe (Beaverton, OR, USA) equipped with a high voltage probe and a current probe was used to measure the applied voltage U (kV) and discharge current I (mA) of the jet. (v) The dose rate of the APPJ plume irradiance per unit area was measured using an 818-RAD irradiance and dosage sensor (MKS/Newport, Model No.: 818-RAD, Newport Beach, CA, USA), compatible with a 1919-R optical power meter with the following characteristics: 8 mm aperture, 200–850 nm spectral wavelength range, 100–250 mW/cm2 irradiance range, and 30 W/cm2 maximum power density.
Different gas admixtures were used: a mixture of oxygen with argon at different ratios, where the mass flow rate of each gas was controlled and the gases flowed into a ceramic tube. Waveform signals of APPJ discharge were recorded using a 350 MHz digital oscilloscope, for which the applied voltage was measured using a Tektronix P6015A high-voltage probe; the discharge current was observed by measuring the voltage over a resistance equivalent to 33 kΩ. The average discharge power can be calculated using the voltage–current waveforms of the discharges and integrating the product of the discharge voltage U (kV) and discharge current I (mA) over one cycle as in Equation (1):
P = f   t 0 t 0 + T U ( t )   I ( t )   d t .
P is the average power of the discharge, and f = 1 T ; f and T are the frequency and period of the discharge, respectively. In the case of a sinusoidal waveform, Equation (1) can be written [19]:
P = I rms   U rms   cos ( φ ) ,
where Irms = I 0 2 and U rms = U 0 2 are the root mean square (rms) current and rms voltage, respectively. I0 and U0 are the peak values of current and voltage, respectively, and φ is the phase angle between the discharge voltage and current.
The recent study in this article represents the control parameters of the plume generated by the APPJ using cold plasma. The measured jet parameters included length and width, power, applied voltage, pure argon concentration, and different admixtures of oxygen and argon plasma discharge.
The 3rd electrode with the narrow diameter, the powering characteristics, and gas flow rate contribute to:
a.
Control in the jet dimensions such as width, length, and covered area;
b.
Control in the lifetime of the discharge process mode, whether laminar flow mode or turbulent flow mode;
c.
Control in the heat impact emerging from the nozzle;
d.
Control in the antibacterial effect factors of culture media down the nozzle such as exposure time, optical emission spectra, and irradiance.

3. Results and Discussion

3.1. Voltage–Current Waveform Signals of APPJ Discharge

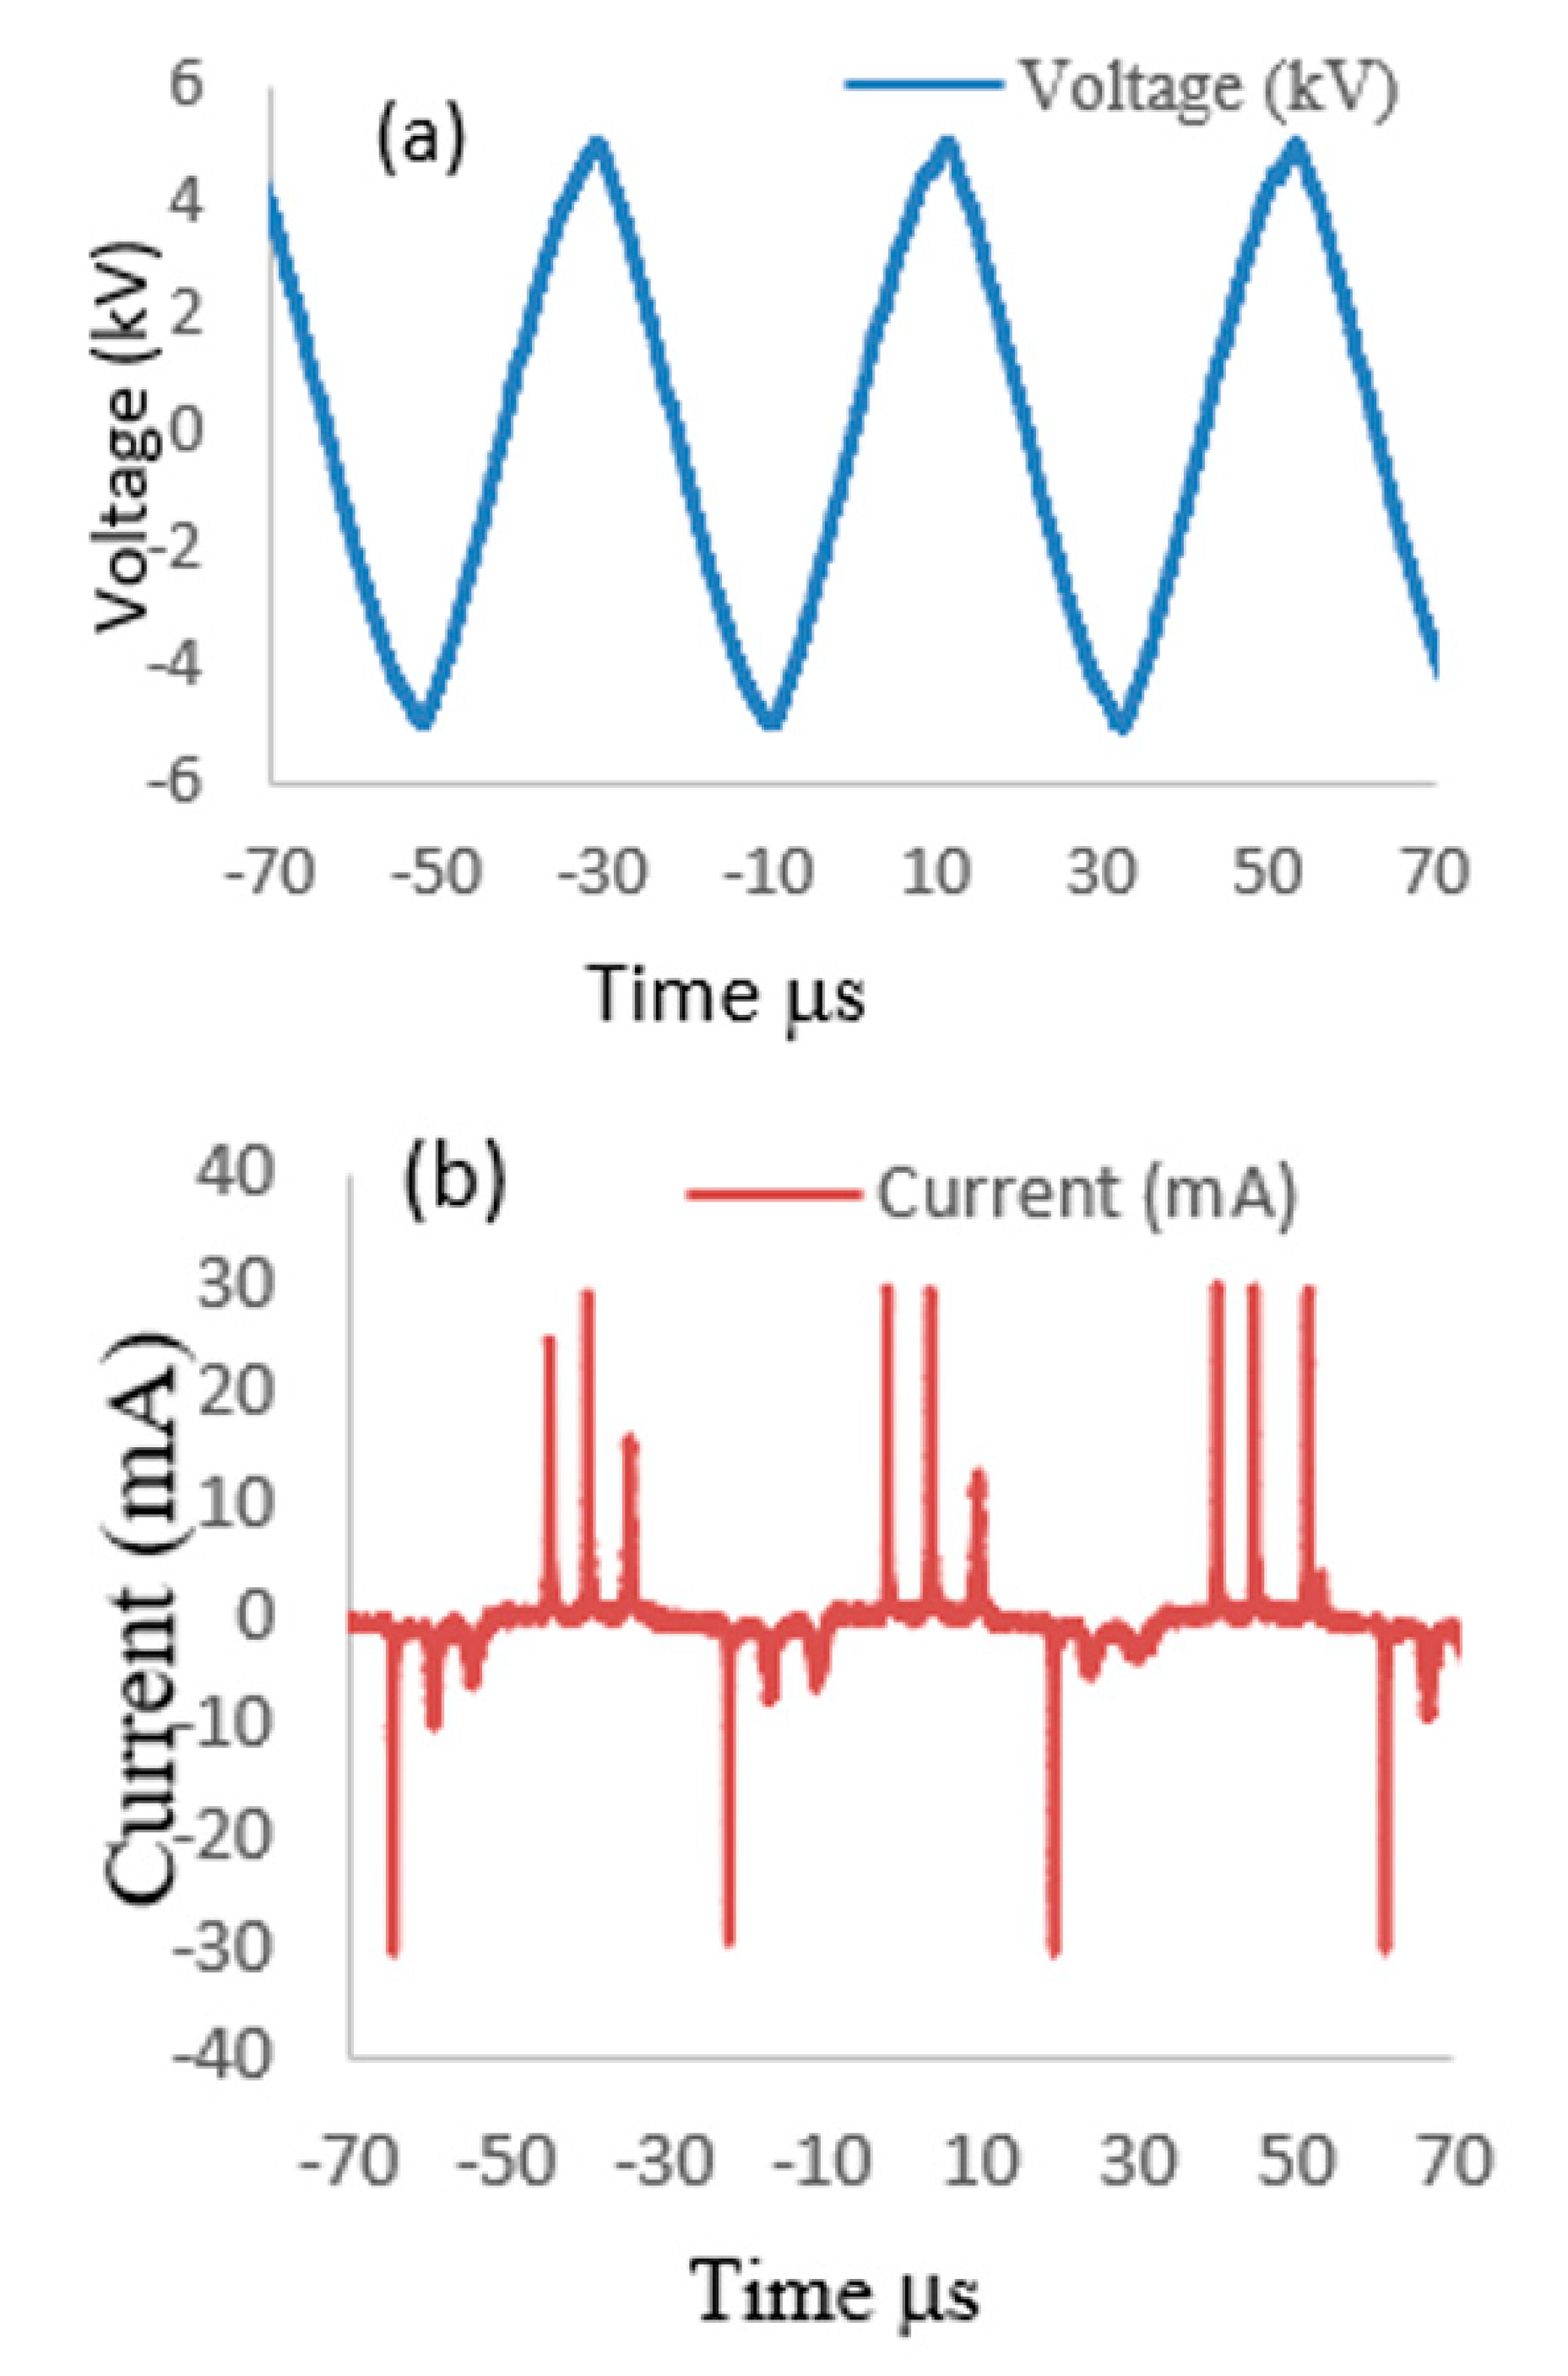
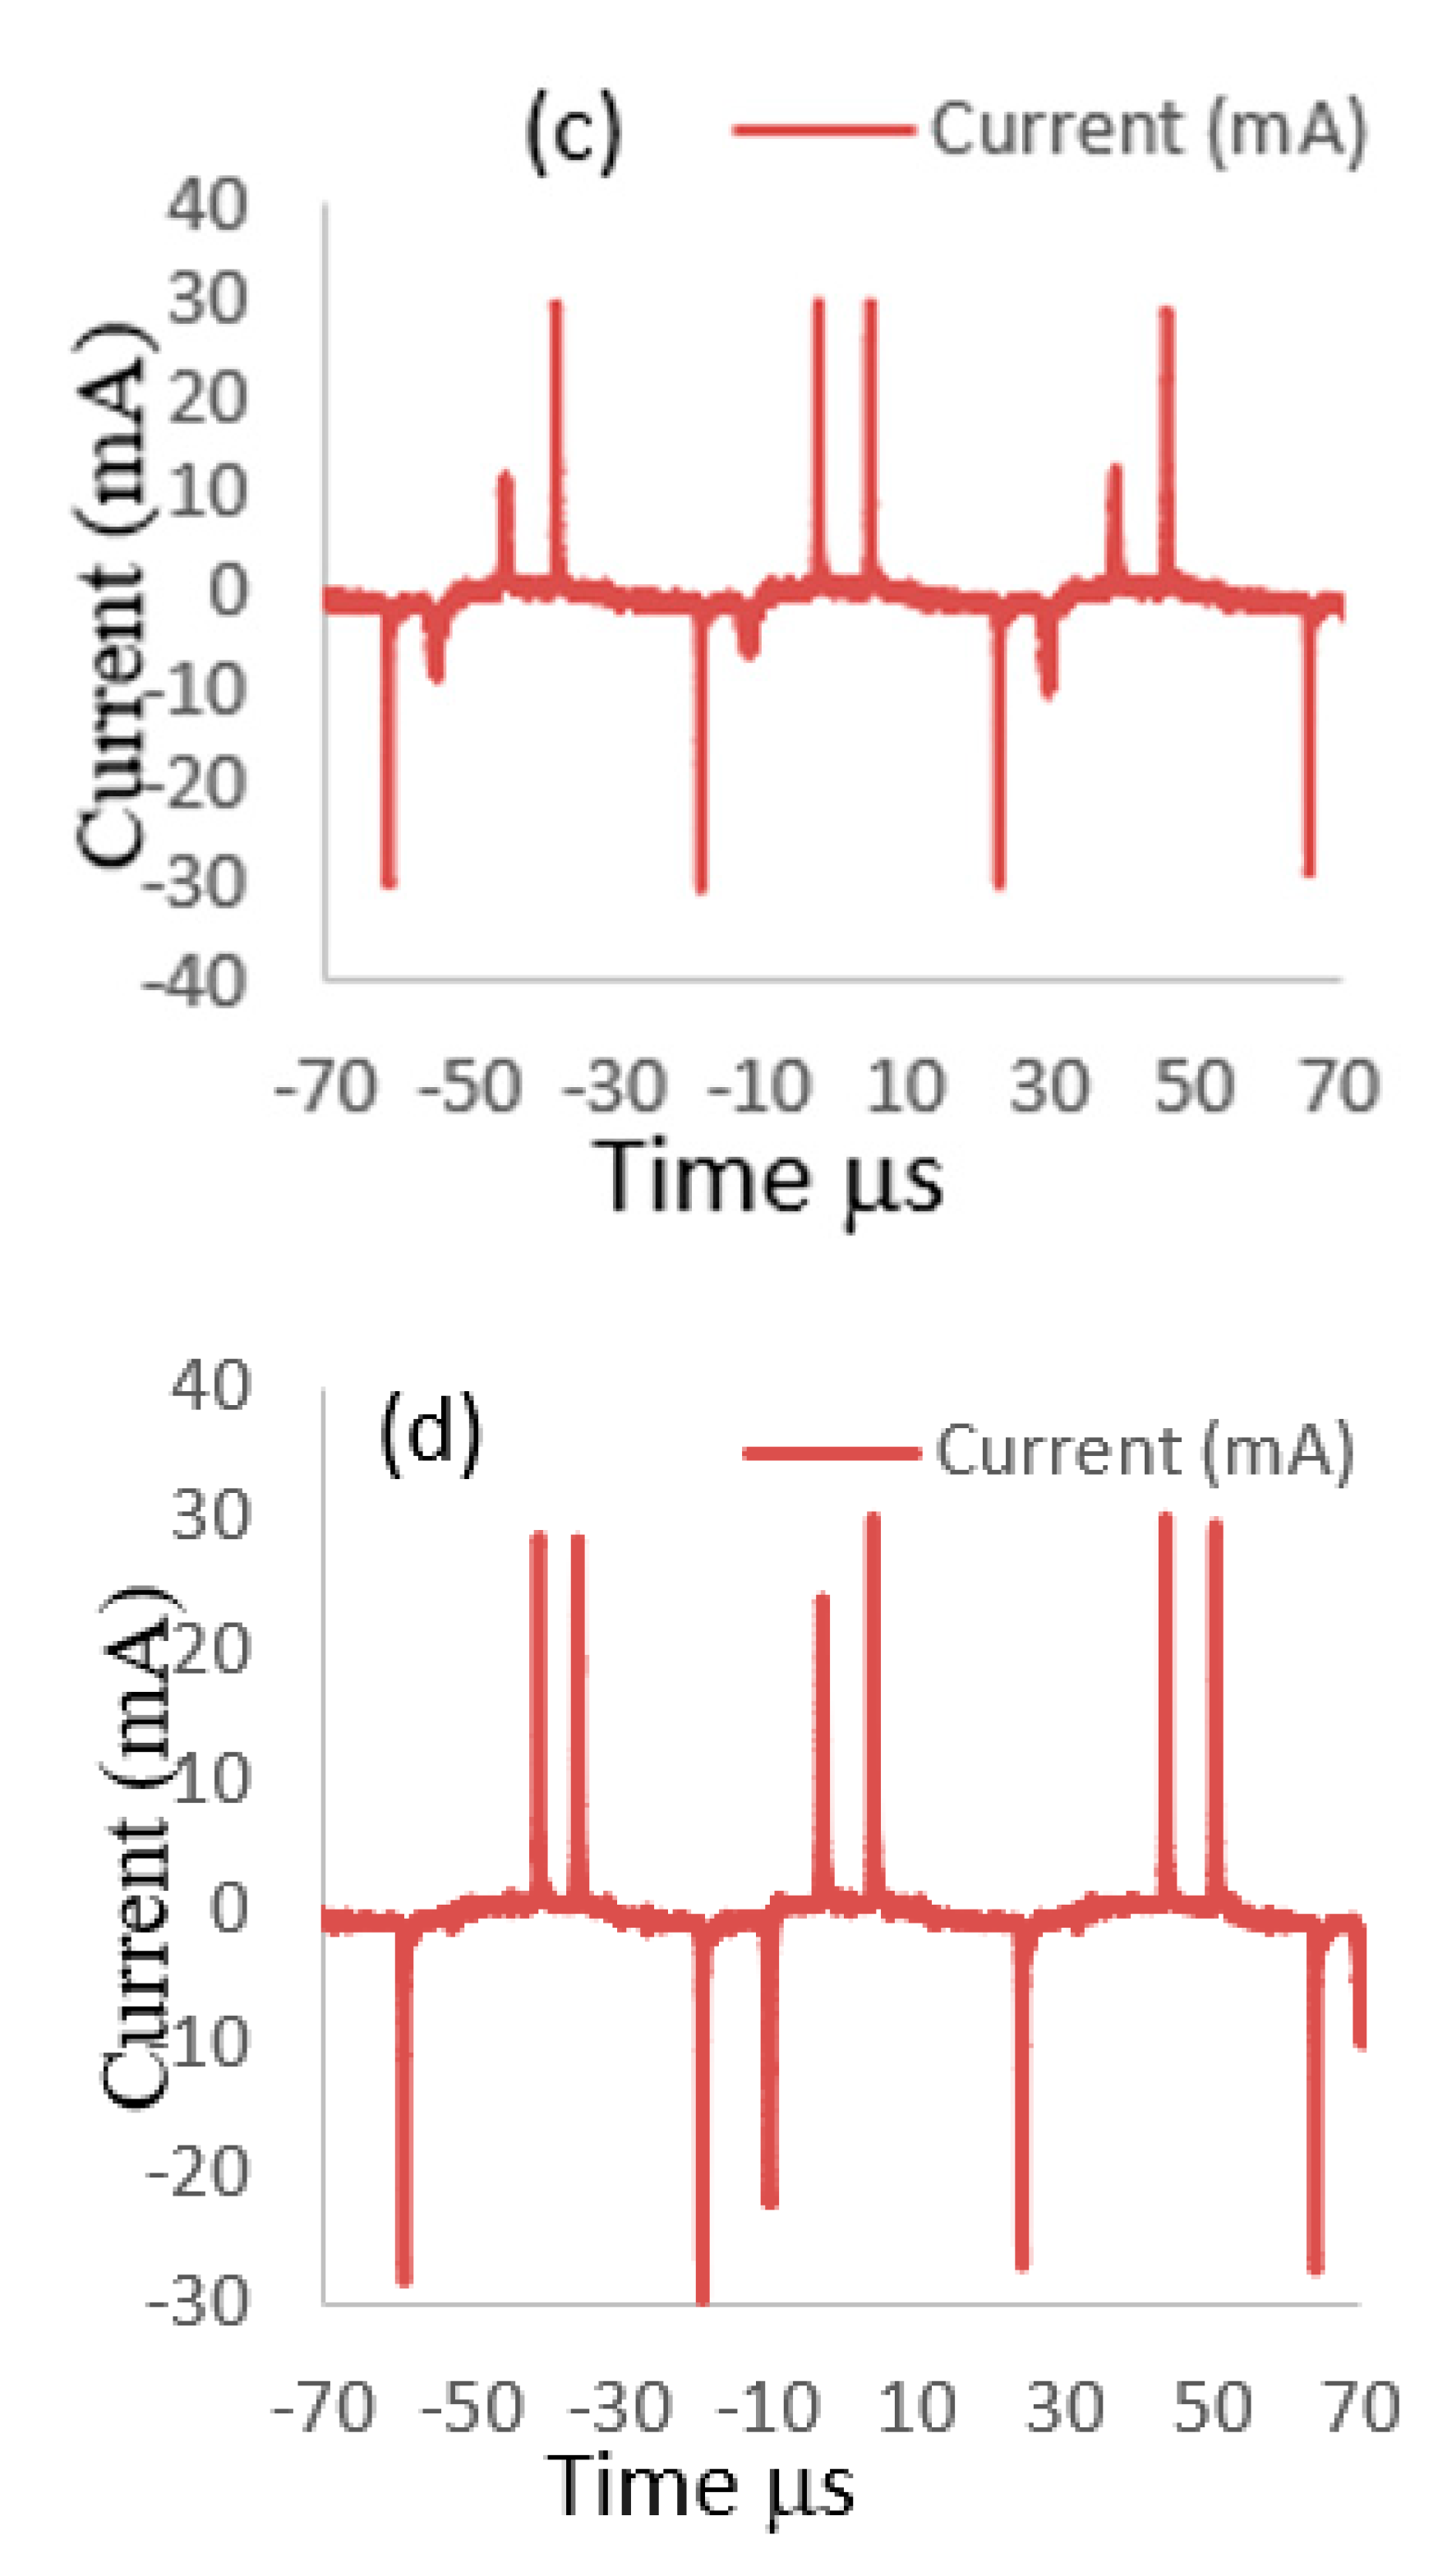
The electrical properties of APPJ discharge for dry argon (pure Ar) and different oxygen/argon admixtures (wet argon) were investigated. Figure 2a–d show the current–voltage waveform of the APPJ discharge where: (i) Figure 2a shows the voltage waveform, plus the current waveforms of the APPJ discharge as follows: (ii) Figure 2b shows an Ar flow rate of 1 slm and discharge plasma power of 2.5 W; (iii) Figure 2c shows an admixture of 1 slm Ar flow rate with 0.25% (O2) and a discharge plasma power of 1.77 W; and (iv) Figure 2d shows an admixture of 1 slm Ar flow rate with 1.5% (O2) and a discharge plasma power of 1.65 W.
Figure 2a shows that the applied voltage is sinusoidal with 11.2 kV as the peak-to-peak voltage. The discharge current (I mA) consists of a displacement current (Figure 2b–d) [20,21], three short peaks for pure argon (Figure 2b), and one or two peaks for the O2/Ar admixture (Figure 2c,d), appearing at every half cycle. Generally, these peaks appear because of the glow-like discharge when the plasma is formed [22,23]. The number of the current peaks decreased when the admixture of oxygen increased, as shown from Figure 2b to Figure 2d, due to the reduction in the sheath creation around the jet. The decreasing average discharge plasma power for increasing oxygen/argon ratios is attributed to increasing numbers of collisions among particles with an increasing flow rate; moreover, additional particles will contribute to energy exchange [24,25].

3.2. Gas Flow Rate

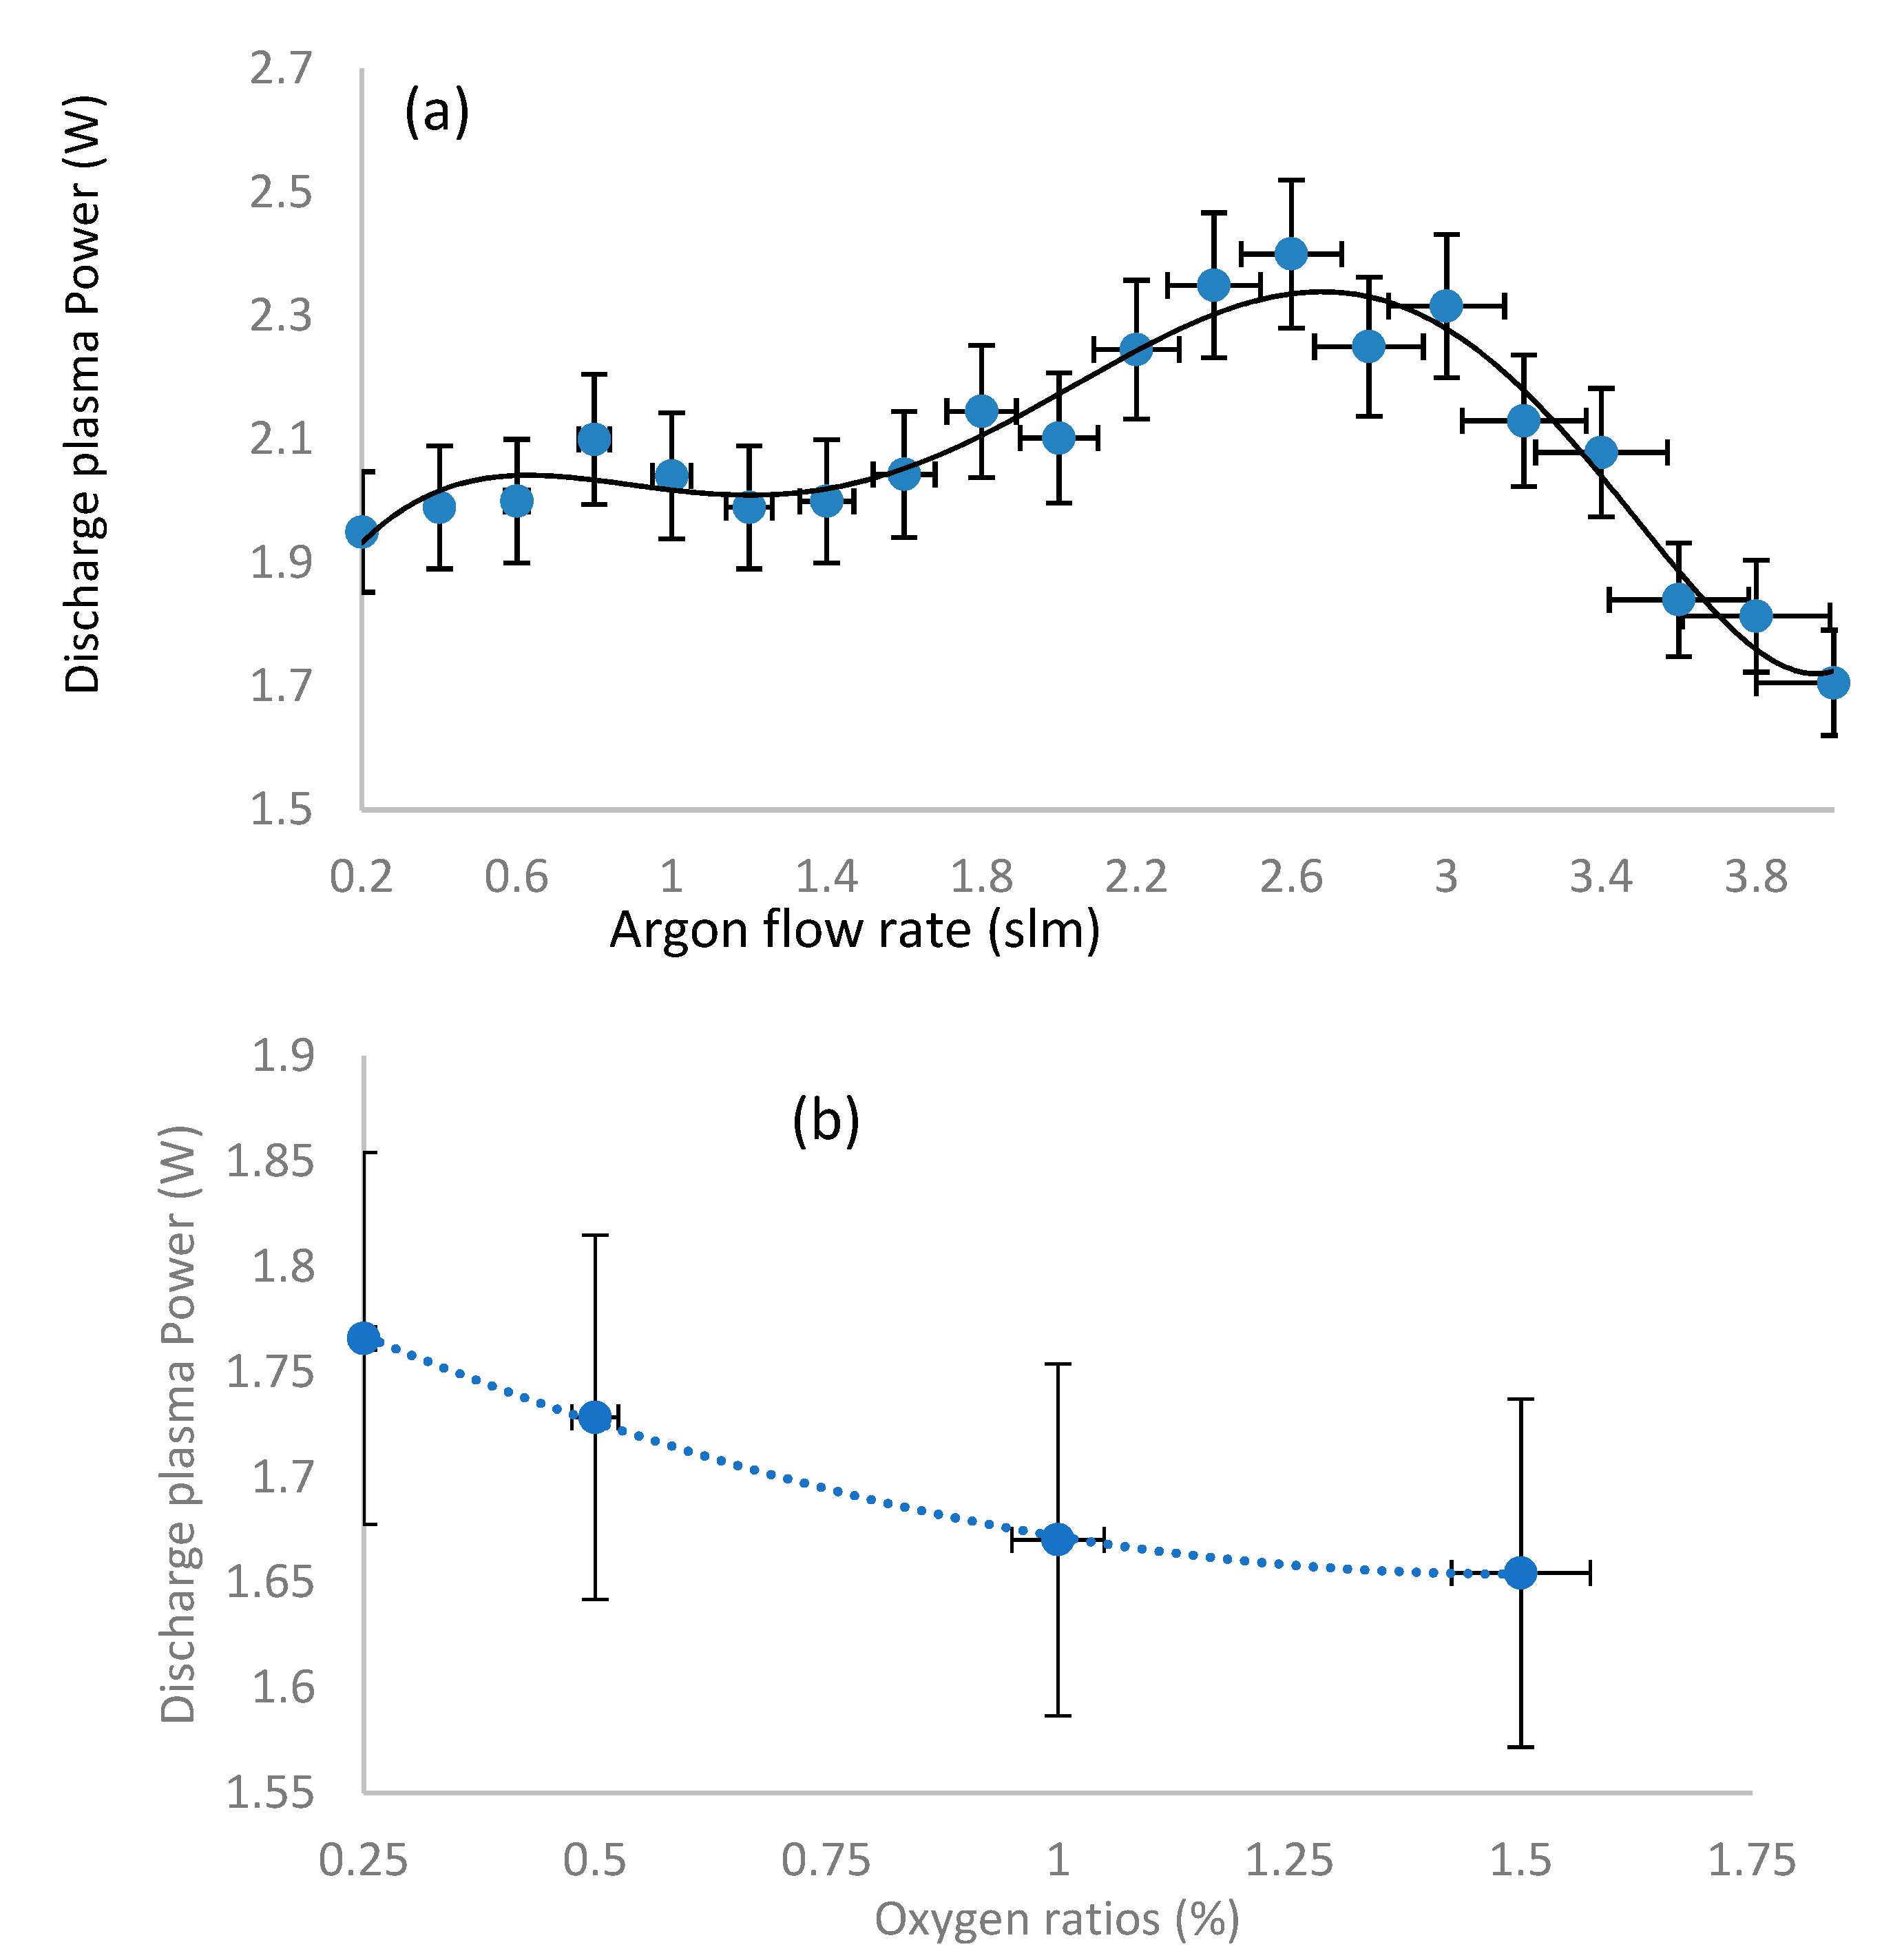
The discharge plasma power does not depend only on the applied peak-to-peak voltage, but also on the gas flow rate. The applied peak-to-peak voltage is limited to 11.2 kV for our experiment. Figure 3a shows the influence of the flow rate on the discharge plasma power for the emerging jet of pure argon discharge: the flow rate increases from 0.2 to 3 slm, and the argon discharge plasma power increases from 1.95 to 2.4 W. By increasing the argon flow rate further to 4 slm, the discharge plasma power begins to decrease, from 2.31 to 1.7 W [26]. Figure 3b shows that for oxygen/argon admixtures (see Table 2), the discharge plasma power of the emerging jet decreases from 1.75 to 1.65 W, for oxygen admixture ratios increasing from 0.25% to 1.5% [27]. As the oxygen percentages increases, ions, atoms, and free radicals are produced due to inelastic collisions, leading to losses in the discharge process and lower power than in the case of argon discharges. This is useful in sterilization and inactivation because of the longer interaction between the jet and the sample.

3.3. Length and Width of the Jet

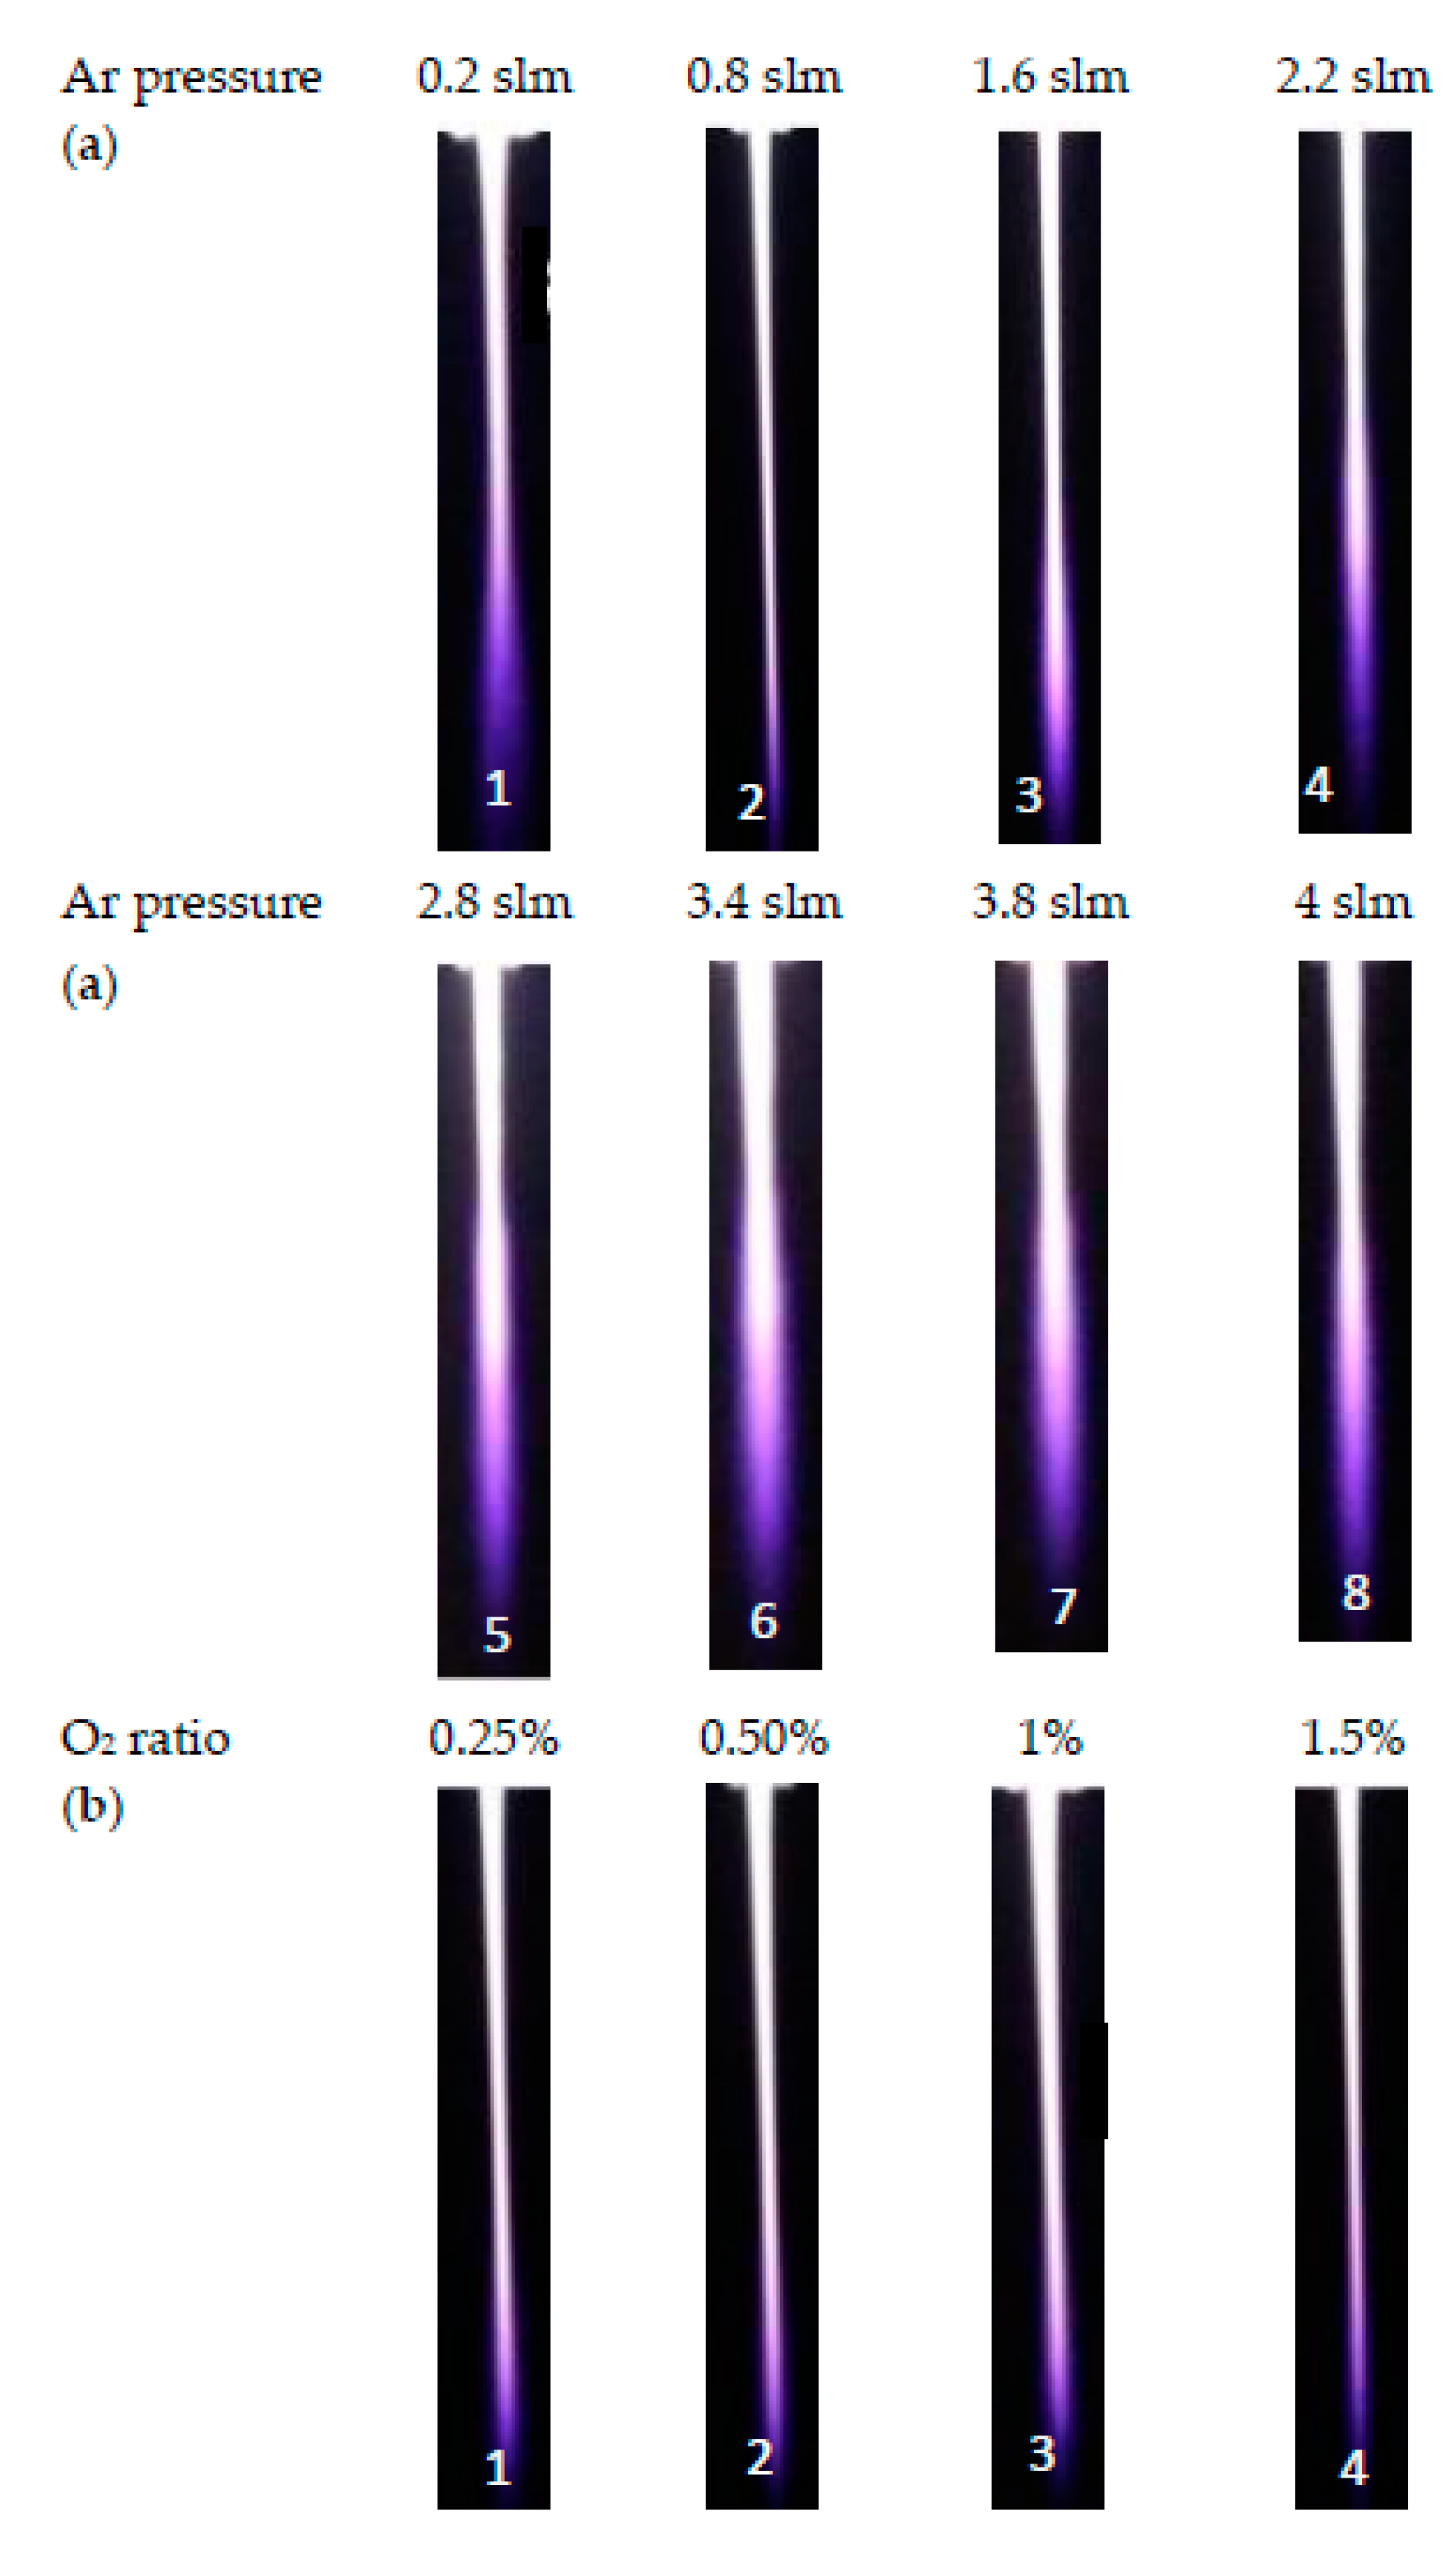
Measurement of the length and width of the jet of argon and oxygen/argon admixture discharges, for different flow rates and different discharge plasma powers of the emerging jet, can be performed by photo-imaging the plasma jet. Figure 4a represents eight photo images of an argon discharge as a function of flow rate (from 0.2 to 4 slm). Figure 4b represents four photo images of an oxygen/argon discharge as a function of oxygen ratio (from 0.25% to 1.5%). The images were taken in a darkened laboratory. All the photo images, depending on the calibrated length and width of the ground electrode (10 and 3 mm, respectively), as shown in Figure 1c, were taken as a reference for measuring the length and the width of the emerging jet. As shown in Figure 4, the jet is tilted and not vertical, which may be due to the sheath around the jet besides the edge effect of the jet.
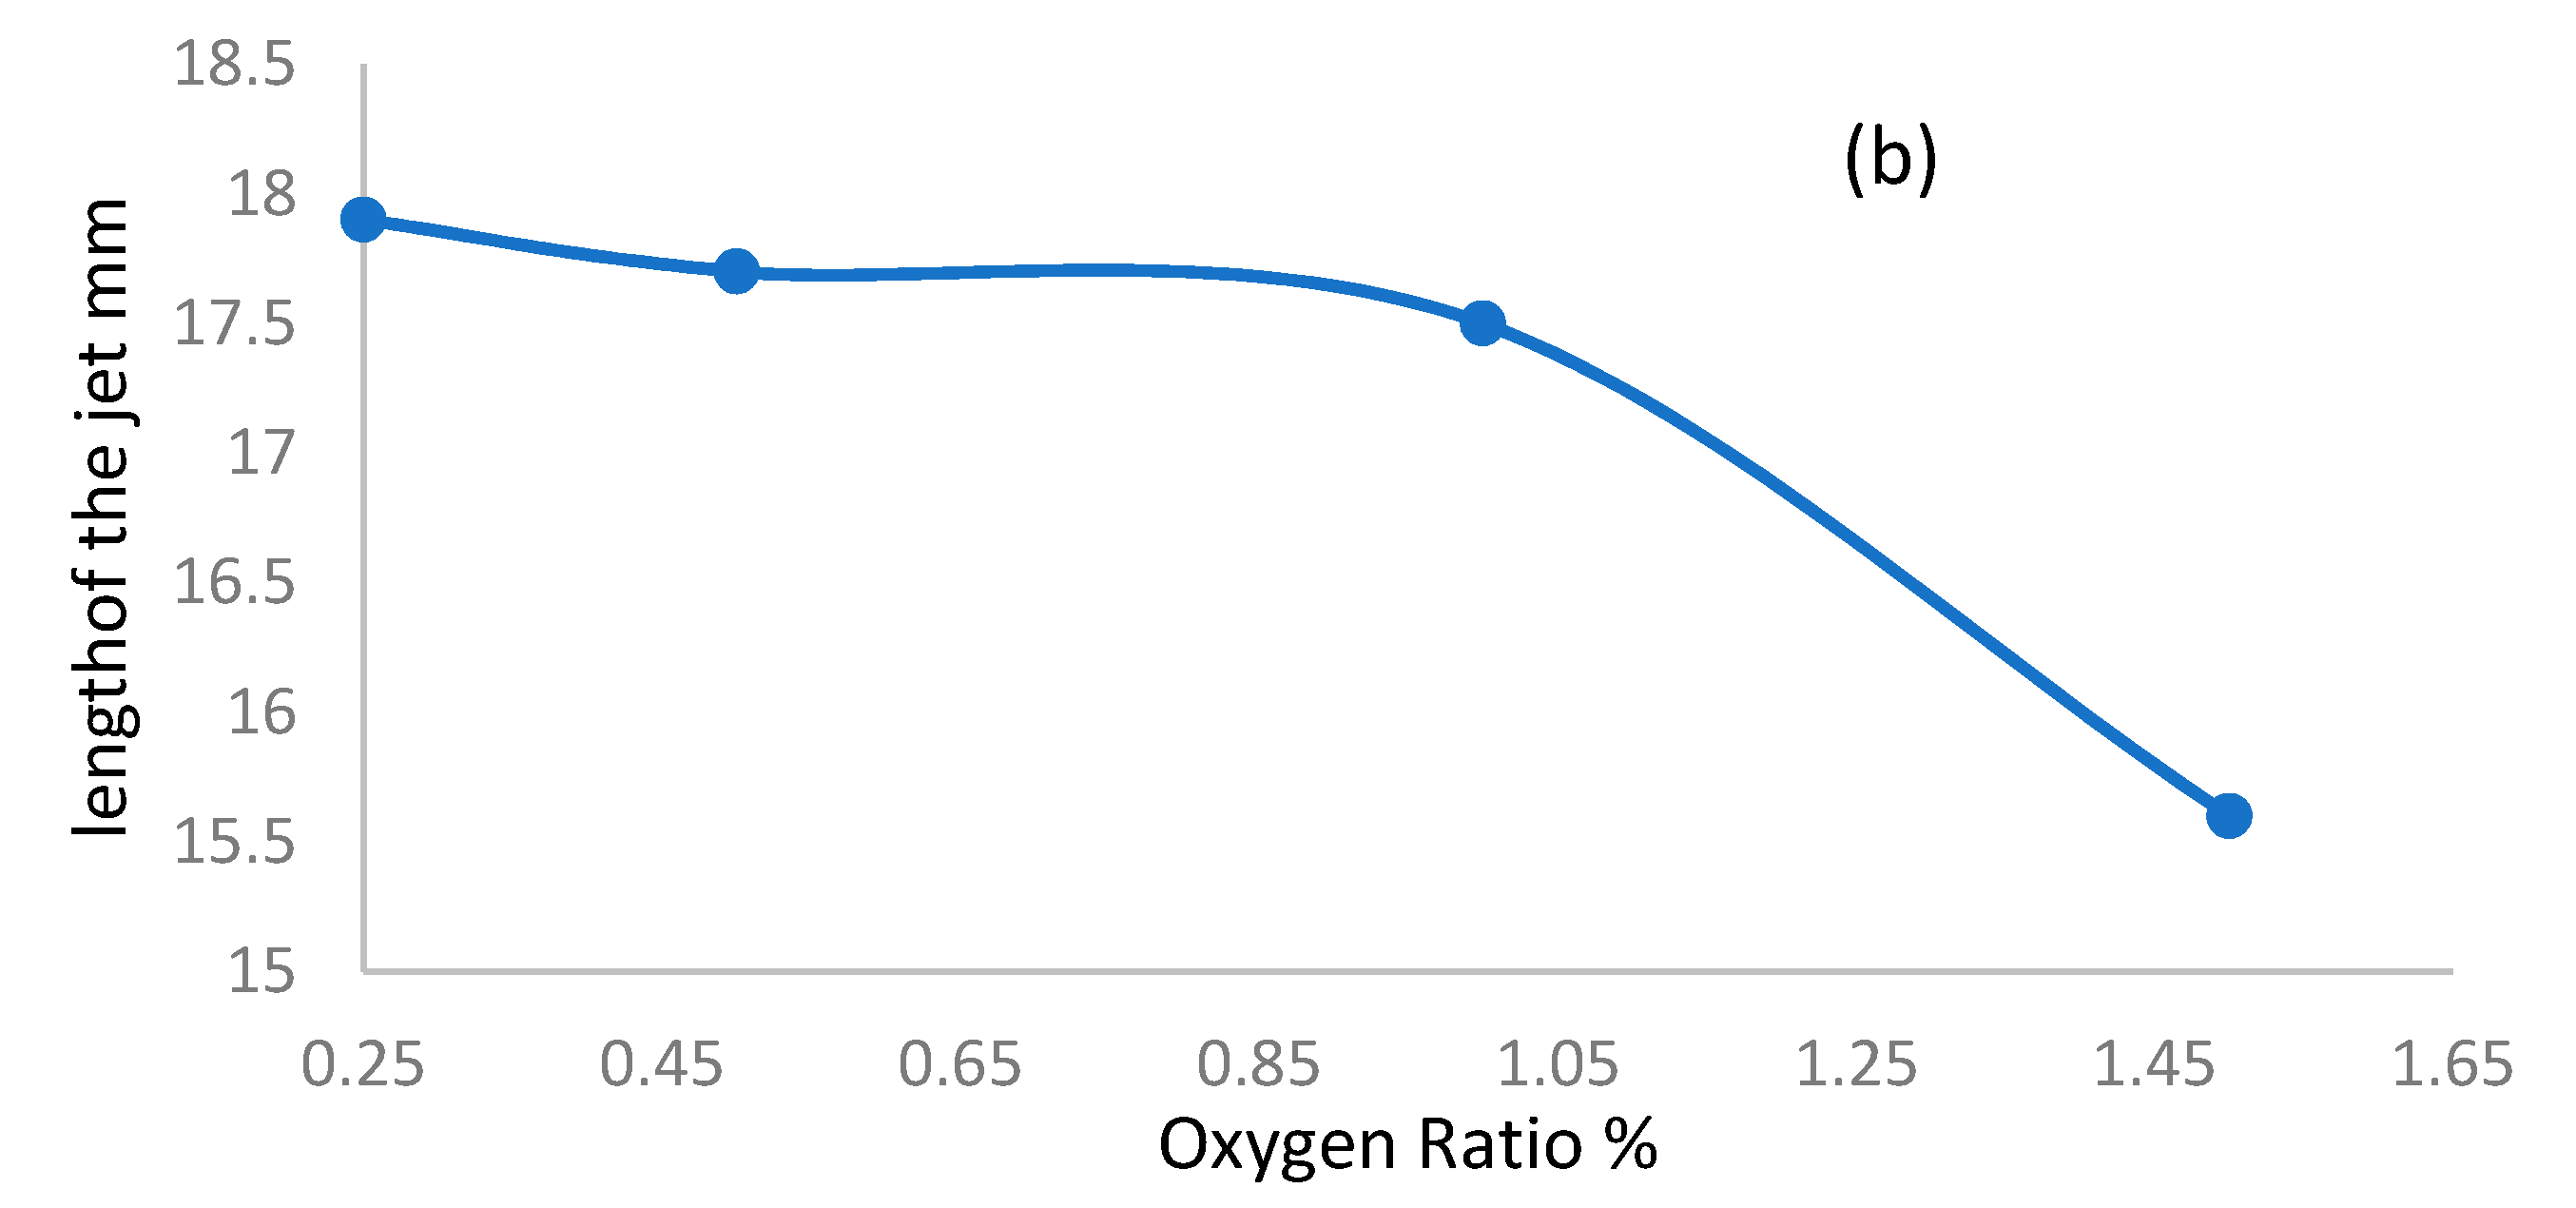
Figure 5a shows the plasma jet length for an argon discharge as a function of flow rate from 0.2 to 4 slm. The plasma jet length decreases from 20.6 to 10.7 mm with increasing flow rate from 0.2 to 2 slm and begins to stabilize at an average jet length of 9.8 mm when the flow rate increases from 2.2 to 4 slm. Figure 5b shows the plasma jet length of an oxygen/argon discharge as a function of the oxygen ratio admixture with 1 slm of Ar; with increasing oxygen concentration using oxygen ratios from 0.25% to 1.5%, the plasma length decreases from 17.9 to 15.6 mm. This may be because of an electronegative property of oxygen, to attract electrons, meaning that the effects on the discharge intensity diminish, as does the plasma jet length [28].
The width of the jet is an active and interesting parameter that depends on plasma jet length and the applied flow rates of argon and oxygen. The width is a guideline for the maximum area of irradiance emerging from the jet and reaching the exposed sample.
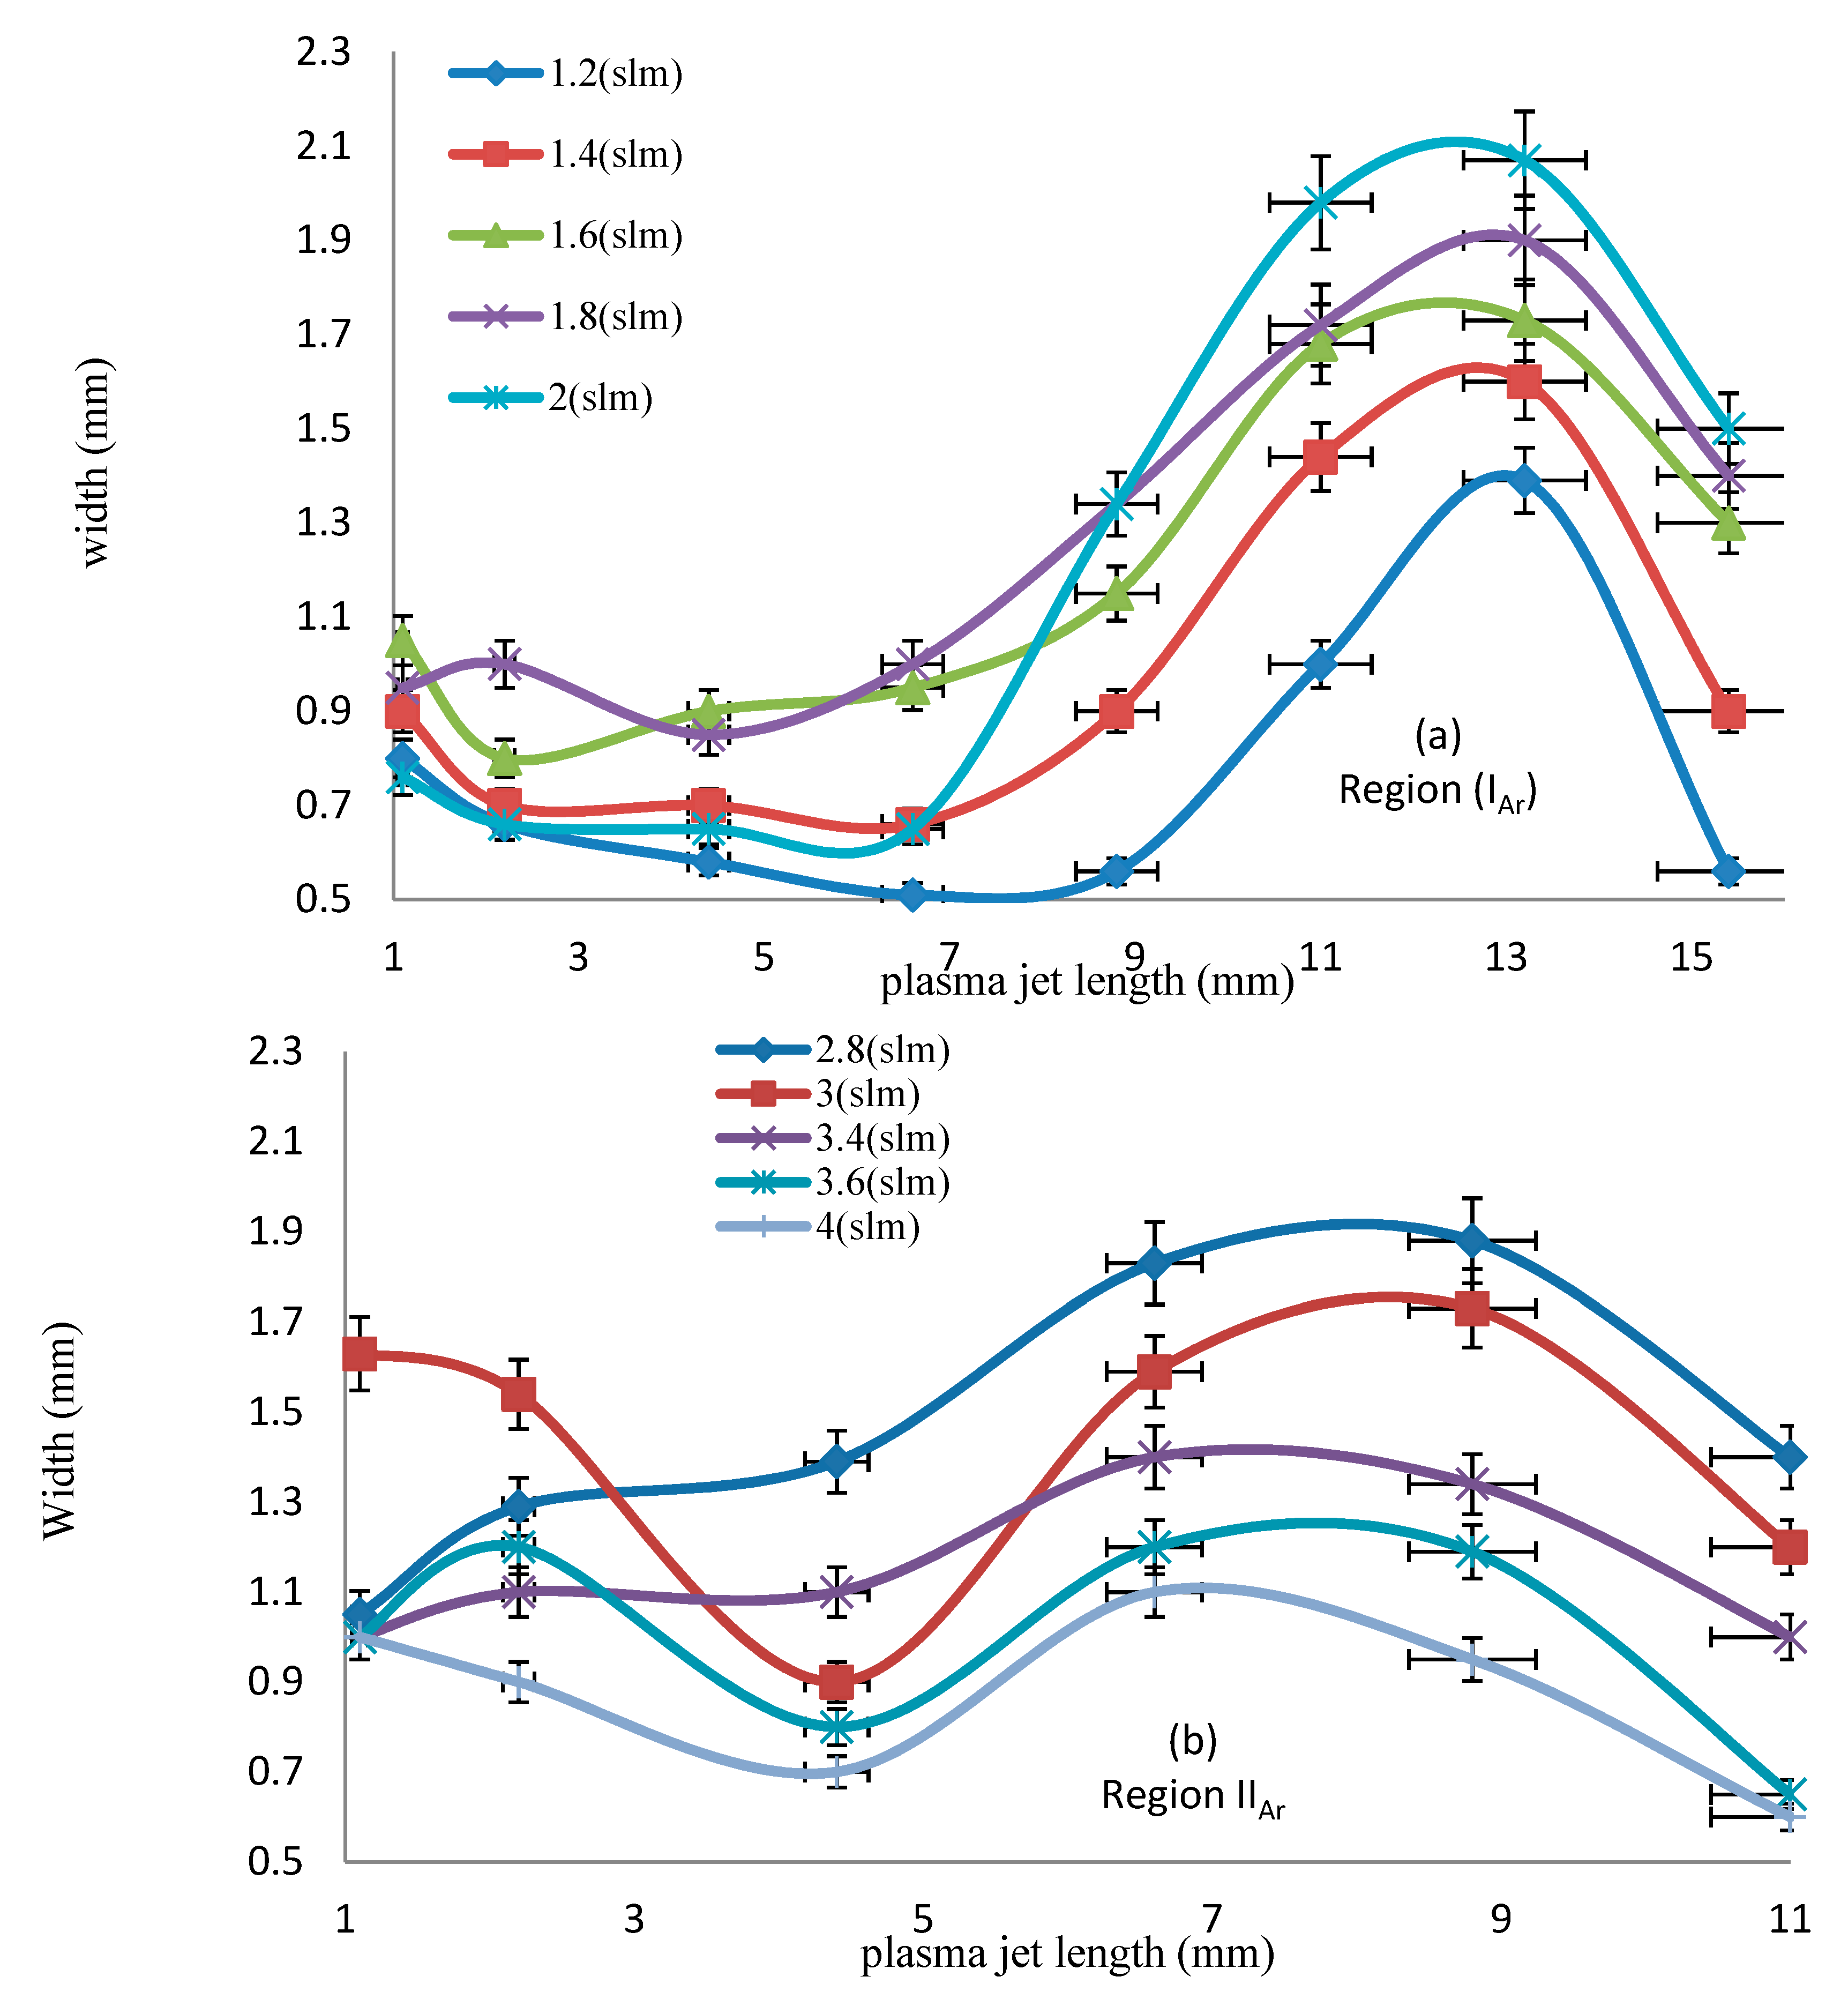
For the argon discharge, Figure 6a shows that in group IAr, as the flow rate increases from 1.2 to 2 slm, the jet width increases axially to a maximum of 1.39 to 2.07 mm, for a plasma jet length of 13.2 mm; the jet length then begins to decrease recognizably to between 0.56 and 1.5 mm, for a plasma jet length of 15.4 mm. Figure 6b shows that in group IIAr, as the flow rate increases from 2.8 slm to 4 slm, the jet width increases axially to a maximum of 1.88 to 1.1 mm, for a plasma jet length of 8.8 mm; the jet width begins to decrease recognizably to between 1.4 and 0.6 mm, for a plasma jet length of 11 mm.
Figure 6a,b show that the best flow rates of dry argon, which obtain maximal irradiance that emerges from the jet and reaches the exposed samples, are moderate flow rates (2–2.8 slm). These moderate flow rates represent the maximum transition region from the laminar flow mode to the turbulent flow mode to obtain the largest widths, help to cover the largest exposure area of sample and accelerate the antibacterial process by dry argon, as discussed and applied in our previous work [29].
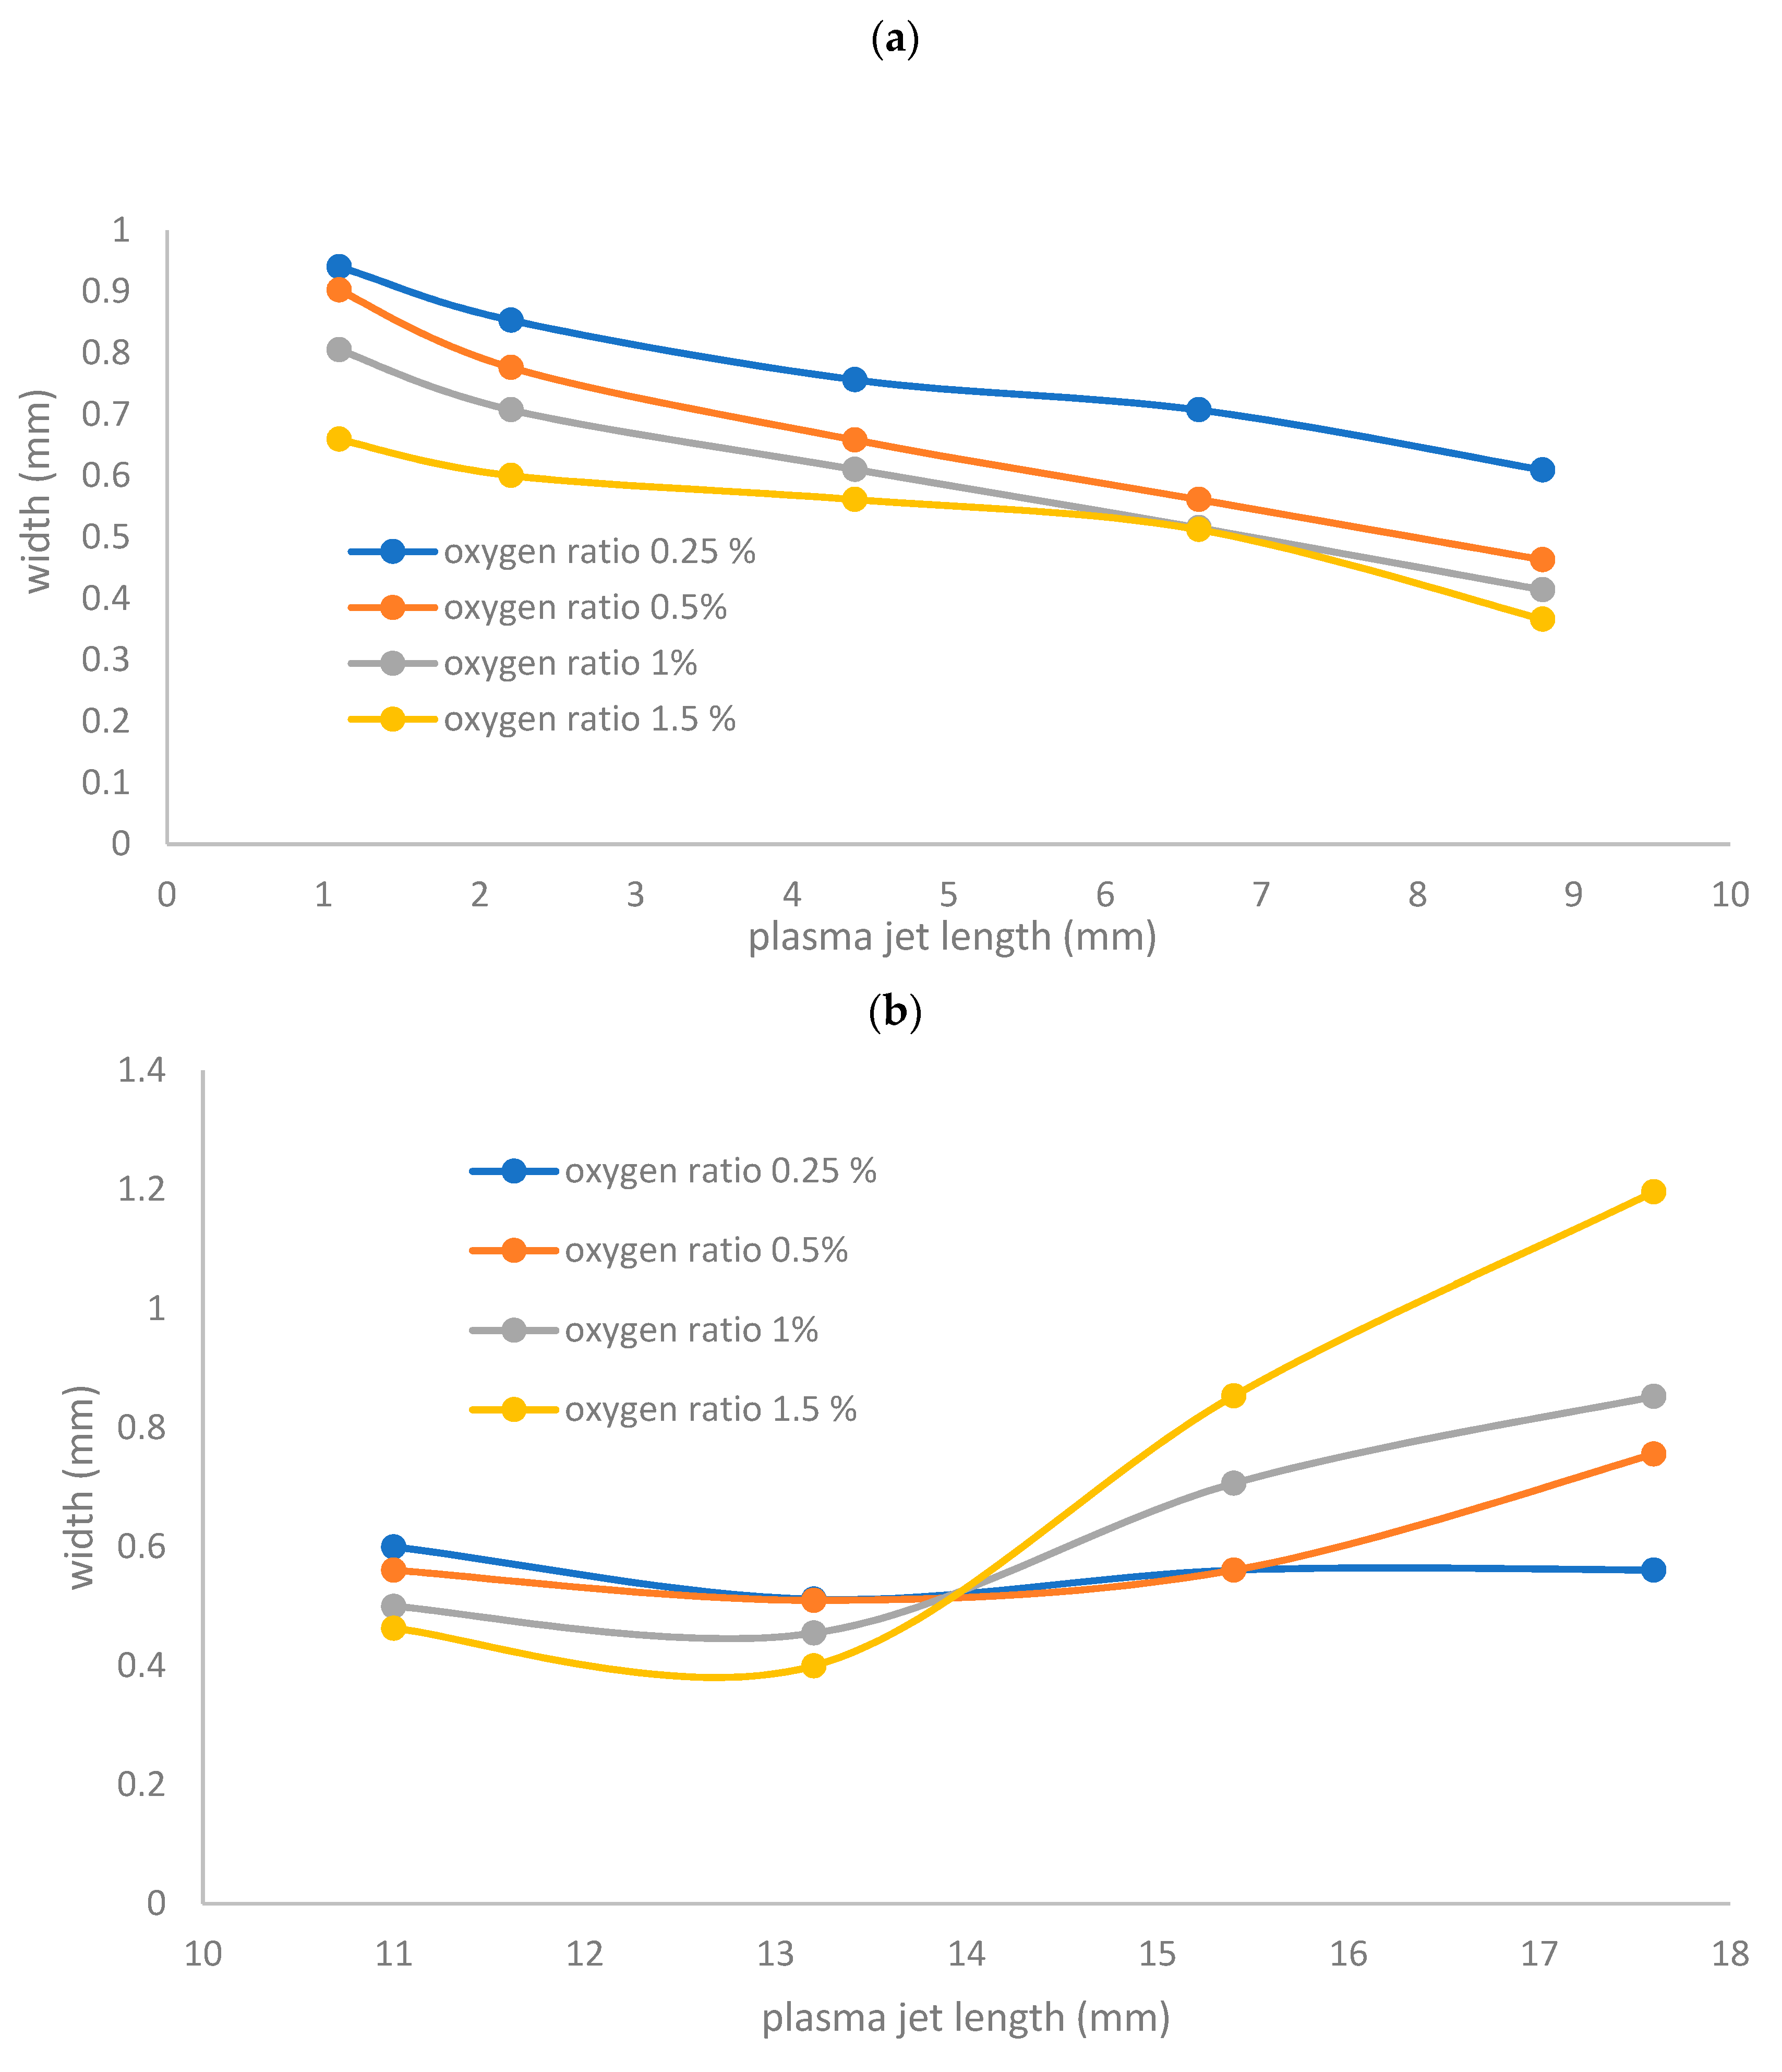
Figure 7a,b show the influence of the flow rate ratio of oxygen on the width and the length of the jet, from 0.25%, 0.5%, and 1% to 1.5% admixture with 1 slm of Ar, where two phases will be observed as follows:
(a)
Figure 7a shows the jet width for wet argon as a function of plasma jet length less than 10 mm, at different applied flow rate ratios of oxygen, ranging from 0.25% to 1.5%. As the flow rate ratio of oxygen increases, the jet width recognizably decreases axially to a minimum of 0.609 to 0.366 mm, for a plasma jet length of 8.8 mm.
(b)
Figure 7a shows the jet width for wet argon as a function of plasma jet length, ranging from 11 to 18 mm, at different applied flow rate ratios of oxygen, ranging from 0.25% to 1.5%. As the flow rate ratio of oxygen increases, the jet width begins to increase, reaching a wider scale from 0.561 to 1.196 mm, for a plasma jet length of 17.6 mm. This means that, as in Figure 7b, as the admixture values of oxygen flow rates increase, elongating the axial length dimension of the jet, and increase the width dimensions of the plasma jet. Table 3 and Table 4 give the largest width dimension values at the equivalent length dimensions of jet for an argon and oxygen/argon admixture discharge, respectively. The optical emission spectra and irradiances of the atmospheric pressure plasma jets can be obtained using these dimensions, as briefly presented below in Section 3.5 and Section 3.6.

3.4. Axial Temperature Distribution

Since this paper deals with non-thermal plasma (cold plasma), the temperature of the emerging jet from the APPJ is a critical factor in inactivation processes [30,31]. Figure 8 shows the axial distribution of temperature from the nozzle of the APPJ to a far away axial distance, at different powers of argon discharge using 1 slm of argon flow rate. The temperature depends on the input power, which ranges from 1 to 2.5 W. The temperature recognizably decreases far away—321 and 332 K at the nozzle (0 mm) to values from 310 to 319 K at 22 mm from the nozzle. The variation in the axial temperature distribution for argon discharge at different applied flow rates is shown in Figure 9. As the flow rate increases from 0.2 to 4 slm, the axial temperature decreases from 487 to 364 K at the nozzle, and from 396 to 364 K at 14 mm from the nozzle.
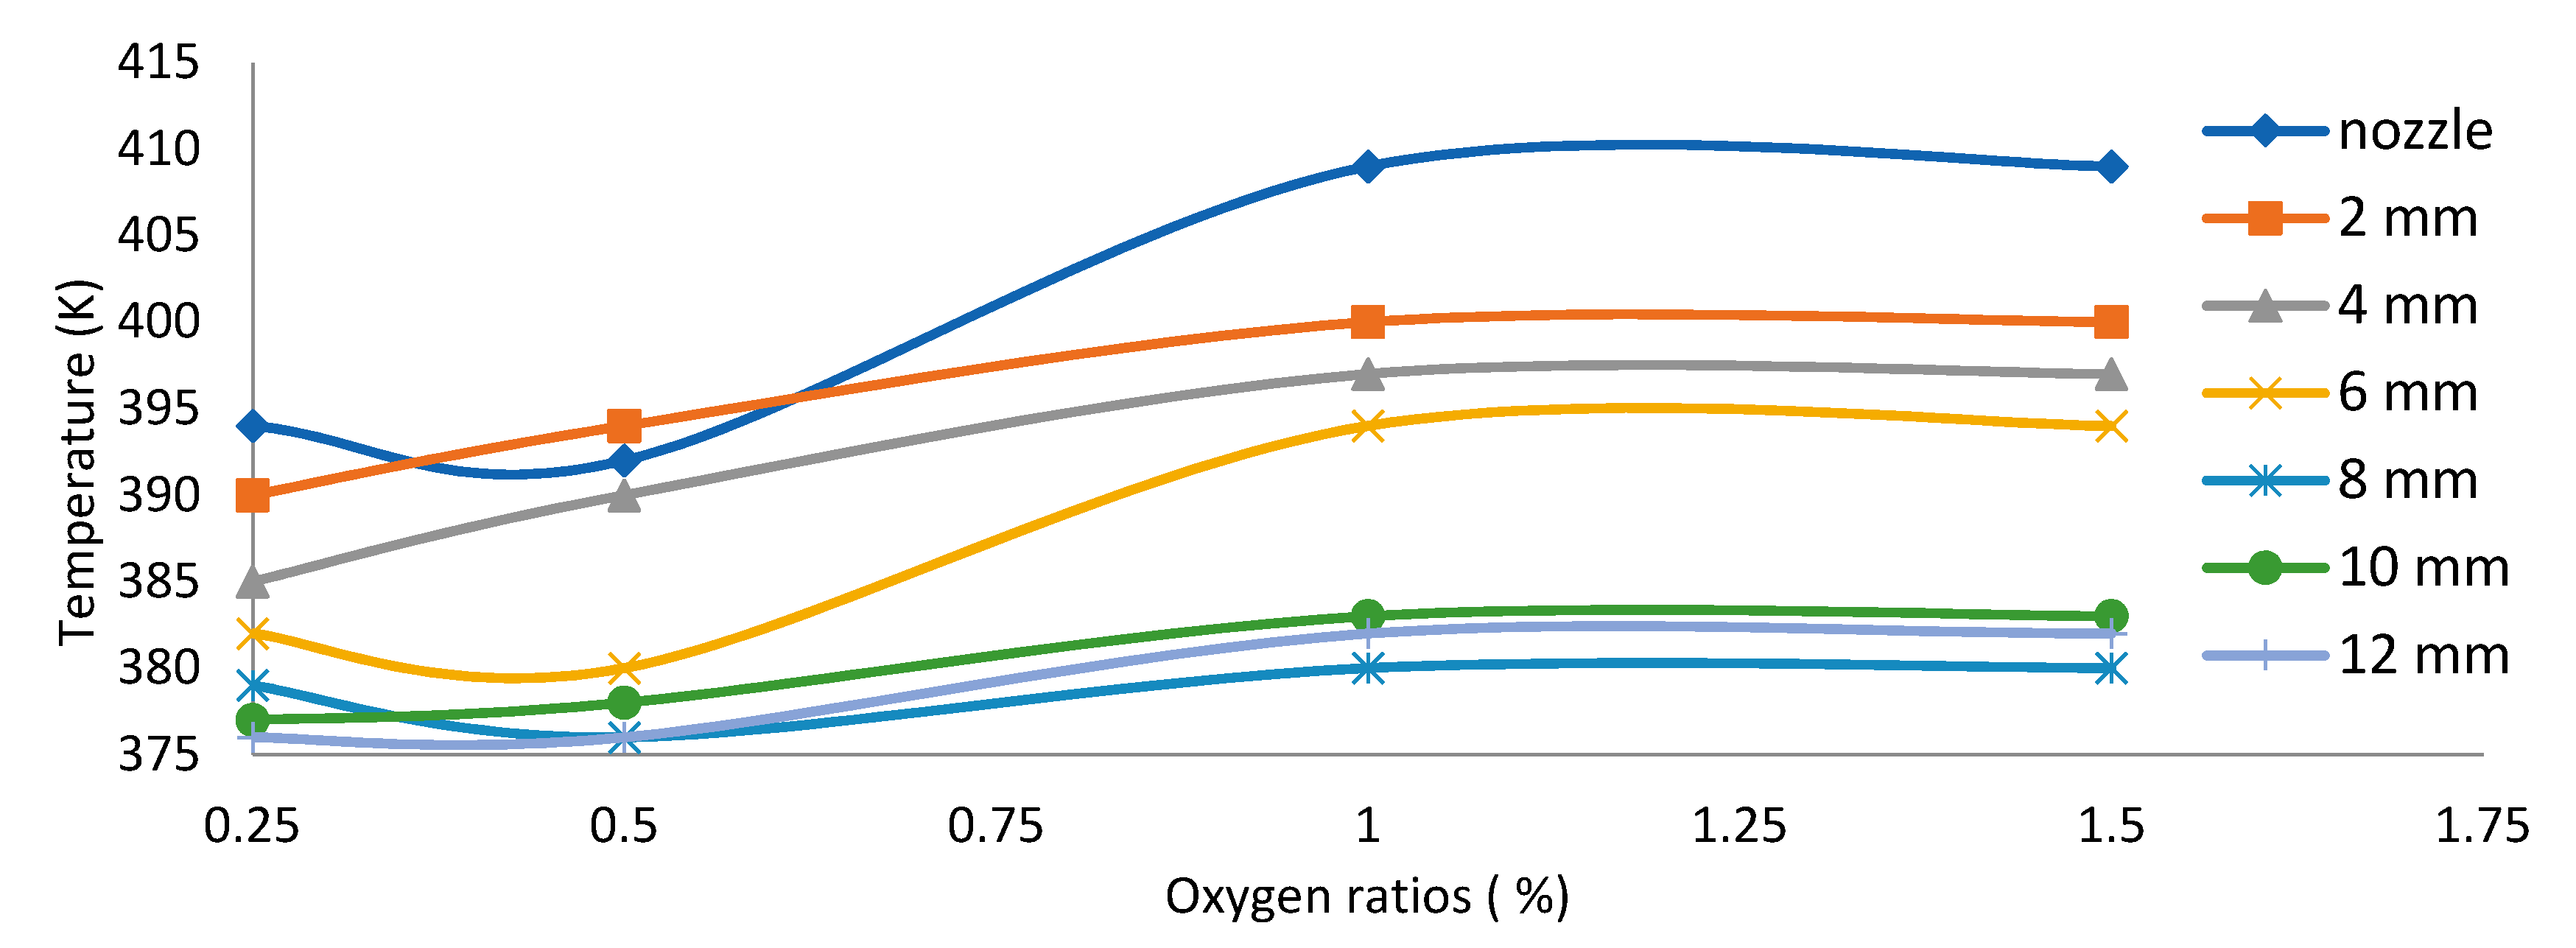
Figure 10 shows the relation between the oxygen ratio (with 1 slm of argon flow rate) and the axial temperature of the emerging jet at different axial locations. When the flow rate of oxygen increases, the temperature increases to reach a stable value. At the nozzle, the temperature ranges from 395 K to a stable value of 409 K, and at 12 mm from the nozzle the temperature ranges from 376 to 380 K.
As shown in Figure 9 and Figure 10, the gas temperatures of the plume in O2/Ar admixtures (with 1 slm of argon flow rate) are slightly lower than those in pure argon discharges. However, as the oxygen ratio increases, the temperature begins to increase and then becomes stable. The reason for this difference between the temperatures of Ar/O2 and Ar plasmas might be because, as the oxygen ratio increases, the numbers of collisions among particles increase with the flow rate, and more particles participate in energy exchange and dissipating power processes [32]. Therefore, the rotational temperature and vibrational temperature decrease as a result of processes that occur due to adding oxygen to the argon during discharge. Furthermore, adding oxygen accelerates the disinfection process, since a large quantity of thermal energy is transferred from the jet to the alive culture compared with the case for pure argon—the thermal conductivity of oxygen (0.0238 W m−1 K−1) is higher than that of argon (0.0162 W·m−1 K−1) [33].

3.5. Optical Emission Spectra of APPJ

Optical emission spectroscopy (OES) of the APPJ was performed at the core of the jet’s vertical axis using fiber optics with the following parameters: (i) the intensity of the emission spectra (IES) of the emitted jet versus the wavelength; (ii) the peak-to-peak voltage was 11.2 kV, with a 25 kHz frequency; (iii) the wavelength ranged from 250 to 850 nm; (iv) detection was carried out at two different axial locations—the nozzle and 10 mm apart from the nozzle; (v) the investigated flow rates for dry argon discharges were 1.8 and 3.2 slm and for wet argon discharges were 1 slm of argon with different ratios of oxygen admixture: 0.25% and 1.5%.
Figure 11 shows the OES of dry argon discharge with an applied flow rate of 1.8 slm taken from the two axial locations: nozzle and 10 mm apart from the nozzle. The dry argon APPJ emission spectrum at the nozzle is presented in Figure 11a. A high emission intensity with a strong line is found for the hydroxide band (OH) at 309.6 nm ((A2+-X2∏) transition), for argon lines as follows: ArI: {696.7, 727.3, 738.46, 751.47, 763.76, 772.53, 795.53, 801.47, 811.53, 826.45, and 842.46 nm} (3s23p5(23/2)4p transition), and for the nitrogen band (N2): {337.26, 357.77, 380.36 nm} ((C3Πu-B3Πg) transition).
Figure 11b shows the emission spectrum detected at 10 mm from the jet nozzle for dry argon, a moderate emission intensity lower than that of the nozzle measurements. The OH band appears lower with 80% than IES at the nozzle, and the nitrogen band (N2) with higher IES than at the nozzle by 90%, and with lines, as follows: {337.26, 357.77, 380.36, 405.22, and 433.62 nm} ((C3Πu-B3Πg) transition); besides argon lines appeared at the jet nozzle.
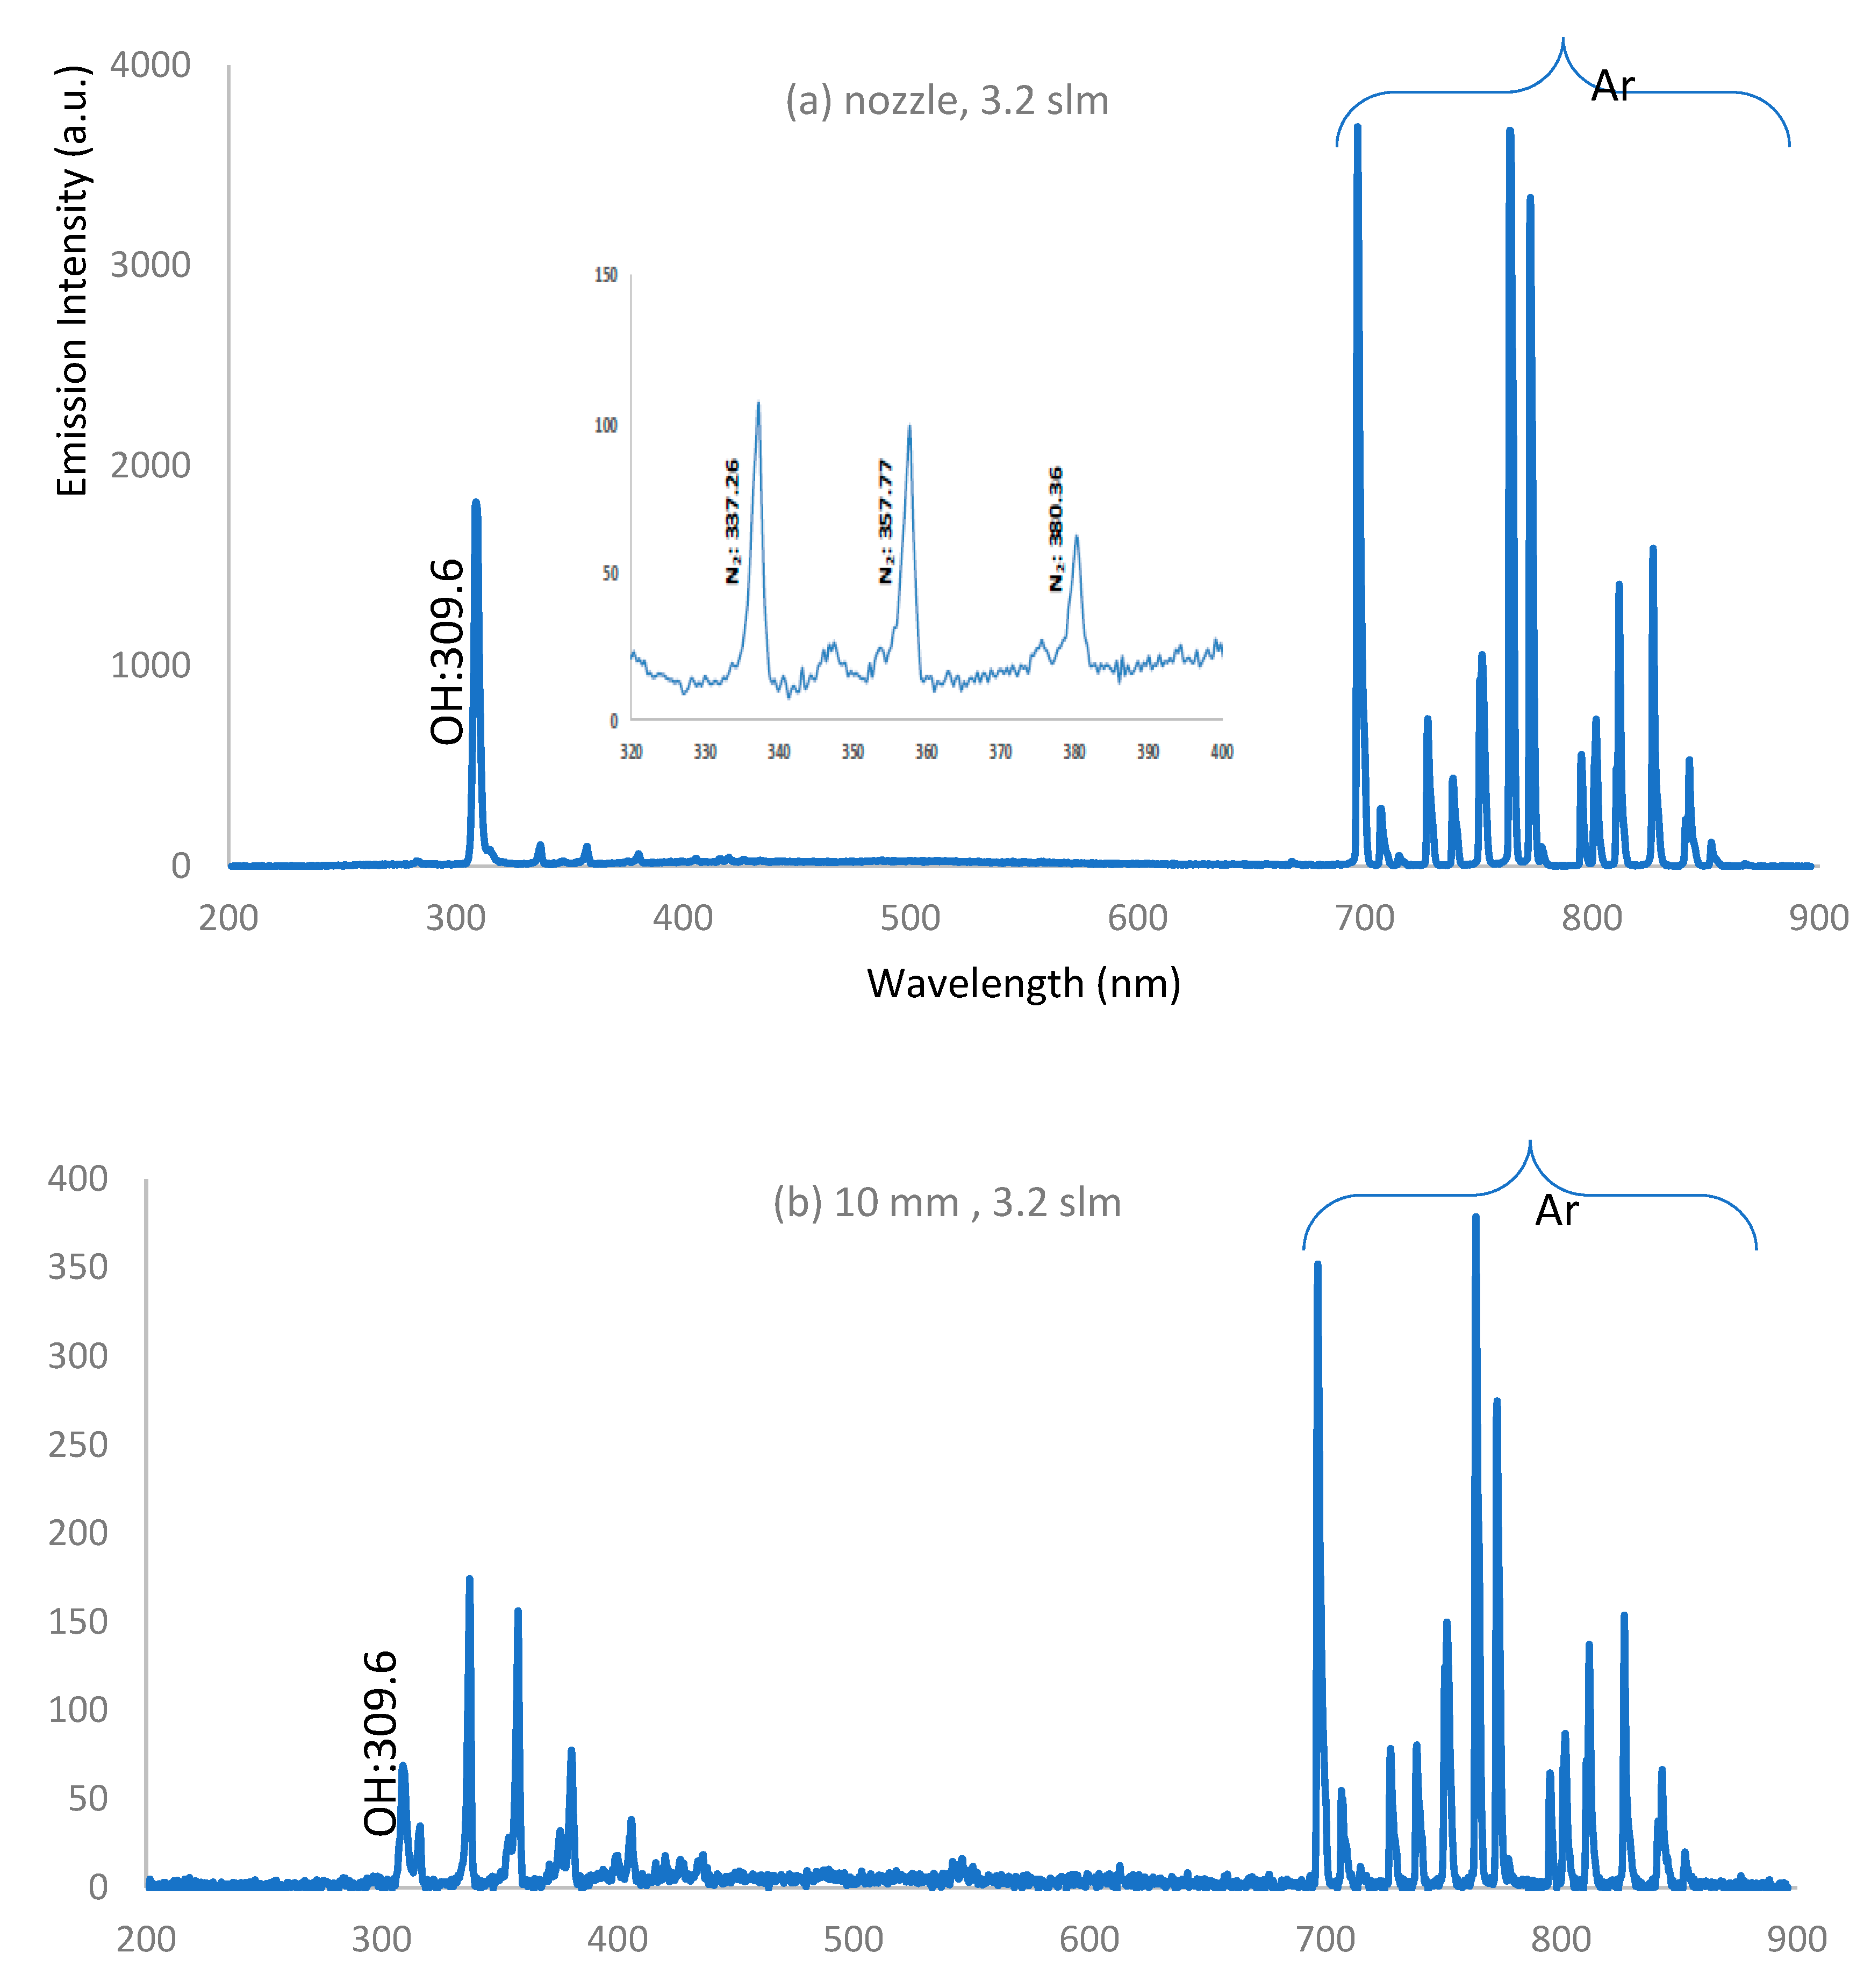
The intensity of APPJ emission spectra decreased when the argon flow rate increased to 3.2 slm for all spectra measured at the two different axial locations ( nozzle and 10 mm), as shown in Figure 12a,b. A reduction in the APPJ emission spectra was measured when the dry argon flow rate increased to more than 2.4 slm for all spectra measured due to a transition from the laminar flow mode to the turbulent flow mode.
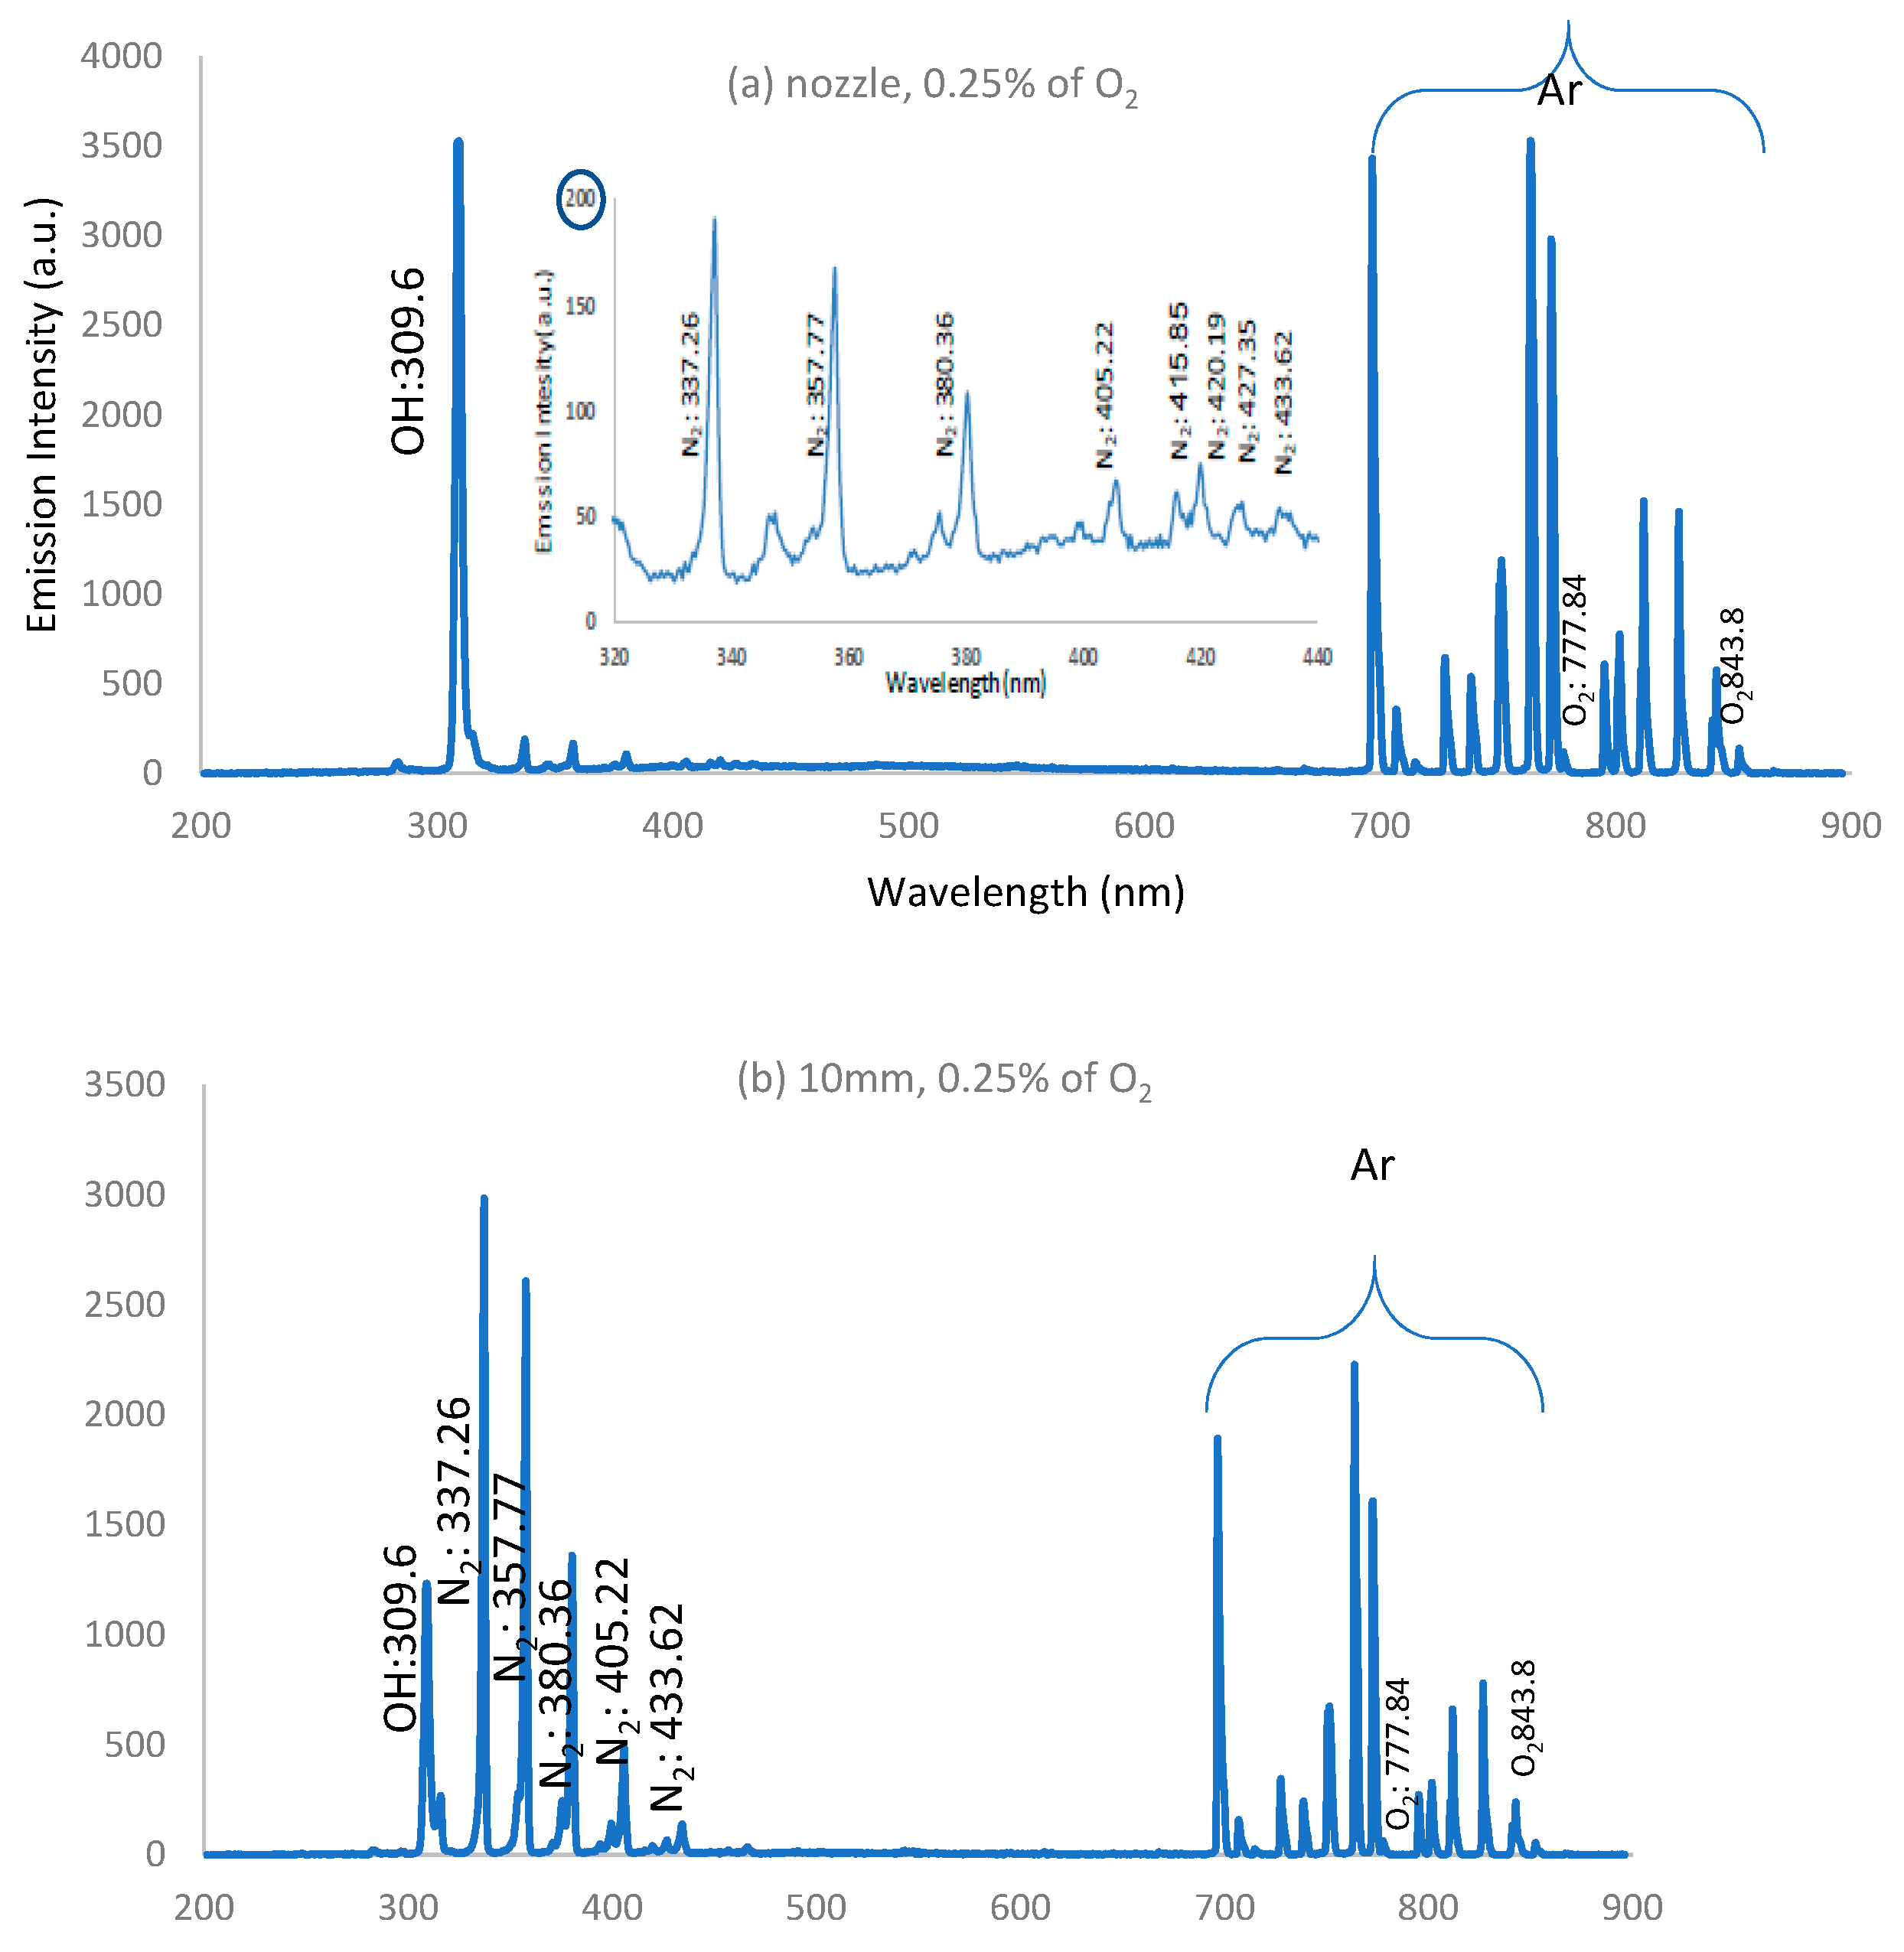
Figure 13a displays the optical emission spectra of wet argon discharges with ratios of 0.25% of oxygen admixture with 1 slm of argon at the two different axial locations (nozzle and 10 mm). A high IES with a strong OH band at 309.6 nm was measured at the nozzle location; a low IES for weak N2 bands was measured: {337.26, 357.77, 380.36, 380.36, 405.22, 415.85, 420.19, 427.3, and 433.62 nm} ((C3Πu-B3Πg) transition); Ar lines appeared as presented in Figure 11a for the case of a dry argon discharge; and oxygen (O) radical lines were observed: {777.84 and 843.8 nm} (3s23p5(23/2)4s transition).
For a wettability with 0.25% of oxygen and at 10 mm from the nozzle, as shown in Figure 13b, the same lines and bands appeared in the emission spectra recorded at the nozzle, but IES decreased by 60% for the OH band and increased by 80% for the N2 bands: {337.26, 357.77, 380.36, 380.36, 405.22, and 433.62 nm} ((C3Πu-B3Πg) transition), where the wavelengths of the Ar lines were as follows: ArI: {696.7, 727.3, 738.46, 751.47, 763.76, 795.53, 801.47, 811.53, and 826.45 nm} (3s23p5(23/2)4p transition), with a 27% lower emission spectrum intensity; oxygen lines at 777.84 and 843.8 nm (3s23p5(23/2) 4s transition) were recorded.
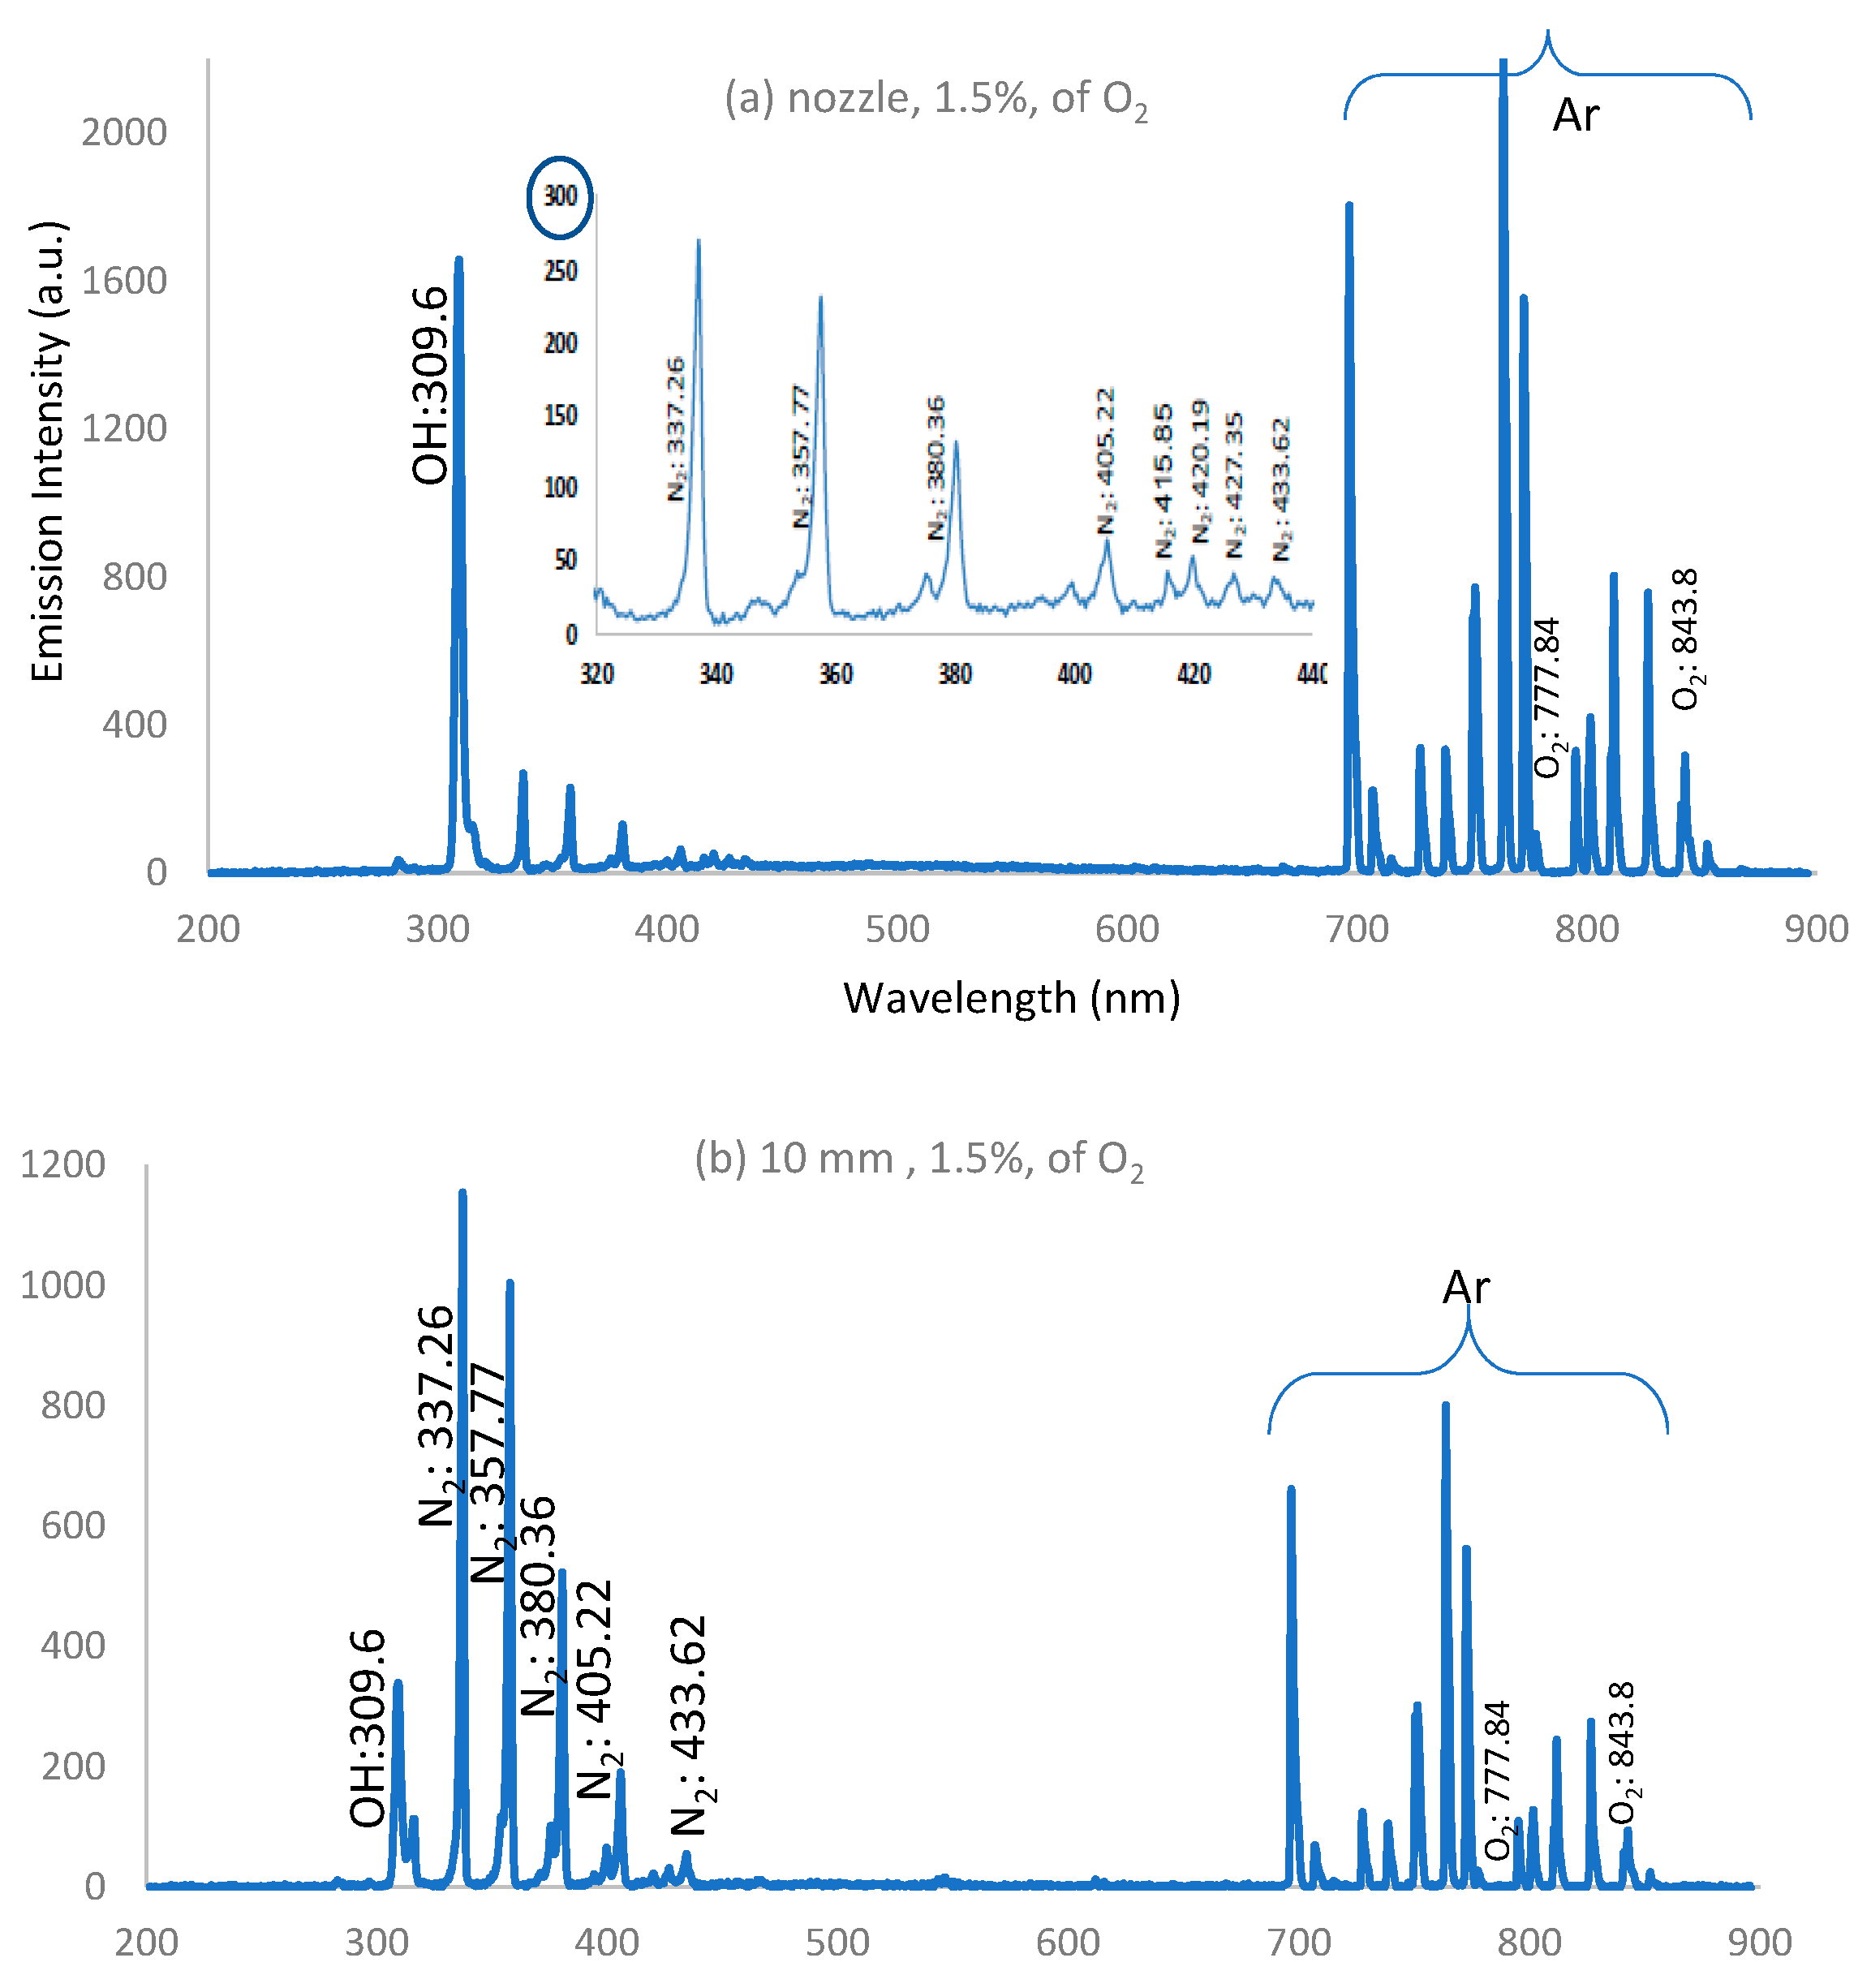
For wet argon discharges when the O2 percentage increased to 1.5%, as depicted in Figure 14a,b, at the two observed locations (nozzle and 10 mm), IES was measured for a wettability of 1.5% for O2 at 10 mm from the nozzle (Figure 14b), giving the same lines and bands as those observed at the nozzle, but IES increased by 37% for (OH) band and decreased by 33% for (N2) bands.
Generally:
a-
IES decreases along the jet length and decreases apart from the nozzle due to the presence of the strong electric field near the nozzle and because of the high rate of charge carrier generation by electron impacts near the nozzle.
b-
As the admixture of oxygen increases, IES decreases due to the decrease in electron density and temperature resulting from significant dissociation of the oxygen molecules in the discharge processes [34].
c-
As the admixture of oxygen increases, IES for the concentration of O, OH, and NO radicals increases far away from the nozzle, compared with the dry argon case.
d-
There are many reactions for dry argon discharge, as follows [35]:
i-
Argon reacts with an energetic electron (e*) to produce metastable argon (Arm):
Ar + e*→ Arm + ē
ii-
Arm reacts with e* to produce excited argon (Ar*):
e * + Arm → Ar* + ē
iii-
Ar* reacts with water to generate OH:
H2O + Ar* → H + OH + Ar
iv-
For the oxygen admixture in wet argon, there are many dissociation reactions in addition to the reactions for dry argon [36,37]:
O2 + e  2O + e
N2 + e  2 N + e
N + O2  NO + O
N2* + O NO + N*
O 2+ O O3
From the dissociation reactions (6) to (10), it is concluded that: (i) The dissociation reactions, the degree of gas ionization, and the production of ozone, O3, play an important role in the inactivation process. (ii) Due to the oxygen admixture in wet argon, there are dissociation reactions that produce radicals and charged particles under high-energy electron bombardment [38]. (iii) The bonding energy B.EN≡ N (9.79 eV) > B.E O= O (5.15 eV) and the dissociation and concentration of active species of O 2 > N2 lead to an inactivation process by O2 higher than for N2 [39]. (iv) OH and O radical emission results due to impurities in the gas or due to the entry of air into the discharge zone [40]. (v) The presence of OH, O, and N2 bands and lines is attributed to the interaction of ambient air with excited argon species, as well as high-energy electrons in the plasma.
Reactive species, such as O, OH, and NO, are the most effective agents in biomedical applications; the plume interacts with ambient gases and molecules. The spectral lines of other elements will be investigated in our future experimental study on APPJ impact parameters that affect the microbial inactivation process of bacteria [41].

3.6. Irradiance

The amount of energy (radiant power) emitted per unit area from the plasma jet is the irradiance (W/m2). The optical emission spectra, the measured dimensions (length and width) of the emerging APPJ (for argon and oxygen/argon admixture discharges) at different flow rates, and the constant applied voltage are important parameters in determining the exposed irradiance, suitable for disinfection processes in medical applications.
The dose rate of irradiance of the APPJ plume per unit area [42] can be calculated by the plume power (W) measured with a power meter detector divided by the cross-sectional area of the effective window of the detector (70 × 10−6 m2).
Figure 15a,b show that the dose rate of irradiance per unit area (μJ/mm2) decreases as the jet length increases:
a-
Figure 15a shows the influence of the flow rate on the discharge plasma power of the emerging jet for pure argon discharge; by increasing the flow rate from 1.8 to 3 slm, the irradiance per unit area of the plasma jet discharge decreases from 55 to 13 μJ/mm2 for a plasma jet distance with 8 mm. With increasing plasma jet length to 18.4 mm, the irradiance decreases to between 15 and 6.09 μJ/mm2.
b-
Figure 15b shows the influence of different oxygen ratios; whereas the oxygen ratios increase from 0.25% to 1.5%, the irradiance per unit area of plasma jet discharge decreases from 28.57 to 5.68 μJ/mm2 for a plasma jet length of 8 mm. By increasing the plasma jet length to 18.4 mm, the irradiance decreases to between 6.9 and 4.02 μJ/mm2. The dose rate of irradiance per unit area is lower for the oxygen/argon admixture discharges than for the argon discharges. The oxygen percentages increase; inelastic collisions lead to losses in the discharge process and lower irradiance compared with the case for argon discharges.
c-
According to the measured data and the Guidelines of the International Commission on Non-Ionizing Radiation Protection (ICNIRP), the limits of irradiance exposure of the skin must not exceed 30 μJ/mm2 [43,44]. From the results, it is concluded that the measured irradiances under the drawn dashed line in Figure 15a for argon discharges and the irradiances for all oxygen/argon admixture discharges in Figure 15b are compatible with ICNIRP irradiance limits.

4. Conclusions

The impact of a non-thermal atmospheric pressure plasma jet (APPJ) using different working gases, powered by an AC high-voltage source with a variable frequency reaching 60 kHz, and with a voltage ranging from 2.5 to 25 kV, has been determined. The optical and electrical characteristics of APPJ discharges for Ar and Ar/O2 working gases have been determined, such as: voltage–current waveform signals, gas flow rates, discharge plasma powers, lengths, widths, the axial temperature distribution, optical emission spectra, and irradiance.
The discharge plasma power values of oxygen admixture discharges decrease, from 1.75 to 1.65 W, for oxygen admixture ratios increasing from 0.25% to 1.5%, and are lower than those of argon discharges, and the plasma power values increase from 1.95 to 2.4 W when the argon flow rate increases from 0.2 to 3 slm. This is useful in sterilization and inactivation processes, since it prolongs the interaction processes between the plasma jet and the sample.
The width of the jet is an interesting parameter that depends on the plasma jet length and the applied flow rate of argon and oxygen. The width is a guideline for the maximum irradiance area emerging from the jet and reaching the sample. As the oxygen flow rates increase, the width of the plasma jet increases and elongates the axial length of the jet. In general, the temperature of the jet reaching the sample must not exceed the threshold of room temperature. As the oxygen ratio increases, the numbers of collisions among particles increase, and the jet temperatures decrease as a result of processes during discharge.
For discharges with oxygen admixture ratios between 0.25% and 1.5% with argon, the emission spectra of APPJ give a behavior similar to that of pure argon discharges, but with low values of intensity due to the decrease in electron density and temperature and higher dissociation and ionization of the oxygen molecules in the discharges processes in the case of oxygen admixture.
The optical emission spectra and the dose rate of irradiance of plasma jet discharge were investigated as a function of plasma jet length for dry argon discharge and for wet argon discharge. This investigation delivered data compatible with the International Commission on Non-Ionizing Radiation Protection (ICNIRP) for irradiance exposure limits of the skin, 30 μJ/mm2. This limit is suitable for the disinfection of microbes on the skin without harmful effects.
Our future work will involve an experimental study on the impact parameters affecting the microbial disinfection process of bacteria on skin in a wound area. The study will use different distances between the jet of the APPJ and the treated samples and the required knowledge to avoid toxic gas formation, damage, and heat radiation production in the sample. Moreover, the Reynolds numbers of argon and oxygen/argon admixture discharges for various gas flow rates will be considered.

Author Contributions

Conceptualization, methodology, validation, formal analysis, investigation, resources, data curation, writing (original draft preparation, review, and editing), visualization, supervision, project administration, and funding acquisition, all tasks done by the two authors. Both authors have read and agreed to the published version of the manuscript.

Funding

The research work was funded by the Deanship of Scientific Research—Umm Al-Qura University, Makkah, Saudi Arabia, where the project was setup with funding No. 18-sci-1-01-0022.

Institutional Review Board Statement

Not applicable.

Informed Consent Statement

Not applicable.

Data Availability Statement

Data are contained within the article.

Acknowledgments

The authors acknowledge the support of the Deanship of Scientific Research-Umm El-Qura University-Makkah-Saudi Arabia where the project was set up with funding no. 18-sci-1-01-0022, as well as the full support by the Department of Applied Physics of Ghent University (Belgium) and in particular that of Rino Morent and Iuliia Onyshchenko.

Conflicts of Interest

The authors have no conflict of interest to declare.

References

  1. Van Oost, G. Plasma for environment. J. Phys. Conf. Ser. 2017, 941, 012014. [Google Scholar] [CrossRef]
  2. Laroussi, M.; Leipold, F. Evaluation of the roles of reactive species, heat, and UV radiation in the inactivation of bacte-rial cells by air plasmas at atmospheric pressure. Int. J. Mass Spectrom. 2004, 233, 81–86. [Google Scholar] [CrossRef]
  3. Laroussi, M.; Mendis, D.A.; Rosenberg, M. Plasma interaction and microbes. New J. Phys. 2003, 5, 41. [Google Scholar] [CrossRef]
  4. Morent, R.; De Geyter, N.; Van Vlierberghe, S.; Dubruel, P.; Leys, C.; Gengembre, L.; Schacht, E.; Payen, E. Deposition of HMDSO-based coatings on PET substrates using an atmospheric pressure dielectric barrier discharge. Prog. Org. Coat. 2009, 64, 304. [Google Scholar] [CrossRef]
  5. Laroussi, M. Nonthermal decontamination of biological media by atmospheric-pressure plasmas: Review, analysis, and prospects. IEEE Trans. Plasma Sci. 2002, 30, 1409–1415. [Google Scholar] [CrossRef]
  6. Lee, H.W.; Nam, S.H.; Mohamed, A.-A.; Kim, G.C.; Lee, J.K. Atmospheric Pressure Plasma Jet Composed of Three Electrodes: Application to Tooth Bleaching. Plasma Process. Polym. 2010, 7, 274–280. [Google Scholar] [CrossRef]
  7. Morent, R.; De Geyter, N.; Verschuren, J.; De Clerck, K.; Kiekens, P.; Leys, C. Non-thermal plasma treatment of textiles. Surf. Coat. Technol. 2008, 202, 3427–3449. [Google Scholar] [CrossRef]
  8. Machala, Z.; Hensel, K.; Akishev, Y. Plasma for Bio-Decontamination, Medicine and Food Security; Springer: Dordrecht, The Netherlands, 2011; pp. 417–430. [Google Scholar]
  9. Lee, M.-H.; Min, B.K.; Son, J.S.; Kwon, T.-Y. Influence of Different Post-Plasma Treatment Storage Conditions on the Shear Bond Strength of Veneering Porcelain to Zirconia. Materials 2016, 9, 43. [Google Scholar] [CrossRef] [PubMed] [Green Version]
  10. Wu, C.-C.; Wei, C.-K.; Ho, C.-C.; Ding, S.-J. Enhanced Hydrophilicity and Biocompatibility of Dental Zirconia Ceramics by Oxygen Plasma Treatment. Materials 2015, 8, 684–699. [Google Scholar] [CrossRef] [Green Version]
  11. Nam, S.H.; Lee, H.J.; Hong, J.W.; Kim, G.C. Efficacy of Nonthermal Atmospheric Pressure Plasma for Tooth Bleaching. Sci. World J. 2015, 2015, 1–5. [Google Scholar] [CrossRef] [Green Version]
  12. Laroussi, M. Low-Temperature Plasma Jet for Biomedical Applications: A Review. IEEE Trans. Plasma Sci. 2015, 43, 703–712. [Google Scholar] [CrossRef]
  13. Xiong, Q.; Lu, X.P.; Jiang, Z.H.; Tang, Z.Y.; Hu, J.; Xiong, Z.L.; Pan, Y. An Atmospheric Pressure Nonequilibrium Plasma Jet Device. IEEE Trans. Plasma Sci. 2008, 36, 986–987. [Google Scholar] [CrossRef] [Green Version]
  14. Seo, Y.S.; Mohamed, A.-A.; Woo, K.C.; Lee, H.W.; Lee, J.K.; Kim, K.T. Comparative Studies of Atmospheric Pressure Plasma Characteristics between He and Ar Working Gases for Sterilization. IEEE Trans. Plasma Sci. 2010, 38, 2954–2962. [Google Scholar] [CrossRef]
  15. Sun, Y.; Zhang, Z.; Wang, S. Study on the Bactericidal Mechanism of Atmospheric-Pressure Low-Temperature Plasma against Escherichia coli and Its Application in Fresh-Cut Cucumbers. Molecules 2018, 23, 975. [Google Scholar] [CrossRef] [PubMed] [Green Version]
  16. Weltmann, K.-D.; Brandenburg, R.; von Woedtke, T.; Ehlbeck, J.; Foest, R.; Stieber, M.; Kindel, E. Antimicrobial treatment of heat sensitive products by miniaturized atmospheric pressure plasma jets (APPJs). J. Phys. D Appl. Phys. 2008, 41. [Google Scholar] [CrossRef]
  17. Mohamed, A.-A.H.; Aljuhani, M.M.; Almarashi, J.Q.M.; Alhazime, A. The effect of a second grounded electrode on the atmospheric pressure argon plasma jet. Plasma Res. Express 2020, 2, 015011. [Google Scholar] [CrossRef]
  18. Galaly, A.R.; Ahmed, O.B.; Asghar, A.H. Antibacterial effects of combined non-thermal plasma and photocatalytic treatment of culture media in the laminar flow mode. Phys. Fluids 2021, 33, 043604. [Google Scholar] [CrossRef]
  19. Dünnbier, M.; Becker, M.M.; Iséni, S.; Bansemer, R.; Loffhagen, D.; Reuter, S.; Weltmann, K.-D. Stability and excitation dynamics of an argon micro-scaled atmospheric pressure plasma jet. Plasma Sources Sci. Technol. 2015, 24, 65018. [Google Scholar] [CrossRef]
  20. Sarani, A.; Nikiforov, A.; Leys, C. Atmospheric pressure plasma jet in Ar and Ar/H2O mixtures: Optical emission spectroscopy and temperature measurements. Phys. Plasmas 2010, 17, 063504. [Google Scholar] [CrossRef] [Green Version]
  21. Morent, R.; De Geyter, N.; Leys, C.; Vansteenkiste, E.; De Bock, J.; Philips, W. Measuring the wicking behavior of textiles by the combination of a horizontal wicking experiment and image processing. Rev. Sci. Instrum. 2006, 77, 093502. [Google Scholar] [CrossRef]
  22. Morent, R.; De Geyter, N.; Leys, C.; Gengembre, L.; Payen, E. Surface Modification of Non-woven Textiles using a Dielectric Barrier Discharge Operating in Air, Helium and Argon at Medium Pressure. Text. Res. J. 2007, 77, 471–488. [Google Scholar] [CrossRef]
  23. Vicoveanu, D.; Ohtsu, Y.; Fujita, H. Pulsed Discharge Effects on Bacteria Inactivation in Low-Pressure Radio-Frequency Oxygen Plasma. Jpn. J. Appl. Phys. 2008, 47, 1130–1135. [Google Scholar] [CrossRef]
  24. Singh, M.K.; Ogino, A.; Nagatsu, M. Inactivation factors of spore-forming bacteria using low-pressure microwave plasmas in an N2 and O2 gas mixture. New J. Phys. 2009, 11. [Google Scholar] [CrossRef]
  25. Laroussi, M. Low Temperature Plasma-Based Sterilization: Overview and State-of-the-Art. Plasma Proc. Polym. 2005, 2, 391. [Google Scholar] [CrossRef]
  26. Deng, X.; Leys, C.; Vujosevic, D.; Vuksanovic, V.; Cvelbar, U.; De Geyter, N.; Morent, R.; Nikiforov, A. Engineering of Composite Organosilicon Thin Films with Embedded Silver Nanoparticles via Atmospheric Pressure Plasma Process for Antibacterial Activity. Plasma Process. Polym. 2014, 11, 921. [Google Scholar] [CrossRef]
  27. Ploux, L.; Mateescu, M.; Anselme, K.; Vasilev, K. Antibacterial Properties of Silver-Loaded Plasma Polymer Coatings. J. Nanomater. 2012, 2012, 1–9. [Google Scholar] [CrossRef] [Green Version]
  28. Deng, X.L.; Nikiforov, A.; Vanraes, P.; Leys, C. Direct current plasma jet at atmospheric pressure operating in nitrogen and air. J. Appl. Phys. 2013, 113, 023305. [Google Scholar] [CrossRef] [Green Version]
  29. Asghar, A.H.; Ahmed, O.B.; Galaly, A.R. Inactivation of E. coli Using Atmospheric Pressure Plasma Jet with Dry and Wet Argon Discharges. Membranes 2021, 11, 46. [Google Scholar] [CrossRef] [PubMed]
  30. Soloshenko, I.; Tsiolko, V.; Khomich, V. Sterilization of medical products in low- pressure glow discharges. Plasma Phys. Rep. 2000, 26, 792. [Google Scholar] [CrossRef]
  31. Lu, X.; Ye, T.; Cao, Y.; Sun, Z.; Xiong, Q.; Tang, Z.; Xiong, Z.; Hu, J.; Jiang, Z.; Pan, Y. The roles of the various plasma agents in the inactivation of bacteria. J. Appl. Phys. 2008, 104, 053309. [Google Scholar] [CrossRef]
  32. Shen, J.; Cheng, C.; Shidong, F.; Hongbing, X.; Yan, L.; Guohua, N.; Yuedong, M.; Jiarong, L.; Xiangke, W. Sterilization of Bacillus subtilis Spores Using an Atmospheric Plasma Jet with Argon and Oxygen Mixture Gas. Appl. Phys. Express 2012, 5, 3. [Google Scholar] [CrossRef]
  33. Cheng, C. Atmospheric pressure plasma jet utilizing Ar and Ar/H2O mixtures and its applications to bacteria inactivation. Chin. Phys. B 2014, 23, 7. [Google Scholar] [CrossRef]
  34. Lu, X.; Naidis, G.V.; Laroussi, M.; Reuter, S.; Graves, D.B.; Ostrikov, K. Reactive species in non-equilibrium atmospheric-pressure plasmas: Generation, transport, and biological effects. Phys. Rep. 2016, 630, 1–84. [Google Scholar] [CrossRef] [Green Version]
  35. Bruggeman, P.; Schram, D.; González, M.A.; Rego, R.; Kong, M.G.; Leys, C. Characterization of a direct dc-excited discharge in water by optical emission spectroscopy. Plasma Sources Sci. Technol. 2009, 18, 5–17. [Google Scholar] [CrossRef]
  36. Dodet, B.; Odic, E.; Goldman, A.; Goldman, M.; Renard, D. Hydrogen Peroxide Formation by Discharges in Argon/Water Vapor Mixtures at Atmospheric Pressure. J. Adv. Oxid. Technol. 2005, 8, 91–97. [Google Scholar] [CrossRef]
  37. Kirkpatrick, M.; Dodet, B.; Odic, E. Atmospheric pressure humid argon DBD plasma for the application of sterilization measurement and simulation of hydrogen, oxygen, and hydrogen peroxide formation. Int. J. Plasma Environ. Sci. Technol. 2007, 1, 96–101. [Google Scholar]
  38. Taghizadeh, L.; Brackman, G.; Nikiforov, A.; van der Mullen, J.; Leys, C.; Coenye, T. Inactivation of biofilms using a low power atmospheric pressure argon plasma jet; the role of en-trained nitrogen. Plasma Process. Polym. 2015, 12, 75–81. [Google Scholar] [CrossRef]
  39. Galaly, A.R.; Zahran, H.H. Disinfection of Microbes by Magnetized DC Plasma. J. Mod. Phys. 2014, 5, 781–791. [Google Scholar] [CrossRef] [Green Version]
  40. Galaly, A.R.; Zahran, H.H. Inactivation of Bacteria using Combined Effects of Magnetic Field, Low Pressure and Ultra Low Frequency Plasma Discharges (ULFP). J. Phys. Conf. Ser. (IOP) 2013, 431, 012014. [Google Scholar] [CrossRef] [Green Version]
  41. Lam, Y.L.; Kan, C.W.; Yuen, C.W. Effect of oxygen plasma pre-treatment and titanium dioxide overlay coating on flame retardant finished cotton fabrics. Bioresources 2011, 6, 1454–1474. [Google Scholar]
  42. Deng, X.; Nikiforov, A.; Coenye, T.; Cools, P.; Aziz, G.; Morent, R.; De Geyter, N.; Leys, C. Antimicrobial nano-silver non-woven polyethylene terephthalate fabric via an atmospheric pressure plasma deposition process. Sci. Rep. 2015, 5, 10138. [Google Scholar] [CrossRef] [PubMed]
  43. The International Commission on Non-Ionizing Radiation Protection. Guidelines on limits of exposure to ultraviolet radiation of wavelengths between 180 nm and 400 nm incoherent optical radiation. Health Phys. 2004, 87, 171–179. [Google Scholar] [CrossRef] [PubMed]
  44. The International Commission on Non-Ionizing Radiation Protection. General approach to protection against non-ionizing radiation. Health Phys. 2002, 82, 540–545. [Google Scholar] [CrossRef] [PubMed]
Figure 1. (a) Schematic diagram of APPJ experimental set-up; (b) Typical example of a ground electrode; (c) Plasma jet width and length as calibration scale.
Applsci 11 06870 g001aApplsci 11 06870 g001b
Figure 2. (a) Voltage waveform and current waveforms for (b) 1 slm argon gas, (c) admixture of argon 1 slm/0.25% oxygen, and (d) admixture of argon 1 slm/1.5% oxygen.
Applsci 11 06870 g002aApplsci 11 06870 g002b
Figure 3. Influence of different flow rates on discharge plasma power (a) for pure argon, (b) for different oxygen ratios.
Applsci 11 06870 g003
Figure 4. (a) Photo-imaging of the plasma jet lengths for argon discharge as a function of flow rate from 0.2 slm to 4 slm, and (b) Photo-imaging of the plasma jet lengths for oxygen ratio from 0.25% to 1.5%.
Applsci 11 06870 g004
Figure 5. Influence of different flow rates on the length of the emerging plasma jet (a) for pure argon, (b) for oxygen ratios with argon flow rate 1 slm.
Applsci 11 06870 g005aApplsci 11 06870 g005b
Figure 6. Relation between the plasma jet length and the width of the jet of dry argon for a flow rate (a) from 1.2 to 2 slm, (b) from 2.8 to 4 slm.
Applsci 11 06870 g006
Figure 7. (a) Jet width for wet argon as a function of plasma jet length less than 10 mm and at different applied flow rate ratios of oxygen. (b) Jet width for wet argon as a function of plasma jet length ranging from 11 to 18 mm and at different applied flow rate ratios of oxygen.
Applsci 11 06870 g007
Figure 8. Axial distribution of temperatures from the nozzle of the plasma source at different powers for argon discharge.
Applsci 11 06870 g008
Figure 9. Axial temperature distributions for argon at different applied flow rates.
Applsci 11 06870 g009
Figure 10. Oxygen ratio (with 1 slm of argon flow rate) vs. temperature of the emerging jet for different axial distributions.
Applsci 11 06870 g010
Figure 11. Optical emission spectra of APPJ using argon discharge at an applied flow rate of 1.8 slm for (a) nozzle and (b) 10 mm.
Applsci 11 06870 g011
Figure 12. Optical emission spectra of APPJ using argon discharge at an applied flow rate of 3.2 slm for (a) nozzle and (b) 10 mm.
Applsci 11 06870 g012
Figure 13. Optical emission spectra of APPJ using oxygen/argon admixture discharge at an applied flow rate of 0.25% of O2 for (a) nozzle and (b) 10 mm.
Applsci 11 06870 g013
Figure 14. Optical emission spectra of APPJ using oxygen/argon admixture discharge at an applied flow rate of 1.5% of O2 for (a) nozzle and (b) 10 mm.
Applsci 11 06870 g014
Figure 15. Dose rate of irradiance per unit area (μJ/mm2) of plasma jet discharge as a function of plasma jet length (a) for argon discharge with different flow rates and (b) for oxygen/argon admixture discharge for different oxygen ratios.
Applsci 11 06870 g015
Table 1. Tube dimensions and powering characteristics.
Tube dimensionsCeramicMaterial
CylindricalShape
70 mmLength
2 mmOuter diameter
1.5 mmInner diameter (Nozzle)
Powering characteristicsAC high voltagePower source
2.5 to 25 kVApplied voltage
60 kHzFrequency
Table 2. Equivalent O2 flow rate ratio.
O2 Flow RateEquivalent O2 Ratio
2.5 mslm0.25%
5 mslm0.50%
10 mslm1%
15 mslm1.5%
Table 3. Largest width of the jet for dry argon discharge and the equivalent length.
Flow Rate slmWidth mmLength mm
1.81.913.2
22.0713.2
2.81.88.8
31.738.8
Table 4. Largest width of the jet for oxygen/argon admixture discharge and the equivalent length.
Axial Length of the Jet (mm)Width (mm)Oxygen Ratio 0.25%Oxygen Ratio 0.50%Oxygen Ratio 1%Oxygen Ratio 1.5%
13.20.4550.510.4550.4
15.40.5610.5610.7070.854
17.60.5610.7560.8531.196
Publisher’s Note: MDPI stays neutral with regard to jurisdictional claims in published maps and institutional affiliations.