Article

Determination of VOCs in Surgical Resected Tissues from Colorectal Cancer Patients by Solid Phase Microextraction Coupled to Gas Chromatography–Mass Spectrometry

by
Nicoletta De Vietro
1,
Antonella Maria Aresta
1,*,
Arcangelo Picciariello
2,
Maria Teresa Rotelli
2 and
Carlo Zambonin
1
1
Department of Chemistry, University “Aldo Moro”, Via Orabona, 4, 70126 Bari, Italy
2
Surgical Unit “M. Rubino”, Department of Emergency and Organ Transplantation, University “Aldo Moro”, 70126 Bari, Italy
*
Author to whom correspondence should be addressed.
Appl. Sci. 2021, 11(15), 6910; https://doi.org/10.3390/app11156910
Submission received: 6 July 2021 / Revised: 22 July 2021 / Accepted: 23 July 2021 / Published: 27 July 2021

Abstract

:
Early diagnosis of colorectal cancer is crucial to increase the survival rates of the patients and breath analysis represents a promising non-invasive tool to obtain information on cancer-related variations on the human volatilome. A solid phase microextraction coupled to gas chromatography–mass spectrometry method for the determination of seven selected compounds, representative of the volatilome secreted by the colonic mucosa of patients affected by colorectal cancer, including benzaldehyde, benzoic acid, dodecane, ethylbenzene, octanal, tetradecane and toluene, was developed. All the extraction parameters were studied for both headspace and direct immersion sampling and the procedures fully validated. The potential of the approach was demonstrated by the time monitoring of the emission of the selected volatile organic compounds from the surgical resected colon mucosa tissues of colorectal cancer patients. Furthermore, the extraction and identification of thirty-one volatile organic compounds secreted by the same tissues was accomplished.

1. Introduction

Colorectal cancer (CRC) is a leading cause of cancer-related death [1,2,3,4] and the third most prevalent malignancy worldwide [5]. Only an early diagnosis can increase the 5-year survival rate up to 90% [4].
The volatilome [6] is represented by the volatile fraction of metabolome generated within the human organism and reflects the metabolic processes in the body, which may change in presence of cancer [7,8,9]. Wherever cancer is in the body, the volatile organic compounds (VOCs) released by the tumor tissue into the bloodstream are subsequently eliminated through the lung alveoli as components of exhaled air [10,11], making breath analysis an attractive, promising and non-invasive means for the diagnosis and follow-up of the disease [12].
Several investigations have confirmed that different patterns of VOCs are exhaled by patients affected by different tumors [13,14,15,16] and our previous studies pointed out that selected VOCs could discriminate CRC patients from normal individuals [16,17]. Specifically, three VOCs (benzaldehyde, ethylbenzene and tetradecane) were found to be useful to detect differences among patterns of substances secreted by cancerogenic tissues compared to heathy mucosa, in the same individual. If reflected in the pattern of exhaled VOCs of the patients, those differences could lead to a simple, non-invasive, unexpensive method for early diagnosis of the disease based on the direct breath analysis [16].
Solid phase microextraction (SPME) is a simple, sensitive and cost-effective [18,19,20,21,22,23,24,25] technique for the extraction of volatile and semi-volatile compounds by means of a fiber coated with a proper polymeric phase. The extraction can be performed in the headspace (HS-SPME) of solid/liquid matrixes, exposing to the gas phase the polymeric film that adsorbs the volatiles, or by direct immersion (DI-SPME) of the fiber in a small volume of aqueous samples [20,21]. As the SPME mechanism is based on the equilibrium of analytes among different phases, the extraction of the compounds is greatly influenced by the vapor pressure in the vial, which depends on extraction temperature, equilibrium and extraction time [22]. Therefore, these parameters must be carefully optimized [22,23,24,25], together with other important variables, including ionic strength, pH, sample volume, uniformity and stirring speed [22,23,24,25]. Recently, our research group successfully applied HS-SPME to find correlation among the VOCs released by the surgical resected tissue of patients affected by CRC and the VOCs contained in their exhaled breath, collected in sorbent tubes and desorbed with a thermal desorber [17]. This study was then aimed to optimize and compare two different extraction protocols, based on HS- and DI-SPME, respectively, for the extraction of seven target VOCs secreted by surgical resected tissues of the colonic mucosa of colorectal carcinoma patients, whose concentration likely depends on the presence of the disease. All the relevant parameters were carefully optimized and the methods were validated using the ideal conditions. The extracted compounds were then subsequently analyzed by gas chromatography–mass spectrometry (GC–MS) in selected ion monitoring (SIM) mode. Both optimized protocols were then employed for the analysis of colon tissues (healthy tissue and tumor) from CRC patients, allowing to extract and identify 31 secreted VOCs. Besides, the DI-SPME approach permitted to perform kinetic studies, being independent from the metabolic evolution of the ex vivo systems, monitoring over time the emission of the seven selected VOCs. Therefore, both systems described could be useful to understand which metabolites released come directly from the healthy or tumor tissue of the same patient, but the DI-SPME system, described here for the first time, could provide more important and useful knowledge for understanding CRC metabolism.

2. Materials and Methods

2.1. Chemicals and SPME Device

All standards (benzaldehyde, benzoic acid, dodecane, ethylbenzene, octanal, tetradecane and toluene) were purchased from Supelco (Sigma-Aldrich, St. Louis, MI, Italy) and were certified as reference material, except octanal, which was of analytical degree (≥98%, purity). Stock solutions of each compound (10 mg/mL) were prepared in methanol (Sigma-Aldrich, MI, Italy), stored at 8 °C and daily diluted in a fresh culture medium (Dulbecco’s Modified Eagle Medium, Euroclone, MI, Italy) to prepare working standard mixtures.
The SPME assembly kit (Supelco) included a manual holder and six different fiber coatings (1 cm, length), namely, 60 μm carbowax-polyethylene glycol (PEG), 85 μm polyacrylate (PA), 75 μm carboxen/polydimethylsiloxane (CAR/PDMS), 50/30 μm divinylbenzene/carboxen/polydimethylsiloxane (CAR/DVB/PDMS), 65 μm polydimetylsiloxane/divinylbenzene (PDMS/DVB) and 7 μm polydimetylsiloxane (PDMS). Before use, fibers were conditioned in the GC injector, as suggested by the supplier.

2.2. SPME VOCs Extraction

VOCs extraction by HS-SPME was carried out as follows: A volume of 0.1 mL of a working standard mixture (1 mg/mL) was added to a 7 mL amber glass vial, fitted with a PTFE/silicone septum and screw cap (Sigma-Aldrich), containing 1 mL of sterile culture medium (HS-vial). The fiber was placed about 1.5 cm above the solution at 37 °C for 30 min.
DI-SPME was carried out as follows: A volume of 15 µL were taken from the HS-vials, by piercing the silicone septum using a Hamilton microliter syringe (Sigma-Aldrich), and transferred in a 1.7 mL vial containing 1.5 mL of an aqueous solution and a magnetic stir bar (Sigma-Aldrich). After sealing with cap equipped with PTFE/silicone septa, the fiber was immersed in the solution under stirring (700 rpm) for a 60 min at room temperature, or at 50 °C.
After obtaining written informed consent, samples of fresh cancer tissues and normal colonic mucosa were surgically resected from three colorectal affected patients (one man and two women, mean age 65 ± 10 years, tumor localized to the right colon, stage III). Immediately after resection, tissues were cut in weighted biopsies of 0.5 ± 0.0.5 g and hermetically sealed in a 7 mL screw top amber glass vial with a PTFE/silicone septum (Sigma-Aldrich), containing 1 mL of sterile culture medium. Within 30 min from resection, the vials were incubated in a thermostatic bath set at 37 °C and the analyses were performed by HS- and DI-SPME after 1, 2, 3 and 7 days of incubation. Simultaneously, 1 mL of culture medium was transferred to a similar vial, subjected to the same protocol and used as “blank” during the analyses.

2.3. GC–MS Apparatus and Analysis Experimental Conditions

A TRACE GC Ultra (Thermo Scientific, Waltham, MA, USA) was equipped with an ion-trap mass spectrometer (Polaris Q, Thermo Scientific). The chromatographic separation was performed with a TRACE TR-5 MS fused-silica capillary column (30 m × 0.25 mm i.d., 0.25 μm film thickness) (Thermo Scientific). Helium was the carrier gas, with a constant flow rate of 1.0 mL/min.
The optimized chromatographic conditions were as follows: The oven temperature was raised from an initial 40 °C (5 min) to 100 °C at 10 °C/ min, then to 130 °C at 3 °C/min and, finally, at 10 °C/ min to 220 °C (1 min). The injector temperature (splitless mode) was 200 °C. The mass spectrometer operated in the electron impact mode with a source temperature of 200 °C, an ionizing voltage of 70 eV and a transfer line temperature of 240 °C. The mass analyzer was used in full scan mode (40–250 m/z with a total scan time of 0.34 s), or selected ion monitoring (SIM) mode, using the experimental parameters shown in Table 1.
After extraction, fibers were directly transferred into the injection port of the GC for 2 min in splitless mode. In the case of ex vivo experiments, fibers were further exposed for 5 min in the GC injector port at 250 °C before a new sampling to prevent memory effects.

3. Results and Discussion

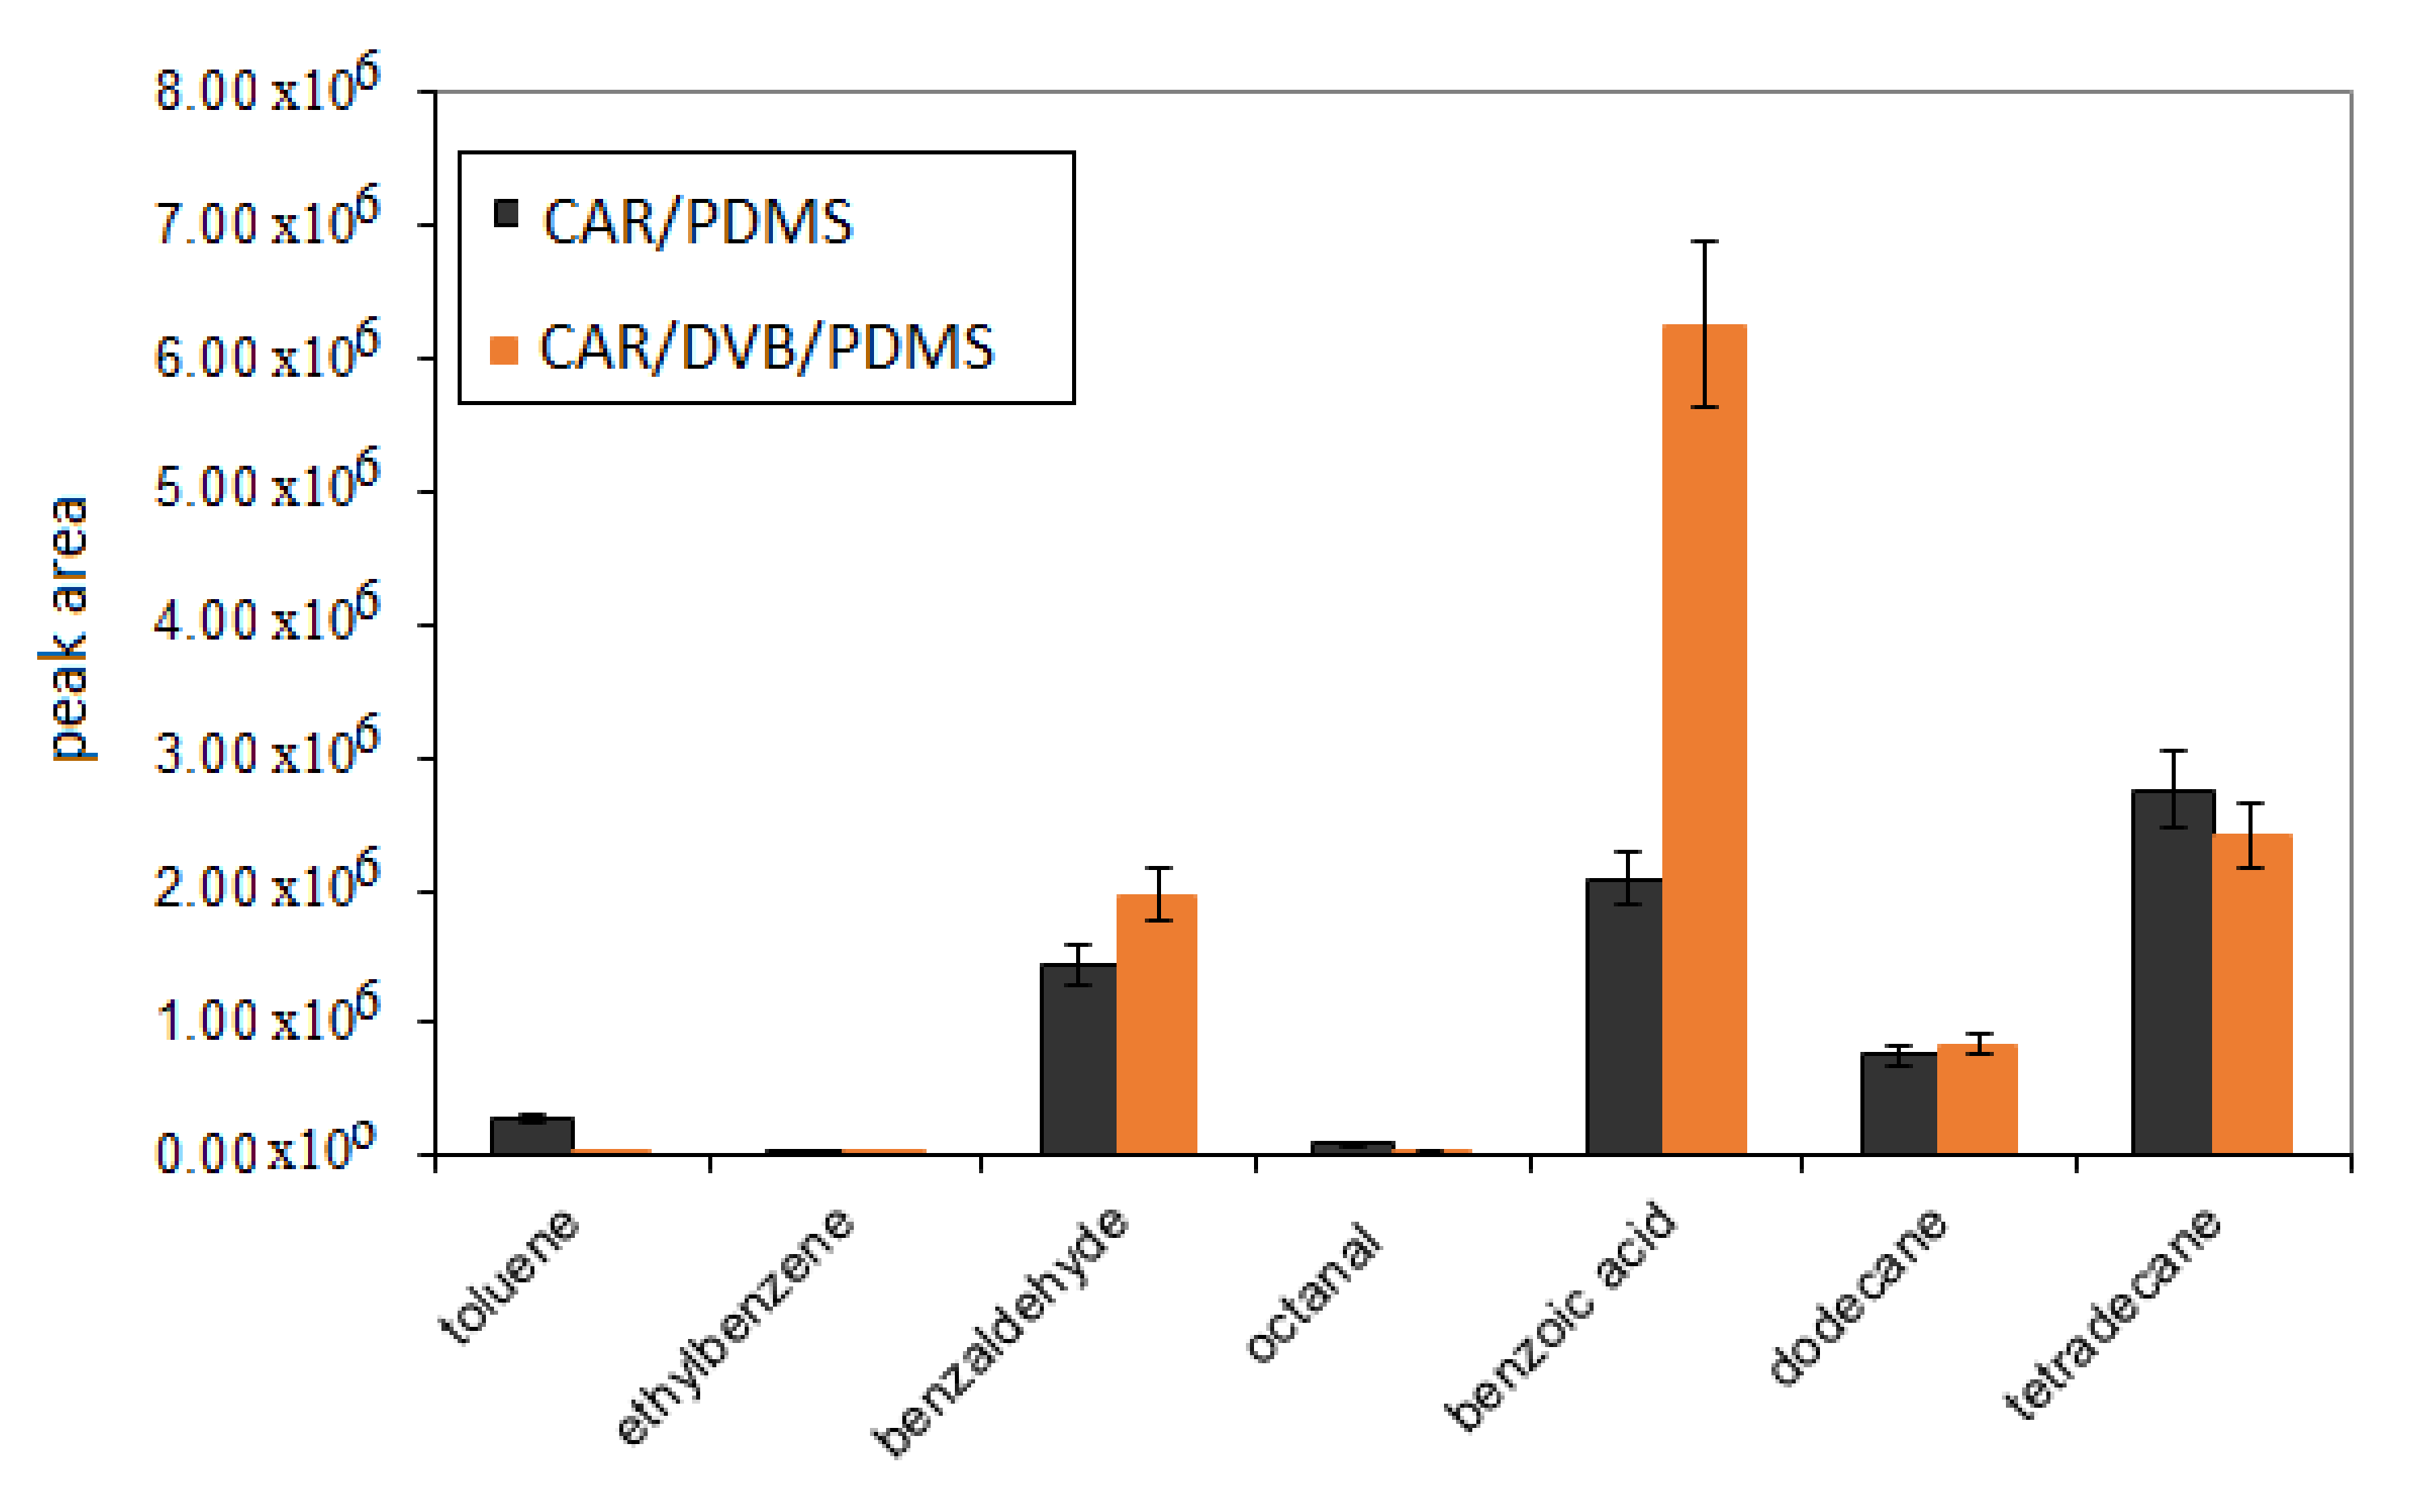
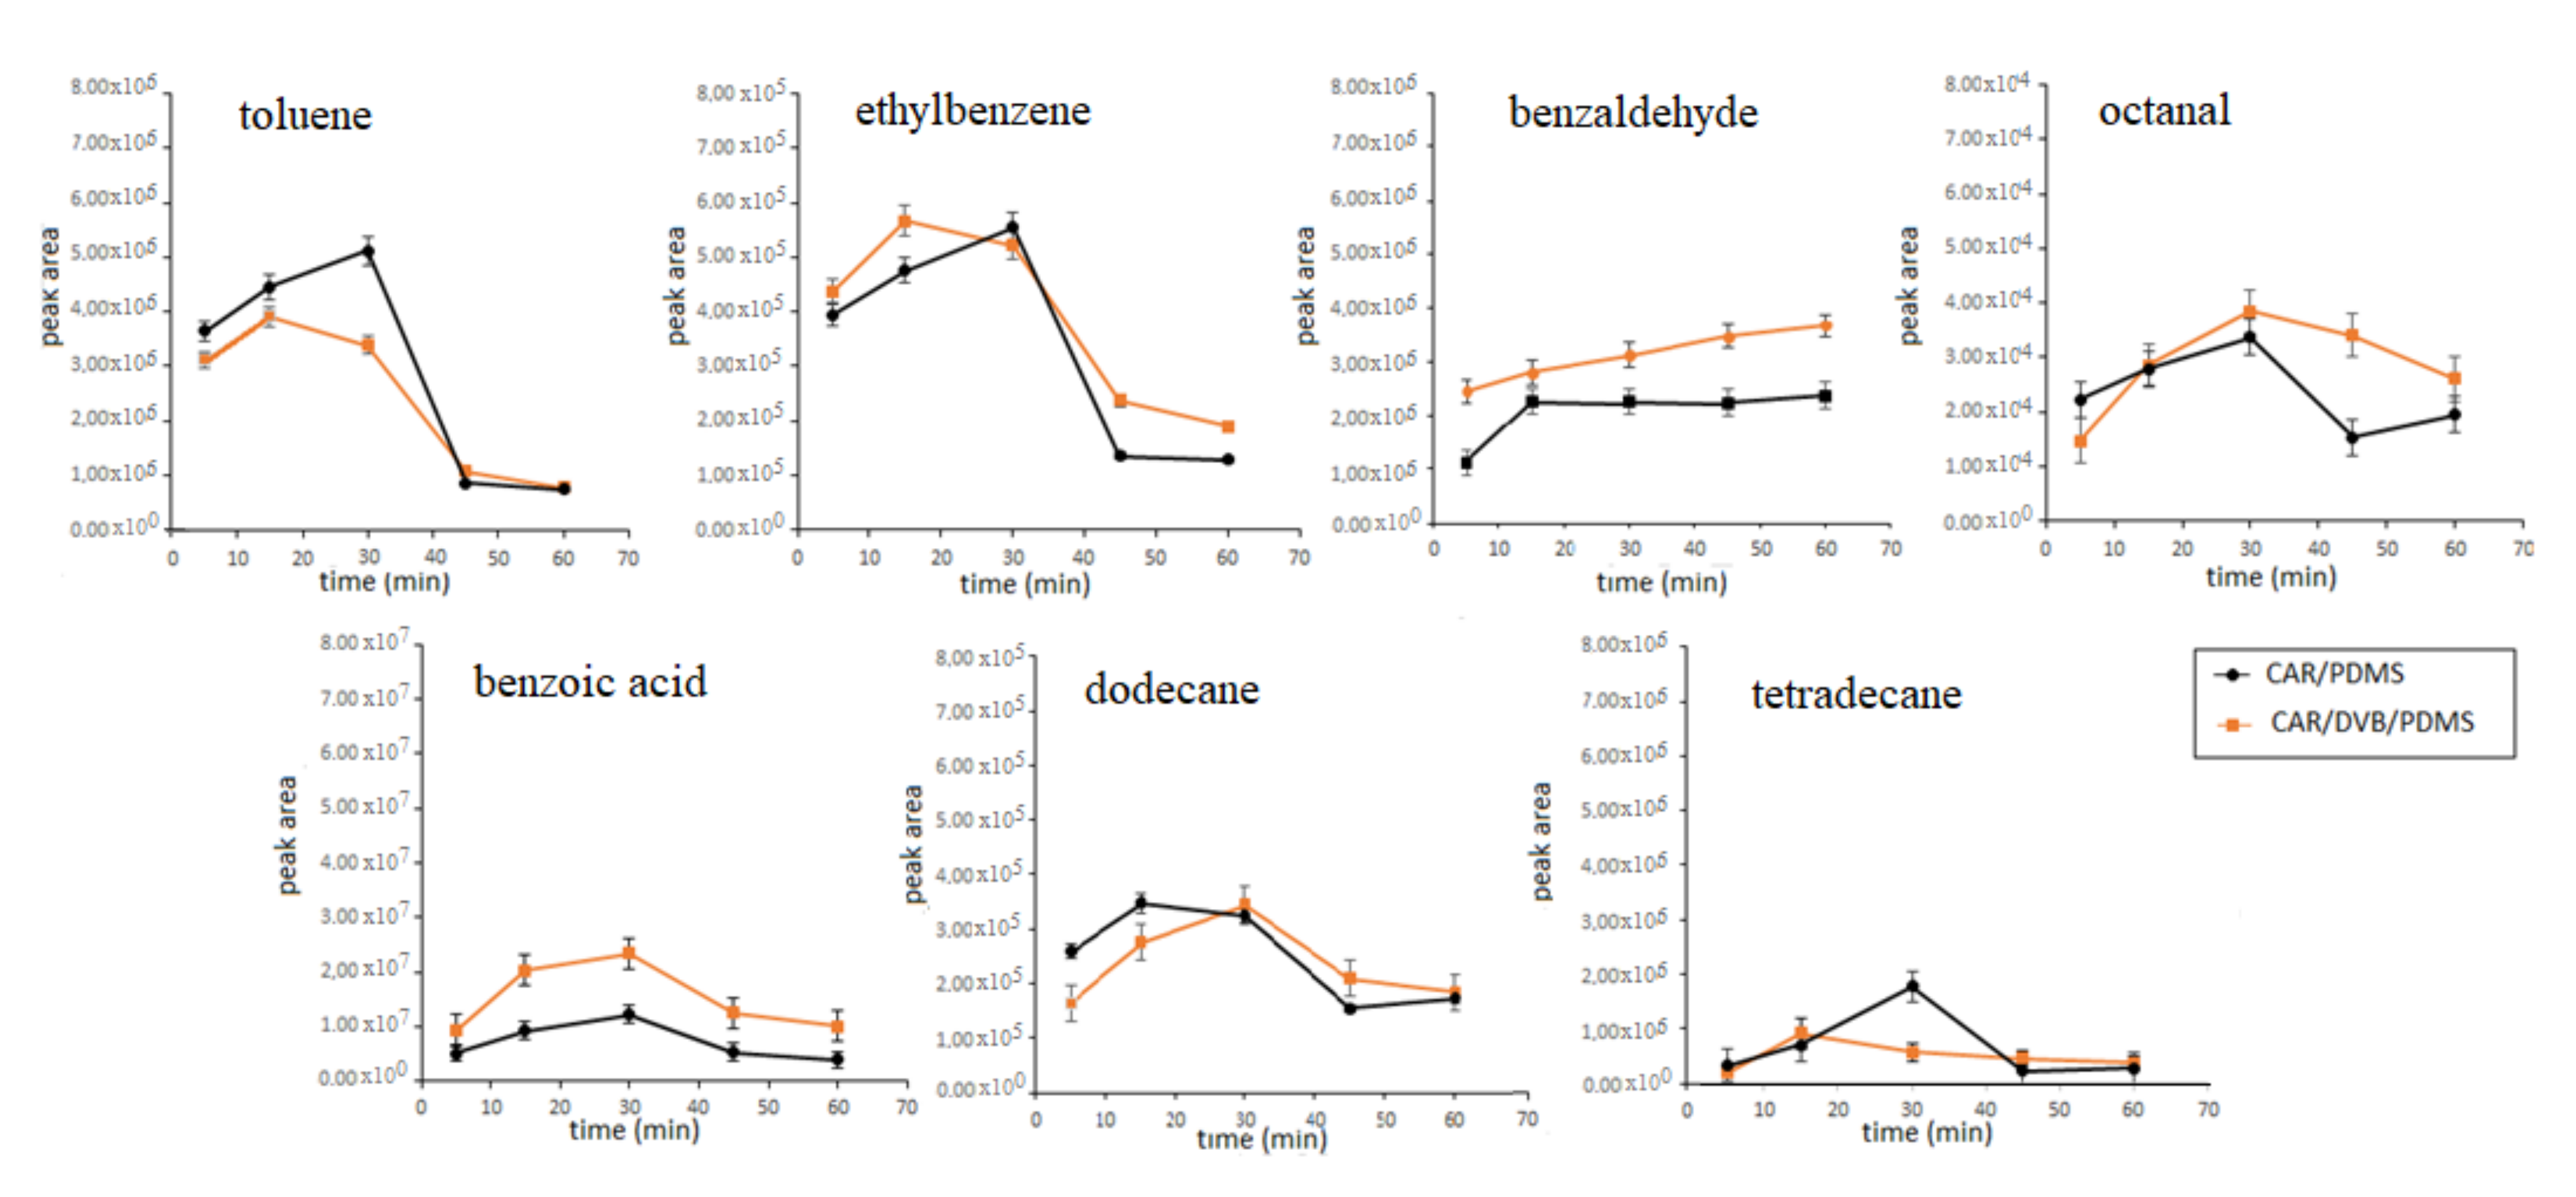
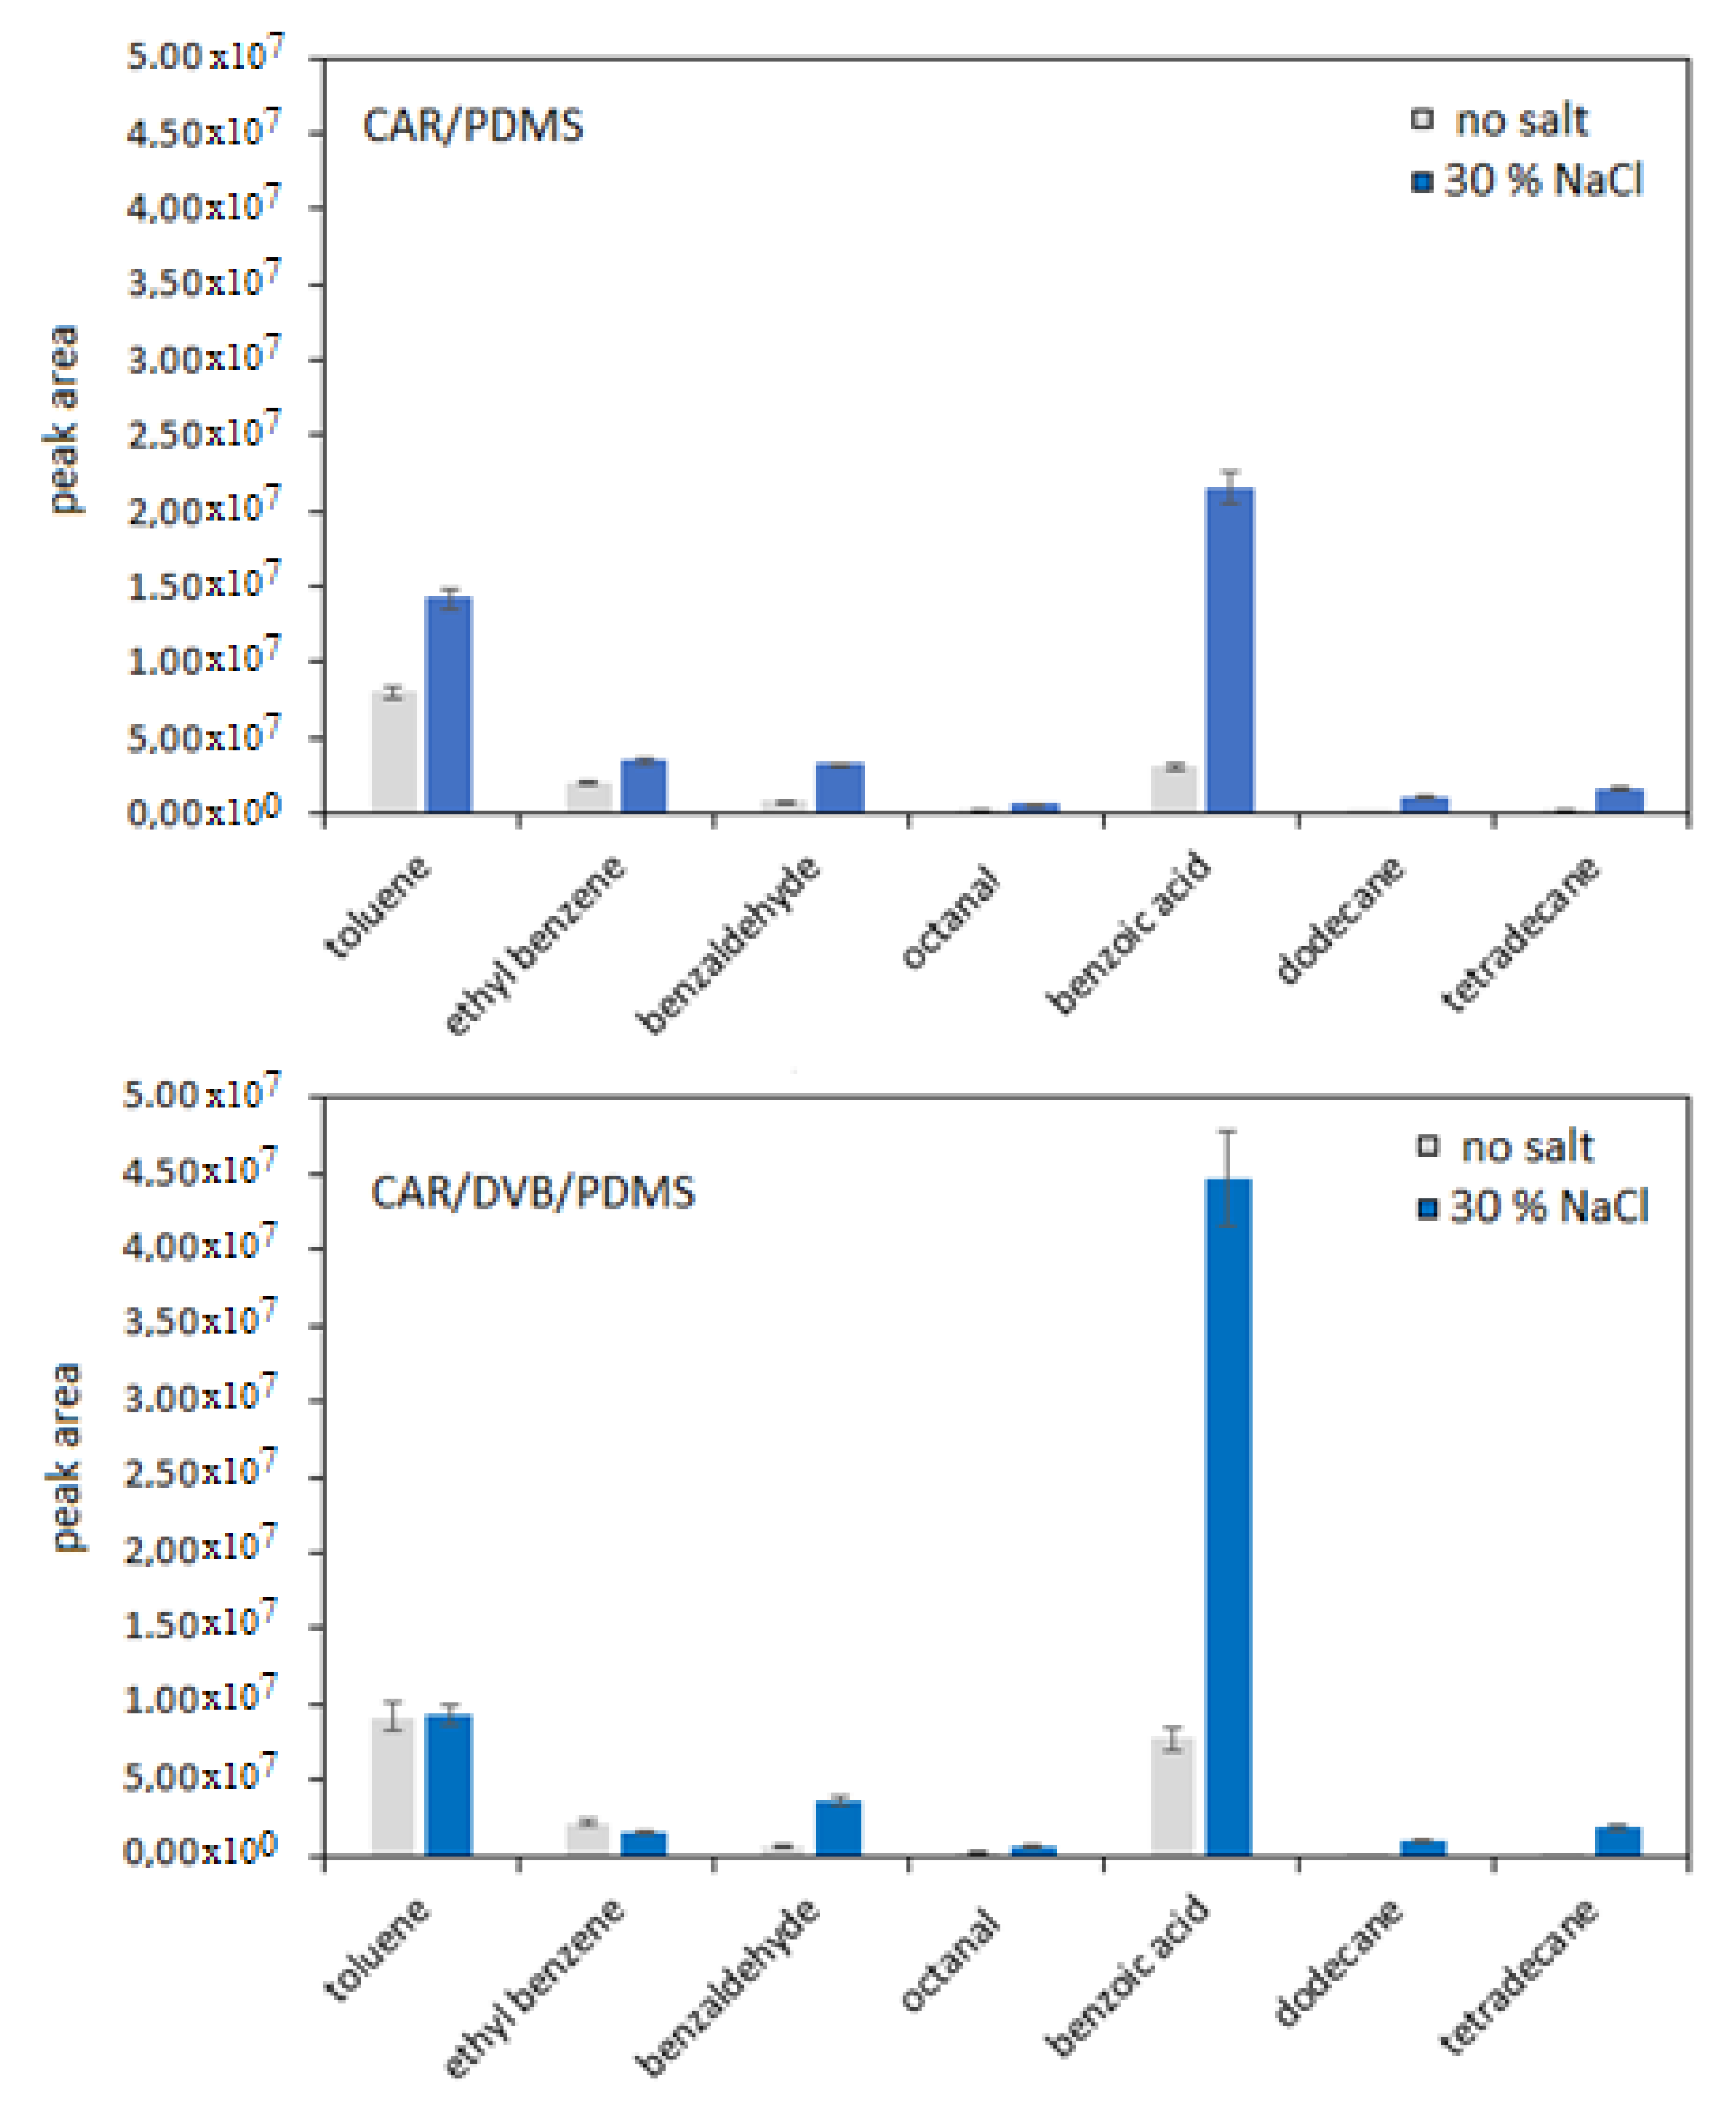
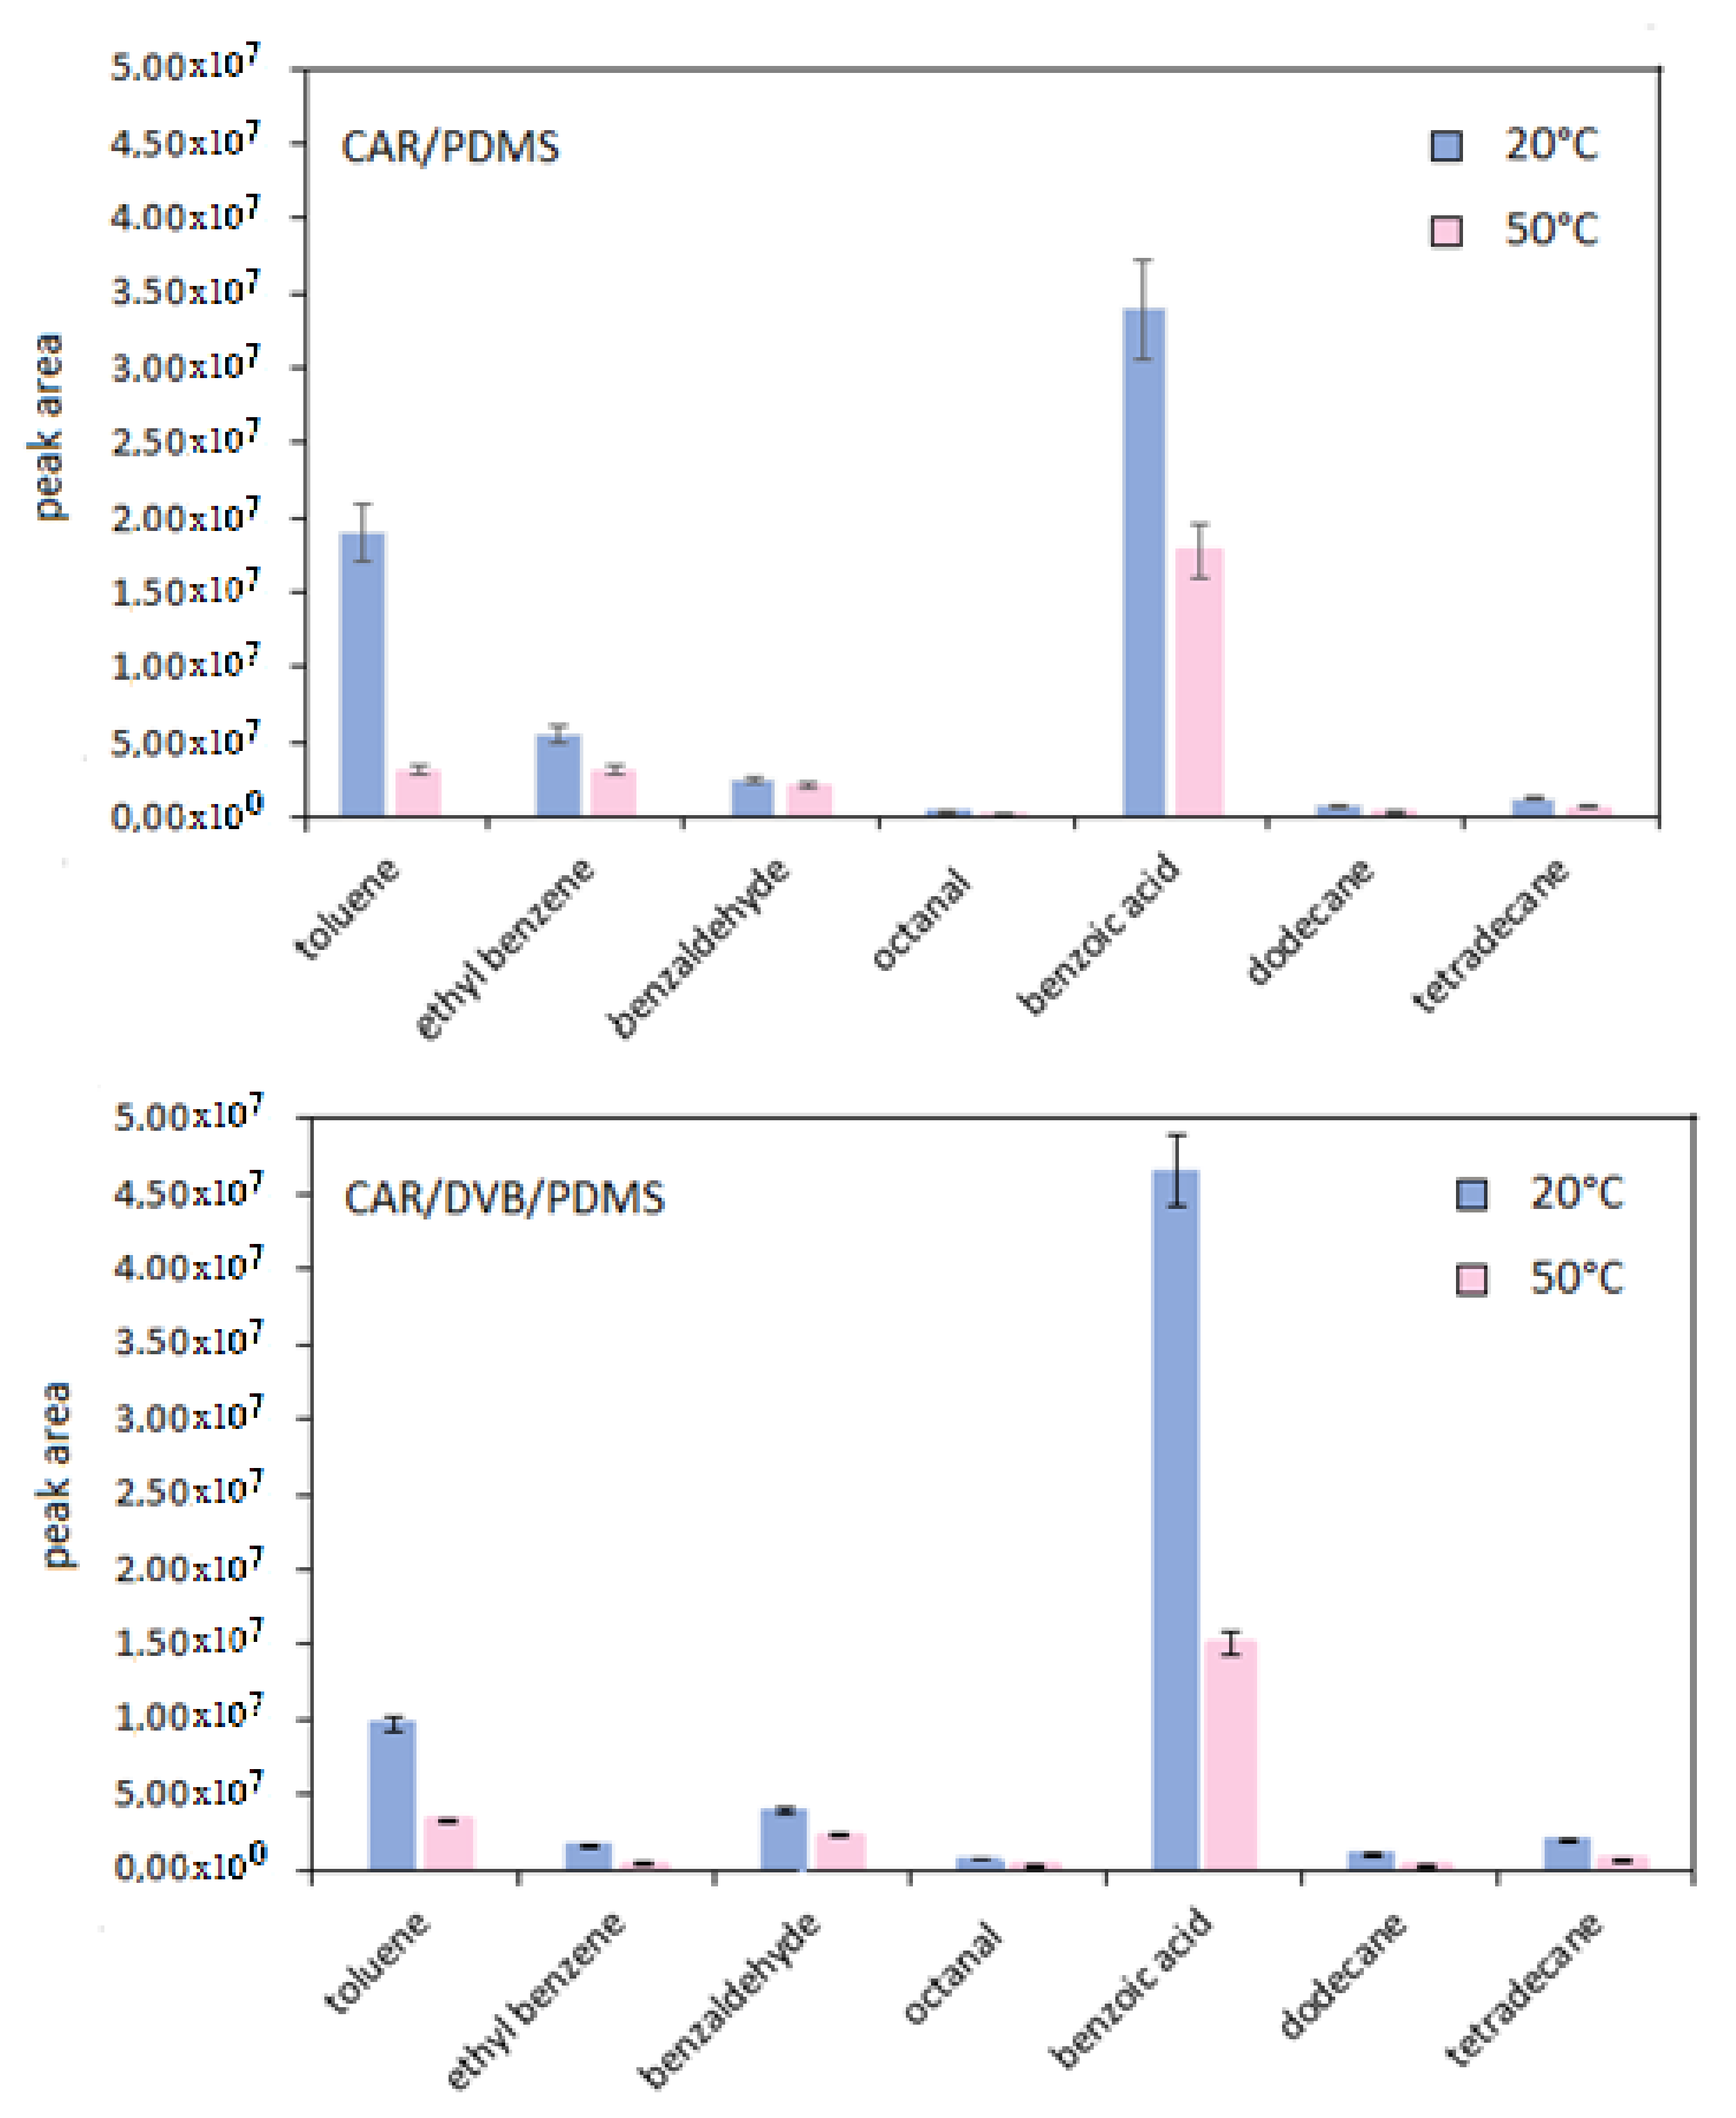
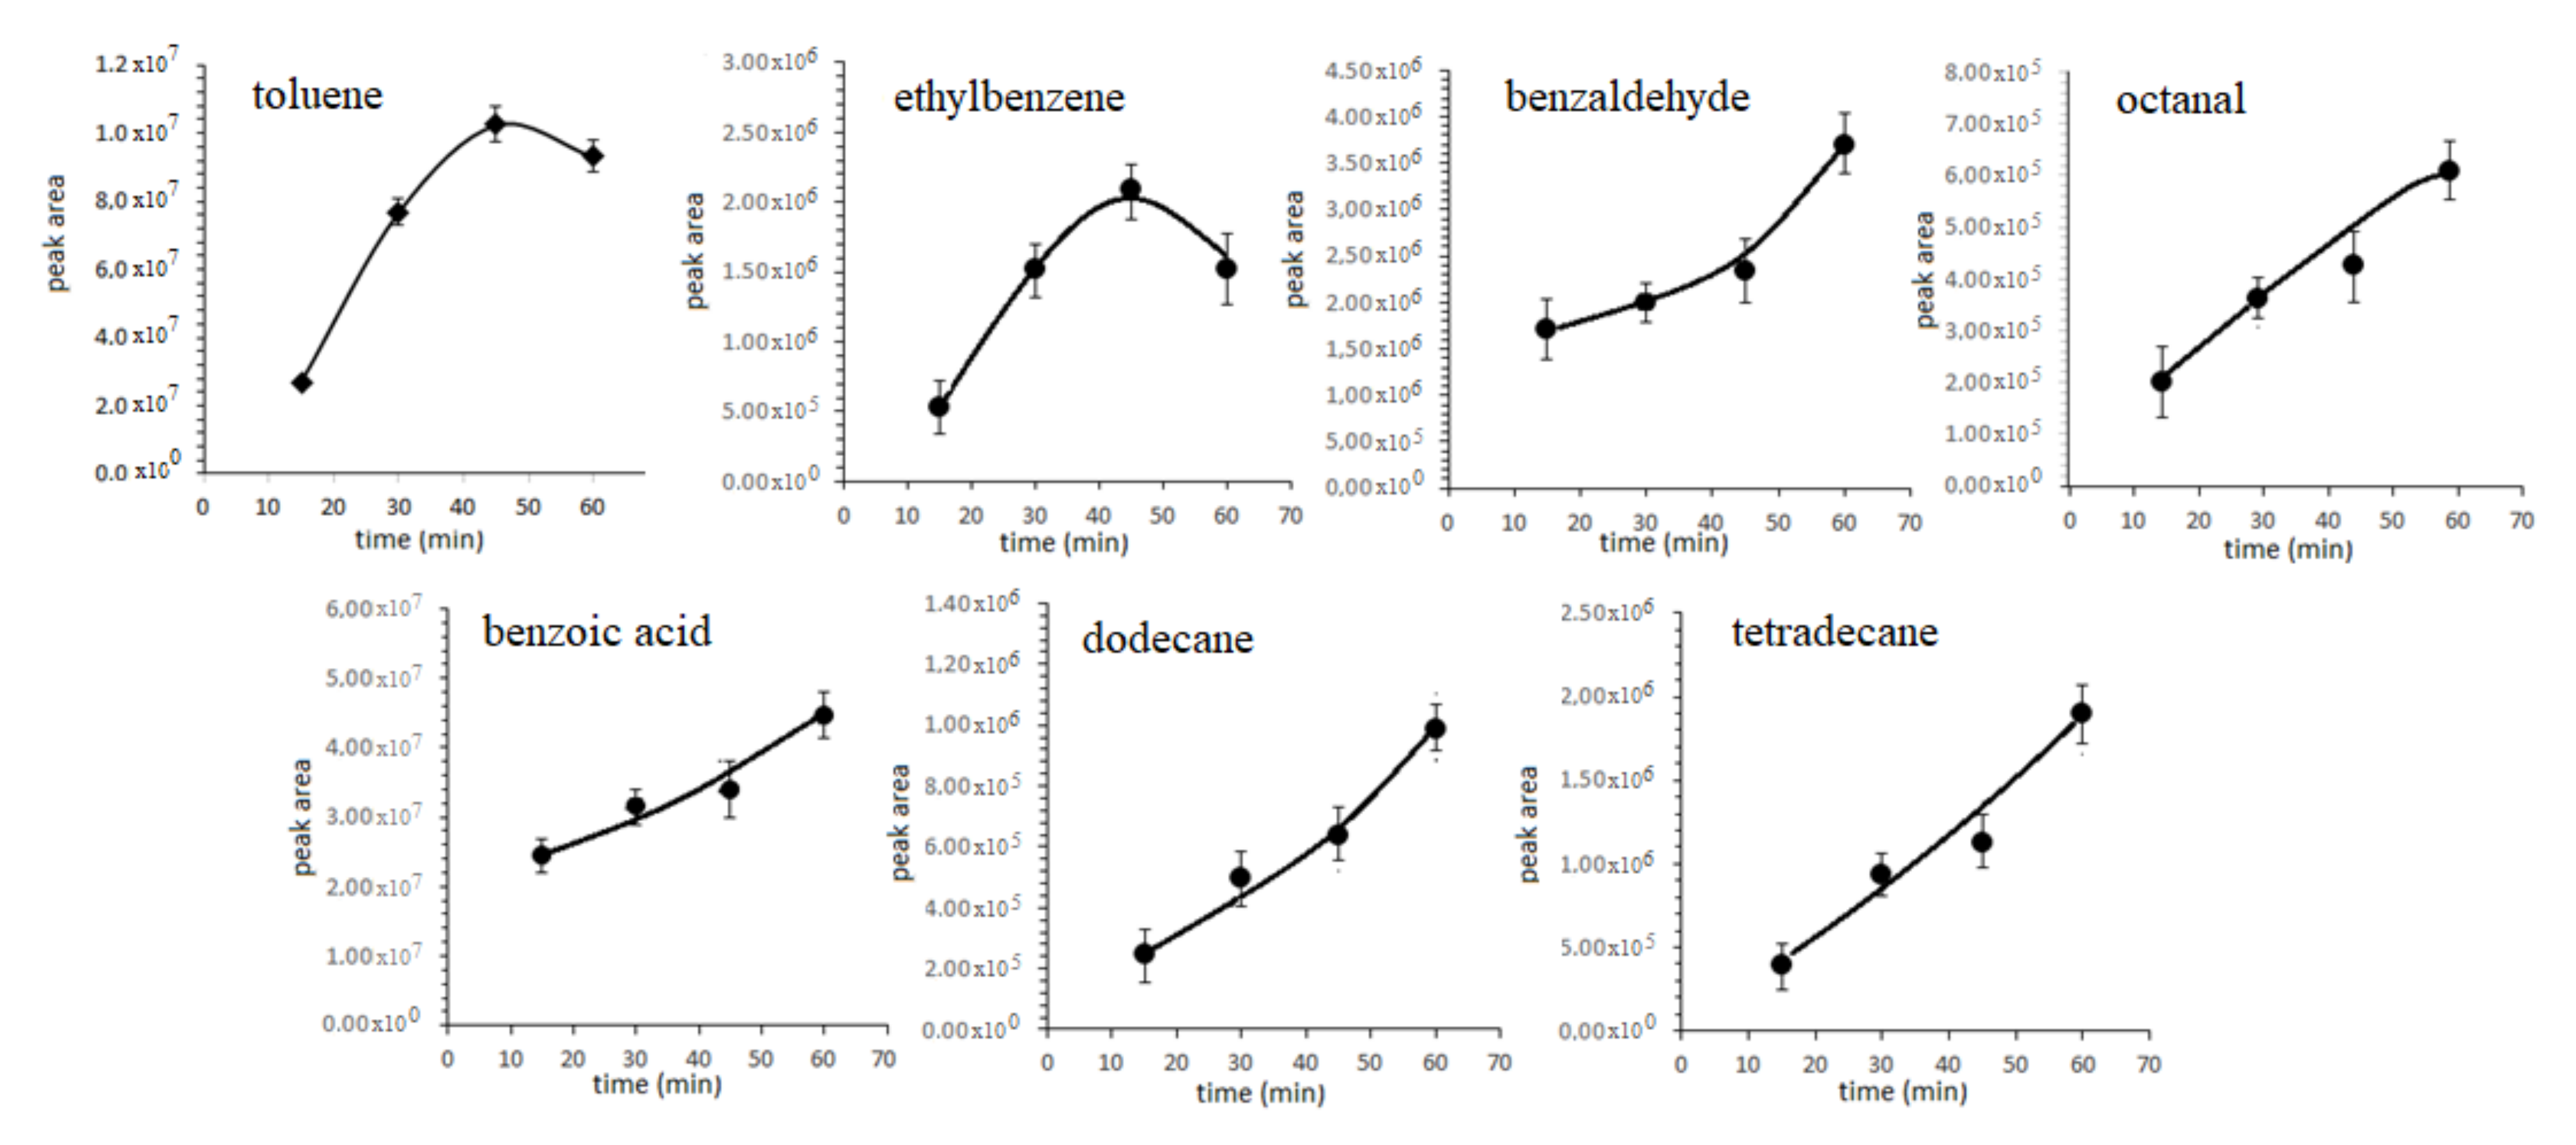
3.1. Optimization of SPME Parameters

Starting from the optimization of the HS-SPME conditions, preliminary experiments were performed in order to compare the extraction efficiency of different fiber coatings, namely, polyethylene glycol (PEG), polyacrylate (PA), carboxen/polydimethylsiloxane (CAR/PDMS), carboxen (CAR), carboxen/divinylbenzene/polydimethylsiloxane (CAR/DVB/PDMS) and polydimethylsiloxane (PDMS), using the experimental conditions reported in Section 2.2 (exposure time 30 min, after 30 min of sample heating at 37 °C). A good compromise for the simultaneous extraction of all the selected targets compounds was reached employing the bipolar fibers CAR/PDMS and CAR/DVB/PDMS, which were then selected for further experiments. Figure 1 compares the instrumental response obtained for each analyte using the two fibers.
Then, desorption conditions in the GC injector (splitless mode) were optimized testing different combinations of temperature and time, evaluating the carry-over after each desorption. It was found that 2 min at 200 °C were sufficient to completely remove the volatiles from the fiber.
The optimization of the extraction temperature, pH, ionic strength and stirring were not performed, since the method is intended to be applied to ex vivo experiments that involve surgical resected tissues of CRC patients and their subsequent cultivation in laboratory, under suitable conditions of sterility. Therefore, only extraction time profiles at 37 °C (ex vivo incubation temperature) were evaluated for both selected fibers and the relevant results reported in Figure 2. As apparent, 30 min of HS sampling were required to obtain the best response for the analytes with both fibers, with the only exception of benzaldehyde and tetradecane with CAR/DVB and CAR/DVB/PDMS fibers, respectively, that reached equilibrium after 15 min.
DI-SPME extraction was also considered, since it could provide useful information for the evaluation of metabolites directly released from the tissues into the culture medium. Then, all the main variables (time, temperature, ionic strength and pH) that influence the extraction process were evaluated, under constant agitation (700 rpm). It is worth noting that, to preserve the polymer phase, especially due to the presence of salt, the fibers were left overnight in distilled water without exposing the coating. This practice permitted to perform more than 80 consecutive extractions per fiber.
Generally speaking, salt addition often improves the recovery, due to the salting-out effect. Thus, experiments were performed by increasing progressively the ionic strength of the extraction solutions. Figure 3 reports the results obtained performing the extraction for 1 h at room temperature, without and after the addition (30%) of NaCl, respectively. As apparent, a positive effect of salt on the extraction was mostly observed.
The influence of pH and temperature on the extraction efficiency were also examined performing extractions by using different pH buffers and temperatures, even if they did not show a positive effect. Figure 4 reports, for instance, the results obtained working at room temperature and at 50 °C, clearly showing how the temperature increase produced a decrease of the peak area.
As can be easily inferred from the results obtained so far, the CAR/DVB/PDMS fiber showed the best extraction efficiencies for almost all the analytes and was then selected for the prosecution of the experiments. Figure 5 reports the extraction time profiles obtained with the CAR/DVB/PDMS fiber at room temperature in the presence of 30% NaCl. Equilibrium was reached after 45 min for toluene and ethylbenzene, while longer sampling times were required for the other analytes. However, considering that non-equilibrium extractions can be performed working under reproducible conditions, 60 min were selected as the best compromise between time and sensitivity.

3.2. Validation of HS-SPME and DI-SPME Optimized Methods Coupled to GC/MS

The optimized HS- and DI-SPME conditions were tested with linear regression analysis of peak area versus analyte concentration in culture medium, utilizing standard solutions of suitable concentration. The linear ranges and the equations of the calibration curves, together with limits of detection (LOD) and quantification (LOQ), calculated for the selected compounds with both the approaches, are reported in Table 2. The regression lines obtained by HS-SPME showed higher slopes than those obtained by DI-SPME only for benzaldehyde and octanal; opposite results were observed in the case of toluene, while comparable results were observed for the remaining analytes. This trend was also reflected in the LOD and LOQ values.
The within day (n = 3) and day-to-day (n = 3, over 7 days) relative standard deviations (RSD%) of the HS- and DI-SPME procedures were investigated on standard solutions of the analytes at concentration levels equal to 5, 10 and 20 times the LOQs. In the case of the HS procedure, RSD% values ≤10.5 (headspace) and ≤9.9% (direct immersion) were always obtained for all the analytes at different concentrations levels.

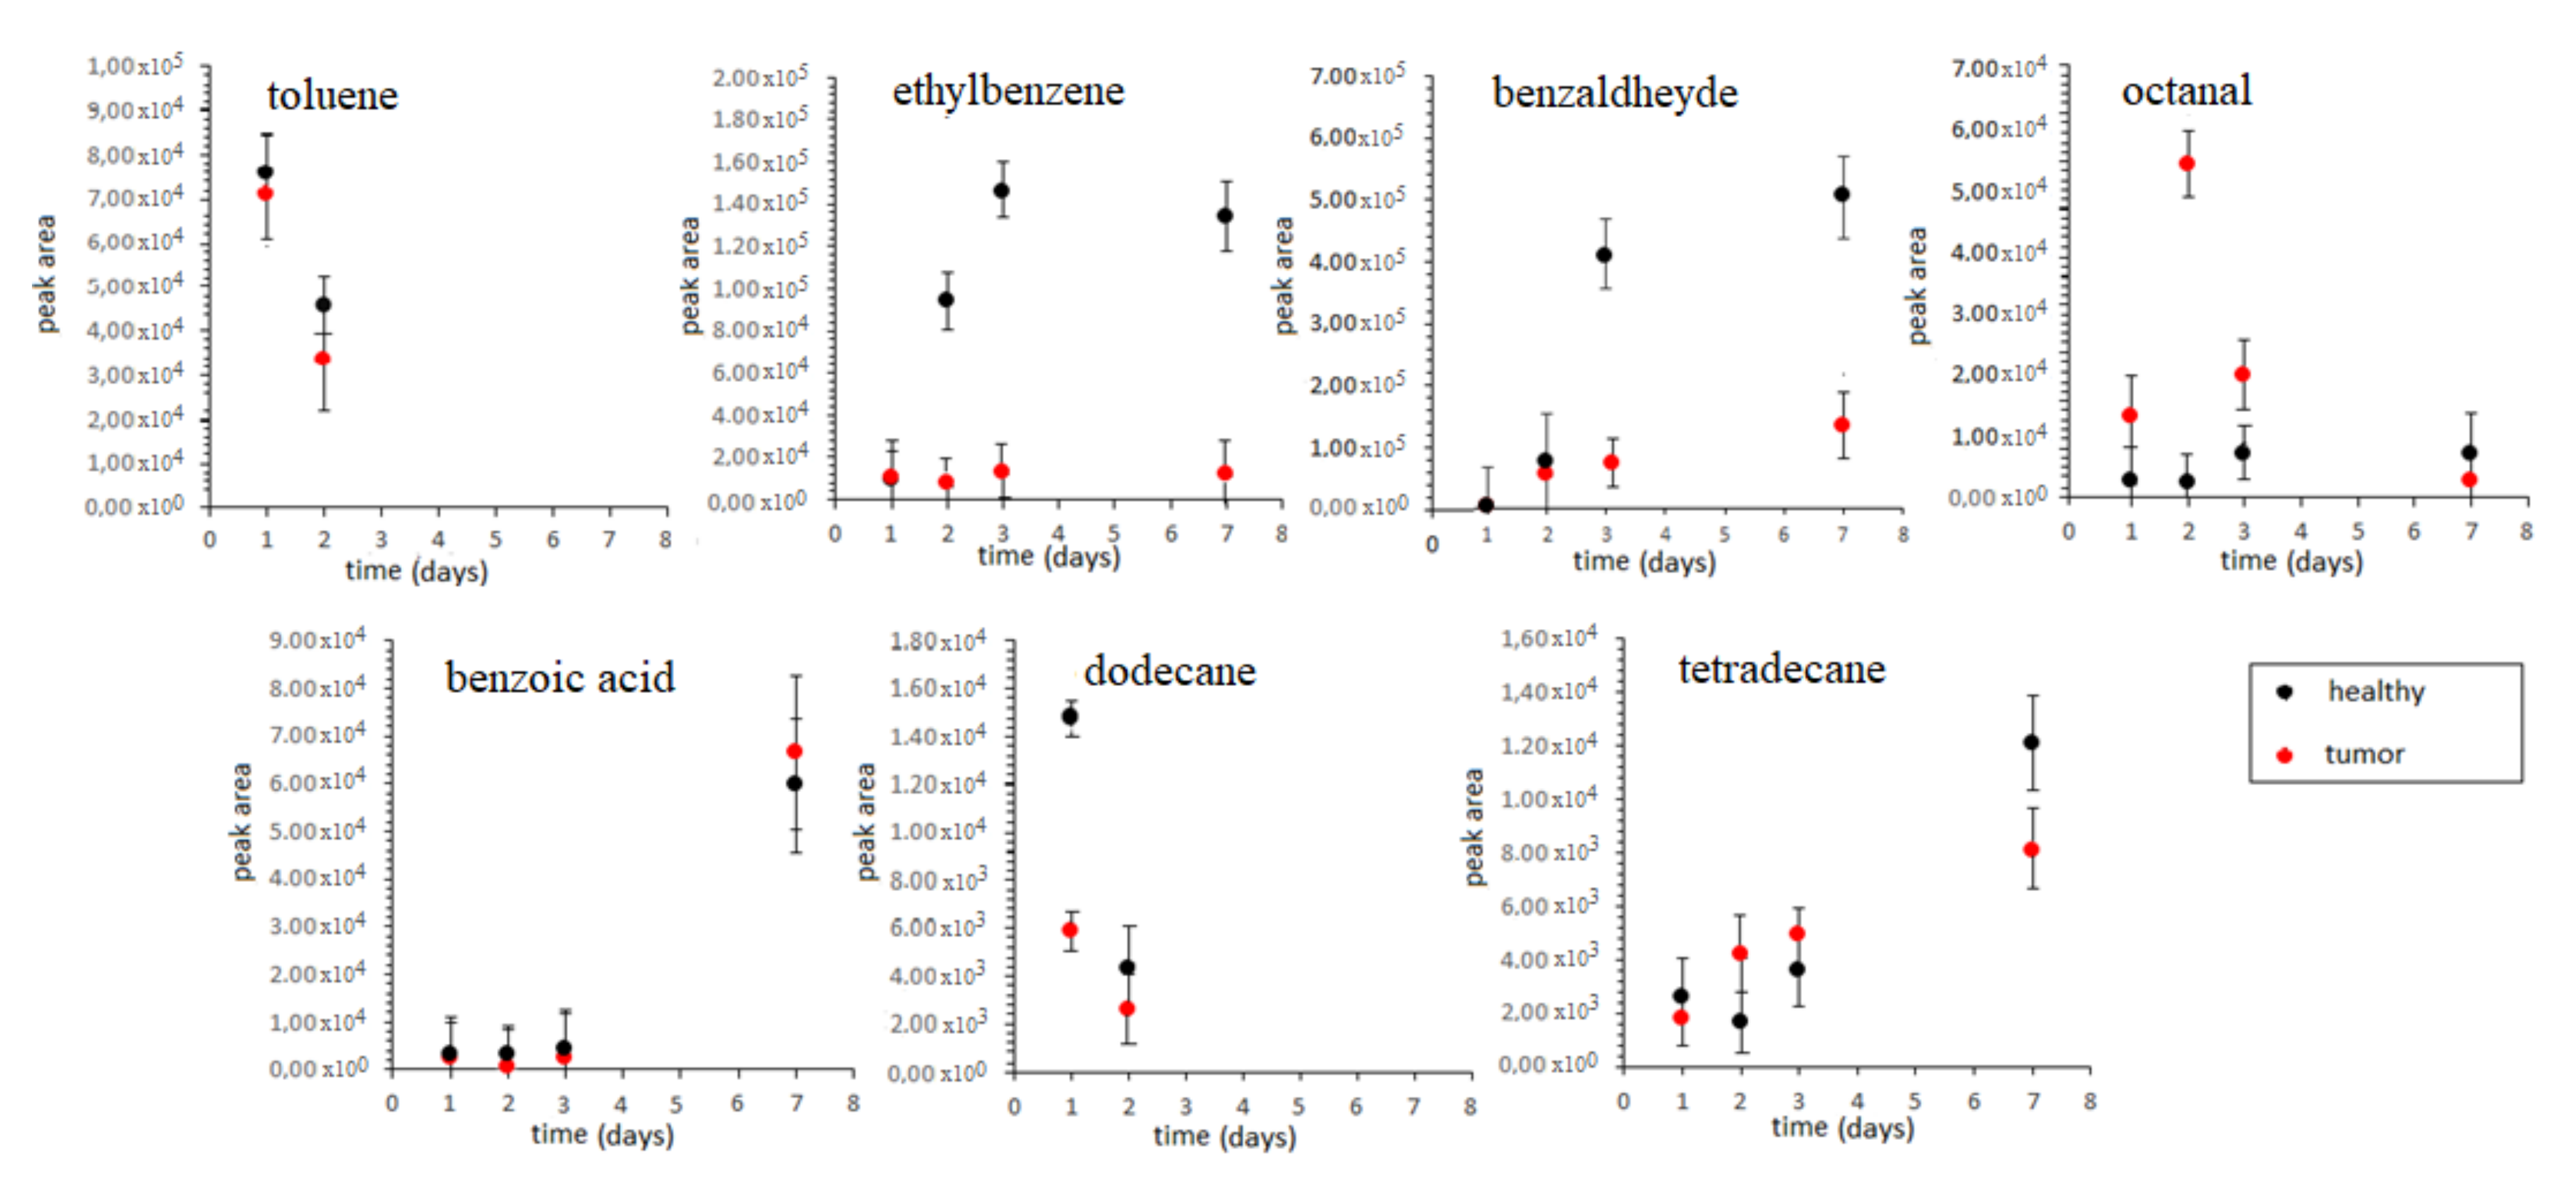
3.3. Analyses of Ex Vivo Colon Tissues from CRC Patients

The colon tissues (healthy tissue and tumor) from CRC patients were analyzed by HS- and DI-SPME-GC–MS, employing the optimized experimental conditions, and identities were attributed to the secreted VOCs. At first, peaks identification was carried out by comparing the mass spectra of the chromatographic peaks with those reported in the National Institute of Standards and Technology (NIST) library (http://webbook.nist.gov/chemistry/2018 (accessed on 6 July 2021)). Furthermore, the relative retention index (RI) of each compound was calculated using the RT of the C7–C30 series of homologous n-alkanes (1000 μg/mL in hexane from Supelco) and compared with those reported for substances analyzed under similar conditions. The protocols allowed to individuate 31 different compounds, shown in Table 3, clearly demonstrating the potential of the present approach.
The DI-SPME-GC–MS procedure was then used to monitor the progressive emission of seven selected VOCs from the healthy tissues and diseased mucosa, respectively, of three CRC patients, for 1 week in ex vivo conditions. The DI-SPME technique was preferred to carry out kinetic studies, because it permitted to be independent from the metabolic evolution of the ex vivo systems, which also makes impossible to perform replicate analyses on the same vials to evaluate intra- and inter-day variability. Figure 6 shows the kinetic profiles obtained for each analyte while Table 4 shows the concentration ranges of the analytes estimated in healthy tissues and diseased mucosa.
Data reported in Figure 6 suggest that the secretion of most of the selected compounds, i.e., benzaldehyde, ethylbenzene, octanal and tetradecane, from both type of tissues was observable for 6 days, with a constant increase for 4 days, when a plateau was reached. On the contrary, dodecane and toluene showed a fast reduction that lead to their total disappearance after only 2 days of incubation. In the case of ethylbenzene, octanal (after 2 days) and benzaldehyde, quantitative differences were observed between sick and healthy tissues of the same patient. Moreover, compared to the normal colonic mucosa, cancer tissue is characterized by higher release of benzaldehyde, likely due to the increase in the rate of specific metabolic processes catalyzed by the disease which, on the contrary, slows down the production of ethylbenzene.

4. Conclusions

This study aimed to optimize an experimental method suitable to extract and analyze VOCs secreted by surgical resected tissues of CRC patients, in order to find possible quantitative differences between patterns of substances secreted by the cancerogenic tissue compared to heathy mucosa of the same people, that could allow to develop a simple, non-invasive, cost-effective method for the early diagnosis of the disease based on the direct breath analysis.
For this purpose, HS-SPME-GC/MS and DI-SPME-GC/MS methods to quantify VOCs secreted by surgical resected colonic mucosa of three CRC patients were optimized. Seven compounds, relatable with substances detected in expired breath of the same patients (benzaldehyde, benzoic acid, dodecane, ethylbenzene, octanal, tetradecane and toluene), were selected as target compounds. The potential of the optimized protocols was demonstrated by the time monitoring of the concentration of the analytes, in ex vivo conditions and by the identification of 31 secreted compounds.

Author Contributions

A.M.A., N.D.V. and C.Z. conceived the original idea. A.P. provided conceptual guidance for the development of the clinical protocol. M.T.R. prepared the surgical resected tissues samples. A.M.A. and N.D.V. carried out the GC–MS analysis, also validating the indicated analytical methods and processing all the experimental data. The manuscript was written by A.M.A. and N.D.V. with the support of C.Z. All authors have read and agreed to the published version of the manuscript.

Funding

This research did not receive any specific grant from funding agencies in the public, commercial, or not-for-profit sectors.

Institutional Review Board Statement

The study was conducted according to the guidelines of the Declaration of Helsinki and approved by Local independent ethic committee “Azienda Ospedaliero-Universitaria Consorziale Policlinico di Bari” (cod. 0081215-29-10-2020).

Informed Consent Statement

Informed consent was obtained from all individual participants included in the study.

Acknowledgments

The authors thank Donato Francesco Altomare for surgical resected tissues samples supply and Manuela Triggiani for statistical support.

Conflicts of Interest

The authors declare no conflict of interest.

References

  1. Siegel, R.L.; Miller, K.D.; Goding Sauer, A.; Fedewa, S.A.; Butterly, L.F.; Anderson, J.C.; Cercek, A.; Smith, R.A.; Jemal, A. Colorectal cancer statistics. CA Cancer J. Clin. 2020, 70, 145–164. [Google Scholar] [CrossRef] [PubMed] [Green Version]
  2. Ferlay, J.; Parkin, D.M.; Steliarova-Foucher, E. Estimates of cancer incidence and mortality in Europe in 2008. Eur. J. Cancer 2010, 46, 765–781. [Google Scholar] [CrossRef] [PubMed]
  3. Armstrong, H.; Bording-Jorgensen, M.; Wine, E. Review:The Multifaceted Roles of Diet, Microbes, and Metabolites in Cancer. Cancers 2021, 13, 767. [Google Scholar] [CrossRef]
  4. Siegel, R.; De Santis, C.; Virgo, K.; Mariotto, A.; Smith, T.; Cooper, D.; Ganslet, T.; Lerro, C.; Fedewa, S.; Lin, C.; et al. Cancer treatment and survivorship statistics. CA Cancer J. Clin. 2012, 62, 220–241. [Google Scholar] [CrossRef] [PubMed] [Green Version]
  5. Favoriti, P.; Cardone, G.; Greco, M.; Pirozzi, F.; Pirozzi, R.E.M.; Corcione, F. Worldwide burden of colorectal cancer: A review. Updates Surg. 2016, 68, 7–11. [Google Scholar] [CrossRef]
  6. Amann, A.; de Lacy Costello, B.; Miekisch, W.; Schubert, J.; Buszewski, B.; Pleil, J.; Ratcliffe, N.; Risby, T. The human volatilome: Volatile organic compounds (VOCs) in exhaled breath, skin emanations, urine, feces and saliva. J. Breath Res. 2014, 8, 034001. [Google Scholar] [CrossRef]
  7. Van Berkel, J.J.B.N.; Dallinga, J.W.; Möller, G.M.; Godschalk, R.W.L.; Moonen, E.J.; Wouters, E.F.M.; Van Schooten, F.J. A profile of volatile organic compounds in breath discriminates COPD patients from controls. Respir. Med. 2010, 104, 557–563. [Google Scholar] [CrossRef] [Green Version]
  8. Schmekel, B.; Winquis, F.; Vikström, A. Analysis of breath samples for lung cancer survival. Anal. Chim. Acta 2014, 840, 82–86. [Google Scholar] [CrossRef]
  9. Antoniou, S.X.; Gaude, E.; Ruparel, M.; van der Schee, M.P.; Janes, S.M.; Rintoul, R.C.; LuCID Research Group. The potential of breath analysis to improve outcome for patients with lung cancer. J. Breath Res. 2019, 13, 034002. [Google Scholar] [CrossRef] [Green Version]
  10. Lourenco, C.; Turner, C. Breath analysis in disease diagnosis: Methodological considerations and applications. Metabolites 2014, 4, 465–498. [Google Scholar] [CrossRef] [PubMed]
  11. Anh, D.T.V.; Olthuis, W.; Bergveld, P. A Hydrogen peroxide sensor for exaheled breath measurement. Sens. Actuators B Chem. 2005, 111–112, 494–499. [Google Scholar] [CrossRef] [Green Version]
  12. Li, J.; Peng, Y.; Liu, Y.; Li, W.; Jin, Y.; Tang, Z.; Duan, Y. Investigation of potential breath biomerkers for early diagnosis of breast cancer using gas chromatography-mass spectrometry. Clin. Chim. Acta 2014, 436, 59–67. [Google Scholar] [CrossRef]
  13. Marzorati, D.; Mainardi, L.; Sedda, G.; Gasparri, R.; Spaggiari, L.; Cerveri, P. A review of exhaled breath: A key role in lung cancer diagnosis. J. Breath Res. 2019, 13, 034001. [Google Scholar] [CrossRef] [PubMed]
  14. Bhattacharyya, D.; Kumar, P.; Mohanty, S.K.; Smith, Y.R.; Misra, M. Detection of four distinct volatile indicators of colorectal cancer using functionalized titania nanotubular arrays. Sensors 2017, 17, 1795. [Google Scholar] [CrossRef] [PubMed] [Green Version]
  15. Xu, Z.Q.; Broza, Y.Y.; Ionsecu, R.; Tisch, U.; Ding, L.; Liu, H.; Song, Q.; Pan, Y.Y.; Xiong, F.X.; Gu, K.S.; et al. A nanomaterial-based breath test for distinguishing gastric cancer from benign gastric conditions. Br. J. Cancer 2013, 108, 941–950. [Google Scholar] [CrossRef] [Green Version]
  16. Altomare, D.F.; Picciariello, A.; Rotelli, M.T.; De Fazio, M.; Aresta, A.M.; Zambonin, C.G.; Vincenti, L.; Trerotoli, P.; De Vietro, N. Chemical signature of colorectal cancer: Case–control study for profiling the breath print. BJS 2020, 4, 1189–1199. [Google Scholar] [CrossRef] [PubMed]
  17. De Vietro, N.; Aresta, A.; Rotelli, M.T.; Zambonin, C.; Lippolis, C.; Picciariello, A.; Altomare, D.F. Relationship between cancer tissue derived and exhaled volatile organic compound from colorectal cancer patients. Preliminary results. J. Pharm. Biomed. Anal. 2020, 180, 113055–113065. [Google Scholar] [CrossRef] [PubMed]
  18. Pawliszyn, J. Solid Phase Microextraction. In A Century of Separation Science; Marcel Dekker Inc.: New York, NY, USA, 2002; pp. 399–419. [Google Scholar]
  19. Aresta, A.; De Vietro, N.; Zambonin, C. Ultra-Trace Determination of Sudan I, II, III, and IV in Wastewater by Solid-Phase Microextraction (SPME) and on-line Solid-Phase Extraction (SPE) with High-Performance Liquid Chromatography (HPLC). Anal. Lett. 2020, 53, 2559–2570. [Google Scholar] [CrossRef]
  20. Moein, M.M.; Said, R.; Bassyouni, F.; Abdel-Rehim, M. Solid Phase Microextraction and Related Techniques for Drugs in Biological Samples. J. Anal. Methods Chem. 2014, 10, 921350. [Google Scholar] [CrossRef]
  21. Zhang, Y.; Gao, B.; Zhang, M.; Shi, J.; Xu, Y. Headspace solid-phase microextraction-gas chromatography–mass spectrometry analysis of the volatile components of longan (Dimocarpus longan Lour.). Eur. Food Res. Technol. 2009, 229, 457–465. [Google Scholar] [CrossRef]
  22. Ma, Q.L.; Hamid, N.; Bekhit, A.E.D.; Robertson, J.; Law, T.F. Optimization of headspace solid phase microextraction (HS-SPME) for gas chromatography mass spectrometry (GC–MS) analysis of aroma compounds in cooked beef using response surface methodology. Microchem. J. 2013, 111, 16–24. [Google Scholar] [CrossRef]
  23. Risticevic, S.; Lord, H.; Górecki, T.; Arthur, C.L.; Pawliszyn, J. Protocol for solid-phase microextraction method development. Nat. Protoc. 2010, 5, 122–139. [Google Scholar] [CrossRef]
  24. Razmi, H.; Pasandideh, Y. Introduction of commercial heating elements of resistance metal alloys as the novel solid-phase microextraction fibers for chromatographic monitoring of organic pollutants. J. Iran. Chem. Soc. 2020, 17, 1111–1121. [Google Scholar] [CrossRef]
  25. Pereira, A.; Silva, E.; Cerejeira, M.J. Applicability of the New 60 µm Polyethylene Glycol Solid-Phase Microextraction Fiber Assembly for the Simultaneous Analysis of Six Pesticides in Water. J. Chromatogr. Sci. 2014, 52, 423–428. [Google Scholar] [CrossRef] [PubMed] [Green Version]
Figure 1. Instrumental response obtained extracting the selected compounds from the HS using the CAR/PDMS and CAR/DVB/PDMS fibers, respectively.
Applsci 11 06910 g001
Figure 2. HS extraction time profiles obtained with both selected fibers at 37 °C.
Applsci 11 06910 g002
Figure 3. Effect of the NaCl concentration on the DI extraction efficiency obtained with both selected fibers.
Applsci 11 06910 g003
Figure 4. Effect of the temperature on the DI extraction efficiency obtained with both selected fibers.
Applsci 11 06910 g004
Figure 5. DI extraction time profiles obtained with the CAR/DVB/PDMS fiber at room temperature in the presence of 30% NaCl.
Applsci 11 06910 g005
Figure 6. Kinetic profiles of seven selected analytes secreted by surgical resected colon tissues (healthy tissue and tumor) from three CRC patients.
Applsci 11 06910 g006
Table 1. SIM operation mode parameters.
RT *CompoundSegment Start–End (min)Characteristic Ions **
5.79 ± 0.03toluene4.00–7.5065, 91
8.44 ± 0.02ethylbenzene7.50–10.5091, 106
11.01 ± 0.02benzaldheyde10.50–11.5077, 105
11.66 ± 0.01octanal10.50–13.5043, 56
14.30 ± 0.03benzoic acid13.50–15.5091, 121
16.59 ± 0.03dodecane15.50–18.5057, 71, 85
23.05 ± 0.04tetradecane18.50–24.5057, 71, 85
* Retention time (RT); ** Quantification ion in bold.
Table 2. Linear ranges, equations of the calibration curves, LOD and LOQ calculated for the analytes.
CompoundEquationR2Linear Range (mg/mL)LOD *
(mg/mL)
LOQ *
(mg/mL)
HS-SPME-GC/MS-SIM
tolueney = 5110x + 2250.86810.05–1000.020.05
ethylbenzeney = 2436x + 2620.99410.14–1000.040.14
benzaldheydey = 18762x + 3270.95310.09–1000.030.09
octanaly = 11427x + 12830.89740.08–1000.020.08
benzoic acidy = 194091x + 50000.98910.01–1003 × 10−39 × 10−3
dodecaney = 1732x + 3060.87171.40–1000.401.40
tetradecaney = 17293x−52020.98830.10–1000.030.10
DI-SPME-GC/MS-SIM
tolueney = 18135x + 16170.99870.02–10006 × 10−30.02
ethylbenzeney = 2270x + 30310.99770.04–10000.040.14
benzaldheydey = 1704x + 3840.99950.90–10000.270.90
octanaly = 1990x + 6480.99970.40–10000.120.40
benzoic acidy = 242162x + 42040.99747 × 10−3–1002 × 10−37 × 10−3
dodecaney = 1245x − 9300.99962.00–10000.602.00
tetradecaney = 13800x + 11270.99690.17–10000.050.17
Y = peak area counts (a.u.); x = VOCs concentration in culture medium (µg/mL). * LOD and LOQ were three and ten times the signal to noise ratio, respectively.
Table 3. List of the VOCs secreted by surgical resected colon mucosa tissues of CRC patients.
N #RT (min)RI *Compound
13.26711-butanol
23.456872-pentanone
34.757231-butanol, 3-methyl
45.00732disulfide, dimethyl
55.1753pyridine
65.79761toluene
78.44851ethylbenzene
89.028752-heptanone
99.148852,4-dithiapentane
109.678952,5-dimethyl pyrazine
119.91917oxime, methoxy-phenyl
1210.69921pentanoic acid
1311.01961benzaldehyde
1411.14996furan, 2-pentyl
1511.661001octanal
1612.141023benzyl Alcohol
1712.91027phenol, 2-methyl
1813.0210942-nonanone
1913.281080nonanal
2013.631083phenethyl alcohol
2213.881143disulfide, methyl (methylthio)methyl
2314.301171benzoic acid
2413.901138phenol, 2-ethyl
2513.951143phenol, 3,5-dimethyl
2614.891185decanal
2715.401202tetrasulfide, dimethyl
2816.511288indole
2916.591250dodecane
3023.051399tetradecane
3123.621568dodecanoic acid
* RI = 100 x z + 100 x (RTx − RTz)/(RT(z + 1) − RTz). For element x: z = number of carbon atoms of the n-alcane eluted before x; z + 1 = number of carbon atoms of the n-alcane eluted after x; RTx, RTz and RTz + 1 retention time of x, z and z + 1, respectively.
Table 4. Concentration ranges of the target compounds estimated in the surgical resected colon tissues (healthy tissue/tumor) from three CRC patients.
CompoundHealthy Range (µg/mL)Tumor Range (µg/mL)
benzaldehyde1.14–67.621.31–394.86
benzoic acidLOD-0.26LOD-0.23
dodecaneLOD -5.43LOD-12.59
ethylbenzene2.81–62.773.21–4.38
octanal0.96–27.060.97–3.24
tetradecane0.05–0.50.11–0.79
toluenend–3.84nd–4.08
Publisher’s Note: MDPI stays neutral with regard to jurisdictional claims in published maps and institutional affiliations.

