
Low-Carbon Economic Bi-Level Optimal Dispatching of an Integrated Power and Natural Gas Energy System Considering Carbon Trading

Abstract
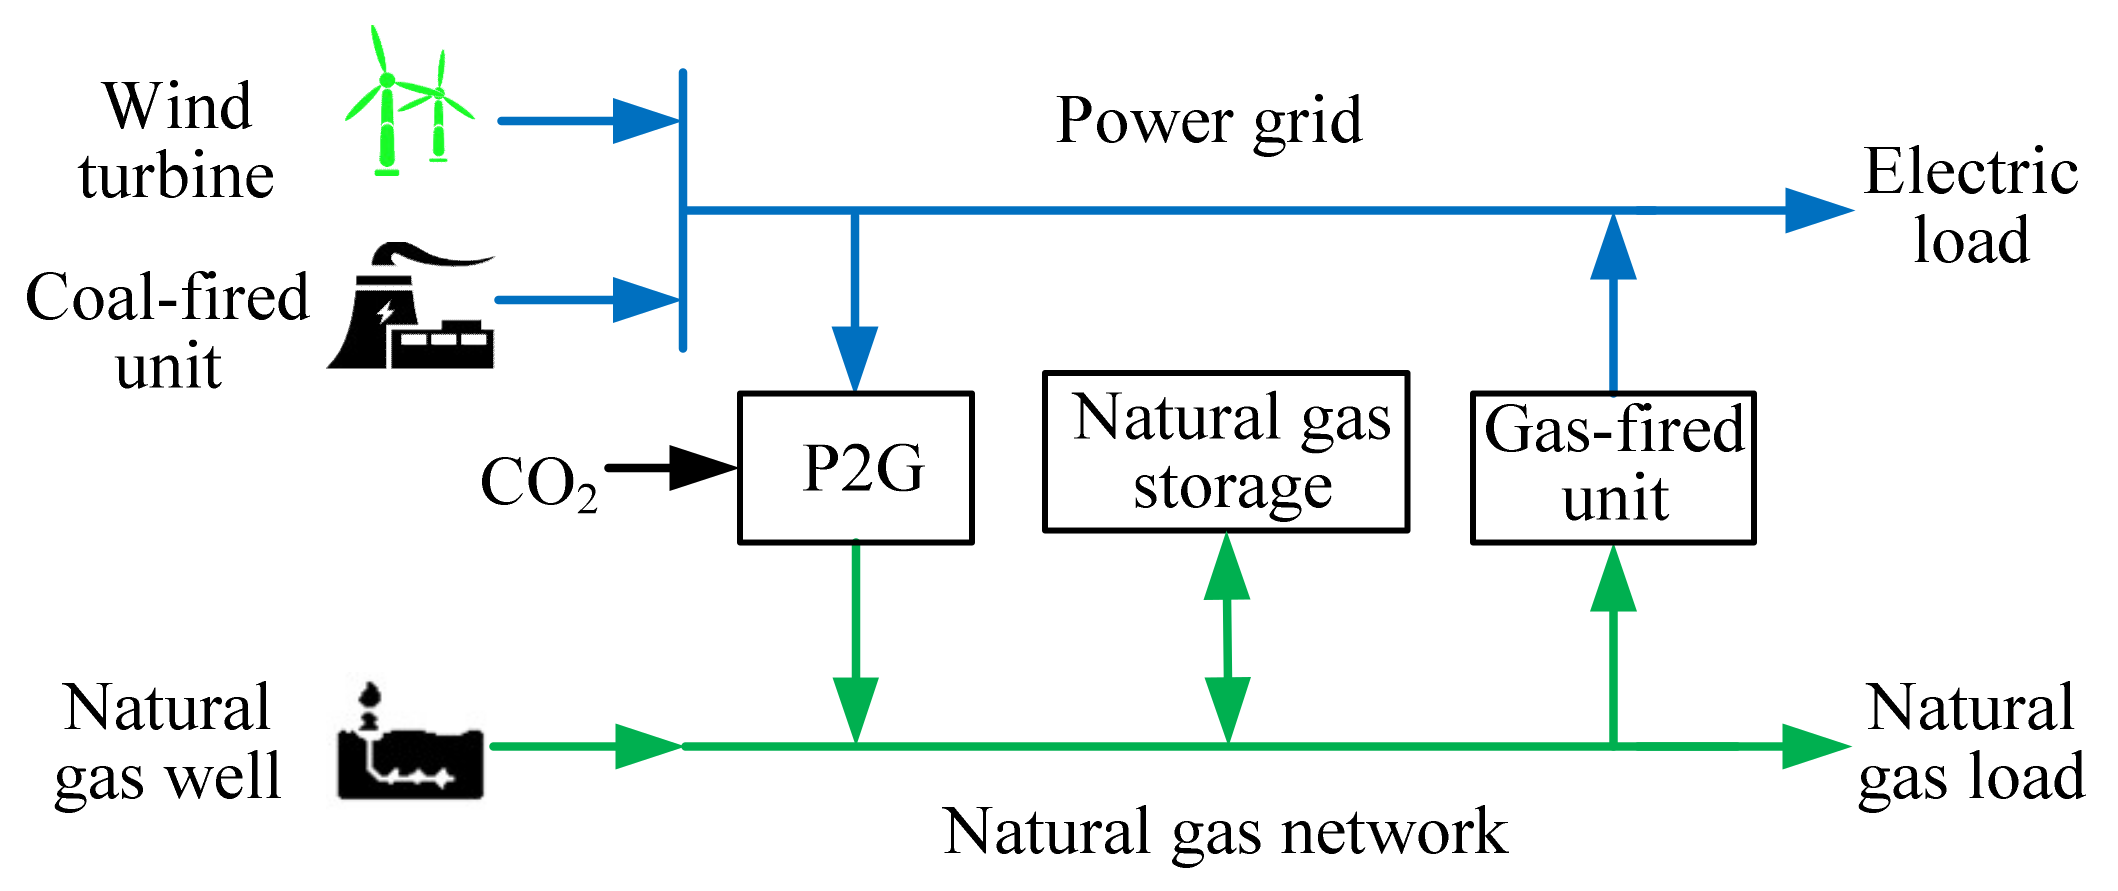
:1. Introduction
- A reward and punishment ladder-type carbon trading model is constructed, and comparatively analyzed the impact of three carbon price mechanisms of carbon trading on the carbon emission sources in the power system;
- Comprehensively considering the power system constraints, natural gas system constraints, and coupling element operation constraints, a stochastic optimal dispatching model of IPGES that takes into account the uncertain wind power and carbon trading cost is established.
- In order to explore the optimal carbon price of IPGES under carbon trading, a bi-level optimization model has been established while taking into account the economics of dispatching and the requirements of carbon emission reduction, which takes the optimal carbon price solution of carbon trading as the outer layer model, and the stochastic optimal dispatching of IPGES as the inner layer model.
- The solution method of the bi-level optimization model in this paper is proposed.
2. Carbon Trading Mechanism
2.1. Carbon Trading Cost Model
2.2. Comparison of the Effects of Different Types of Carbon Trading Mechanisms
3. Problem Formulation
3.1. Inner Model: Stochastic Optimal Dispatching Model of IPGES
3.1.1. Objective Function
3.1.2. Power System Operating Constraints
- (1)
- Generator output constraint
- (2)
- Unit climbing constraint
- (3)
- System reserve constraintAs wind power output is difficult to accurately predict, the system needs to reserve a certain amount of upward reserve and downward reserve adjustment capabilities to cope with the uncertainty of wind power output.where represents the random output of wind power in scenario s, which can be obtained by the method described in Section 4.1.
- (4)
- Power flow constraintFor the transmission network level, DC power flow constraint should be adopted for branch power flow.
- (5)
- Line safety constraint
- (6)
- Node power balance constraint
3.1.3. Natural Gas System Operating Constraints
3.1.4. Electricity and Gas Coupling Constraints
3.2. Outer Model: Optimal Carbon Price Solution Model of IPGES
4. Solving Method
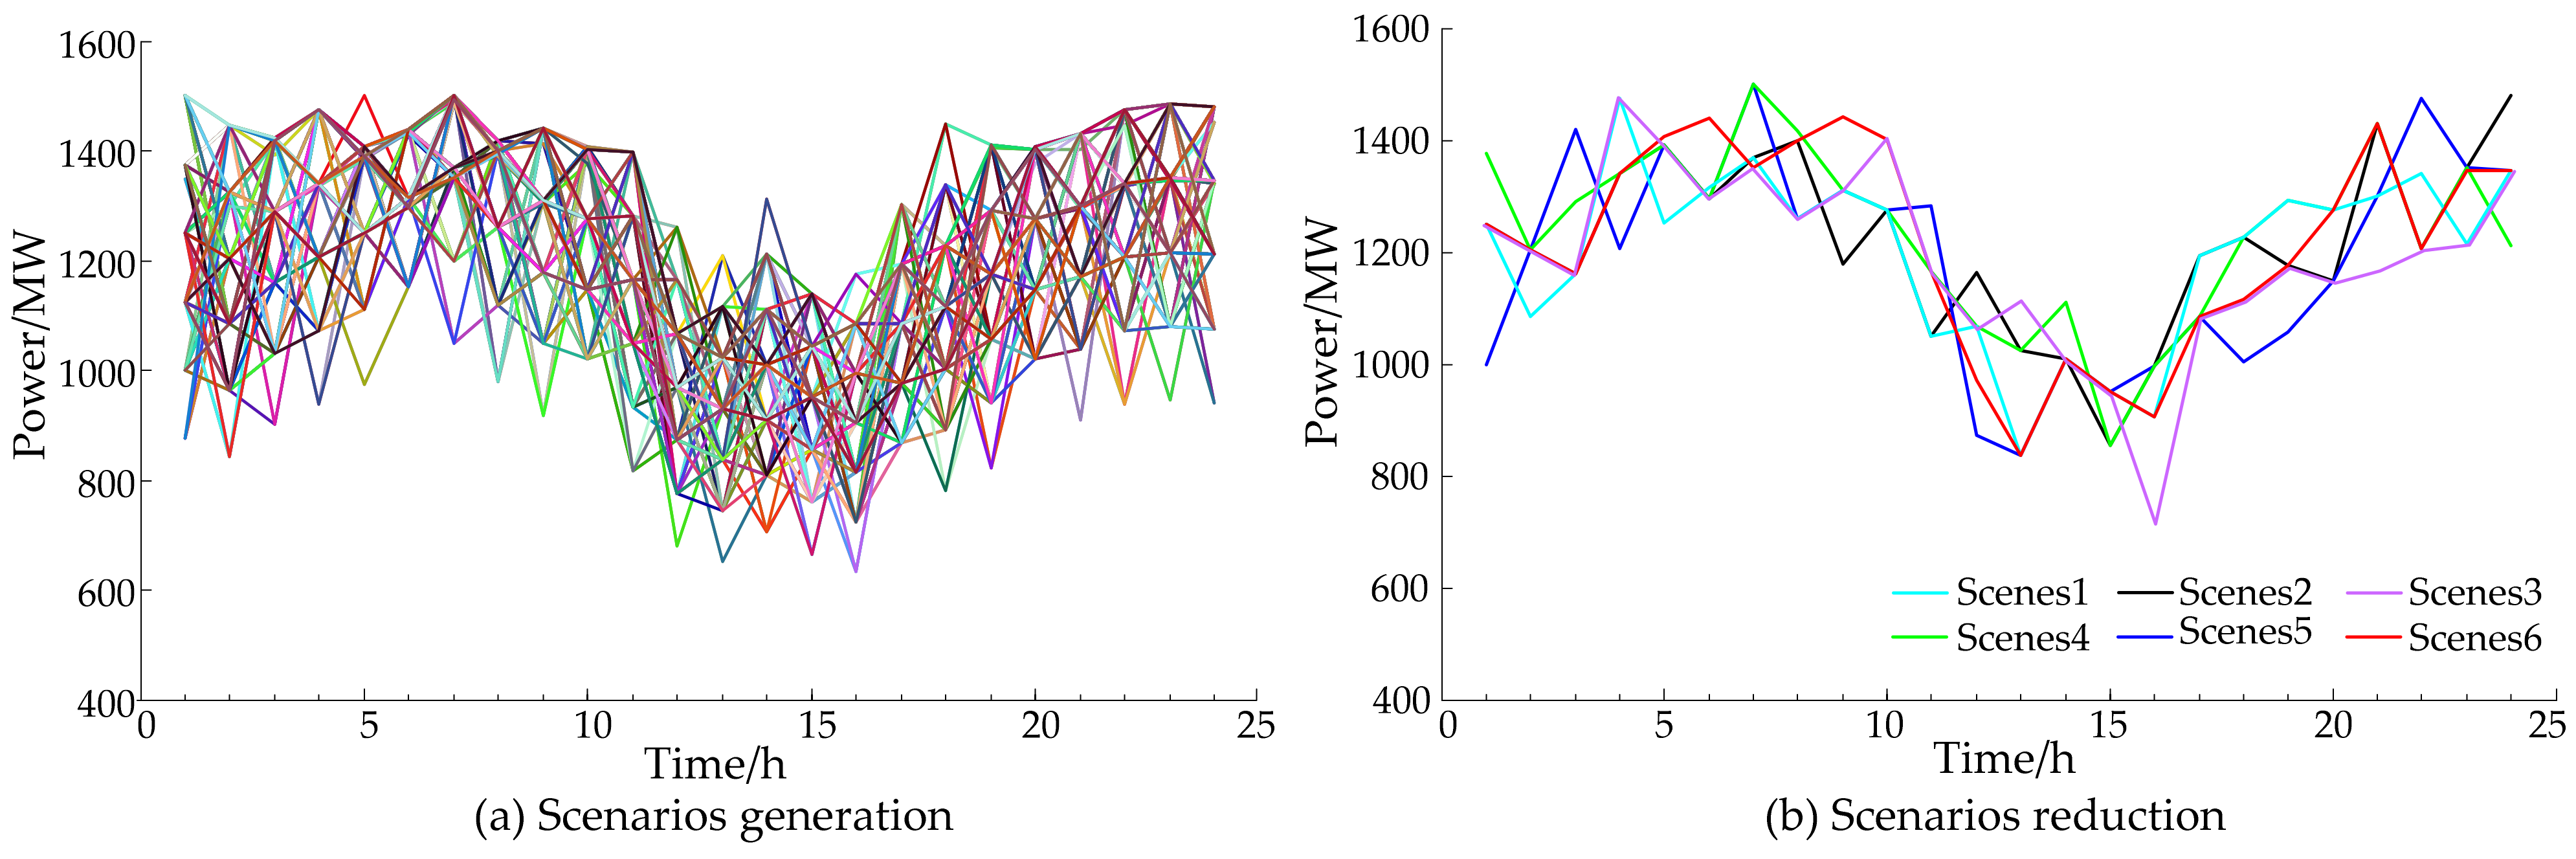
4.1. Uncertainty Processing of Wind Power
4.1.1. Scenario Generation of Wind Power
4.1.2. Scenario Generation and Reduction of Wind Power
4.2. Outer Model Solution
4.3. Solving Process
5. Case Study
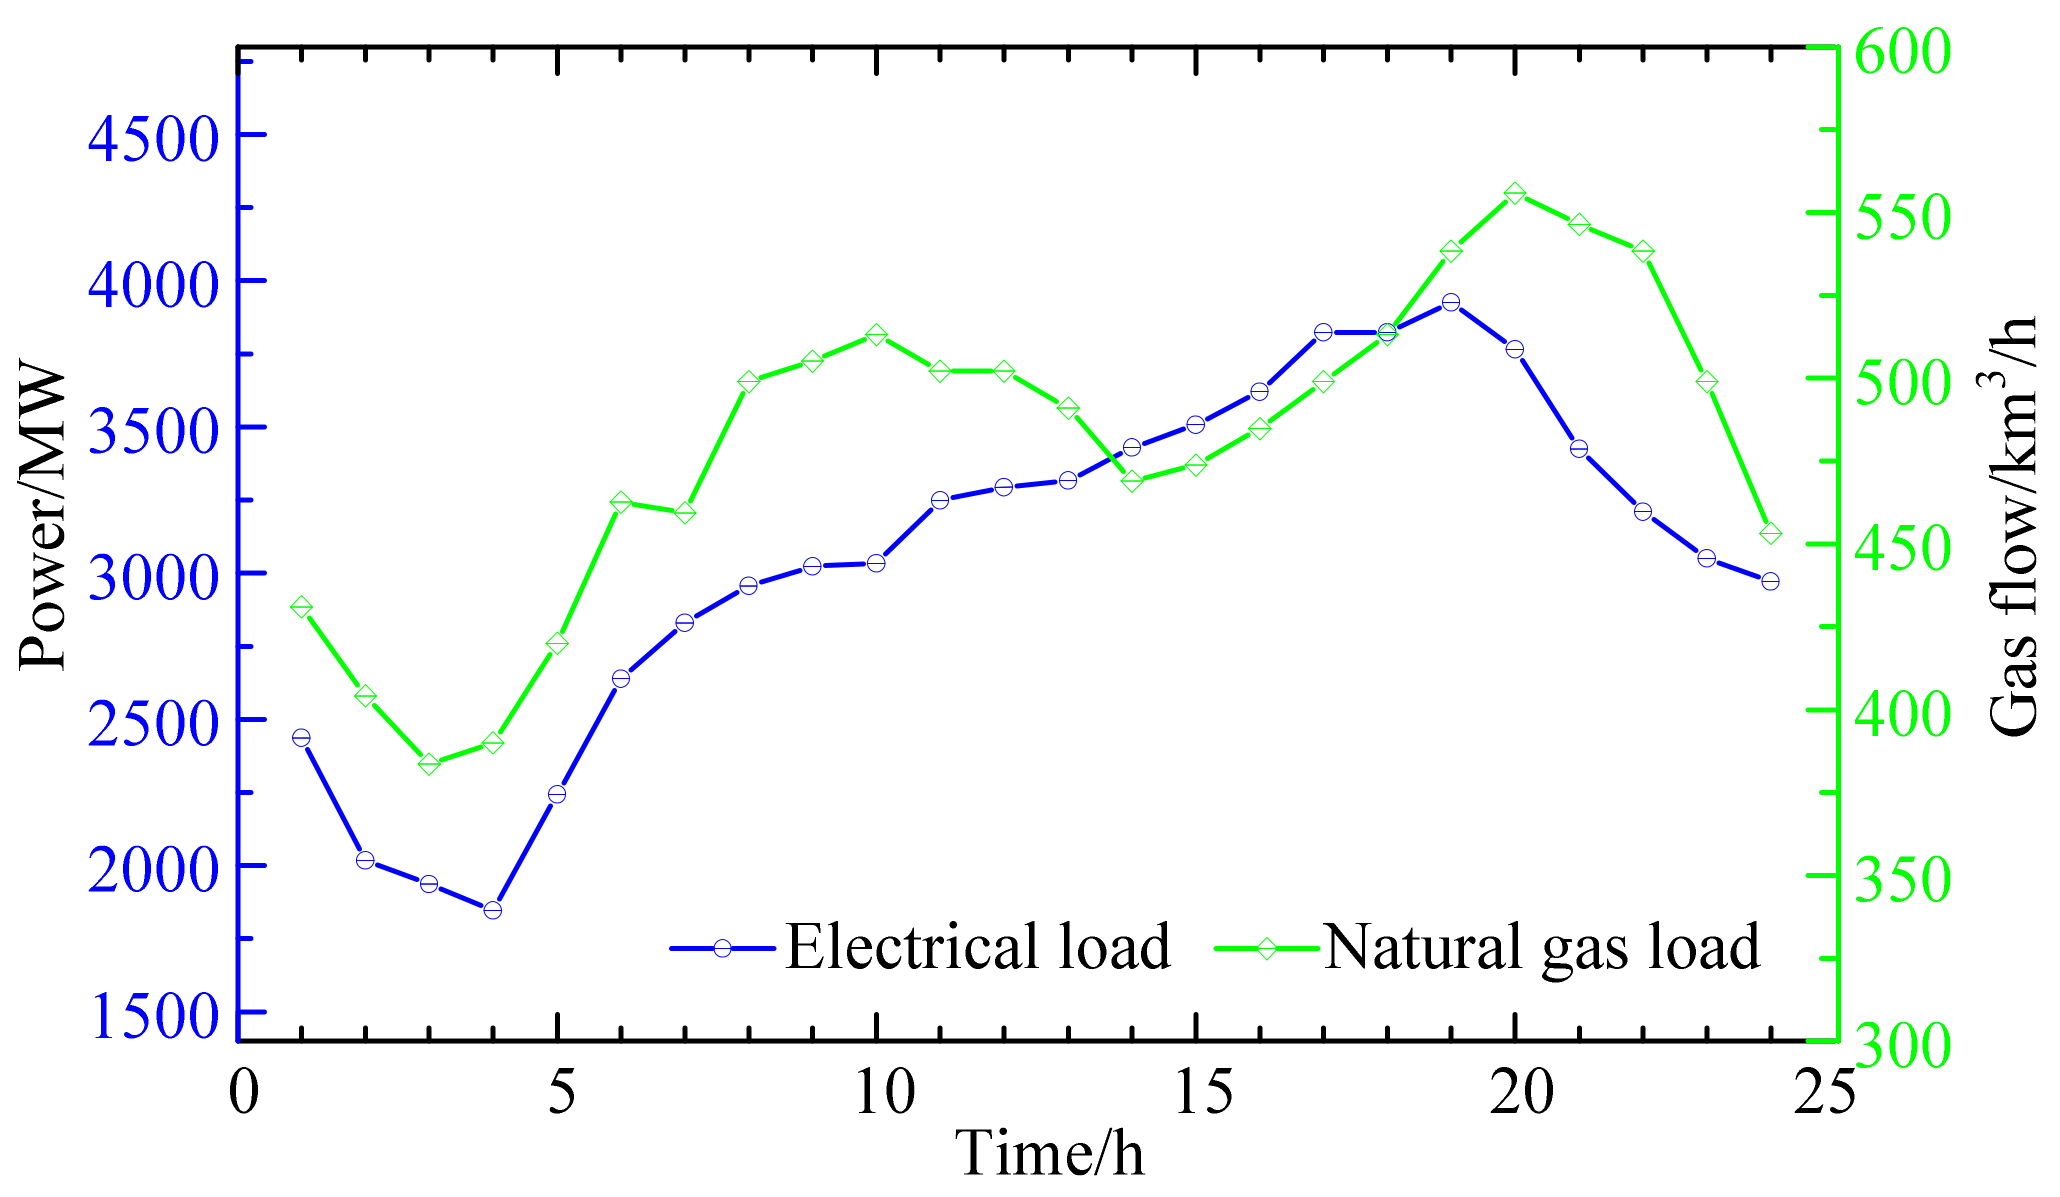
5.1. Case Description
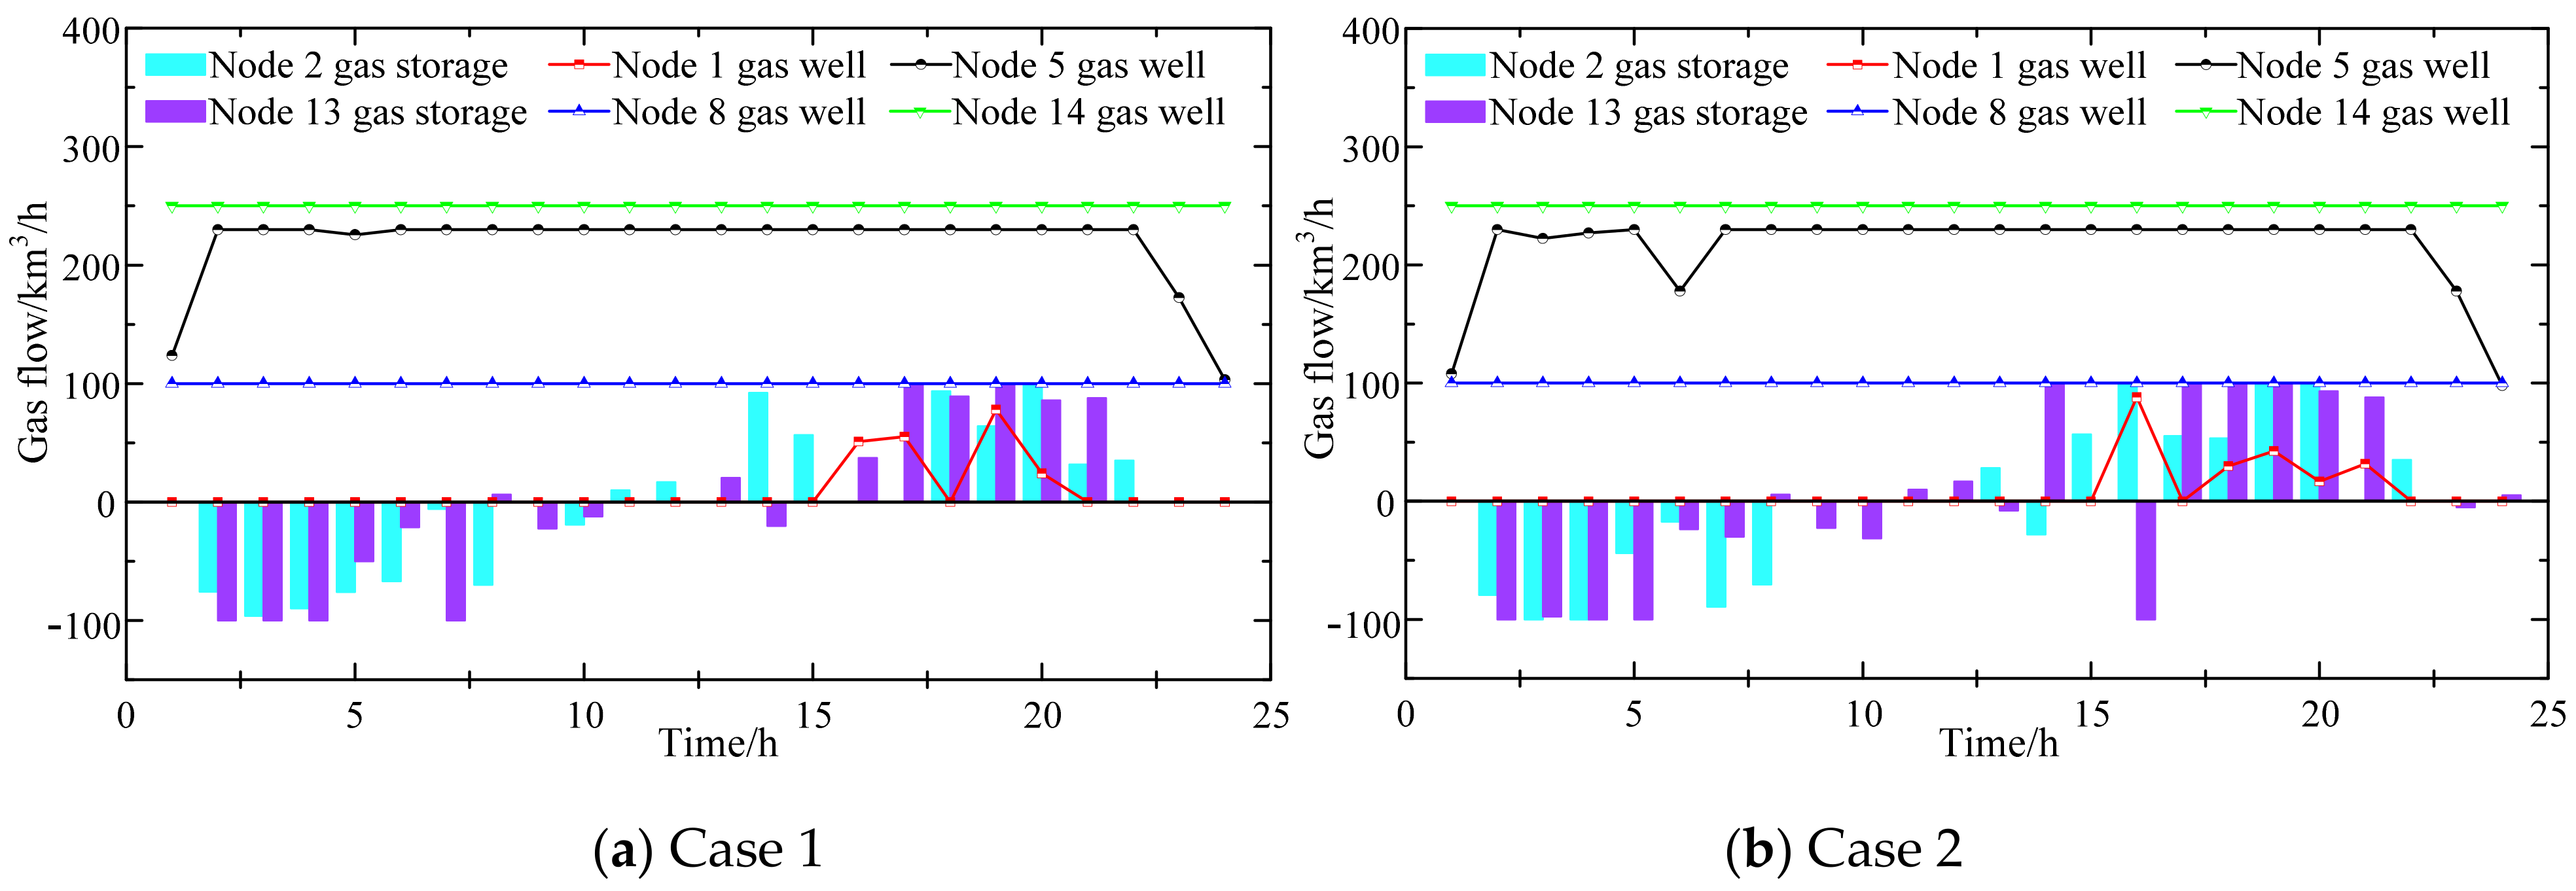
5.2. Simulation Settings and Results Analysis
6. Discussions
7. Conclusions
Author Contributions
Funding
Institutional Review Board Statement
Informed Consent Statement
Data Availability Statement
Conflicts of Interest
Nomenclature
| Abbreviations | |
| IPGES | Integrated power and natural gas energy system |
| P2G | Power-to-gas facilities |
| CFPP | Coal-fired power plant |
| GFPP | Gas-fired power plant |
| UCT | Unified carbon price mechanism |
| LCT | Ladder-type carbon price mechanism |
| RPLCT | Reward and punishment ladder-type carbon trading |
| GH/GL type generators | Thermal power generators whose carbon emission intensity is higher/lower than the free carbon emission quota coefficient per unit of electricity allocation |
| Parameters | |
| t | Index of time |
| T | Dispatch cycle, this paper is taken 24 h |
| Free carbon quota of generator i (ton) | |
| Ei | Actual carbon emissions of generator i (ton) |
| ε | Free carbon emission quota coefficient per unit of electricity allocation (ton/MWh) |
| μi | Carbon emission coefficient of the generator i per unit electric quantity (ton/MWh) |
| Nc, Ng, Np2g, Nw | Number of CFPP, GFPP, P2G and wind turbine generation in the system |
| η | The interval growth length of carbon emission (ton) |
| σ | The penalty-type price multiplier of the carbon trading price of each ladder |
| δ | The incentive price multiplier of the carbon trading price of each ladder |
| K, N | Means that the unit carbon price is calculated according to (1 + Kσ)/−(1 + Nσ) when carbon emissions exceed/below a certain amount |
| Fsod | Comprehensive operation cost of IPGES ($) |
| ai, bi, ci | Operating cost coefficients of coal-fired generators respectively |
| , | Operating cost of the i-th natural gas well price and the unit power consumption of P2G, respectively. ($/MWh) |
| , | Ramp up rate and ramp down rate of unit i, respectively (MW) |
| The random output of wind power in scenario s (MW) | |
| Sset | Set of typical wind power output scenarios |
| Power flow from node m to node n on line l at time t (MW) | |
| Bmn | Admittance of branch l |
| θm | Phase angle of the node m |
| Nbr, Nbus | Number of branch and bus nodes in the electricity network |
| ksafe | Safety factor of branch l |
| , , , , , | Respectively represent the correlation coefficient (all of them are 0 or 1, and 1 means connected) between node i and CFPPs, GFPPs, lines, wind turbine generators, P2G and load nodes in the electricity network |
| The active load of node i at time t (MW) | |
| Nwell, NSG | Number of natural gas wells and gas storage stations in the nature gas network |
| Npip, Nnode | Number of pipelines and bus nodes in the nature gas network |
| Cmn | Pipeline l transmission parameter, which is related to the length, diameter and temperature of the pipeline |
| kt | Compression ratio of the compressor at time t |
| , , , , , | Respectively represent the correlation coefficient (all of them are 0 or 1, and 1 means connected) between node i and natural gas wells, gas storage stations, natural gas pipelines, GFPPs, P2G and load nodes in the nature gas network |
| Natural gas load at each node at time t (km3/h) | |
| αi, βi, γi | Consumption characteristic coefficients of i-th GFPP respectively |
| Hg | High calorific value of natural gas, taking 9.7 kwh/m3 |
| Energy conversion efficiency of P2G | |
| λredu | Carbon emission reduction coefficient |
| Decision variables | |
| Pi,t | Power output of thermal power generating set i (CFPP or GFPP) at time t (MW) |
| Power output of i-th CFPP at time t (MW) | |
| Power output of i-th GFPP at time t (MW) | |
| Carbon trading prices of generator set i ($/ton) | |
| Benchmark carbon emission right price ($/ton) | |
| Gas flow of natural gas well at time t (km3/h) | |
| Electric power of P2G at time t (MW) | |
| Wind abandoning power of the day-ahead dispatching plan at time t (MW) | |
| Binary state variables of the i-th generator on and off (0/1) | |
| The dispatched power output of wind turbines at time t (MW) | |
| FN,j,t | Natural gas flow output of natural gas well j at time t (km3/h) |
| πm,t, πn,t | Pressure of the node m and n at time t (bar) |
| Fmn,t | Natural gas flow from point m to point n on the pipeline l (km3/h) |
| GS,j,t | Natural gas volume inside the natural gas storage station j at time t (km3) |
| , | Natural gas injection flow and output flow of gas storage station j at time t (km3/h) |
| , | Auxiliary variables of gas storage station j at time t (0/1) |
| Natural gas flow consumed by GFPP at time t (km3/h) | |
| Natural gas flow converted by P2G at time t (km3/h) |
Appendix A


| Generator Bus | 30CG | 31CG | 32GG | 33CG | 34GG | 36CG | 38GG | 39CG |
|---|---|---|---|---|---|---|---|---|
| μ (ton/MWh) | 1.19 | 1.08 | 0.55 | 1.08 | 0.55 | 1.19 | 0.55 | 1.08 |
| Gas Node | Fmax (km3/h) | Fmin (km3/h) | cgas ($/km3) |
|---|---|---|---|
| 1 | 220 | 0 | 187 |
| 5 | 230 | 0 | 172 |
| 8 | 800 | 100 | 225 |
| 14 | 250 | 0 | 158 |
| Gas Node | Smax (km3) | Smin (km3) | S0 (km3) | ||
|---|---|---|---|---|---|
| 2 | 500 | 0 | 100 | 100 | 0 |
| 13 | 500 | 0 | 100 | 100 | 0 |
| Bus Node | Gas Node | (MW) | ηp2g | μp2g (ton/MWh) |
|---|---|---|---|---|
| 35/37 | 16/3 | 100 | 0.65 | 0.2 |
| η (ton) | σ | δ | K | N |
|---|---|---|---|---|
| 300 | 0.25 | 0.2 | 9 | 9 |
Appendix B
References
- Energy Economics Statistical Review of World Energy. Available online: https://www.bp.com/en/global/corporate/energy-economics/statistical-review-of-world-energy/electricity.html (accessed on 23 July 2021).
- Yuan, R.; Behrens, P.; Tukker, A. Carbon overhead: The impact of the expansion in low-carbon electricity in China 2015–2040. Energy Policy 2018, 119, 97–104. [Google Scholar] [CrossRef]
- Operation of China Electric Power Industry from January to November 2020. Available online: https://cec.org.cn/detail/index.html?3-291651 (accessed on 23 July 2021).
- Fan, J.L.; Wei, S.; Yang, L. Comparison of the LCOE between coal-fired power plants with CCS and main low-carbon generation technologies: Evidence from China. Energy 2019, 176, 143–155. [Google Scholar] [CrossRef]
- Chen, R.; Zhu, B.; Duan, T. Role of natural gas power generation in China’s energy transformation and suggestions on its development. Nat. Gas Ind. 2020, 40, 120–128. [Google Scholar]
- Ordoudis, C.; Delikaraoglou, S.; Kazempour, J. Market-based coordination of integrated electricity and natural gas systems under uncertain supply. Eur. J. Oper. Res. 2020, 287, 1105–1119. [Google Scholar] [CrossRef]
- Mazza, A.; Bompard, E.; Chicco, G. Applications of power to gas technologies in emerging electrical systems. Renew. Sustain. Energy Rev. 2018, 92, 794–806. [Google Scholar] [CrossRef]
- Götz, M.; Lefebvre, J.; Mörs, F.; Koch, A.M.; Graf, F.; Bajohr, S.; Reimert, R.; Kolb, T. Renewable Power-to-Gas: A technological and economic review. Renew. Energy 2016, 85, 1371–1390. [Google Scholar] [CrossRef] [Green Version]
- Clegg, S.; Mancarella, P. Integrated Modeling and Assessment of the Operational Impact of Power-to-Gas (P2G) on Electrical and Gas Transmission Networks. IEEE Trans. Sustain. Energy 2015, 6, 1234–1244. [Google Scholar] [CrossRef]
- Li, Y.; Zou, Y.; Tan, Y.; Cao, Y.; Liu, X.; Shahidehpour, M.; Tian, S.; Bu, F. Optimal stochastic operation of integrated low-carbon electric power, natural gas, and heat delivery system. IEEE Trans. Sustain. Energy 2017, 9, 273–283. [Google Scholar] [CrossRef]
- Tian, F.; Jia, Y.; Ren, H.; Bai, Y.; Huang, T. “Source-load” low-carbon economic dispatch of integrated energy system considering carbon capture system. Power Syst. Technol. 2020, 44, 3346–3355. [Google Scholar]
- Alabdulwahab, A.; Abusorrah, A.; Zhang, X. Coordination of Interdependent Natural Gas and Electricity Infrastructures for Firming the Variability of Wind Energy in Stochastic Day-Ahead Scheduling. IEEE Trans. Sustain. Energy 2017, 6, 606–615. [Google Scholar] [CrossRef]
- Dou, X.; Zhao, W.; Lang, Y.; Li, Y.; Gao, C. A review of operation of natural gas-electricity coupling system considering power-to-gas technology. Power Syst. Technol. 2019, 43, 165–173. [Google Scholar]
- Manshadi, S.D.; Khodayar, M.E. Coordinated Operation of Electricity and Natural Gas Systems: A Convex Relaxation Approach. IEEE Trans. Smart Grid 2019, 10, 3342–3354. [Google Scholar] [CrossRef]
- Sayed, A.R.; Wang, C.; Bi, T. A Tight MISOCP Formulation for the Integrated Electric-Gas System Scheduling Problem. In 2018 2nd IEEE Conference on Energy Internet and Energy System Integration; IEEE: Beijing, China, 2018; pp. 1–6. [Google Scholar]
- Lemos-Cano, S.; Mccalley, J. Co-Optimized Analysis and Design of Electric and Natural Gas Infrastructures. Energies 2019, 12, 2012. [Google Scholar] [CrossRef] [Green Version]
- Mirzaei, M.A.; Nazari-Heris, M.; Mohammadi-Ivatloo, B. A Novel Hybrid Framework for Co-Optimization of Power and Natural Gas Networks Integrated With Emerging Technologies. IEEE Syst. J. 2020, 14, 3598–3608. [Google Scholar] [CrossRef]
- Xu, Y.; Yin, M.; Dong, Z.Y.; Zhang, R.; Hill, D.J.; Zhang, Y. Robust dispatch of high wind power-penetrated power systems against transient instability. IEEE Trans. Power Syst. 2018, 33, 174–186. [Google Scholar] [CrossRef]
- Wang, L.; Zhang, B.; Li, Q.; Song, W.; Li, G. Robust distributed optimization for energy dispatch of multi-stakeholder multiple microgrids under uncertainty. Appl. Energy 2019, 255, 1138–1145. [Google Scholar] [CrossRef]
- Shabazbegian, V.; Ameli, H.; Ameli, M.T. Stochastic Optimization Model for Coordinated Operation of Natural Gas and Electricity Networks. Comput. Chem. Eng. 2020, 142, 107060. [Google Scholar] [CrossRef]
- Soroudi, A.; Rabbie, A.; Keane, A. Stochastic real-time scheduling of wind-thermal generation units in an electricity utility. IEEE Syst. J. 2017, 11, 1622–1631. [Google Scholar] [CrossRef] [Green Version]
- Tan, Q.; Ding, Y. Optimal energy-saving dispatching model for thermal power considering carbon trading and its coping mode. Electr. Power Autom. Equip. 2018, 38, 175–181. [Google Scholar]
- Wang, C.; Wang, Z.; Ke, R.Y.; Wang, J. Integrated impact of the carbon quota constraints on enterprises within supply chain: Direct cost and indirect cost. Renew. Sustain. Energy Rev. 2018, 92, 774–783. [Google Scholar] [CrossRef]
- Wang, Z.; Shi, Y.; Tang, Y.; Men, X.; Cao, J.; Wang, H. Low carbon economy operation and energy efficiency analysis of integrated energy systems considering LCA energy chain and carbon trading mechanism. Proc. CSEE 2019, 39, 1614–1626. [Google Scholar]
- Qin, T.; Liu, H.; Wang, J.; Feng, Z.; Fang, W. Carbon trading based low-carbon economic dispatch for integrated electricity-heat-gas energy system. Autom. Electr. Power Syst. 2018, 42, 8–13. [Google Scholar]
- Xiang, Y.; Wu, G.; Shen, X.; Ma, Y.; Gou, J.; Xu, W.; Liu, J. Low-carbon economic dispatch of electricity-gas systems. Energy 2021, 226, 120267. [Google Scholar] [CrossRef]
- Cui, Y.; Zeng, P.; Zhong, W.; Cui, W.; Zhao, Y. Low-carbon economic dispatch of electricity-gas- heat integrated energy system based on ladder-type carbon trading. Electr. Power Autom. Equip. 2021, 41, 10–17. [Google Scholar]
- Zhang, X.; Liu, X.; Zhong, J. Integrated energy system planning considering a reward and punishment ladder-type carbon trading and electric-thermal transfer load uncertainty. Proc. Csee 2020, 40, 6132–6142. [Google Scholar]
- Sadegheih, A. Optimal design methodologies under the carbon emission trading program using MIP, GA, SA, and TS. Renew. Sustain. Energy Rev. 2011, 15, 504–513. [Google Scholar] [CrossRef]
- Li, X.; Ai, X.; Hu, J.; Zhou, B.; Lin, Z. Three-stage combined peak regulation strategy for nuclear-thermal-virtual power plant considering carbon trading mechanism. Power Syst. Technol. 2019, 43, 2460–2470. [Google Scholar]
- De, W.; Daniel, Y.S. The gas transmission problem solved by an extension of the simplex algorithm. Manag. Sci. 2000, 46, 1454–1465. [Google Scholar]
- Liu, J.; Sun, W.; Harrison, G.P. Optimal Low-Carbon Economic Environmental Dispatch of Hybrid Electricity-Natural Gas Energy Systems Considering P2G. Energies 2019, 12, 1355. [Google Scholar] [CrossRef] [Green Version]
- Crespodel Granado, P.; Skar, C.; Doukas, H.; Trachanas, G.P. Investments in the EU Power System: A Stress Test Analysis on the Effectiveness of Decarbonisation Policies; Springer: Cham, Switzerland, 2019. [Google Scholar] [CrossRef] [Green Version]
- Cai, B. Spatial Characteristics of Carbon Dioxide Emissions and its Co-management with Sulfur Dioxide in Cities of China. Energy China 2012, 34, 33–37. [Google Scholar]


Publisher’s Note: MDPI stays neutral with regard to jurisdictional claims in published maps and institutional affiliations. |
© 2021 by the authors. Licensee MDPI, Basel, Switzerland. This article is an open access article distributed under the terms and conditions of the Creative Commons Attribution (CC BY) license (https://creativecommons.org/licenses/by/4.0/).
Share and Cite
Li, H.; Ye, Y.; Lin, L. Low-Carbon Economic Bi-Level Optimal Dispatching of an Integrated Power and Natural Gas Energy System Considering Carbon Trading. Appl. Sci. 2021, 11, 6968. https://doi.org/10.3390/app11156968
Li H, Ye Y, Lin L. Low-Carbon Economic Bi-Level Optimal Dispatching of an Integrated Power and Natural Gas Energy System Considering Carbon Trading. Applied Sciences. 2021; 11(15):6968. https://doi.org/10.3390/app11156968
Chicago/Turabian StyleLi, Hong, Yazhong Ye, and Lanxin Lin. 2021. "Low-Carbon Economic Bi-Level Optimal Dispatching of an Integrated Power and Natural Gas Energy System Considering Carbon Trading" Applied Sciences 11, no. 15: 6968. https://doi.org/10.3390/app11156968