
High Sensitivity Continuous Monitoring of Chloroform Gas by Using Wavelength Modulation Photoacoustic Spectroscopy in the Near-Infrared Range


Abstract
:1. Introduction
2. Materials and Methods
2.1. Principle
2.2. System Setup
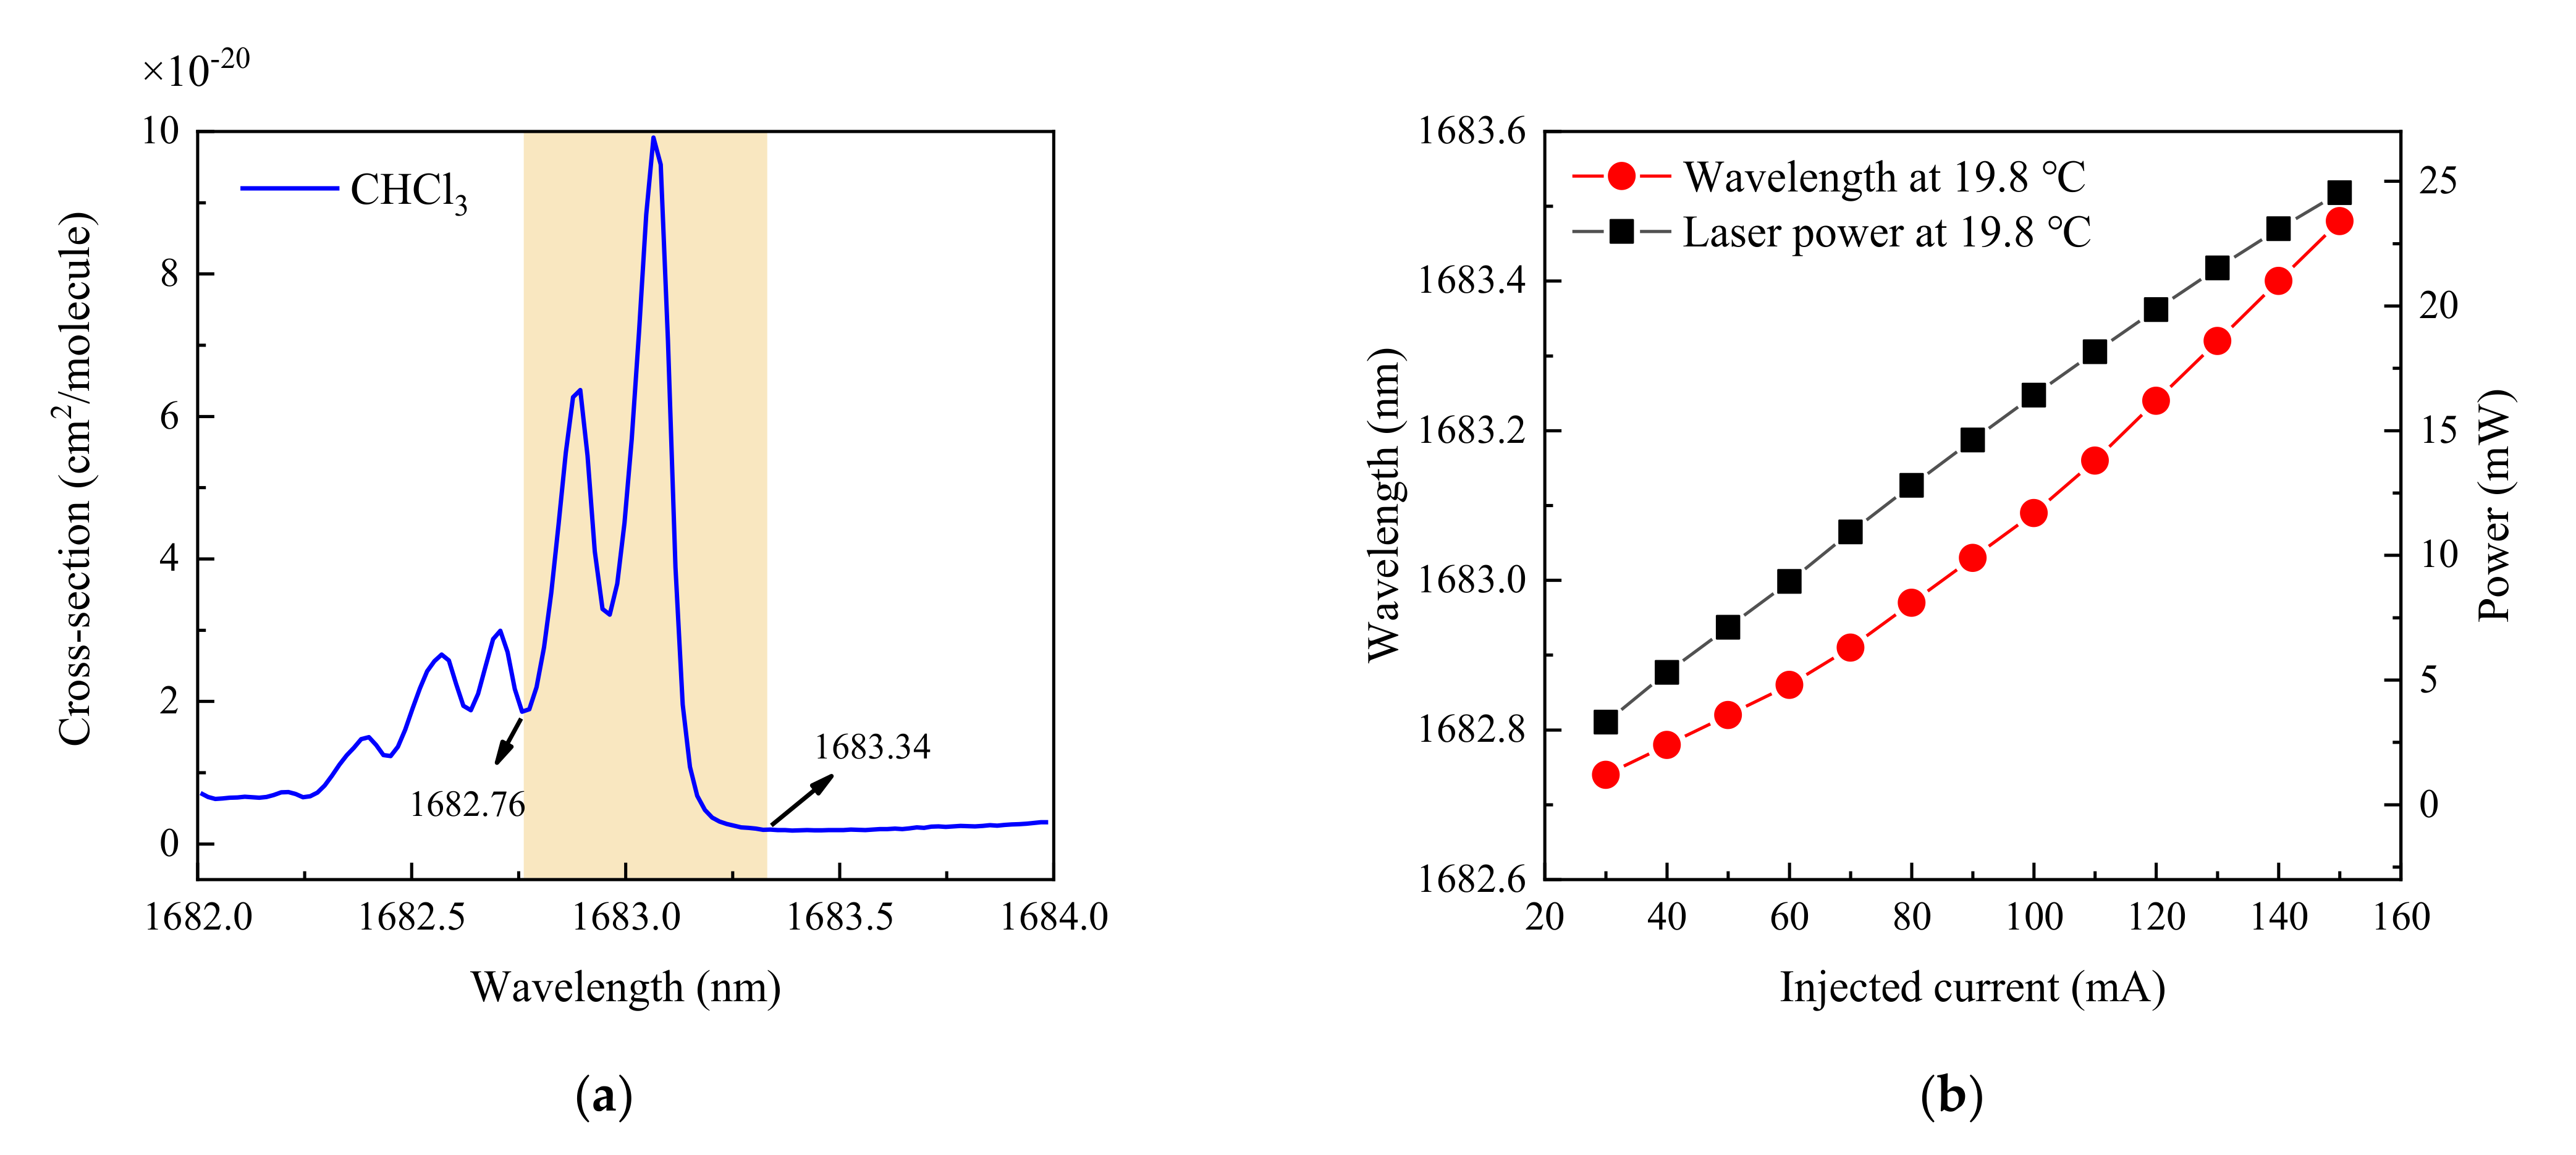
2.3. Absorption Lines and Laser Performance
3. Results
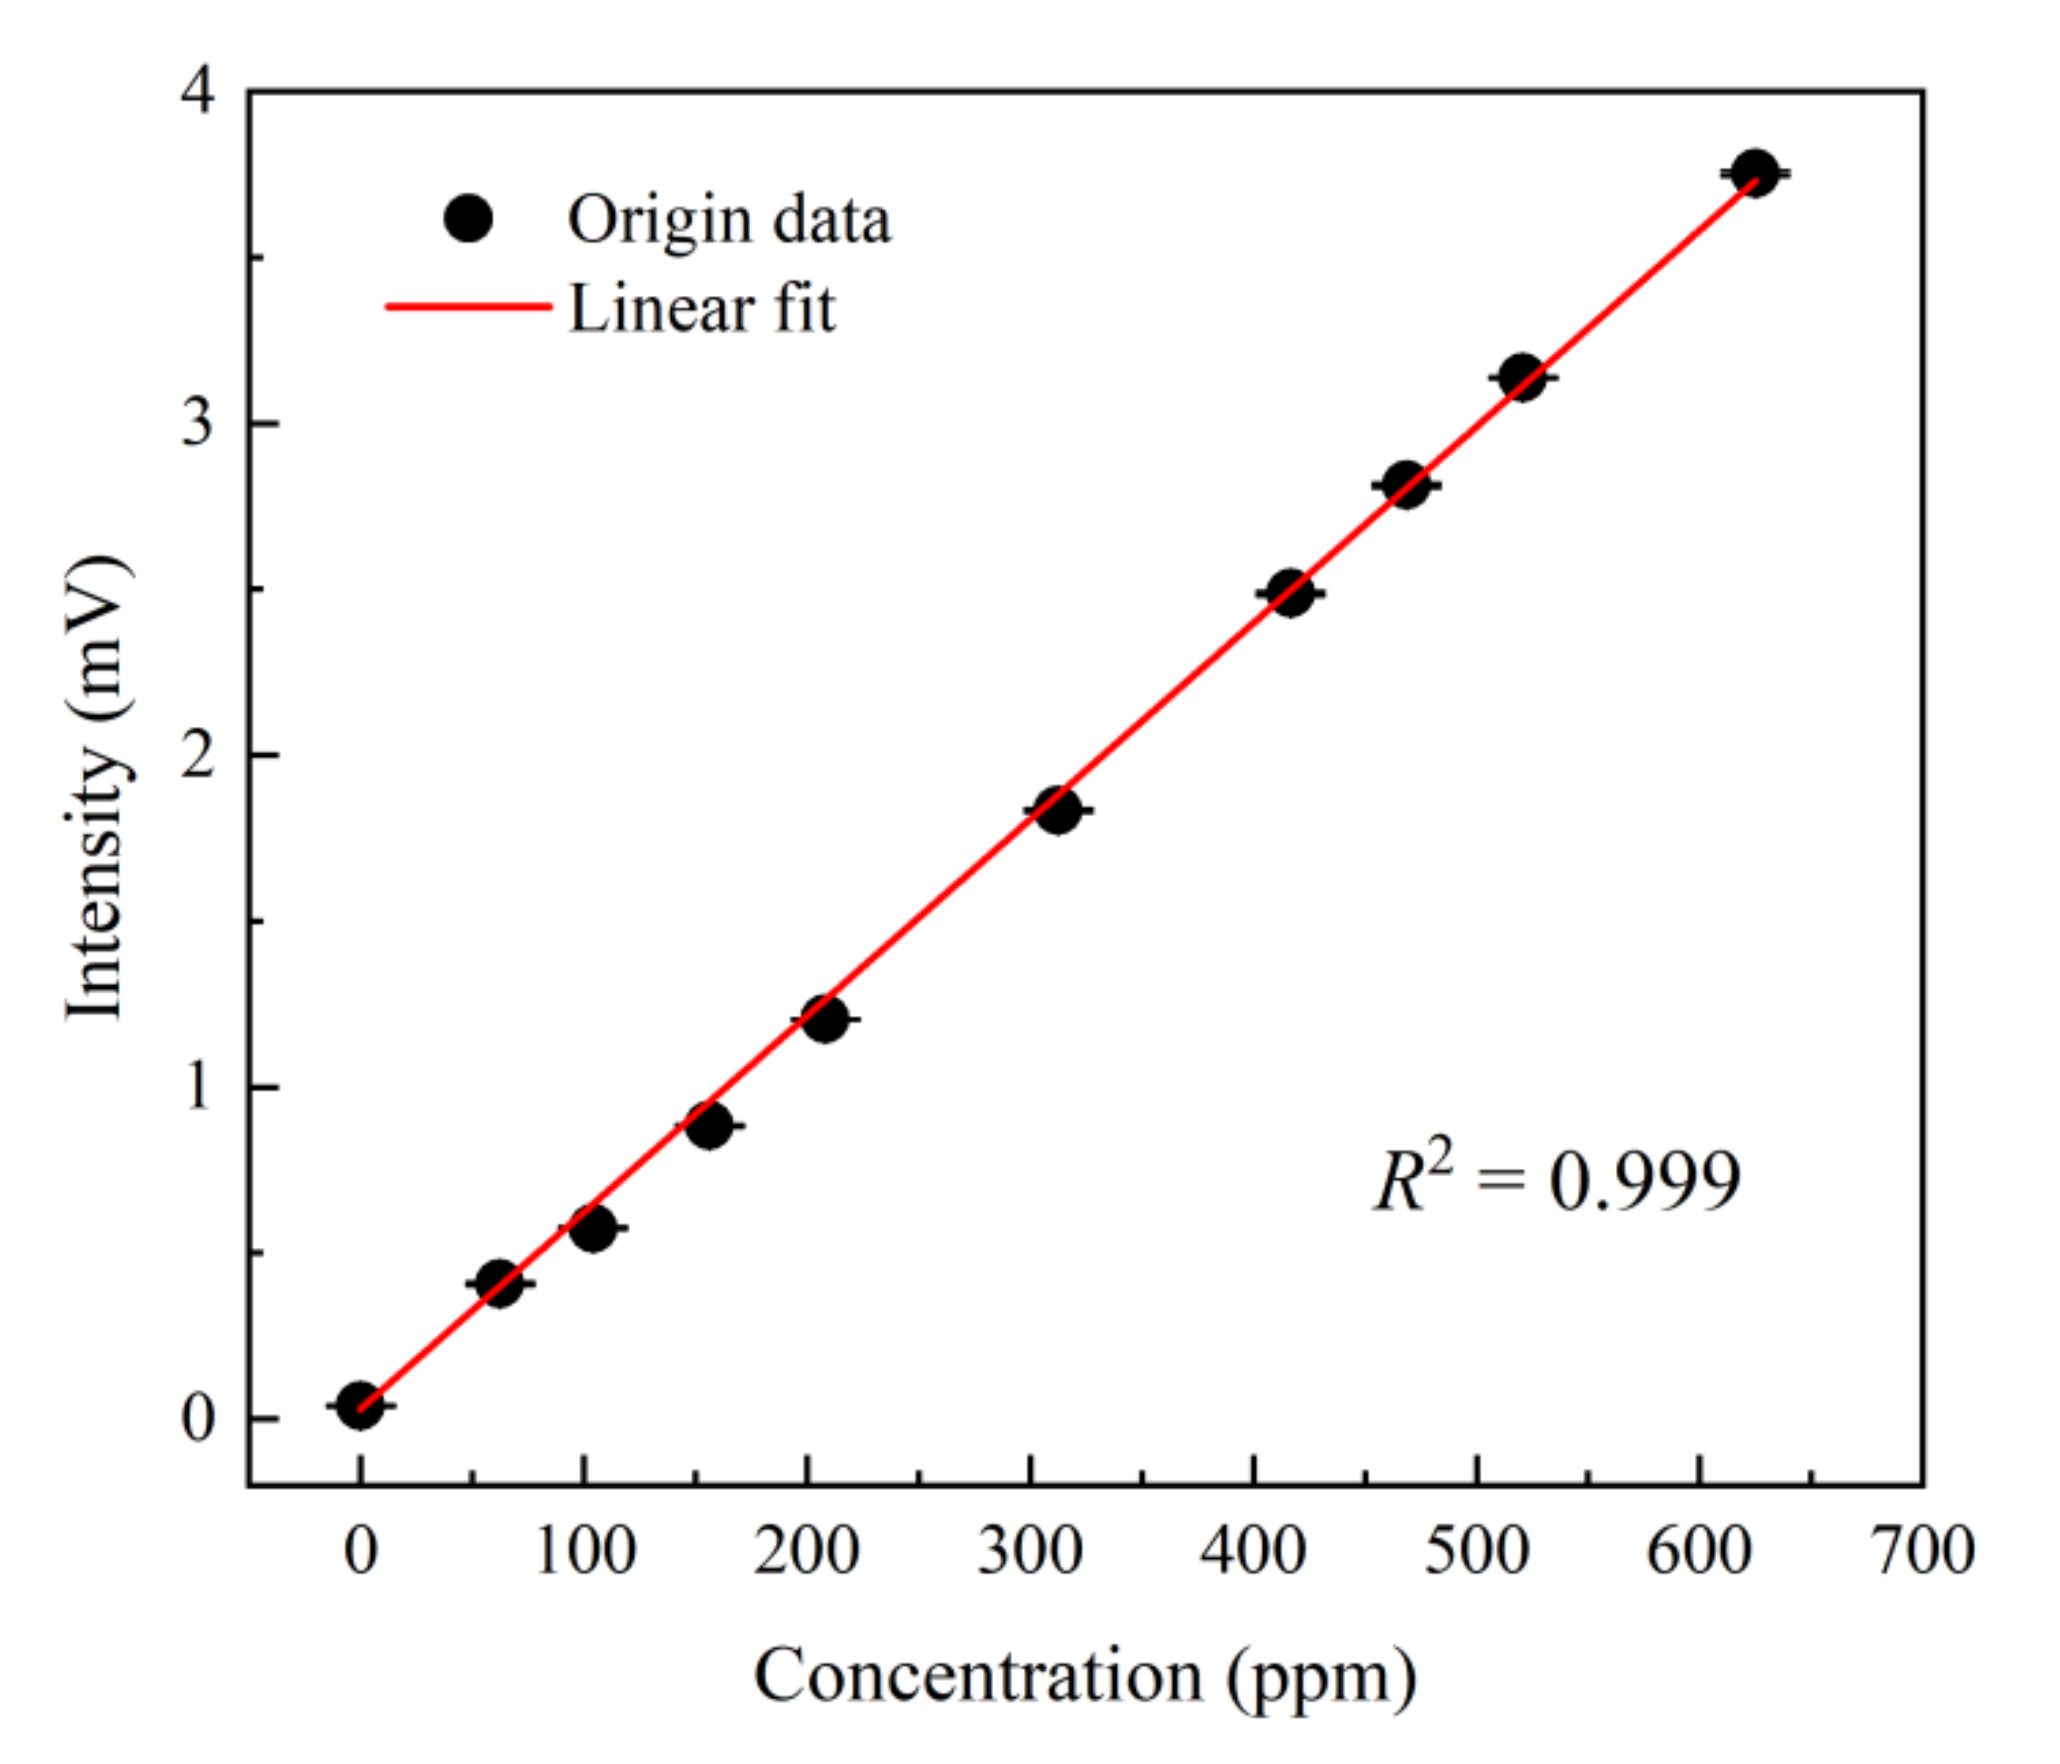
3.1. Calibration
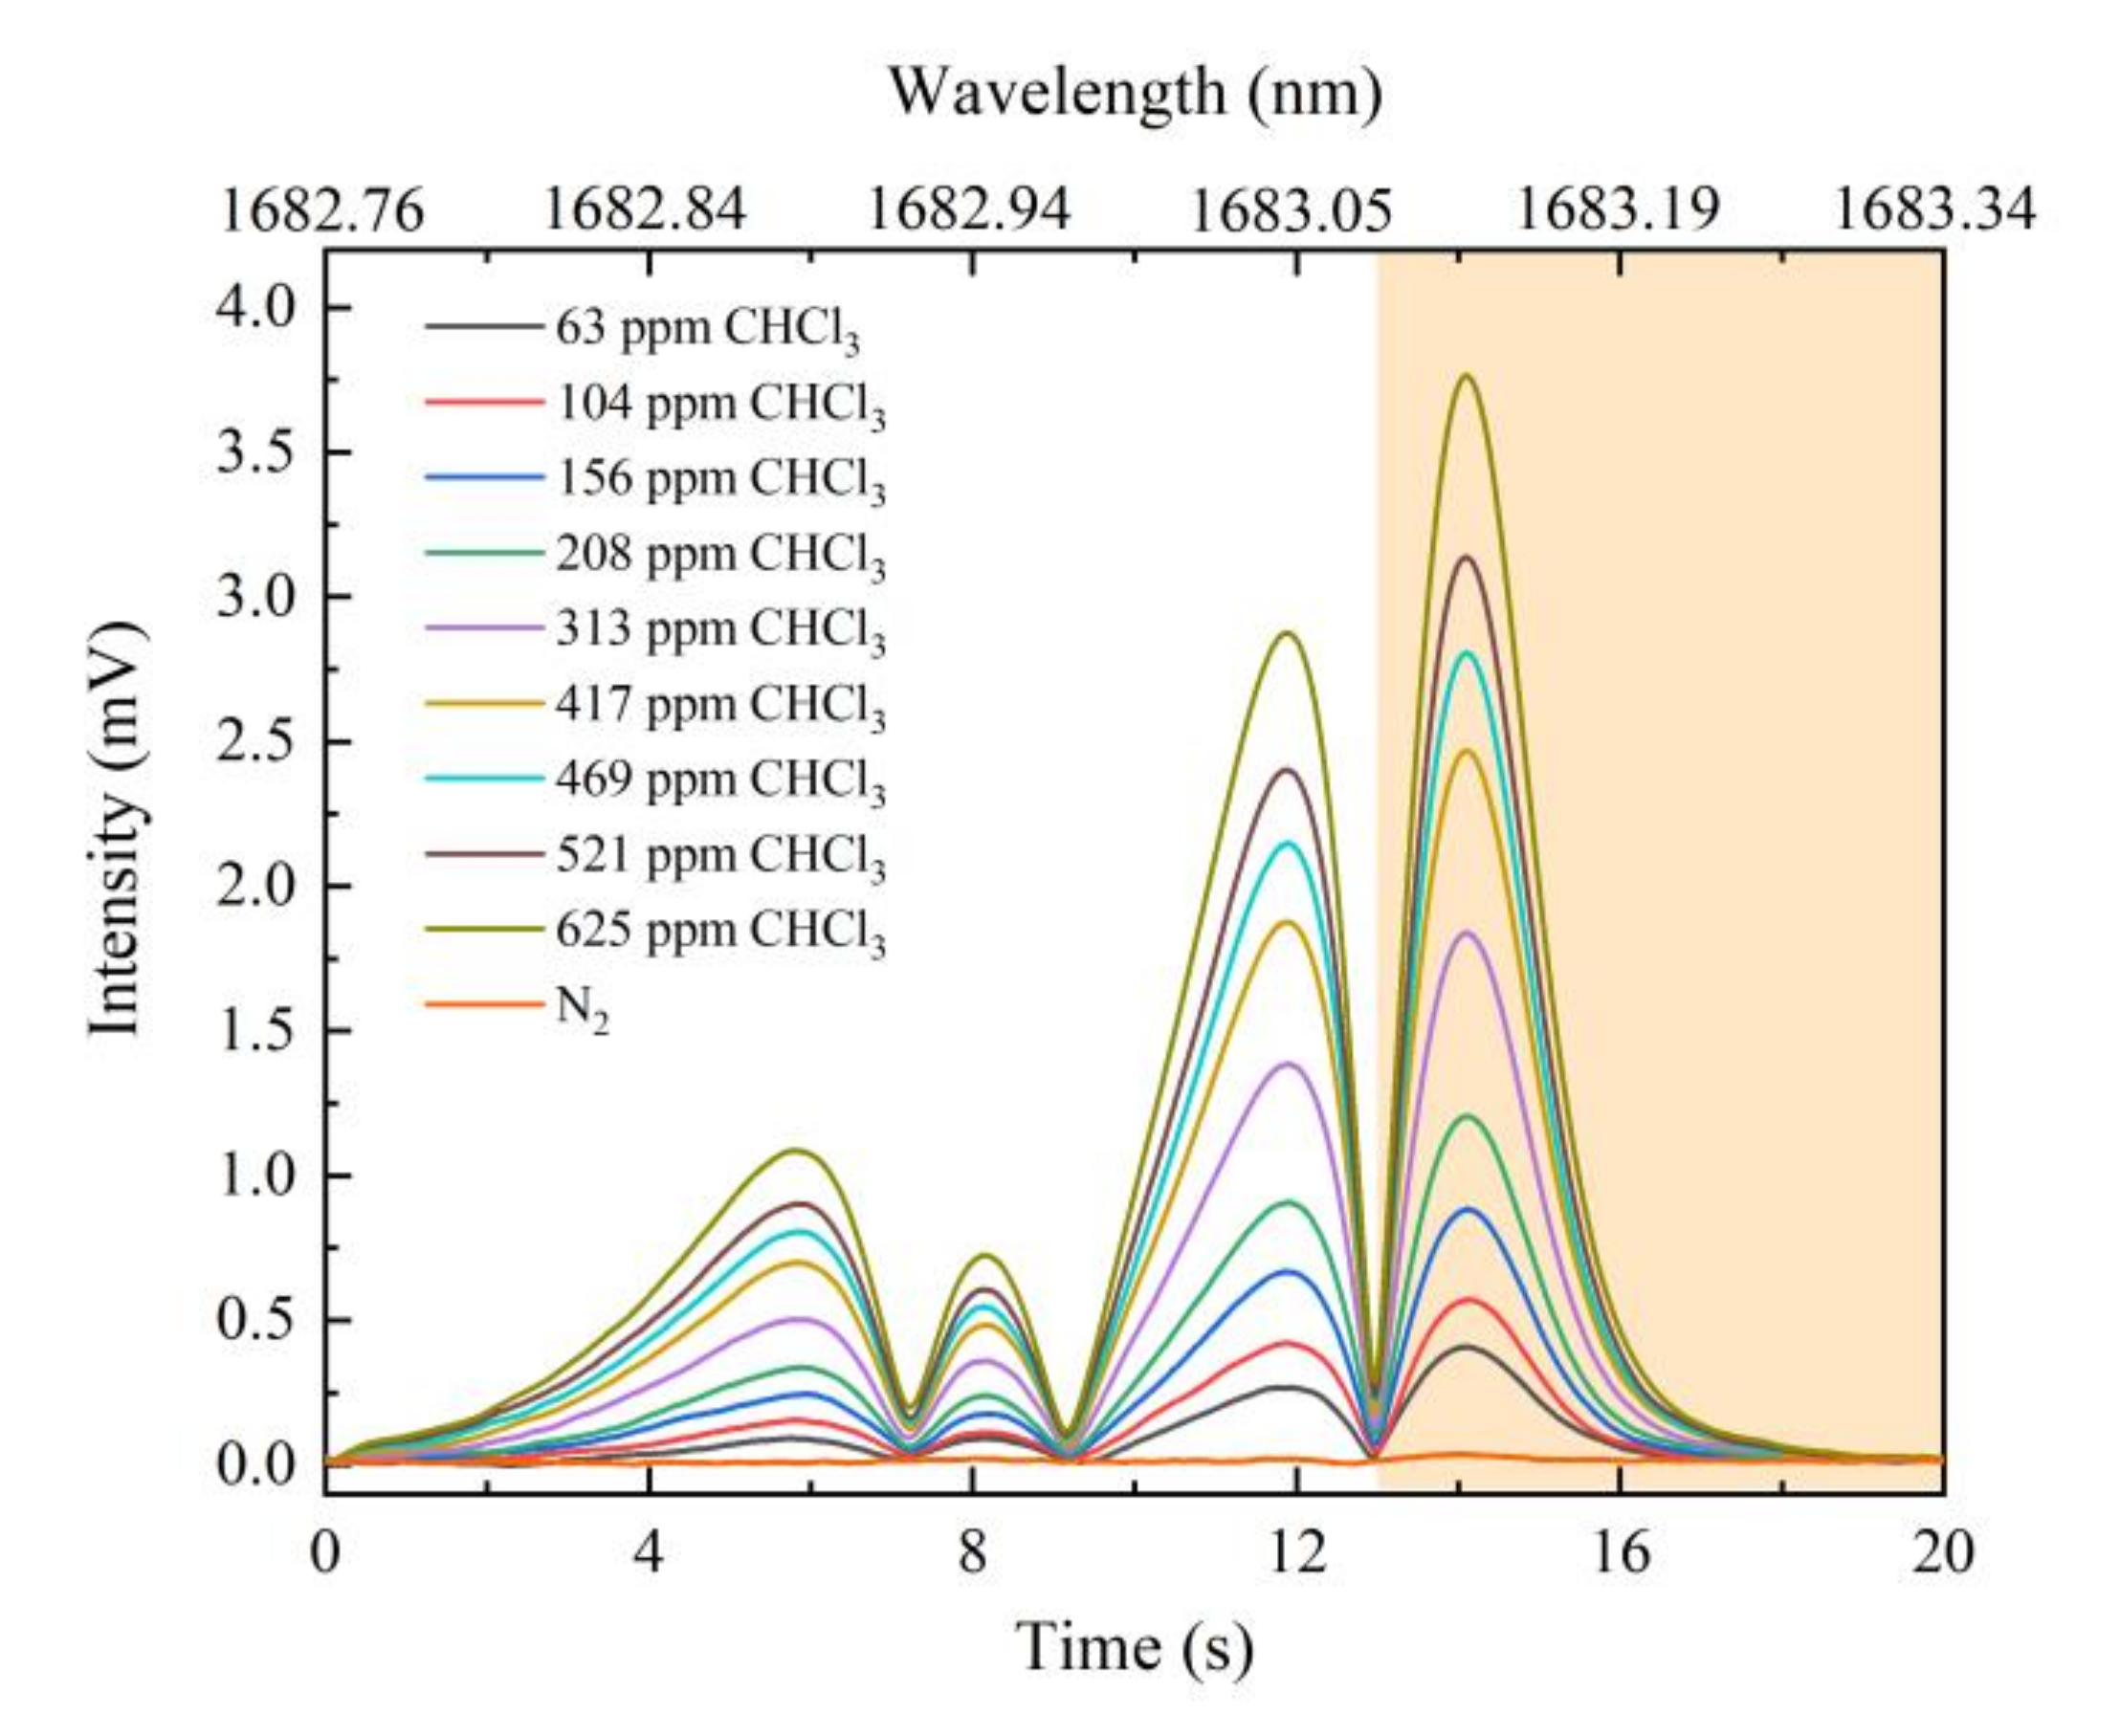
3.2. Continuous Measurement of Different Concentrations
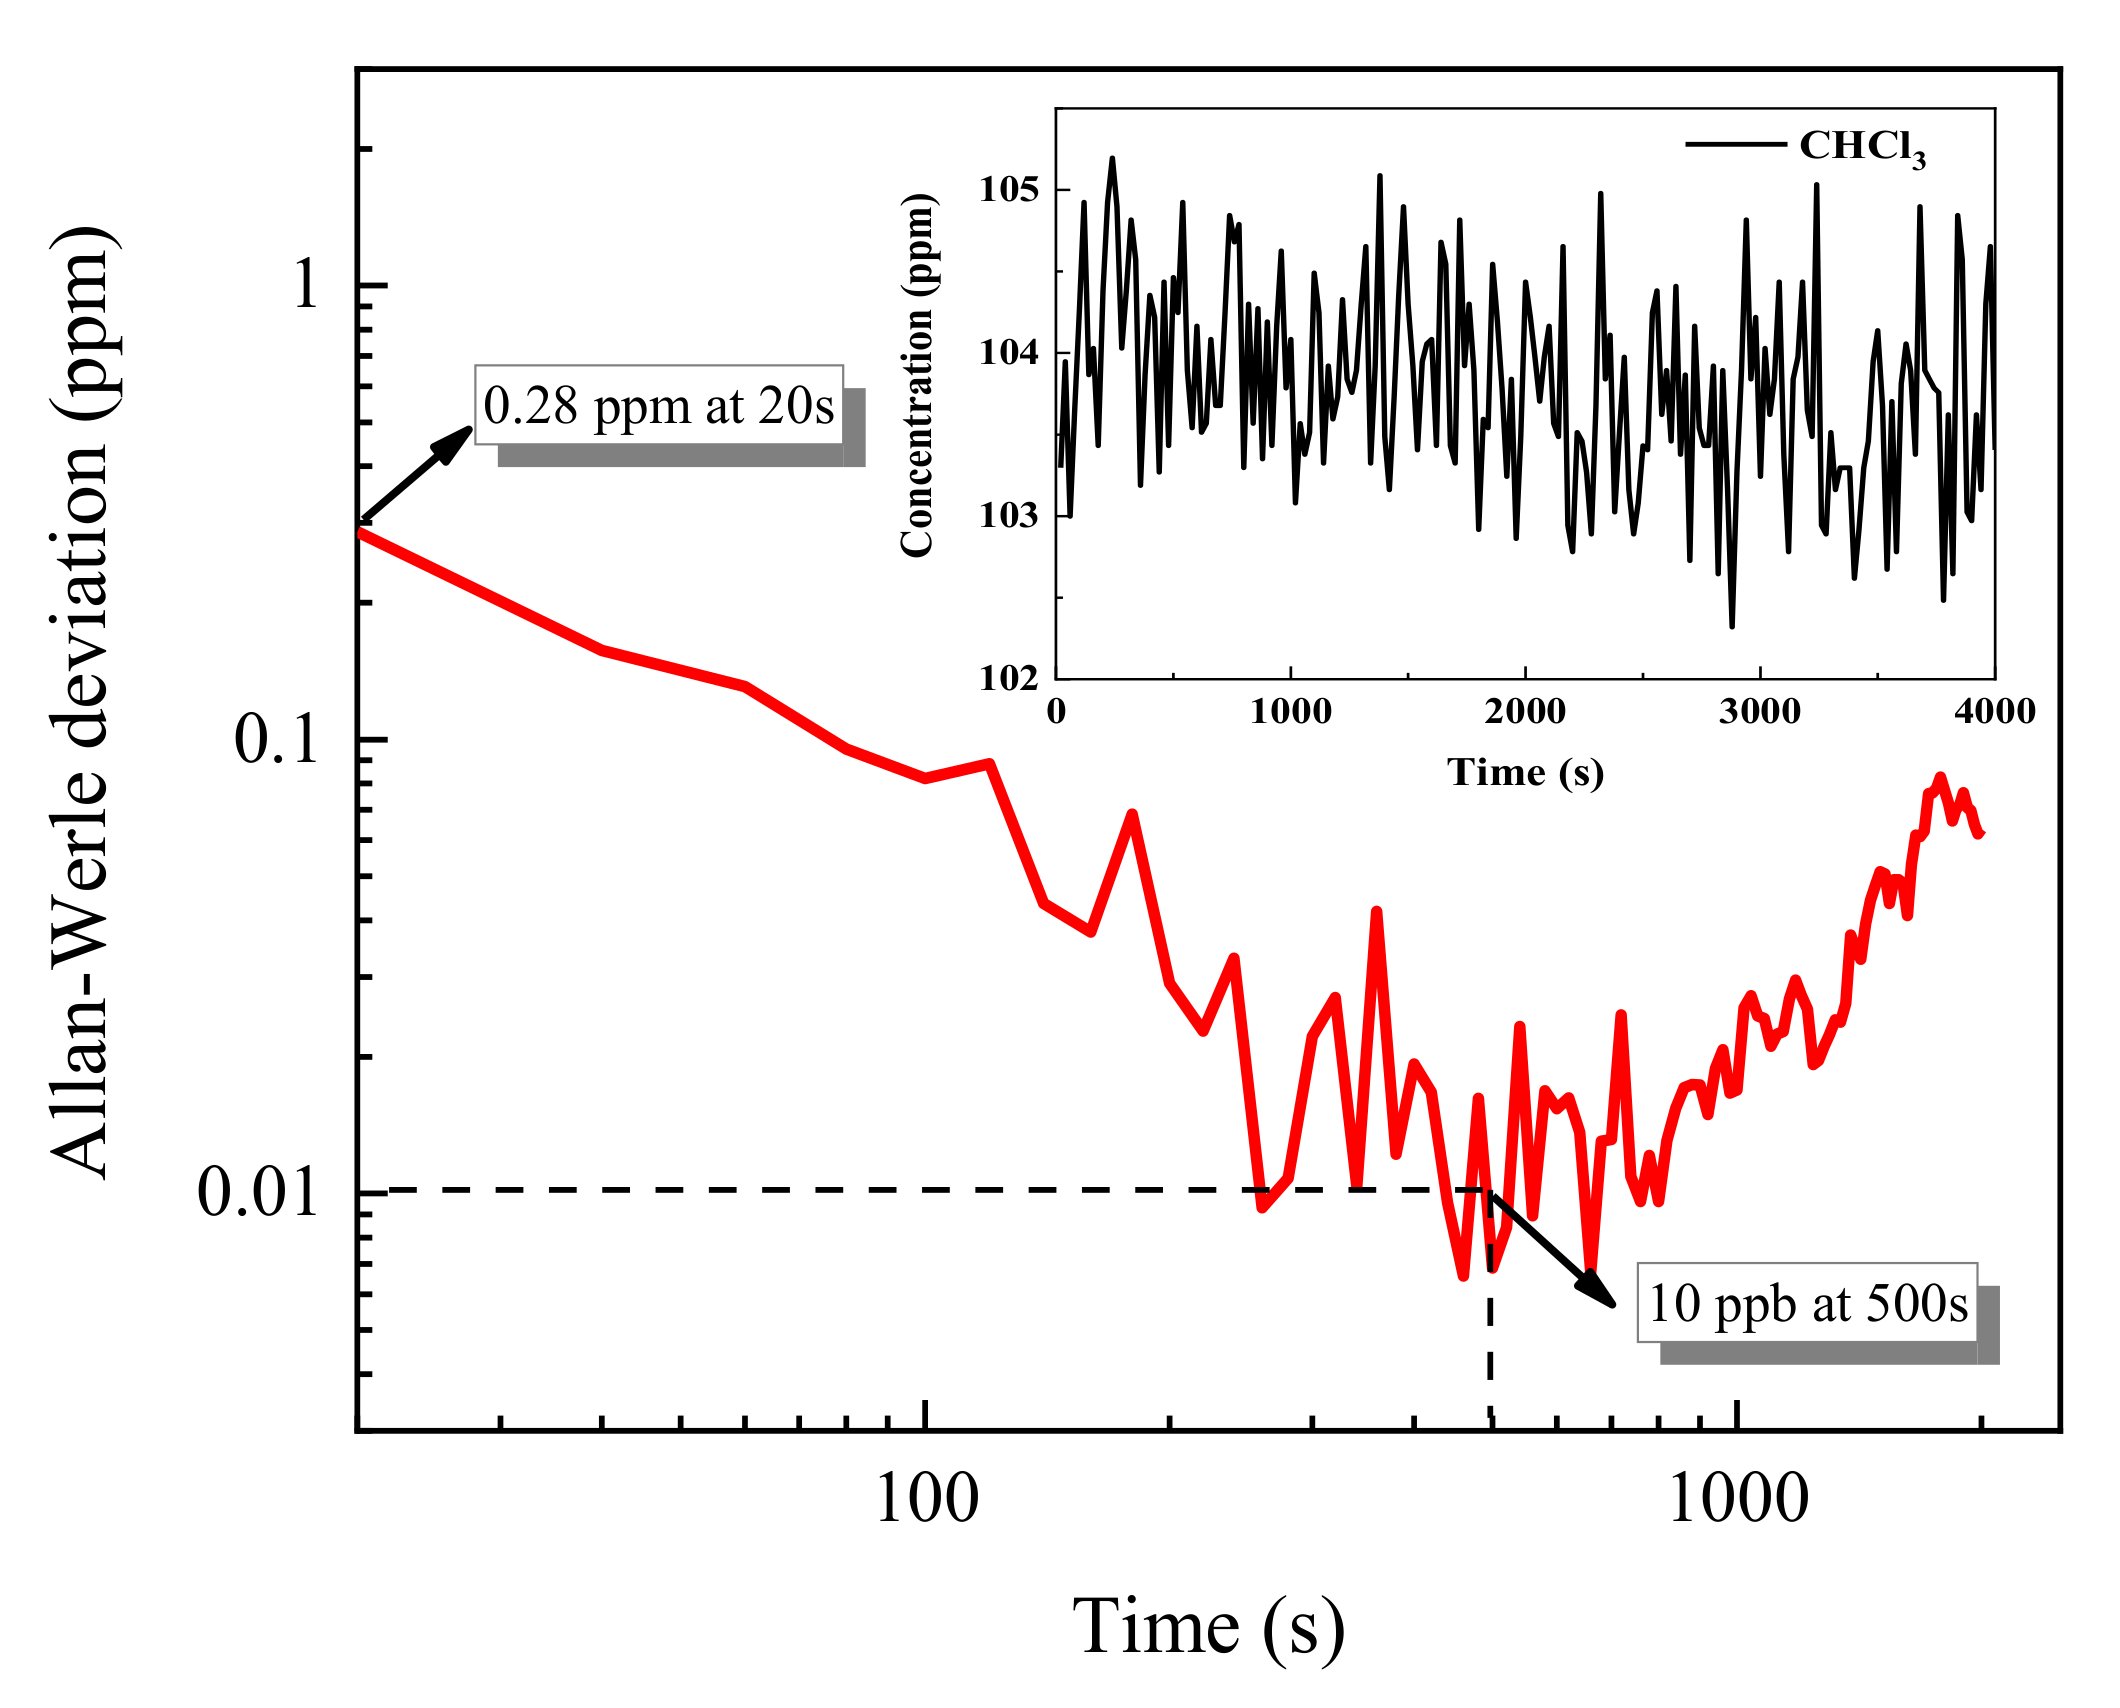
3.3. Allan Variance
3.4. Anti-Interference
4. Conclusions
Author Contributions
Funding
Institutional Review Board Statement
Informed Consent Statement
Data Availability Statement
Acknowledgments
Conflicts of Interest
References
- Stroo, F.; Hans, W. In Situ Remediation of Chlorinated Solvent Plumes; Springer: New York, NY, USA, 2010; pp. 4–14. [Google Scholar]
- Mohebbifar, M.R. High-sensitivity detection and quantification of CHCl 3 vapors in various gas environments based on the photoacoustic spectroscopy. Microw. Opt. Technol. Lett. 2019, 61, 2234–2241. [Google Scholar] [CrossRef]
- Cao, X.-H.; Li, J.; Gao, H.; Du, Z.-H.; Ma, Y.-W. Simultaneous Determination of Carbon Disulfide, Carbon Monoxide, and Dinitrogen Oxide by Differential Absorption Spectroscopy Using a Distributed Feedback Quantum Cascade Laser. Anal. Lett. 2017, 50, 2342–2350. [Google Scholar] [CrossRef]
- Yu, S.; Yan, L.; Zhang, T.; Zhang, Y.; Zhang, X.; Sun, G.; William, W.Y. Gas detection based on quantum dot LEDs utilizing differential optical absorption spectroscopy. RSC Adv. 2017, 7, 30096–30100. [Google Scholar] [CrossRef] [Green Version]
- Al-Jalal, A.; Al-Basheer, W.; Gasmi, K.; Romadhon, M.S. Measurement of low concentrations of NO2 gas by differential optical absorption spectroscopy method. Measurement 2019, 146, 613–617. [Google Scholar] [CrossRef]
- Wang, P.; Chen, W.; Wan, F.; Wang, J.; Hu, J. A review of cavity-enhanced Raman spectroscopy as a gas sensing method. Appl. Spectrosc. Rev. 2019, 55, 393–417. [Google Scholar] [CrossRef]
- Zheng, K.Y.; Zheng, C.T.; Zhang, Y.; Wang, Y.D.; Tittel, F.K. Review of Incoherent Broadband Cavity-Enhanced Absorption Spectroscopy (IBBCEAS) for Gas Sensing. Sensors 2018, 18, 3646. [Google Scholar] [CrossRef] [PubMed] [Green Version]
- Amiot, C.; Aalto, A.; Ryczkowski, P.; Toivonen, J.; Genty, G. Cavity enhanced absorption spectroscopy in the mid-infrared using a supercontinuum source. Appl. Phys. Lett. 2017, 111, 061103. [Google Scholar] [CrossRef] [Green Version]
- Chandran, S.; Mahon, S.; Ruth, A.A.; Braddell, J.; Gutiérrez, M.D. Cavity-enhanced absorption detection of H2S in the near-infrared using a gain-switched frequency comb laser. Appl. Phys. A 2018, 124, 1–9. [Google Scholar] [CrossRef]
- Maity, A.; Maithani, S.; Pradhan, M. Cavity Ring-Down Spectroscopy: Recent Technological Advancements, Techniques, and Applications. Anal. Chem. 2021, 93, 388–416. [Google Scholar] [CrossRef]
- Liu, A.W.; Hu, C.L.; Wang, J.; Perevalov, V.I.; Hu, S.M. Cavity ring-down spectroscopy of 15N enriched N2O near 1.56 µm. J. Quant. Spectrosc. Radiat. Transf. 2019, 232, 1–9. [Google Scholar] [CrossRef]
- Wang, H.Y.; Wang, J.; Ma, X.Y.; Chen, W.L.; Chen, D.; Li, Q.F. Note: A NDIR instrument for multicomponent gas detection using the galvanometer modulation. Rev. Sci. Instrum. 2017, 88, 116103. [Google Scholar] [CrossRef] [PubMed]
- Tan, X.; Zhang, H.; Li, J.; Wan, H.; Guo, Q.; Zhu, H.; Liu, H.; Yi, F. Non-dispersive infrared multi-gas sensing via nanoantenna integrated narrowband detectors. Nat. Commun. 2020, 11, 1–9. [Google Scholar] [CrossRef] [PubMed]
- Lou, X.; Somesfalean, G.; Svanberg, S.; Zhang, Z.; Wu, S. Detection of elemental mercury by multimode diode laser correlation spectroscopy. Opt. Express 2012, 20, 4927–4938. [Google Scholar] [CrossRef] [Green Version]
- Lin, H.; Lou, X.; Zhong, W.; He, S. Continuous monitoring of elemental mercury employing low-cost multimode diode lasers. Meas. Sci. Technol. 2015, 26, 085501. [Google Scholar] [CrossRef]
- Lou, X.; Zhang, T.; Lin, H.; Gao, S.; Xu, L.; Wang, J.; Wan, L.; He, S. Detection of gaseous elemental mercury using a frequency-doubled green diode laser. Opt. Express 2016, 24, 27509–27520. [Google Scholar] [CrossRef]
- Lin, H.; Gao, F.; Ding, Y.; Yan, C.; He, S. Methane detection using scattering material as the gas cell. Appl. Opt. 2016, 55, 8030. [Google Scholar] [CrossRef]
- Zhang, T.; Lou, X.; Xu, L.; He, S. Elemental mercury sensing by synchronously sweeping two multimode diode lasers. Appl. Opt. 2020, 59, 3360–3368. [Google Scholar] [CrossRef] [PubMed]
- Besson, J.-P.; Schilt, S.; Thévenaz, L. Multi-gas sensing based on photoacoustic spectroscopy using tunable laser diodes. Spectrochim. Acta Part A Mol. Biomol. Spectrosc. 2004, 60, 3449–3456. [Google Scholar] [CrossRef]
- Bell, A.G. On the production and reproduction of sound by light. Am. J. Sci. 1880, 20, 305–324. [Google Scholar] [CrossRef] [Green Version]
- Kosterev, A.A.; Bakhirkin, Y.A.; Curl, R.F.; Tittel, F.K. Quartz-enhanced photoacoustic spectroscopy. Opt. Lett. 2002, 27, 1902–1904. [Google Scholar] [CrossRef] [Green Version]
- Ma, Y. Review of Recent Advances in QEPAS-Based Trace Gas Sensing. Appl. Sci. 2018, 8, 1822. [Google Scholar] [CrossRef] [Green Version]
- Elia, A.; Di Franco, C.; Lugarà, P.M.; Scamarcio, G. Photoacoustic Spectroscopy with Quantum Cascade Lasers for Trace Gas Detection. Sensors 2006, 6, 1411–1419. [Google Scholar] [CrossRef] [Green Version]
- Dumitras, D.C.; Dutu, D.C.; Matei, C.; Magureanu, A.M.; Petrus, M. Laser photoacoustic spectroscopy: Principles, instrumentation, and characterization. J. Optoelectron. Adv. Mater. 2007, 9, 3655–3701. [Google Scholar]
- Choi, H.; Ryu, J.-M.; Choe, S.-W. A novel therapeutic instrument using an ultrasound-light-emitting diode with an adjustable telephoto lens for suppression of tumor cell proliferation. Measurement 2019, 147, 106865. [Google Scholar] [CrossRef]
- Wang, G.; Kulinski, P.; Hubert, P.; Deguine, A.; Petitprez, D.; Crumeyrolle, S.; Fertein, E.; Deboudt, K.; Flament, P.; Sigrist, M.W.; et al. Filter-free light absorption measurement of volcanic ashes and ambient particulate matter using multi-wavelength photoacoustic spectroscopy. Prog. Electromagn. Res. 2019, 166, 59–74. [Google Scholar] [CrossRef] [Green Version]
- Civiš, S.; Horká, V.; Cihelka, J.; Šimeček, T.; Hulicius, E.; Oswald, J.; Pangrác, J.; Vicet, A.; Rouillard, Y.; Salhi, A.; et al. Room-temperature diode laser photoacoustic spectroscopy near 2.3 μm. Appl. Phys. B 2005, 81, 857–861. [Google Scholar] [CrossRef]
- Wang, J.; Wang, H. Ammonia, carbon dioxide and water vapor detection based on tunable fiber laser photoacoustic spectroscopy. Opt. 2016, 127, 942–945. [Google Scholar] [CrossRef]
- Wang, Z.L.; Tian, C.W.; Liu, Q.; Chang, J.; Zhang, Q.; Zhu, C.G. Wavelength modulation technique-based photoacoustic spectroscopy for multipoint gas sensing. Appl. Opt. 2018, 57, 2909–2914. [Google Scholar] [CrossRef]
- Salati, S.H.; Khorsandi, A. Apodized 2f/1f wavelength modulation spectroscopy method for calibration-free trace detection of carbon monoxide in the near-infrared region: Theory and experiment. Appl. Phys. A 2013, 116, 521–531. [Google Scholar] [CrossRef]
- Choi, S.S.; Mandelis, A.; Guo, X.; Lashkari, B.; Kellnberger, S.; Ntziachristos, V. Wavelength-Modulated Differential Photoacoustic Spectroscopy (WM-DPAS) for noninvasive early cancer detection and tissue hypoxia monitoring. J. Biophotonics 2016, 9, 388–395. [Google Scholar] [CrossRef]
- Schilt, S.; Thévenaz, L. Wavelength modulation photoacoustic spectroscopy: Theoretical description and experimental results. Infrared Phys. Technol. 2006, 48, 154–162. [Google Scholar] [CrossRef]
- Chen, K.; Liu, S.; Mei, L.; Jin, F.; Zhang, B.; Ma, F.; Chen, Y.; Deng, H.; Guo, M.; Yu, Q. An auto-correction laser photoacoustic spectrometer based on 2f/1f wavelength modulation spectroscopy. Analyst 2020, 145, 1524–1530. [Google Scholar] [CrossRef] [PubMed]
- Wang, Q.; Wang, Z.; Ren, W. Wavelength-stabilization-based photoacoustic spectroscopy for methane detection. Meas. Sci. Technol. 2017, 28, 065102. [Google Scholar] [CrossRef]
- Gordon, I.E.; Rothman, L.S.; Hill, C.; Kochanov, R.V.; Tan, Y.; Bernath, P.F.; Birk, M.; Boudon, V.; Campargue, A.; Chance, K.V.; et al. The HITRAN2016 molecular spectroscopic database. J. Quant. Spectrosc. Radiat. Transf. 2017, 203, 3–69. [Google Scholar] [CrossRef]
- Qiao, S.; Ma, Y.; Patimisco, P.; Sampaolo, A.; He, Y.; Lang, Z.; Tittel, F.K.; Spagnolo, V. Multi-pass quartz-enhanced photoacoustic spectroscopy based trace gas sensing. Opt. Lett. 2021, 46, 977–980. [Google Scholar] [CrossRef]


Publisher’s Note: MDPI stays neutral with regard to jurisdictional claims in published maps and institutional affiliations. |
© 2021 by the authors. Licensee MDPI, Basel, Switzerland. This article is an open access article distributed under the terms and conditions of the Creative Commons Attribution (CC BY) license (https://creativecommons.org/licenses/by/4.0/).
Share and Cite
Zhang, T.; Xing, Y.; Wang, G.; He, S. High Sensitivity Continuous Monitoring of Chloroform Gas by Using Wavelength Modulation Photoacoustic Spectroscopy in the Near-Infrared Range. Appl. Sci. 2021, 11, 6992. https://doi.org/10.3390/app11156992
Zhang T, Xing Y, Wang G, He S. High Sensitivity Continuous Monitoring of Chloroform Gas by Using Wavelength Modulation Photoacoustic Spectroscopy in the Near-Infrared Range. Applied Sciences. 2021; 11(15):6992. https://doi.org/10.3390/app11156992
Chicago/Turabian StyleZhang, Tie, Yuxin Xing, Gaoxuan Wang, and Sailing He. 2021. "High Sensitivity Continuous Monitoring of Chloroform Gas by Using Wavelength Modulation Photoacoustic Spectroscopy in the Near-Infrared Range" Applied Sciences 11, no. 15: 6992. https://doi.org/10.3390/app11156992