Review

On a Certain Research Gap in Big Data Mining for Customer Insights

by
Maria Mach-Król
* and
Bartłomiej Hadasik
Department of Business Informatics, University of Economics in Katowice, ul. 1 Maja 50, 40-287 Katowice, Poland
*
Author to whom correspondence should be addressed.
Appl. Sci. 2021, 11(15), 6993; https://doi.org/10.3390/app11156993
Submission received: 30 June 2021 / Revised: 21 July 2021 / Accepted: 27 July 2021 / Published: 29 July 2021
(This article belongs to the Special Issue Advances in Information System Analysis and Modeling (AISAM))

Abstract

:
The main purpose of this paper is to provide a theoretically grounded discussion on big data mining for customer insights, as well as to identify and describe a research gap due to the shortcomings in the use of the temporal approach in big data analyzes in scientific literature sources. This article adopts two research methods. The first method is the systematic search in bibliographic repositories aimed at identifying the concepts of big data mining for customer insights. This method has been conducted in four steps: search, selection, analysis, and synthesis. The second research method is the bibliographic verification of the obtained results. The verification consisted of querying the Scopus database with previously identified key phrases and then performing trend analysis on the revealed Scopus results. The main contributions of this study are: (1) to organize knowledge on the role of advanced big data analytics (BDA), mainly big data mining in understanding customer behavior; (2) to indicate the importance of the temporal dimension of customer behavior; and (3) to identify an interesting research gap: mining of temporal big data for a complete picture of customers.

1. Introduction

Obtaining a sustainable competitive advantage largely depends on the organization’s analytical skills, including the ability to analyze customers’ needs and demands [1,2]. Research has shown that organizations which rely on advanced data analysis perform much better than others, both financially and operationally [3]. For several years, organizations have been gaining a new source of data for analysis, known as big data. Mikalef et al. [4] show in a detailed manner how various resources and contextual factors lead to performance gains from big data analytics (BDA). However, organizations are still facing the problem of efficient analysis and understanding of this data. This is due to the features of big data, which are the most often described as the so-called 7V, i.e., Volume, Velocity, Variety, Veracity, Variability, Visualization, Value [5]. In a modern fast-changing economy, the Velocity and Variability dimensions become particularly important—the features that cause the most problems in the analysis process are the speed of data inflow and their variability and thus the temporal dimension of big data. This dimension is interconnected with the fundamental assumption that time is an inseparable element influencing the phenomenon of big data and the process of analyzing this data. The temporal dimension manifests itself in three ways: as the fourth dimension of space-time, as the logical sequence of events (which are described by big data), and as a direct determinant of these events (cf. [6]). The time dimension concerns both the phenomenon of data inflow and the reality reflected in these data, because the organization’s environment is changeable. The formal description of time and temporality is given, e.g., in [7].
One of the most important volatile elements influencing the reality of an organization is the image of its customers. This image comes in the form of customer insights, defined as the profound “knowledge about customers” [8] that is knowledge about their needs, expectations, and opinions which drives organizations’ innovative efforts and business processes [9] (cf. Section 2.1). Extracting value from customer insights is identified as a pronounced challenge for organizations which becomes even greater when these insights are searched for in the vast area of big data [10,11]. To effectively analyze big data about customers, organizations must therefore adapt to their dynamics. Only in this way will they obtain current and valuable knowledge about trends and market expectations [11]. Such advanced analysis of clients is the way to acquire, maintain, engage, and satisfy them in an effective manner [11,12]. Customer analytics is strictly related to time and dynamics as it brings behavioral insights about customers by finding hidden patterns in (big) data. Hence, big data consumer analytics may be defined as “the extraction of hidden insights about consumer behavior from big data and the exploitation of that insight through advantageous interpretation” [13]. The dynamic characteristics of customers’ opinions, expectations and behavior are already subject of research [12,14], but the temporal dimension of customer data is not addressed directly. As Jukić et al. [15] point out, big data needs to be analyzed in a time-sensitive manner. This applies also to customer big data. If customer behavior and opinions were tracked as they change in time, the company would be more customer-oriented, which is the vital step on the road to market success. Our previous research [16] also revealed the need for explicit incorporation of time aspect into big data analytics.
Processing and analyzing big customer data are possible thanks to the use of big data analytics tools. BDA, which has transformed the world of business management, has been dubbed a “game-changer” [17]. BDA is defined in the literature as “methodologies used to interpret and obtain information from big data-helps”. To drive future decisions, big data analytics leverages various databases from a heterogeneous range of related media and metadata [18]. Organizations, including enterprises, to function properly and in the long term, should advance and implement goals (under constant and dynamic establishment), both short-term and long-term. BDA is seen as the “enabler of dynamic capabilities” [19]. Grasping the processes taking place in the organization, of which the evolution of big data analytics is a part, is therefore the foundation for effective counteracting failures in achieving the goals of the organization for its further growth. The organization, being in constant and effective development, can better use BDA and thus more efficiently understand and research the needs of consumers.
The main purpose of this article is to provide a theoretically grounded discussion on big data analytics for customer insights and to identify and describe a research gap due to the lack of temporal big data mining methods and tools. The main contributions of this paper are:
  • To organize knowledge on the role of advanced big data analytics in understanding client behavior;
  • To indicate the importance of the temporal dimension of customer behavior;
  • To identify an interesting research gap: mining of temporal big data for a complete picture of clients.
These contributions are due to analyzing the existing research achievements promulgated in the domains of big data analytics and of customer analytics. Based on this analysis, we identify the current state of big data analytics for customer insights, and the challenges to address the time dimension of customer behavior while mining big data.
The literature search has employed various bibliographic databases: Scopus, Thomson Reuters Web of Science, ProQuest, and EBSCOhost, as well as open access papers. The research has been conducted in four steps: search, selection, analysis, and synthesis as proposed in [20]. The results presented in the paper have been verified against the Scopus database. The results obtained in this paper may be further utilized by scholars and researchers looking for an engrossing new possible area of investigation and by business practitioners searching for new approaches to customer analytics.
The rest of the paper is organized as follows: Section 2 provides a profound theoretical outline for the notions of customer insights and big data. In Section 3 the types of customer insights from big data are discussed in the context of their role in organizations. Section 4 is devoted to the identified challenges in big data mining which leads to the identification of a research gap. In Section 5, the identified research gap is verified against the Scopus database. In Section 6, the discussion of results against existing literature is provided. Section 7 summarizes and concludes the research findings.

2. Theoretical Lens

2.1. Customer Insights—The Prelude

The desire to develop the organization continuously necessitates a thorough and discerning understanding of consumers together with their needs. The specialist literature decades ago noticed the need not only to recognize them but also to understand them for the proper development of a product or enterprise [21,22]. The needs of consumers are divided into the current (based on the nature of awareness and relatively easy to assess) and the future (which do not exist now but will be materialized in the future) [22,23]. The key to the constant product’s (and thus organization’s) advancement is to recognize and comprehend all customer needs, including those latent (also called hidden) that many consumers identify as relevant in the finished product but do not or cannot express ahead of time [24].

2.1.1. The Uprising of “Customer Insights” Notation

The very theory of customer needs that arose and developed in the 20th century is mainly based on behavioral aspects. The new millennium at its very beginning brought new discoveries in economics and market research, such as the 2001 Nobel Prize-winning “analyses of markets with asymmetric information” by Akerlof, Spence and Stieglitz [25] or “integrated insights from psychological research into economic science, especially concerning human judgment and decision-making under uncertainty” by Kahneman, also awarded the Nobel Prize in 2002 [26]. These economic breakthroughs shed new light on the extension of the aspects of customer research, also in terms of rapidly changing technological reality. The word “understanding”, which was constantly appearing in the works of the 20th century, seemed to become the starting point for the changes in a human-oriented approach appearing continuously more.
To properly understand customers, the holistic concept of “customer insight” is commonly used. This concept includes not only “classic” information about the customers (such as who they are, what they do, what they like to buy, etc.) but also psychological and behavioral concepts, such as what clients think or feel, what are their goals, and how their behaviors influence their decisions (including purchasing ones) [27]. Insights also include unconscious and instinctive attitudes and behaviors, which may be further analyzed. Customer insight may then turn out to be valuable for the organization if the process of managing and handling customer insight is implemented and driven properly [27]. It can be briefly said that customer insight is not only an answer to the question: “who?” (“what?”), but also “how?” and “why?” in terms of an attempt to define an organization’s audience.
A tentative to properly define customer insight was a challenge, in the face of noticed incorrect interchangeable usage of the terms of data, information, knowledge, insight, and value [28]. As these concepts have been organized and prioritized many times, which was proved by scientific works from the previous centenary in the field of information knowledge [29], it is worth emphasizing the concept of customer insight in relation to the relationship with these notations. Barney [8] defines this concept as “knowledge about customers which meets the criteria of an organizational strength; that is, it is valuable, rare, difficult to imitate and which the organization is aligned to make use of”. Creating or extracting value from customer insights was identified as one of the greatest challenges of the 21st century for organizations at the very beginning of this century. To correctly extract value from insights, Smith, Wilson and Clark [28] proposed a framework consisting of 12 subsequent stages—one of its most important elements is listening to consumers and their proposed changes and not arbitrarily deciding what change is most needed organization for its proper development. Takeuchi et al. [30] showed that listening to customers can reveal a multitude of valuable information about them by collecting their insights and analyzing them.

2.1.2. Customer Relationship Management

The concept directly related to customer insight (and occurring in parallel) is customer relationship management (CRM) [31]. Having its foundations already in the 1980s (and developed in 1990’s to its nearing to current form and purpose), its assumption was initially only to collect data on customers (contractors) and cooperating companies [32]. CRM in its current form focuses on one-to-one relationships with customers as potential carriers of added value for the company [33]. It is also seen as a strategic approach that’s used in developed and emerging markets that helps companies to locate, maintain, and retain valuable customers through managing partnerships with them [34]. The concept of CRM is, however, under a constant discussion [35,36].
Studies show that CRM brings added value to an organization by increasing business performance and innovation capability—if the company does not bring sufficient attention to developing CRM and internal data-driven systems, its competitive advantage becomes weaker [37]. However, the direct relationship between CRM and customer insights should be strongly spotlighted. Bailey et al. [38] concluded that organizations must establish a shared view of what customer insight is and how it is applied within the enterprise, including the relationship with market segmentation and CRM. Taking such approach entails changes to marketers’ skills due to the primate of analytical abilities to generate individualized customer insight from extricated segments. Afterwards, such insights are capable to be transfigured into valuable conversations with individual customers (as [39] state: “markets are conversations”). It can be therefore described as a proactive managerial tactic, not a reactive one [40,41].
At the turn of 2007 and 2008, it was noticed that CRM in the then form became insufficient, and thus, it was developed into a form called CRM 2.0 or social CRM. The main reason for the need to develop this sphere was the analysis of the needs and behavior of the so-called Generation Y, which shows that its representatives are distinguished by the constant use of modern technologies, including the Internet and social networks [40]. The trend of communing with modern technology is continued by the younger generations—the Generation Y is only “familiar” with technology, while the younger Generation Z is referred to as “the most tech-savvy generation, born in a digital world” [42]. In view of the crescent use of Internet technologies among adolescents, measuring their needs and insights will be more effective due to the larger potential research sample, increasing the representativeness of the generation. Going further, it can be assumed that the potential added value for the organization will increase.
The transformation of CRM into CRM 2.0 was due to the “customer” of the twentieth century becoming the “social customer” of the twenty-first century, who is characterized by the fact that they can share the content generated by users with virtually “one button” [40]. CRM 2.0 is an approach that recognizes that a new type of customer insights can be gleaned from a new type of customer. Although CRM 2.0 is based on two-way relationships with clients and focuses on building and developing all iterations of relationships (using social media tools), it is considered “strategically maturing but technologically immature” [40]. Despite the development of online tools, it can be seen in scientific works that the concepts of social media (analysis) and customer relationship management are inseparable and go hand in hand [43,44,45].

2.1.3. Other Technologies Helpful with Obtaining Customer Insights

In parallel to CRM tools, business intelligence (BI), along with data warehousing (DW) as a key BI technology [46], play a key role in building relationships with customers. Their role was particularly evident before the comprehensive and widespread use of big data, when the algorithms and methods used in BI and data warehouses had to be transformed to meet the new standards rooted in Web 3.0 (like cloud services or data analytics) [47,48]. The very idea of BI is to understand customer behavior and forecast their purchasing patterns to optimize the business and to maximize the organization’s value [49,50].
Business intelligence along with data warehousing is widely used in various business and social fields [51,52,53]. However, the use of BI as an independent approach for the organizational development is noticeable mainly in the case of the entities where the inflow of new data (including customers) can be handled using conventional tools, i.e., without the use of approaches used in big data dispensing. Data warehouses, despite the possibility of access from heterogeneous sources, mainly operate within one organization with access to historical data. They operate merely based on structured data, due to their database foundations [54]. This can be named the “atemporal approach” defined in the proprietary Temporal Big Data Maturity Model (TBDMM), which constitute the lowest level of organization maturity in the context of readiness to use big data [16,55]. At this level, the organization uses only static knowledge and multi-dimensional data models but scarcely uses BI tools with data warehouses, not big data. Therefore, temporal inference is not possible, despite the presence of scarce time stamps.
It is also seen in terms of customer insights investigation. The most important pillars of customer insights are data (beyond the transactional data on which traditional CRM leans) but also customer profiling, social media participation, and sentiment analysis [56]. The latter has been the subject of many studies, such as that of [57], which concerned obtaining the opinions of Twitter users (i.e., in fact translating into knowledge derived from them) based on publicly available databases from this portal. In the study, there is a time range in which the study was conducted (i.e., data from a specific period was collected), and data from a social network were used. Nonetheless, the analyzed data was structured (from a specific source); hence, the analyzes were simplified. A similar situation can be described in [58], which consisted in segmenting customer groups based on their opinions (discussions) from Twitter based on a semantic approach (i.e., using patterns and clustering methods such as k-means).
Willing to discuss analyzes and interpretations in a temporal context (including inference), there is a need to develop the big data theory (which is what Section 2.2 serves for) to understand the higher-level approaches according to the TBDMM model mentioned above.

2.2. Big Data Issues

In a world overflowing with information, which is particularly evident in information societies with access to the Internet, the term “big data” is indispensable and interconnected. Nowadays, data are being sent to the global network not only by people who do it consciously and manually (e.g., via social networks or e-mails) but also by all kinds of sensors and with the use of cloud computing. It is a Web 3.0 domain of which big data is one of the main pillars [59].
Big data, as a nascent concept, has a rather turbulent history of trying to define it, and an attempt to organize the definitions was made by Gandomi and Haider [60]. The common axis of all definitions is the perception that big data, which can be viewed as a ‘new era’ of the data-driven paradigm, has opened up new possibilities for the improved decision support [61]. As said in Section 1, big data can also be defined using 7V characteristics, but when examining the temporal aspects of big data, the most important is the concept of velocity. Big data is not only vast and dynamic, but it also necessitates the use of cutting-edge technologies to analyze and process [62]. Big data is distinguished from the traditional “data” notation, because big data, due to its stupendous size, cannot be processed and managed with conventional data mining tools [63,64].
The concept of big data mining (BDM) is intimately associated to conventional data mining notation. These two concepts differ mainly in the methods of obtaining data, and not in the idea itself. BDM enables to obtain useful information from databases or data streams that are huge in terms of “big data V’s”, like volume, velocity, and variety [65]. The main functions of data mining in general are descriptive functions (such as clustering, association, and pattern mining) and predictive functions (such as classification, time series analysis, etc.) These functions (enablers) differ only slightly from each other, mainly in terms of the temporal reference, i.e., descriptive functions mainly concern the present and settled dependencies, and the predictive functions mainly refer to the study of the future and tentative dependencies. Having collected (big) data, it is necessary to analyze it to extract information hidden in it. In this case, it is crucial to use big data analytical tools. BDA was created in response to the need to analyze vast volumes of quickly collected complex data. As a result, data acquisition and processing occur at a high pace, which is impossible to achieve with calcareous computational methods [66]. Big data analytics, as being a big data derivative, can also be described with big data “V” characteristics. The ultimate and the pivotal step of the whole BDA process is “action on insight”, as Akhtar et al. [67] claim. The use and implementation of BDA, as one of the most principal factors for engendering meaningful insights for decision-making [68,69], is crucial to extract value from the multitude of data being obtained. An organizational capability to handle BDA has recently become mainstream to create value [70]. It should be noted, however, that the blossoming of BDA potential in organizations can be withheld due to the lack of IT infrastructure, data storage facilities and organization strategy [71].
The use of BDA is seen in a variety of realms [72,73,74,75,76,77,78,79]. Apart from technical uses, BDA is applicable in the economic fields among which the social media analytics (SMA) for revealing customers’ behavior has a prime importance [80]. This is because of the data volume: as of January 2021, there were 2.74 billion users on Facebook, 1.22 billion on Instagram and 353 million on Twitter [81]. Considering the multitude of posts shared by each user, this constitutes a potential mine of knowledge and a significant area for analysis, including segmentation, prediction, etc. This field of big data analytics is called social media analytics which is described in literature as “the analysis of structured and unstructured data from social media channels” [82]. Conducting SMA, including sentiment analysis, is also useful in assessing and understanding the behavior of users (or more broadly: society) in conditions of uncertainty, such as the current pandemic situation, which is confirmed by scientific research [83]. Social media analytics is used extensively in big data-enabled organizations including not only private companies, but also the public sector institutions. SMA generates new prospects by improved customer experience and overall operational efficiency [84,85].
In order to extract the hidden value of customer insights, big data (along with derived approaches, such as big data mining or wider: big data analytics) come in handy. Having presented the historical and theoretical background regarding the values of customer insights, it is possible to explore this topic in an even more extensive way, paying attention e.g., to the practical use of big data for customer insights in organizations. These issues are dealt with in the following Section 3, where topics related to customer insights (such as customer experience, sentiment, retention, churn, etc.) are presented in practical big data approaches and utilizations.

3. Types of Customer Insights from Big Data and Their Role in Organizations

Big data-enabled societies—particularly based on the foundations of the digital economy—are capable of opening new perspectives for organizations striving to get to know their customers better [86]. The enormous volumes of data deriving from a variety of sources allow to analyze greater number of dimensions depicting customers, than before. This is mostly due to the new sources of data origin, as e.g., social media. Thanks to the characteristics of big data, it offers gargantuan possibilities for gaining new insights [87,88]. These new insights are not narrowed to customer-centric decision-making processes but affect the whole operating space of an organization. In simplification, the insights from big data—if properly used—may contribute to value generation, as well as to innovations, and to the competitive advantage [89,90]. Specifically, big data analytics is considered together with data mining issues [91]. For example, Xindong Wu et al. [92] propose a big data processing model from the data mining perspective. They point out that mining big data is data-driven and demand-driven. This context of data mining is present in many big data analytics definitions. In the paper by Mohsenian-Rad et al. [93], this type of analytics is described as the process of uncovering hidden patterns, unknown correlations, irregularities, and other data-driven intelligence. Data mining related to big data analytics’ tasks also encompasses text mining (for sentiment analysis) and social media analytics (for community detection or social influence analysis) [60]. Especially the latter may be of paramount importance in modern dynamic operational environments, due to empowerment of organizations to perform the so-called situational data analytics instead of—or at least together with—classic static data analytics of transactional or enterprise data [94].
In the context of customer insights, there are several application areas of big data analytics which can be found in the literature. These include inter alia:
  • E-commerce [95,96];
  • Marketing [95,97];
  • Market basket analysis [76,98];
  • Customer intelligence [76];
  • Social media analytics [76,94,95,99,100];
  • Consumer banking [101];
  • Public transportation management [102];
  • Aviation [103];
  • Telecommunications [78,104];
  • Tourism [18,105];
  • Policymaking, public governance, and administration performance [106];
  • Customer relationships management [75,107,108].
In these application areas of big data analytics, several types of customer insights seem to dominate:
  • Customer needs;
  • Customer satisfaction and experience, sentiment analysis and opinion mining;
  • Customer profiles;
  • Customer churn, retention, and loyalty;
  • Customer behavior.
The use of big data analytics in acquiring customer insights is evidenced in many scientific studies confirmed by the successes of enterprises in the field of customer relationship management. Foremost, it should be noted that currently the largest corporations, such as Facebook, Amazon, Netflix, or Google, successfully use algorithms based on big data analysis in their business models in order to obtain “digital advantage” [109]. The case study conducted by Wang and Hajli [110] showed that the use of BDA (along with the “V” axes of big data: volume, variety, velocity [111,112]) in health sector organizations can obtain insightful business value, which led to their entrepreneurial triumph. The use of big data analytics is also used in the US Immigration and Customs Office to ensure the safety of citizens, immigrants, and travelers, as well as to counter terrorism [113]. The commercial successes include, first of all [113]:
  • A successful revolution in big data analysis in social networks such as Facebook and Twitter, translating into greater data personalization and understanding of customers, which strengthened the position of these companies on the market;
  • The use of customer insights and their transformation by BDA tools (using mobile network data) enabled a greater degree of profiling in the Sprint mobile network;
  • Personalization with big data (which is the result of “listening” to customers) has also found successful application at the Bank of Scotland and Netflix;
  • Big data for customer insights is also used for family and entertainment industries such as theme parks (Walt Disney Parks and Resorts), mobile gaming (Zynga), and casinos (Caesars).
Customer needs, as pointed out by Olszak and Zurada [90], play crucial role in acquiring competitive advantage by an organization. If properly captured and understood, they allow for new business opportunities. The big data analytics is one of the ways to achieve these goals and to create business value [114,115]. Customer needs may be examined by analyzing customer complaints, opinions, and sentiments [95] or by experimenting with customer data. In fact, there are five dimensions distinguished for creating business value from big data, and experimentations are one of them. Other dimensions are creation of transparency, segmentation of populations, replacement, or support of decision-making with algorithms and innovations concerning business models, products, and services [20,116]. Customer needs in the form of patterns excavated from big data are also indispensable for product customization which is becoming a dominant trend in today manufacturing [117]. Deepened knowledge on customer needs may be transfigured into product or services innovations, which may result in increased customer satisfaction. To stay informed on the satisfaction level of consumers, an organization needs to perform sentiment analysis and opinion mining on a daily basis. These adhibitions, along with trend discovery, are described as the most applied in big data analytics [99]. Big data sources—such as, e.g., opinion portals, organizations’ Facebook professional pages, forums, blogs, etc.—provide an immense amount of data and information on consumers’ reviews, opinions, wishes, complaints, and other satisfaction-related issues. With the utilization of big data, organizations may assess customer satisfaction levels in (almost) real time to adjust operations as needed [95]. As research has proven, big data analytics can explain 62.4% of the variance of customer satisfaction [118]. Measuring satisfaction levels, together with marketing reports, sales data, customer opinions and other allows to monitor organization’s performance on the market [119]. Customers’ sentiments may be explored in a continuous way using time-varying data and dedicated ICT tools [120], thus enabling organizations to capture market trends [121]. Hence, sentiment analysis and opinion mining are closely related to the issues of streaming analytics which is discussed below.
Customers’ opinions, sentiments, interests and needs when accompanied with socio-demographic, financial, and other types of data empower organizations to create customer profiles. These are used for brand management [122], marketing operations [123,124,125], churn prediction [126,127], and many others. In e-commerce, and more generally in the retail area, customer profiles are discovered from transactional data [95,116,128], from the CRM data [107], or from Internet data, especially the social networks [20,129]. The social media analytics constitutes a remarkable kind of big data analytics for customer insights and will be considered in more detail below. Big data analysis of customer experiences (CX) based on various sources of data origin during the customer journey on the website may allow for the interpretation of obtained analyzes that were conducted as customer insights [130]. The use of big data analytical tools in the field of social media contributes to the enhancement of the organization’s marketing by creating instruments for personalizing recommendations [100]. This can be done through the pattern detections (which is one of the main aspects of data mining [131]) and may turn to be useful when generating positive insights. There are also broader attempts to analyze big data for customer intelligence [76].
The customer churn and customer retention and loyalty are amongst the most used big data analytics applications, together with market basket analysis, customer intelligence, retention modeling, and social media analytics [76]. As claimed in [132], analytics directed towards new data sources—e.g., social networks, clickstreams, CRM, emotions, opinions, audio and video conversations, images etc.—allows not only churn prediction but also insights on prevention manners and what incentives to use. It has also been proven that using big data analytical tools, such as Hadoop (with Datameer extension), with prior collection of consumer data (i.e., archive, network, mobile), can not only significantly contribute to creating a customer churn prediction model but also understanding the client retirement path [133]. More generally, contemporary big data analytics is successfully used to conduct research on customer loyalty and customer retention. Chiefly in industries under constant and dynamic development, as e.g., telecommunications, big data analytics is not only aimed at attracting new customers. It primarily focuses on retaining the “old” (current) ones through analyzing the behaviors characterized by the way telecommunications services are used [134]. In particular, big data techniques enable profound analysis of socio-demographic, psychographic, and behavioral features [107]. Insights on customer behaviors are nowadays strictly related with streaming analytics, social media analytics, and pattern mining.
The aims of customer behaviors’ analytics can be generally divided into detection of behavioral patterns and prediction of behaviors [135]. The former allows for a better understanding (description) of customers, while the latter, for an adjustment of enterprise’s actions towards actual and potential customers. Obviously both aims are interrelated.
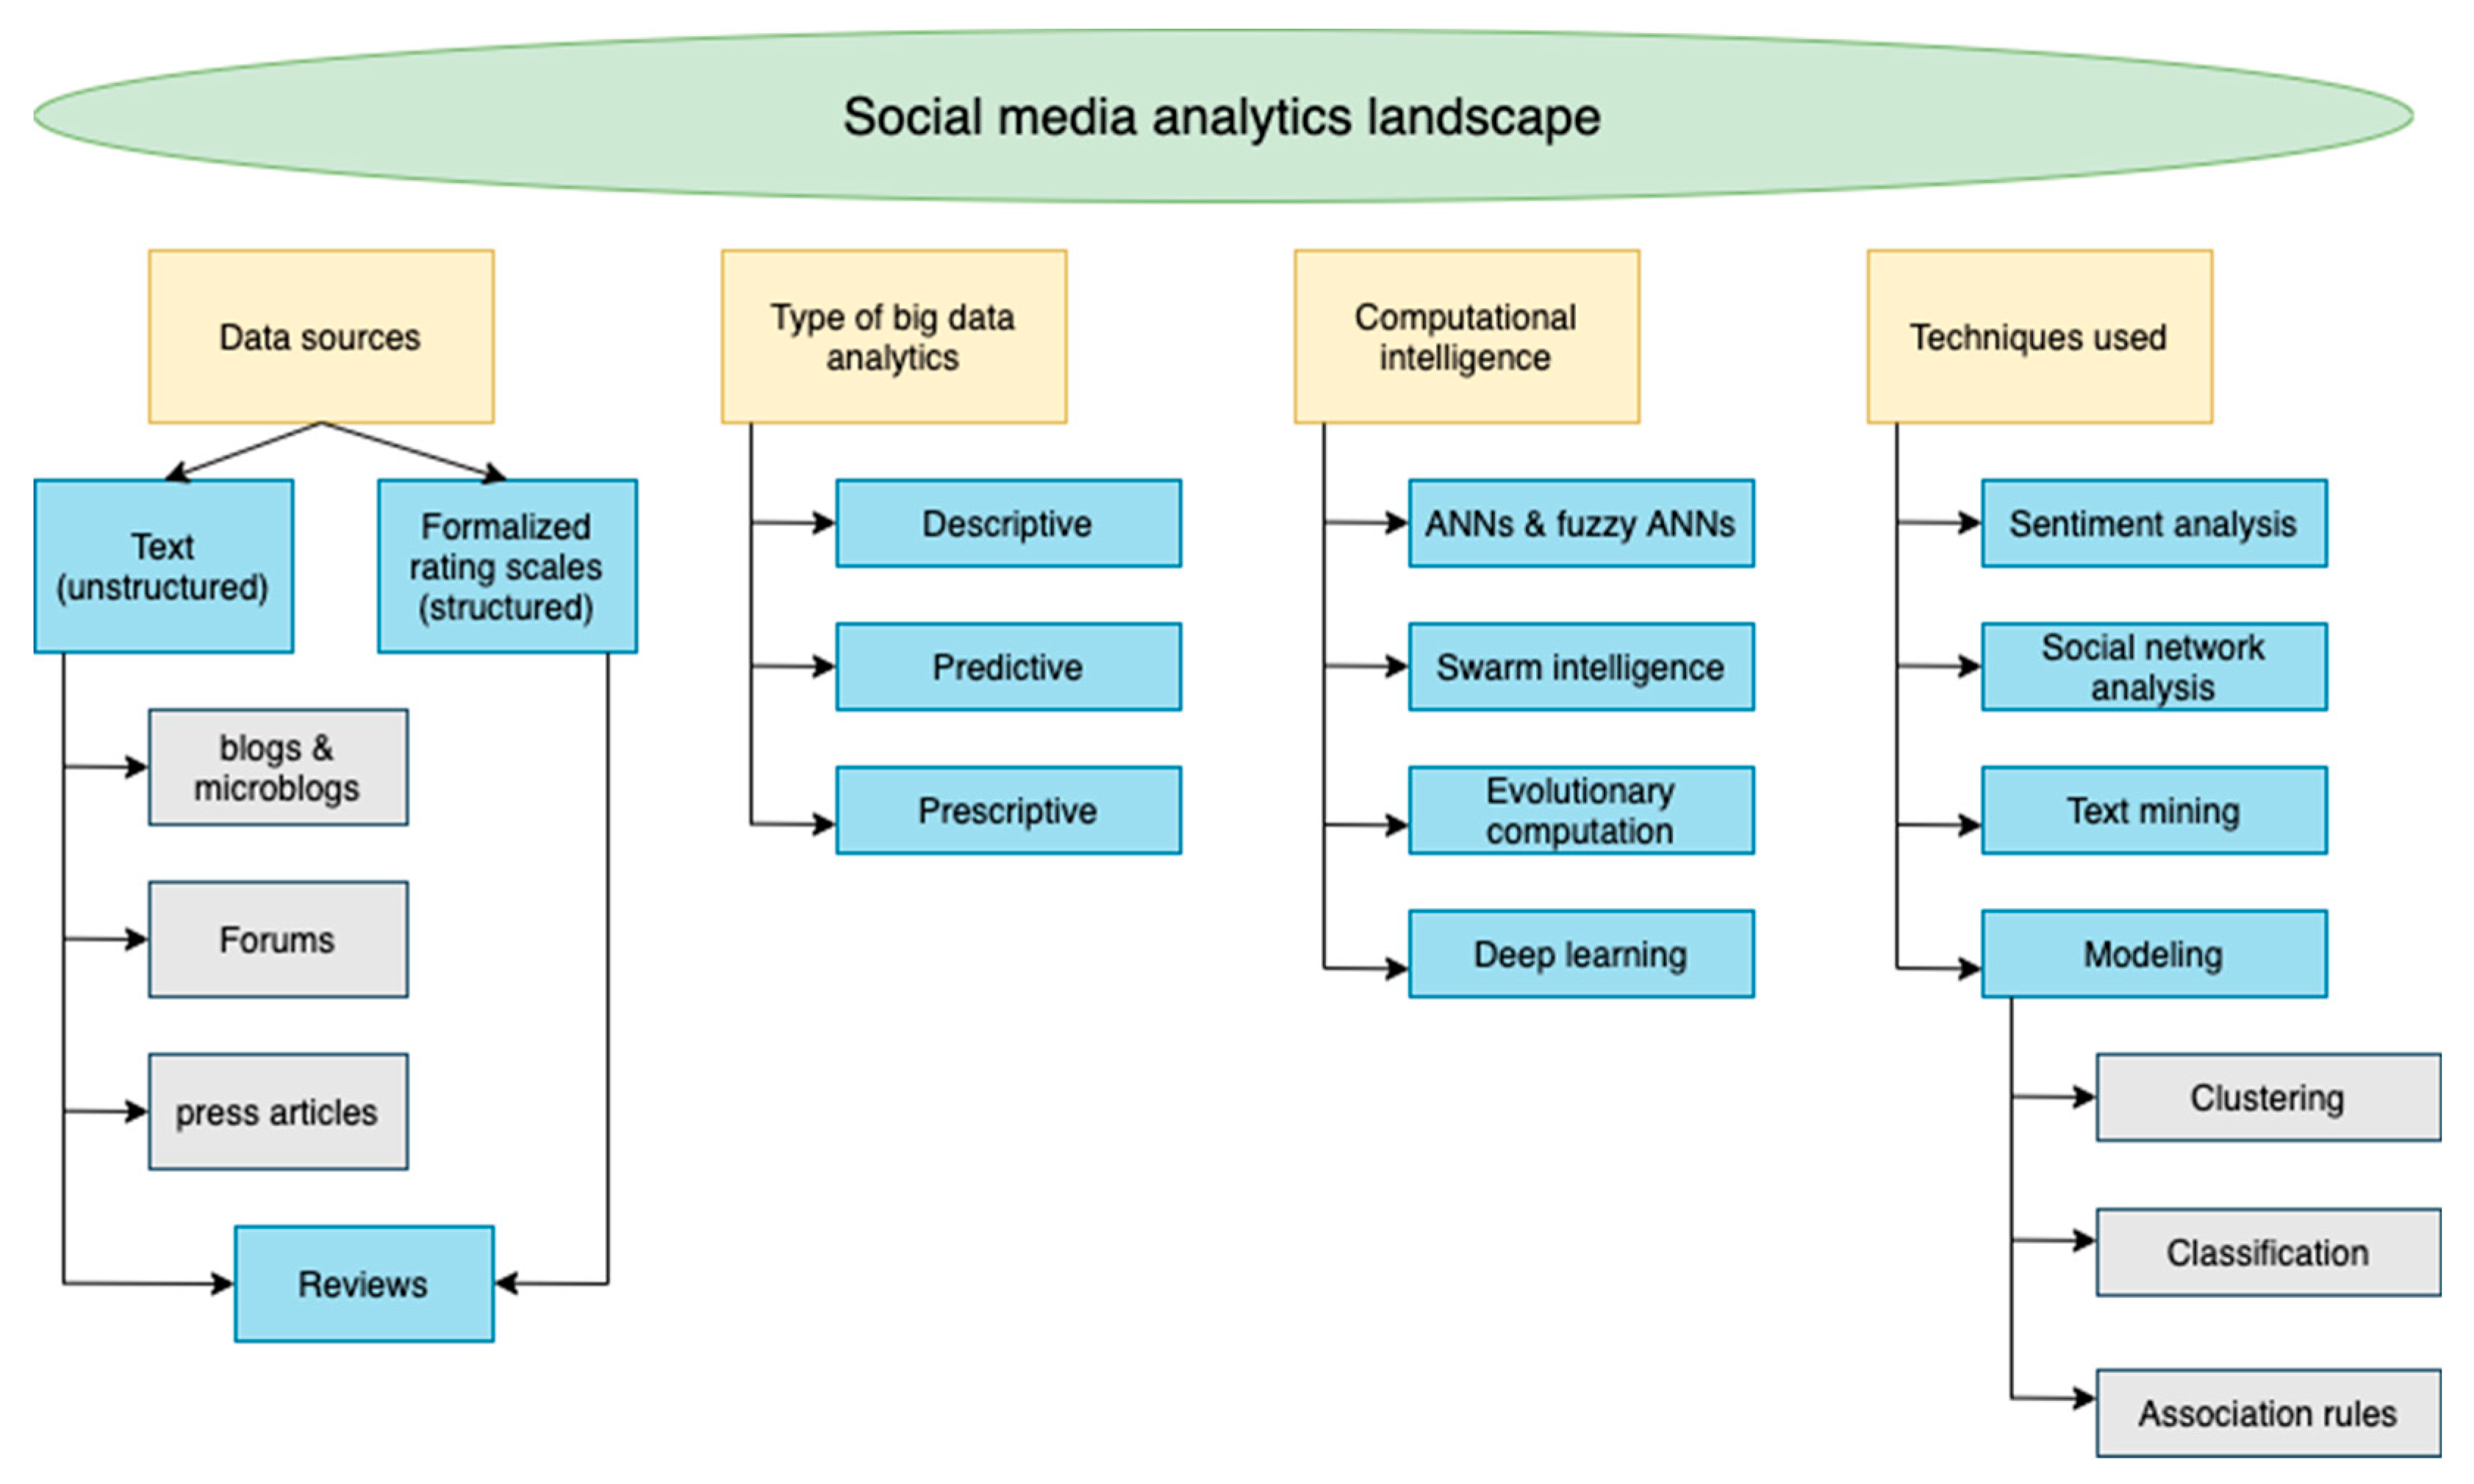
Social media analytics arises as an important part of marketing insights because of an increasing role of sentiment and recommendations [95]. When used in various fields of marketing, business, or politics, it allows to constantly collect, monitor, and naturally analyze user’s behavior or his/her sentiments while continuously inspecting user-generated content [136]. Sentiments show consumers’ reactions to enterprises’ offers and marketing activities. Moreover, social media analytics may reveal how information streams between consumers and how the network is formatted [120,137]. Big data approach to social media may reveal consumers’ communities and directions of social influence [60]. Insights on customers’ social media activities, connections, interactions with the firm, and emotions are used to explore retention models [93,132]. To prevent churn, firms may propose diversified offers to customers as well as diversified marketing content in various social media channels [108]. The summary of social media analytics to understand customers is presented in Figure 1, with various big data analytical activities on SM.
Customer behavior may be observed and analyzed not only on social media, but also by tracing information from customer touchpoints with the firm. Broadly, data may come from service providers (e.g., business transaction, human resource, and financial data) or customers (e.g., demographic, behavioral, and purchase history data) [108]. Data may also originate from location services and interconnected technologies, like GPS [138]. With the use of big data analytics accompanied by these sources it is possible to detect customers’ patterns. These patterns may concern buying habits, searching activities, site usage, movement behaviors, and may others which allow for almost real-time monitoring of consumers [128,139]. If they are extracted with intelligent algorithms, they are called smart data [140], which come in handy to proper data interpretation and data provenance provision [141]. Regardless of the name, the predominant issue in such analyzes is to explicitly link patterns and behaviors to the dimension of time. This is because social networks, behaviors, patterns are all dynamic constructs. For example, in virtue of big data analytical tools, it is possible to measure the flow of information in a social network (SN) at scale and over time [137] to monitor consumers’ reactions and responses. As Lazer et al. [87] point out, big data offers mountainous possibilities for analyzing temporal dynamics of various phenomena. Some research is whence devoted to streaming analytics directed towards click-stream data with the aid of dedicated tools as SAP Hana, Storm, and S4 [142]. Click-stream data together with web server log files and user information enable to reveal consumer’s behavior as a sequence of events [143]. An example is given in Figure 2.
The user behavior, as depicted in Figure 2, can be understood as a sequence of events, each of which may have a different duration. For example, event 3 is longer than events 1, 2, and 4. The time dimension then allows to order and analyze events. Not surprisingly then, some authors started using temporal formalisms to give form and to reason about consumer behavior. In such formal frames time is the dimension brought to the forefront. A thought-provoking research domain has been presented in [144] named stream reasoning. This notion is defined as a combination of stream processing and reasoning. Stream reasoning requires a real-time processing of events. This kind of research has been presented in [77]. The so-called complex event processing (CEP) is directed at combining big data analytics with real-time processing. The events are processed as triggers or as situation delimiters (i.e., detection of situations via sequences of events). The natural consequence of the need to temporally process events is to use some temporal logics. The most used is event calculus introduced by Kowalski and Sergot [145,146]. Other logics are also in use, such as linear temporal logic (LTL) [96], and thus, the situation calculus may also be considered [147]. This list of temporal formalisms helpful in event/stream processing is of course much wider, but this question is beyond the scope of this paper. Summing up, properly selected temporal logics are very useful in capturing users’ behaviors and behavioral patterns.
A summary of customer insights with big data analytics may be seen in Figure 3.
Although Figure 3 is directed towards the framework of marketing mix, it shows what sources of customer insights can be considered, which methods, and for which applications. The methods are narrowed to data mining ones (cf. Section 4), and no temporal methods are shown. This is because temporal reasoning and temporal big data mining are still an unexplored field of research.
There is a multitude of challenges ahead of extracting value from customer insights. They also find their source in the challenges faced by big data in general, such as security and privacy issues, potential waste of resources, or regulatory and compliance problems [148]. Analytical approaches in big data, such as big data mining (BDM), prove to be helpful, due to the speed of operation and automation of the mining process, but to achieve the success of the enterprise, it is crucial to collate threats, opportunities, and challenges to choose the best development strategy. Chapter 4 outlines the challenges of gaining value from customer insights using BDM, which may be useful from a managerial point of view of the company but also constitute horizons for development for academia.

4. Challenges in Big Data Mining for Customer Insights

Generating insights from big data is a process consisting of two main activities—data management and data analytics. The former encompasses data acquisition, extraction, cleaning, integration, and representation. The latter consists of data modeling, analysis, and interpretation [60]. Data mining techniques are among the most used ones in big data analytics. Hence, it can be assumed that challenges in BDA concern also big data mining, even if not expressed explicitly. In a very general way, the first and foremost challenge of big data analytics is to generate business value [95]. It is also one of the ultimate goals of BDA and big data mining. The other ones are also provision of competitive advantage [5,11], and generation of new business ideas from big data insights [89]. Obviously, the quality of insights results from a proper orchestration of big data-related resources, that is, data, technology, processes, and people within the framework of organization [4]. Human skills and organizational culture are as important as the technological dimensions of BDA in providing valuable results for the success of organization [89,149]. The overall success of big data analytics is therefore dependent on such factors as top management support, organizational change, technical infrastructure, the data science skillset, data availability and quality, data security, and privacy [150]. Conceptually, the overall big data challenges can be summarized as presented in Figure 4.
In the big data lifecycle, the first group of challenges concerns the characteristics of big data itself (the “Vs”) which in turn affect the issues of big data preprocessing, e.g., integration, cleansing, and transformation. At the data processing stage, the typical tasks of analysis, modeling, mining, etc. must be adjusted to properly address the challenges of the first stage. Moreover, at the stage of presenting the results, the graphical methods must be able to cope with visualizing a huge amount of big data analysis results. The big data management stage extends over all other stages and is associated with challenges such as privacy, security, data ownership, and other ethical issues [76,152,153,154,155]. Among the features determining data, information, and insights quality the completeness, accuracy, and currency are mentioned to be the most significant [156]. Especially, the last feature is a challenge when applied to big data analysis and mining. Not only the data comes as a stream or flow (the velocity dimension of big data), but also, it must be analyzed/mined in real-time manner to provide value to organizations. We will cover this temporal challenge later.
With data mining as one of the most important elements of big data analytics, it is not surprising that the DM software is one of the most appreciated tools among various analytical tools used for BDA [157]. However, even the best software will not produce valuable results from garbage data. Hence, among big data mining challenges, the first group includes data inconsistence and incompleteness, scalability, timeliness, and data security. Challenges also concern data capture, storage, searching, sharing, analysis, and visualization [158]. There is a common agreement that before mining the data it is mandatory to consider such issues as validity and reliability of data. The bigger the data quantity is, the bigger the challenge. With the amount of data, discovering dependencies and valuable patterns becomes extremely difficult [87,118]. The next group of challenges is associated with the mining process itself. The algorithms and techniques used for “classic” data mining in, e.g., data warehouses sometimes are not suited to be used with huge amounts of constantly incoming big data. This is so because traditional data mining approaches start with a centralized data repository, able to store and process data. With the prodigious size and variety characterizing big data, such centralized approach may not be used. There is a strong need of more distributed approaches capable of mining huge amounts of unstructured data [159]. Some other challenges include, e.g., lack of large-scale data representation (for mining purposes), lack of effective and efficient online large-scale machine learning techniques, and lack of data confidentiality mechanism [77]. Challenges concern mining algorithms which must deal with sparse, uncertain, incomplete, complex, and dynamic data [92]. Moreover, the constant inflow of data to be mined can be recognized a momentous challenge, as many mining algorithms do not provide proper sequences or patterns [143]. Some of the proposals to overcome this obstacle include, e.g., incremental pattern mining and cluster analysis, when the discovered patterns and clusters are incrementally augmented with updated information [160], post-processing enhancements of mined patterns [138], and special spatio-temporal representations of data for further mining [77]. Therefore, these stages, such as data cleaning, integration, ranking, and querying, are often considered as the sources of “algorithmic bias” [161,162]. Reasoning about them as well as attenuating inequity upstream from the final data analysis phase is potentially more impactful [162].
However, it becomes obvious that for valuable insights from big data mining it is essential to consider temporal-related issues. As Xindong Wu et al. [92] point out, in a dynamic world, data and information representing interesting features from the environment of an enterprise enlargement. Hence, while mining useful patterns from big data, it is indispensable to consider these evolving changes. However, it seems symptomatic that a miniature number of big data analytics definitions even mention the question of dynamics. For example, Mikalef et al. [5] while presenting sample definitions of BDA consider only two ones addressing the dynamic dimension of BDA. A challenge in big data mining hence arises—how to deal with dynamic/temporal aspects of the realm described by big data. One of the ways to do it is to implement agile big data analytics. BDA is seen as a ‘bridging’ instrument in development of software applications using agile methods [79]. Agility is achieved by creating a data infrastructure enabling identification and evaluation of various big data sources [11]. Afterwards, there are approaches focused on big data stream processing enabling a flexible mining solution [159]. However, these solutions are insufficient when it comes to real-time data processing [117]. The real-time big data analytics presents another challenge related to big data mining which must be considered [76]. Many of the phenomena of interest to the organization are represented as time series [163], this applies to, e.g., sentiment analysis or user’s website activities. However, many other phenomena are too intricate to be represented this way. Knowledge coming from organization’s environment evolves very quickly because of a constant inflow of data and information. The big data mining in real time may ameliorate decision-making processes in organizations because it would enable dealing with real-time uncertainties [88,120]. The time dimension of big data is reflected in the speed of their inflow. This causes big data to be transient which implies the need to mine them as and when they are generated [139]. The timeliness of data analysis and mining is the succeeding challenge, tightly linked with the challenge of dealing with temporal dimension of big data. This timeliness challenge is discussed in [158] in more detail.
The most intuitive way to deal with temporal aspects of big data mining is to treat the data inflow as a set of events. This is quite natural because events are the building blocks of surroundings of organizations; hence, they need to be represented and mined during big data analytics. The big data mining process should be therefore focused on events implied from the massive volume of data. It is thus clear that big data mining is closely related to events [164]. The consecutive big data mining challenges may be formulated as the challenge of event capturing and representation for further analytics, the challenge of constructing temporal big data mining algorithms, and the challenge of representing temporal features of the mined knowledge. The events and temporal information in big data should be identified; the temporal relations among events should be found and represented; event-based information retrieval and analytics should be done. Zhang et al. [77] proposed a big data temporal analytics solution but only for texts, while leaving apart many other forms of data leading to the big data variety feature.
Another approach to temporal big data has been proposed in the work of Singh et al. [160] where the frequent patterns mining and cluster analysis model are used on constantly incoming data. The model encompasses a progressive and incremental update of mined patterns and clusters with new information, and newly discovered patterns and clusters are incrementally added to the existing ones. However, events are not addressed in this approach, and there is lack of temporal representation. In fact, the model is concentrated on time series instead of event sequences. An answer to the challenge of temporal BD mining has been proposed in [77,144]. Both approaches consider Complex Event Processing (CEP) systems as a solution. CEP systems are particularly useful for real-time analytics and stream reasoning. These solutions differ in time representation. Some of them are based on point structures, while others are based on intervals (cf. [6]). The CEP systems also differ in their complexity and in orientation: computation-oriented vs. detection-oriented ones [77]. A variation of event processing systems has been proposed in [159], namely, Semantic Complex Event Processing augmented with an agent that dynamically builds an ontology which can then be queried temporally. However, even the mining systems based on event processing are yet not capable of mining causality relations [143] which would contain a lot of useful information on complex phenomena in organization’s environment.
Another group of approaches to analyzing streaming and/or temporal big data is built upon the so-called ontology-based data access (OBDA). OBDA origins from the Semantic Web analytics, and its core feature lies in separating conceptual and database levels of data [94]. Unfortunately, OBDA itself does not adapt to changes in data sources. The W3C standardized an ontology and a query language for the ODBA: OWL2QL and SPARQL [165], but these solutions do not handle essentially temporal big data. Incorporating complex temporal information into OBDA together with the ability to process heterogeneous data poses a serious challenge [166]. A temporal OBDA is then requisite. There are various ways to the development of such a temporal version of OBDA:
  • Extending OWL2QL with various temporal operators [167];
  • Extending both OWL2QL and SPARQL with the LTL (linear temporal logic) temporal operators [168,169];
  • Extending OWL2QL and SPARQL with the MTL (metric temporal logic) temporal operators [165];
  • Extending OWL2QL and SPARQL with the interval logic by Halpern and Shoham [170];
  • Developing fully temporal OBDA [170].
The advantage of all the above solutions lies in the direct incorporation of time dimension into analytics. On the other hand, the main disadvantage and weakness in the context of big data mining concern the nature of data and analytics. All the above solutions are directed towards relational/structured data and queries and do not deal with any data mining tasks. Hence, they cannot be considered satisfactory for temporal big data mining. The challenge which then is seen concerns augmenting the existing big data mining models, methods, and algorithms with explicit temporal expressions and with ways to handle them to mine temporal big data.
Summing up, our study identifies several challenges for big data mining, especially in the context of customer insights. These are:
  • Completeness, accuracy, and currency of discovered insights/patterns,
  • Quality of data to be mined,
  • Issues concerning big data storing/processing,
  • Modification of mining algorithms and techniques to deal with abundant, heterogeneous, and streaming data,
  • Dealing with evolving changes,
  • Dealing with dynamics/velocity of big data,
  • Flexibility of mining algorithms and techniques,
  • Representing and processing big data as events and event sequences.
All these challenges constitute important and promising research areas, but as shown, the most important and challenging issue concerns incorporating explicit time notion into representation and mining procedures of big data. There is a strong need to express temporal dimension of big data and in big data itself, using more complex temporal representations than event calculus. There is a need to represent causality of phenomena, of discovering changes in phenomena depicted by big data, and of mining useful temporal patterns to get deep and profound insights on the way the world around organizations evolves.
We have focused on the challenges associated with big data mining which is a specific subarea of BDA. Obviously, the broader BDA field also faces several challenges. These are primarily challenges with big data’s volume characteristics. The large sample size may result in several biases as, e.g., sampling error, measurement error, aggregation error, etc. [171]. Especially the sampling error may result in highly biased data. Researchers have shown examples of such biased data collected from social networks. While gathering this data, it may be erroneously assumed that social media users are representative of the population [172] while there are many social groups excluded from using the SM, e.g., people digitally excluded—due to age, education, low socioeconomic status may not be represented in the retrieved big data sample [172,173,174]. A noticeable bias in big data may also result from gender and race issues [175,176,177]. All these challenges should be kept in mind while addressing the question of big data analytics; however, they are beyond the scope of this paper.

5. Verification of Research Findings

To verify the identified challenges and gaps concerning big data mining for customers insights, the Scopus database has been consulted. Three key phrases resulting from the challenges identified in Section 5 have been searched: (1) “big data mining”, (2) “temporal big data”, and (3) “temporal big data mining”. In all the three cases, Scopus has been queried within article titles, abstracts, and keywords. The searches have not been restricted in any way. The search activities took place on 10th May 2021. Moreover, in order toto extend the scope of the study, the broader term “big data analytics” (parent to the aforementioned challenges) has been also analyzed. The analysis took place on 16–17 July 2021. In conjunction with the fact that the “big data analysis” notion overrides “big data mining”, the Scopus inspection of “big data analysis” term in this paper is presented prior to the remaining phrases. The summary data that was generated by the Scopus database and used for further analysis can be found in the Supplementary File, which is described in the Appendix A.

5.1. “Big Data Analytics” Phrase in Literature

Since the phrase “big data analytics” is the broadest concept (and includes derivative scientific areas such as “big data mining”, etc.), its analysis in Scopus databases is the first. The very first scientific paper concerning this term appeared in this indexing portal in 2010. Then, in simplification, every year the number of articles dealing with the “big data analytics” topic rocketed. The query returned 8373 documents, of which 2232 are open access. The visualized results of the study are presented in Figure 5, Figure 6 and Figure 7, respectively.
Due to the huge number of articles dealing with this scientific sphere, it can be concluded that scientists and researchers are very interested in conducting research on or with the use of big data analytics. It should be noted that the decrease in the number of articles in 2021 results from the period of the study (the authors do not have complete data for 2021), while the slight reduction in the number of papers in 2020 may be the result of the prevailing COVID-19 pandemic, where science accessibility in many regions of the world was lower than ever before.
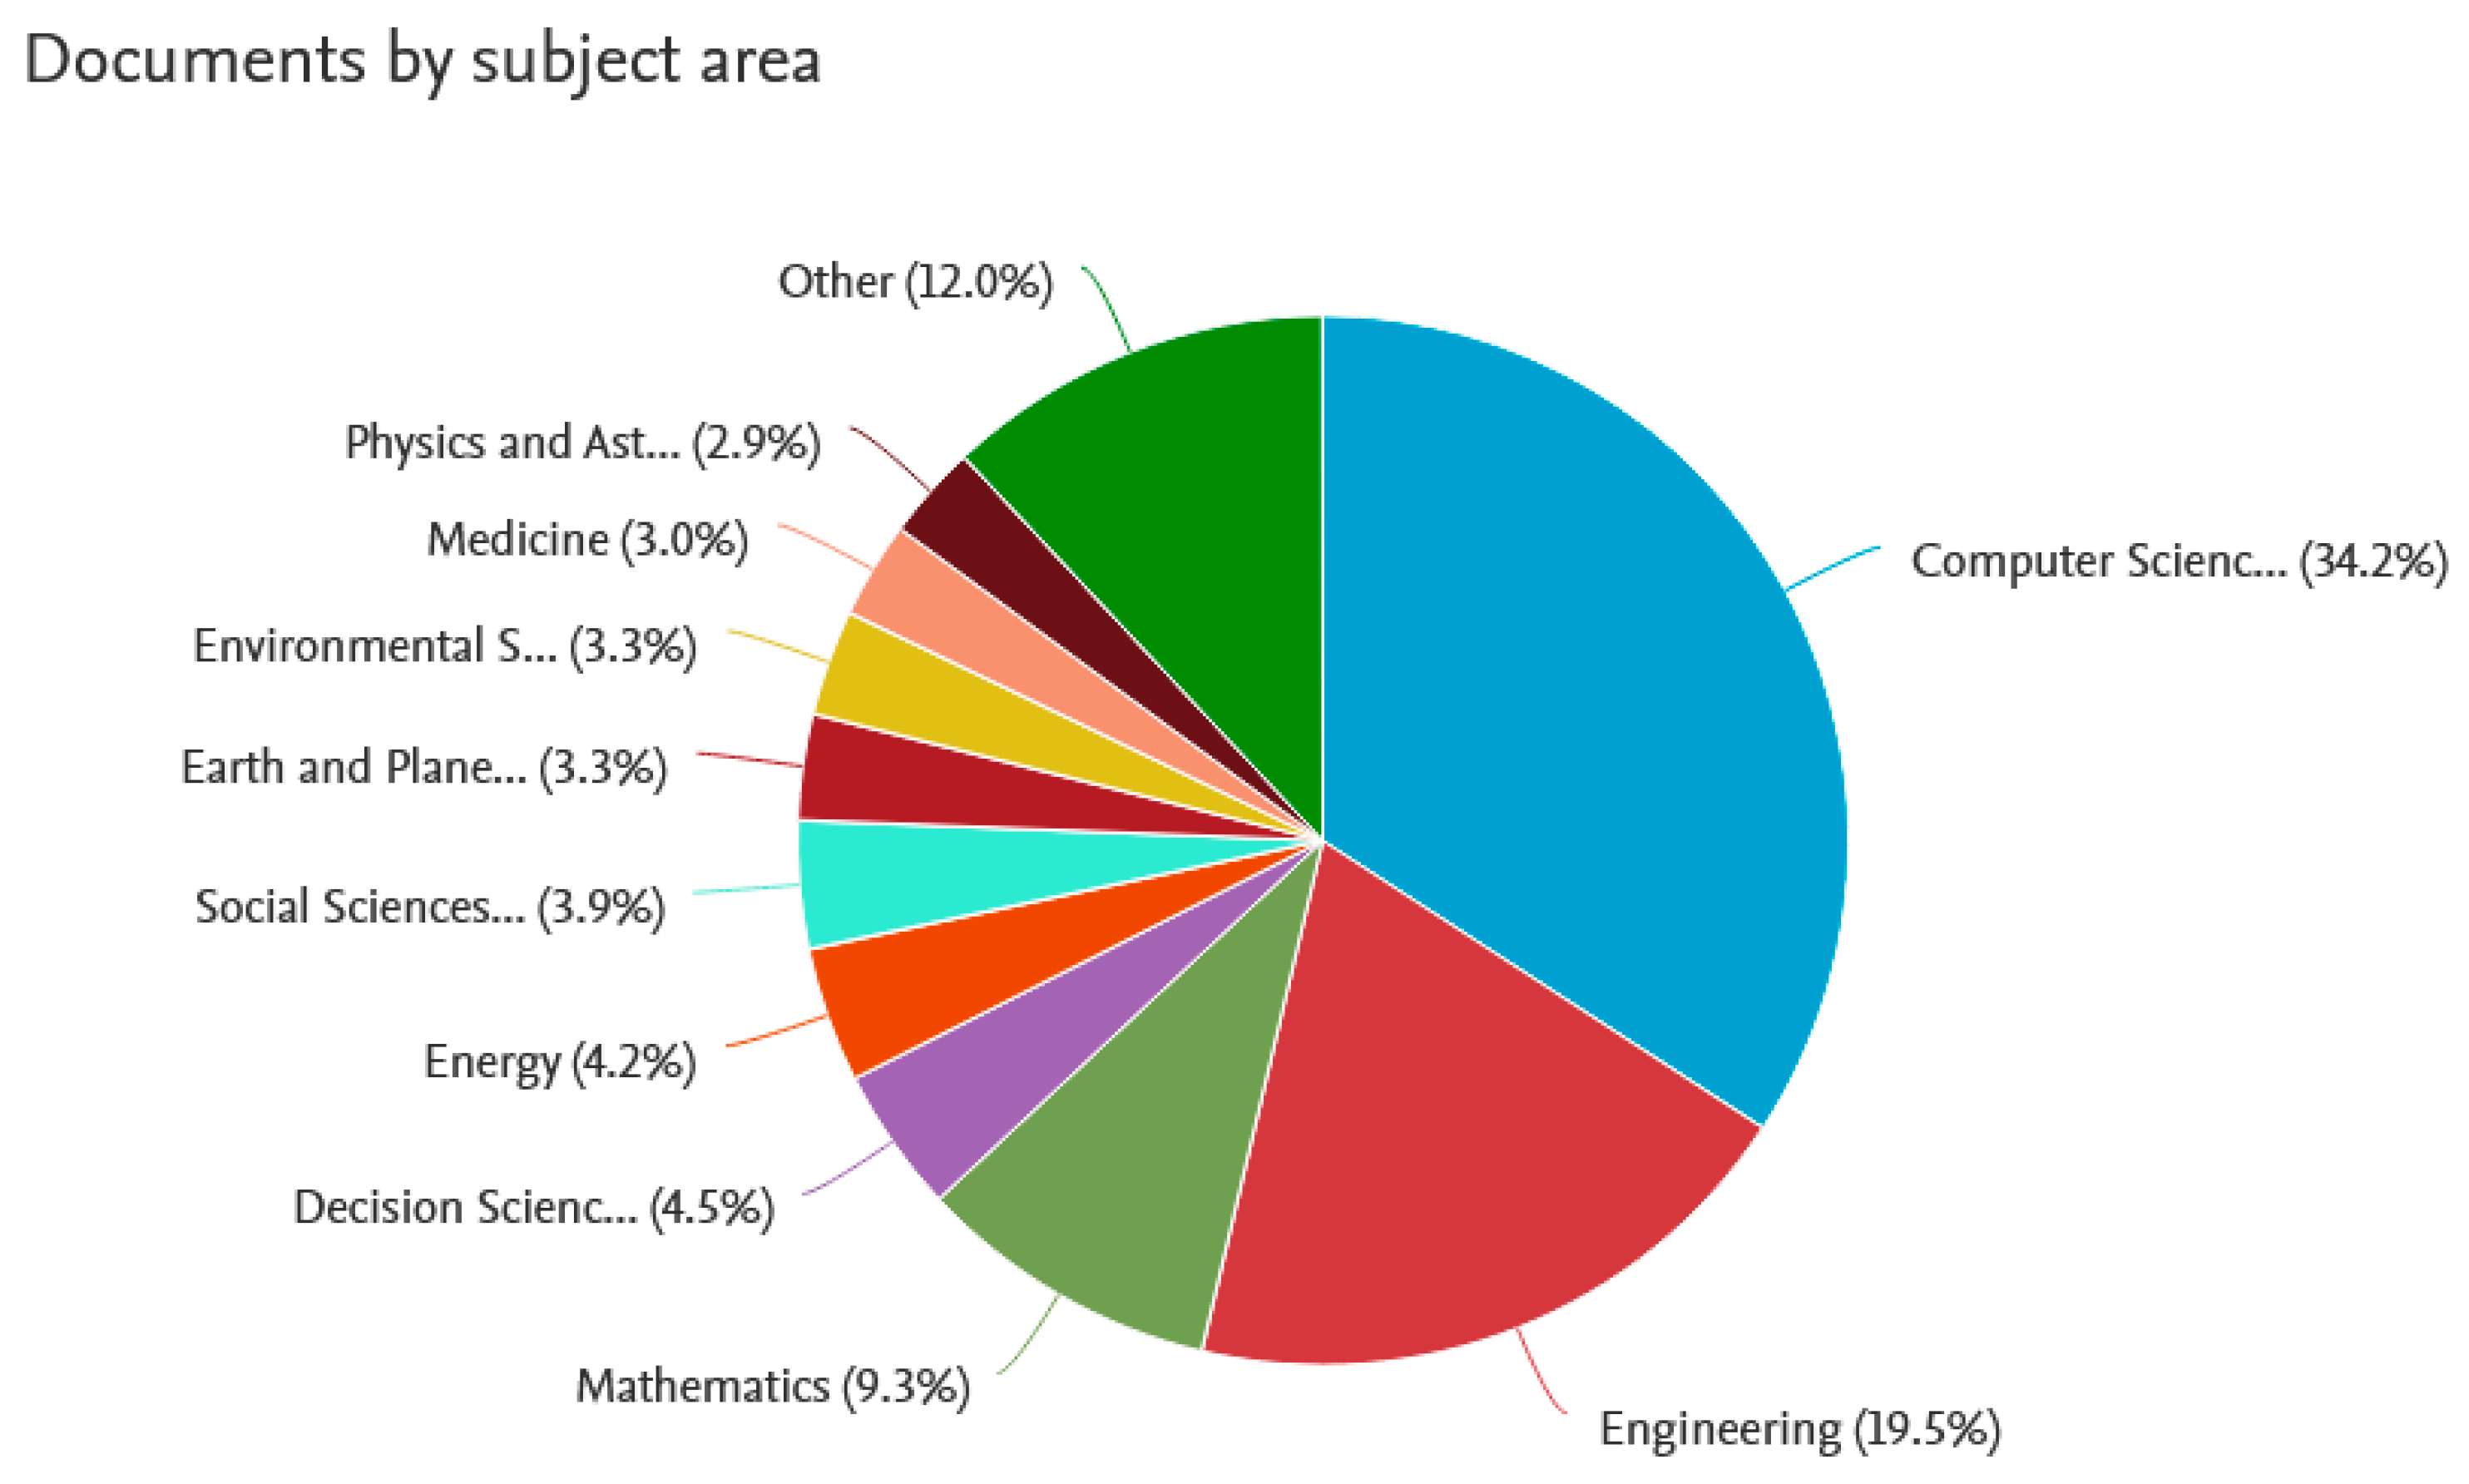
There is no doubt that computer science (25.6%) is, without surprise, the domain in which the field of big data analytics is most often used and explored. Together with engineering (17.9%), it accounts for more than half (53.5%) of all BDA-related scientific works. It should be noted, however, that mathematics (7.5%), decision sciences (7.3%), and business and management (7.0%) are equally important subject areas in investigating and the use of BDA. It can therefore be concluded that the concept of “big data analytics” is multidisciplinary, and hence, it states as foremost implications for academia and business.
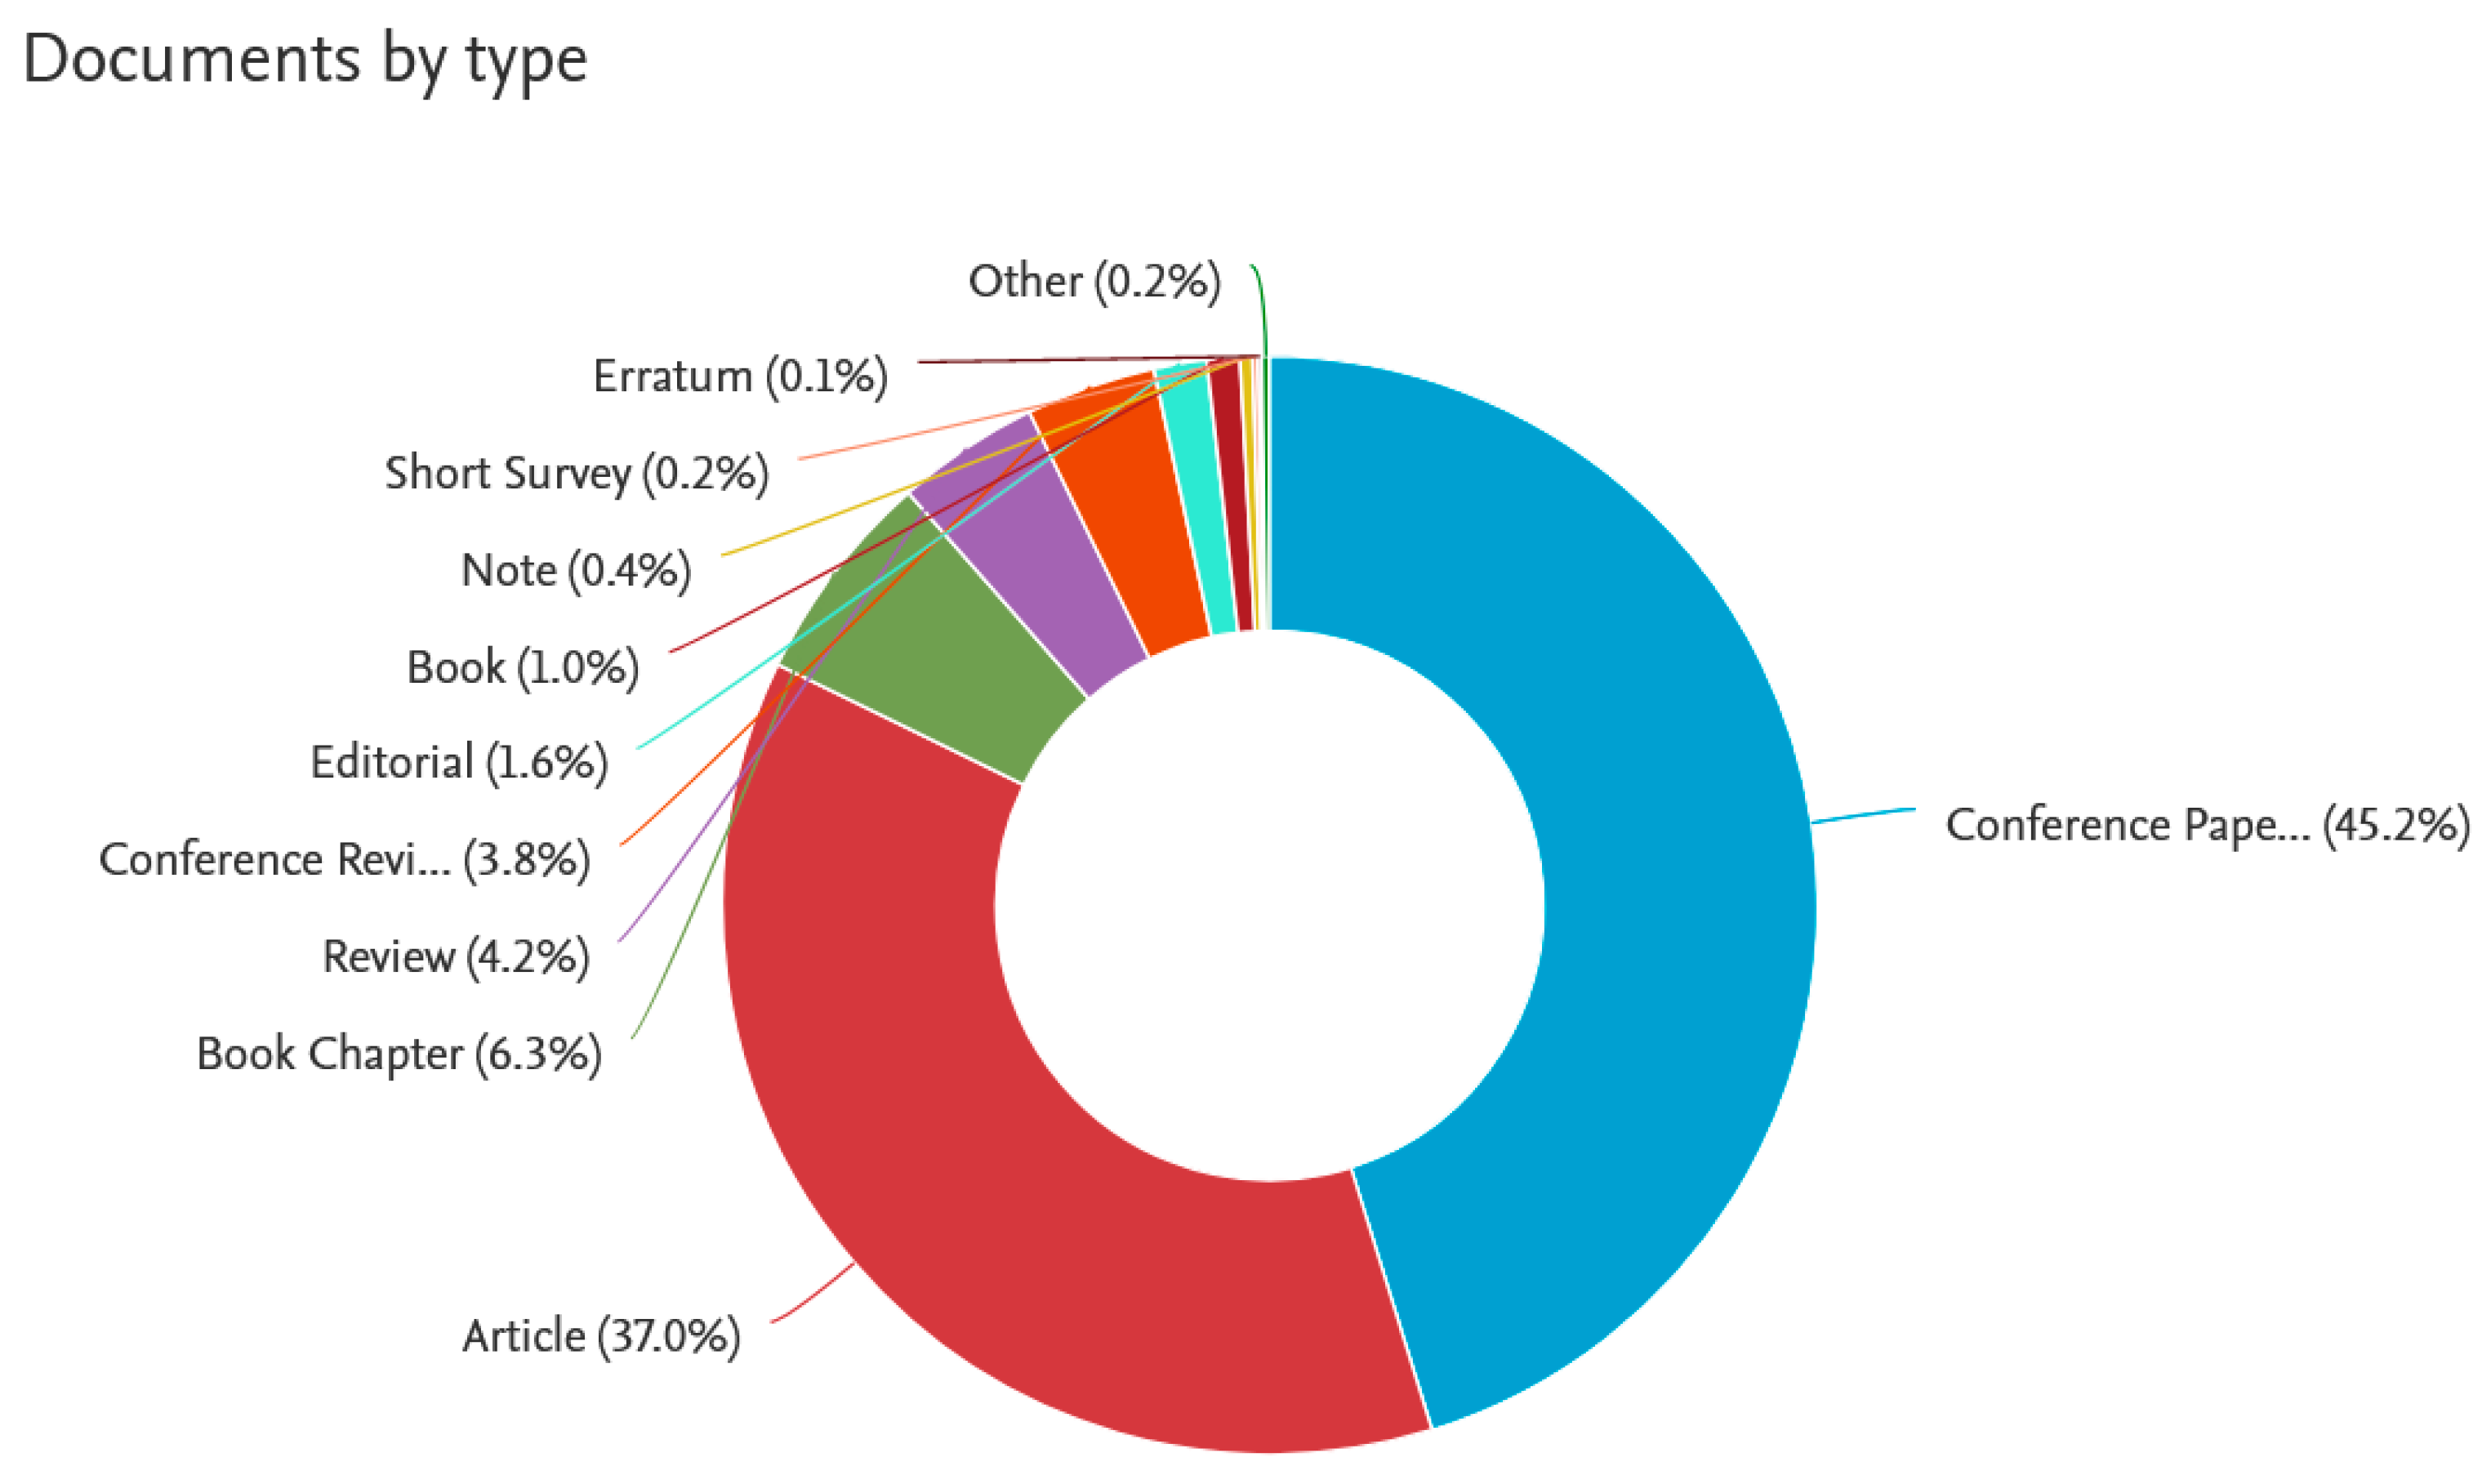
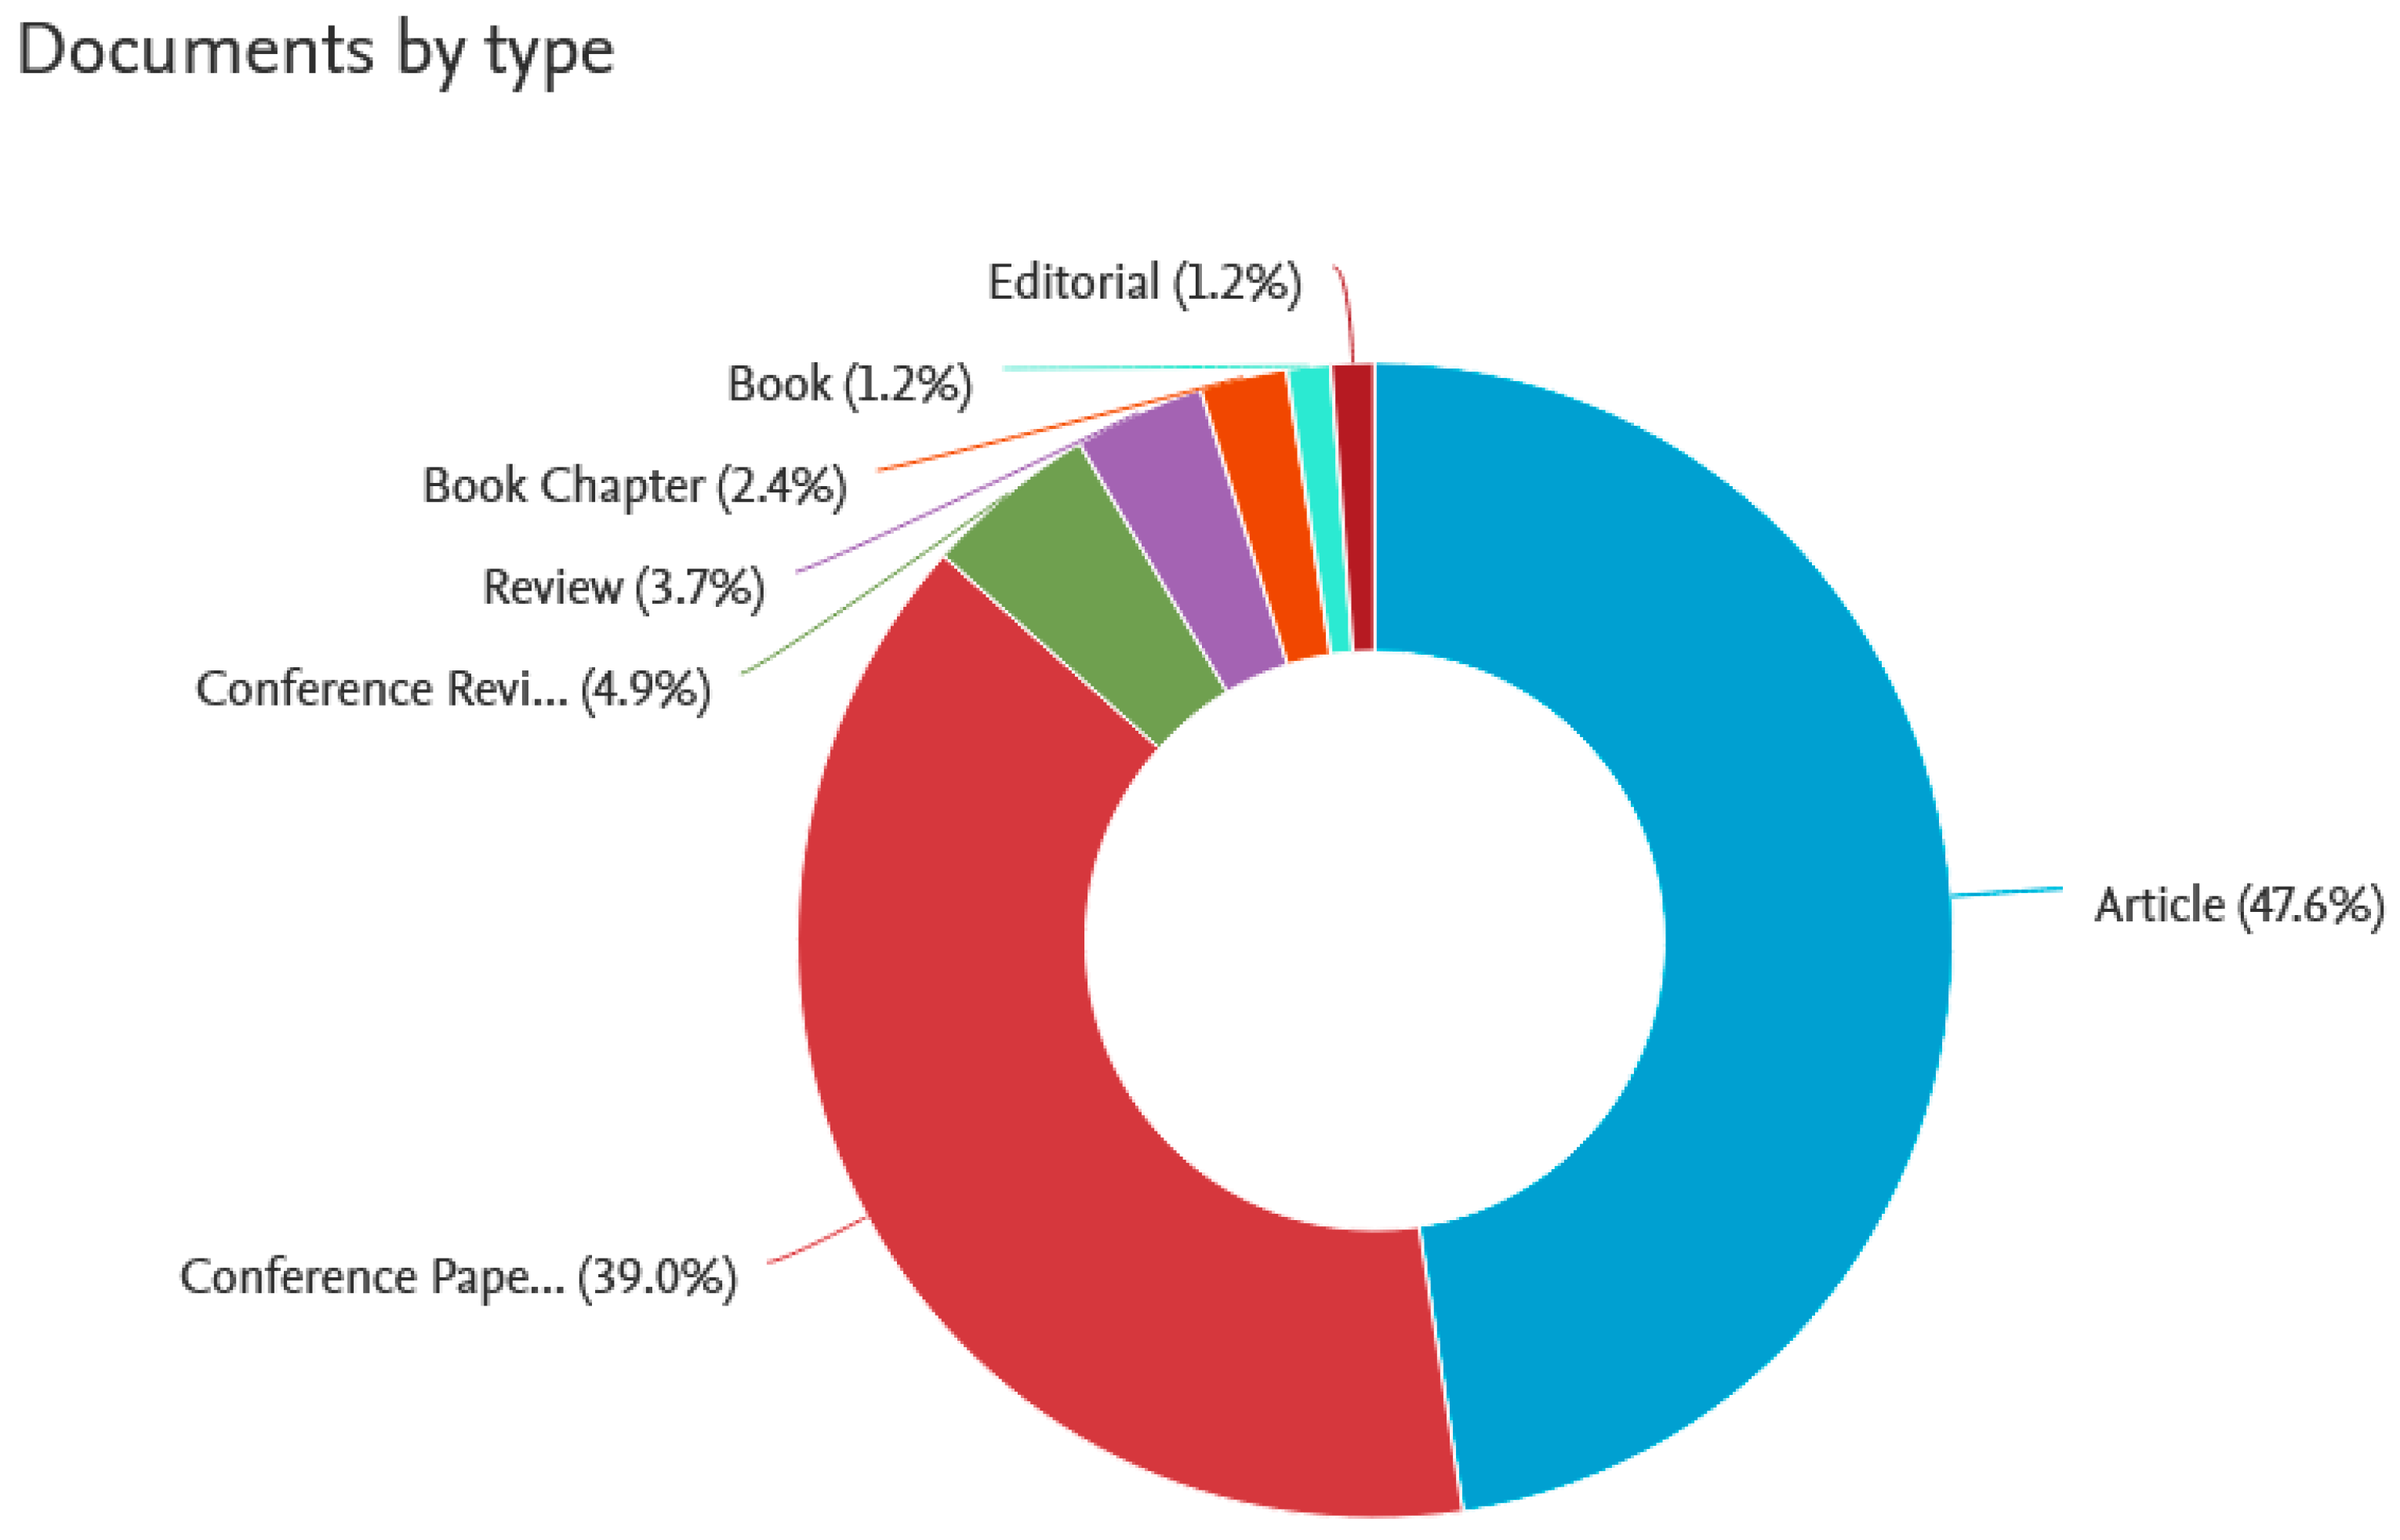
The overwhelming majority of publications including the notation “big data analytics” (82.2%) are conference publications and scientific articles. Chapters in scientific monographs, reviews, and other types of scientific documents are of a much less importance.

5.2. “Big Data Mining” Phrase in Literature

Moving on to the more specific sphere, the query “big data mining” throughout the Scopus database returned 943 documents, among which 230 open-access ones (i.e., gold, hybrid gold, bronze, and green open-access options), while 713—other types of access. The year range detected was 2012–2021. Hence, the research question of big data mining may be already treated as mature one, attracting a widely spread attention of scholars. The returned documents have been then analyzed using three criteria: year of publication, subject area, and document type. The visualizations of findings are presented in Figure 8, Figure 9 and Figure 10, respectively.
Obviously, the issue of big data mining is gaining more and more interest among scholars. The research area of data mining is generally well explored, but when it comes to mine big data, there are still many questions to ask and to answer. The surge in the number of documents in 2021 (concerning the issue of “big data mining”) occurs due to the survey being conducted in the middle of the year. This means that standardization must be done to be able to refer to the whole year. For this purpose, the trend analysis presented in the Section 5.5 is used.
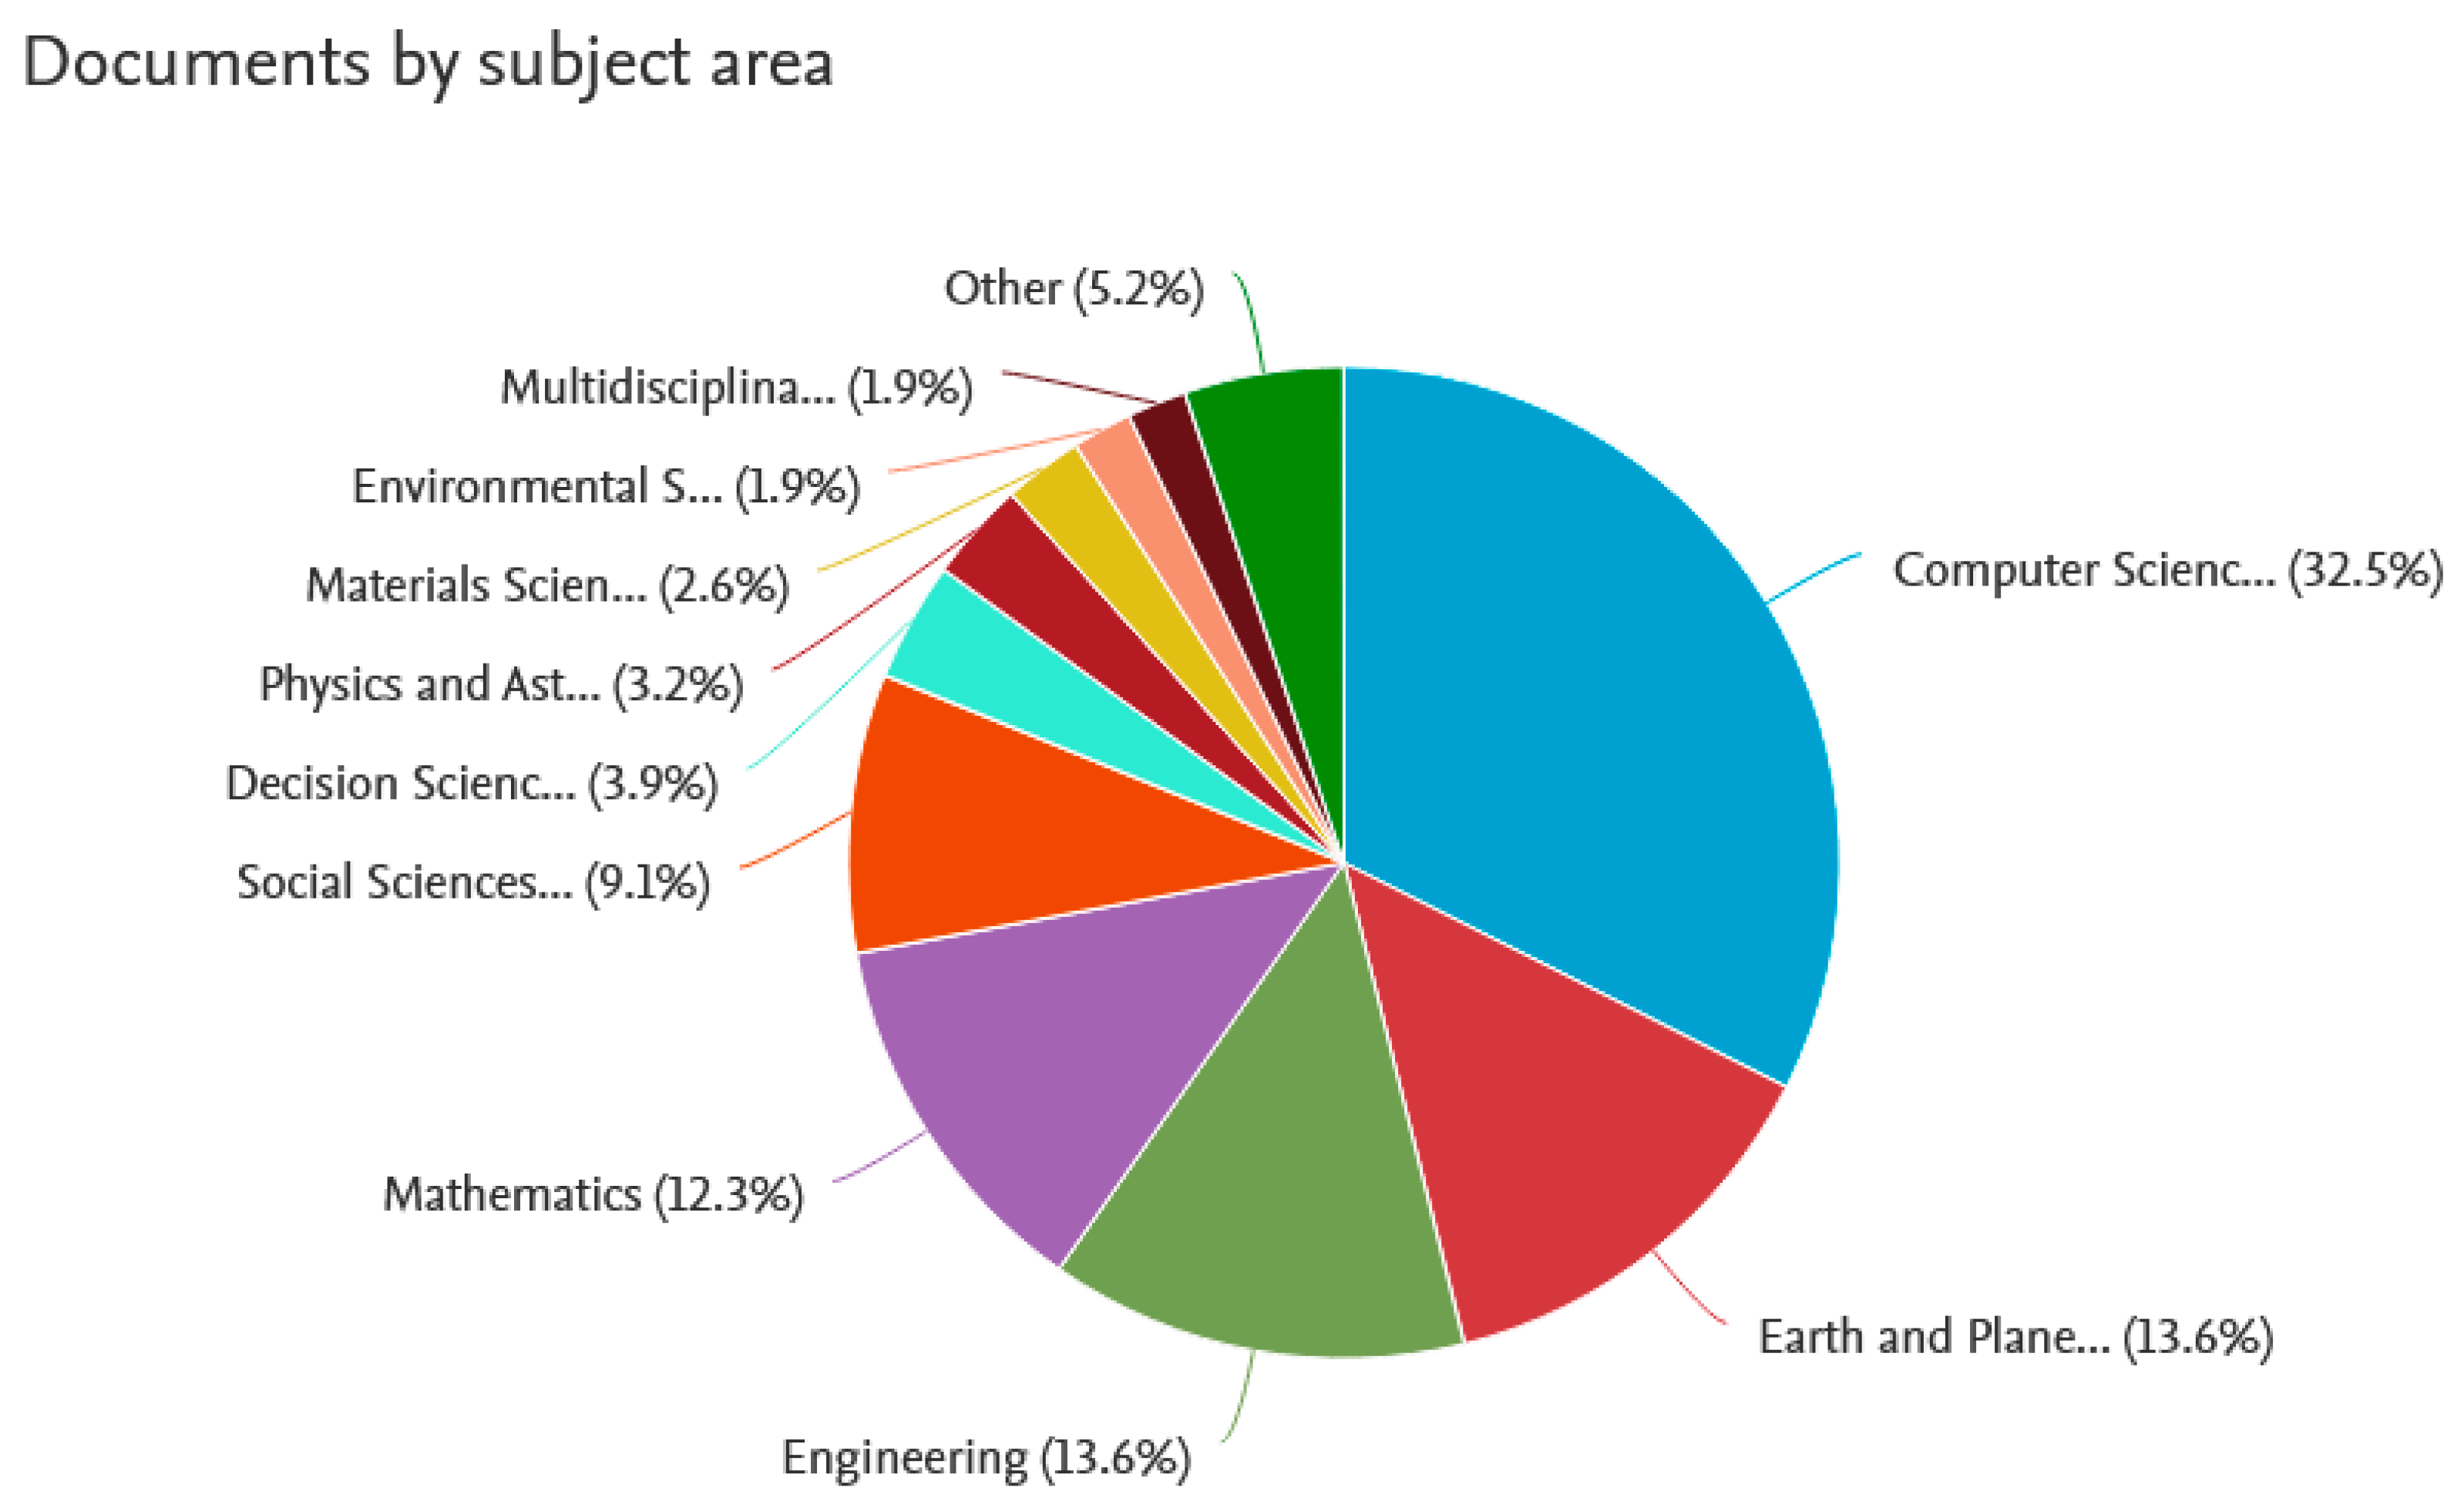
Not surprisingly, big data mining issue is explored mainly within the areas of computer science and engineering. At the same time, it seems underestimated within business and management (2.6%—not visible on the chart), as well as social sciences (3.9%). This may suggest that there may be a possibility of new research concerning big data mining for the use in business, in management, etc.—e.g., for customer insights. The more to do, the more data is available. Although certain research disciplines prevail, big data mining can be considered an interdisciplinary field (or at least one that can be applied in many different industries).
Finally, as a relatively new research topic, big data mining is mostly addressed in journal articles and conference papers.

5.3. “Temporal Big Data” Phrase in Literature

The next query “temporal big data” returned merely 82 documents among which 22 open-access ones and 60 paid-access ones. This query returned the year range of 2014–2021; hence, the notion and research question of temporal big data may be considered slightly “younger” than big data mining and of much smaller popularity among researchers. Moreover, for this query, the returned set of documents has been analyzed by year, by subject area, and by type, and the results are given in Figure 11, Figure 12 and Figure 13, respectively.
In the case of the phrase “temporal big data”, the surge of documents in 2021 results from the same reason as in the case of the “big data mining” analysis, i.e., partial information for the current year in the case of a survey conducted in the middle of 2021. What can be in our opinion inferred from the above chart is that the temporal big data area is just gaining popularity and is attracting attention as a research topic. The year 2020 admittedly saw a slight decrease in the number of articles (like in the previous queries), but it could have been caused by the COVID-19 pandemic situation, which forcefully hindered conducting scientific research.
As it has been observed for the “big data mining” key phrase, also the “temporal big data” is mostly explored within the areas of computer science, engineering, as well as earth and planet sciences, but it is also present in mathematics. Social sciences are also notably represented. For earth and society, temporal data are natural because they reflect the dynamism of the domain. However, in business and management the temporal aspects of phenomena also should be considered. The business environment is perceived as dynamic, and changes should be analyzed. Even though the sphere of business and management is not included in the chart (it is hidden under the “other” layer), it does not mean that there is no interest in the temporal aspects of big data in this sphere. This can only testify to the dynamics of this environment and its significant unexplored area, which may be a starting point for researchers willing to define the research gap.
As “big data mining”, also “temporal big data” reveals to be a new and unexplored research area. This is reflected not only in the relatively small number of publications addressing this topic but also in the structure of the documents retrieved from Scopus—these are mostly journal articles and conference papers (86.6% together). This result, together with our investigations presented in this study, shows the future potential of solutions aimed at capturing and processing temporal big data.

5.4. “Temporal Big Data Mining” in Literature

The last query concerned the “temporal big data mining” key phrase as a sum of the two previous key phrases. This query returned merely two documents (specifically: scientific articles) from the Scopus database. The first of them is dated 2016, with subject area named “multidisciplinary” and, more precisely, geological sciences. The latter comes from 2021, and on the day the analysis was conducted, it was in the press. This article can also be described as “multidisciplinary”, because according to Scopus, it combines three subject areas: engineering, computer science, and mathematics. The issue of temporal big data mining is a new research topic, and within the area of business, it seems completely unexplored. This result is in line with the findings presented in this study. The research topic of temporal big data mining is challenging, and within business, management, and decision sciences, there is a vast area for future investigations.

5.5. Trends Analysis

Considering the time series regarding the number of scientific documents in given years, for all three phrases: “big data analytics”, “big data mining”, and “temporal big data”, a clear upward trend is noticeable, which proves that researchers are becoming increasingly interested in these topics over time. Performing a trend analysis in the case of the phrase “temporal big data mining” is not possible, due to the presence of only 2 articles in the Scopus database corresponding to this phrase (for the abstract, keywords and title). With the help of only two references (i.e., a time series consisting of two observations), it is pointless and impossible to create a trendline and thus analyze it.
It was decided that the trend analysis methodologies (predictions) will be used to analyze these time series, with prior examination of the fit of the data in the model using the coefficient of determination R2. This coefficient takes the values 0 ; 1 the larger its value, the higher the match of the dataset. It is expressed by the following formula, as presented in [178]:
R 2 = t = 1 n ( y ^ t y ¯ ) 2 t = 1 n ( y t y ¯ ) 2
where
  • y t is t th observation of y variable;
  • y ^ t is theoretical value of the dependent variable (based on the model);
  • y ¯ is arithmetic mean of empirical values of the dependent variable.
For comparison purposes, the following trends were chosen: linear, second-order polynomial, logarithmic, exponential, and power. The formula for polynomial models (i.e., linear and second-order polynomial) is generalized as follows:
Y t = c + i = 1 n α i t i + ε t
where i = 1 goes for linear and i = 2 goes for second-order polynomial trend.
The exponential trend formula is as follows:
Y t = α 0 α 1 t e ε t
The power trend formula is as follows:
Y t = α 0 t α 1 e ε t .
The logarithmic trend formula is as follows:
Y t = α 0 + α 1 ln ( t ) + ε t .
For further and deepened discussion for linear/polynomial trends, see [179,180], and for logarithmic, exponential, and power trends, see [181,182]. The study compares the models estimated using the ordinary least squares (OLS) methodology [183,184], which is broadly used in scientific research [185,186,187,188].
For each dataset, individual regressions (characterized by exponential, linear, logarithmic, second-order polynomial, and power trendlines) were compared with respect to the matching (fitting) degree of the dataset, using the R2 coefficient. The trendlines with the highest R2 coefficient were selected for further processing.
The trendlines in various regression models were expressed by trend function equations, in tabular comparison with the values of the determination coefficients. To calculate the values of R2 coefficients, as well as the function of the particular trendlines, and to visualize the results in the form of charts, Microsoft Excel 2019 software was used.
Using regression and trend analysis to predict future values for a given phenomenon can bring enormous value, among others for determining the directions and forms of development of accompanying phenomena. It may turn out to be useful in the scientific or business spheres, depending on the subject of research. Thanks to researching trends, it is simpler to gather knowledge about threats and challenges but also about opportunities faced, for example, by a company, industry, country, region, etc.
The usefulness of the trend analysis is confirmed in scientific research from various fields. For example, there is a study that used trend analysis to analyze the phenomena of road accidents and to eliminate them [189]. Prediction of future values with the use of trend analyzes also turns out to be useful in temperature and climatological studies [190,191,192]. Furthermore, trend analysis approach is widely used to investigate and prevent the COVID-19 spread [193,194,195].

5.5.1. Trends for “Big Data Analytics” Phrase

The occurrence of an upward trend is confirmed in analyzes of time series trends. The trendlines for the phrase “big data analytics” (for each line type) was always accompanied by R2 values exceeding 0.75, which proves that the data was highly matched. This shows a clearly defined trend that is plainly visible and statistically significant. Table 1 juxtaposes the coefficients of determination R2 along with the equations of the trend function for the “big data analytics” phrase.
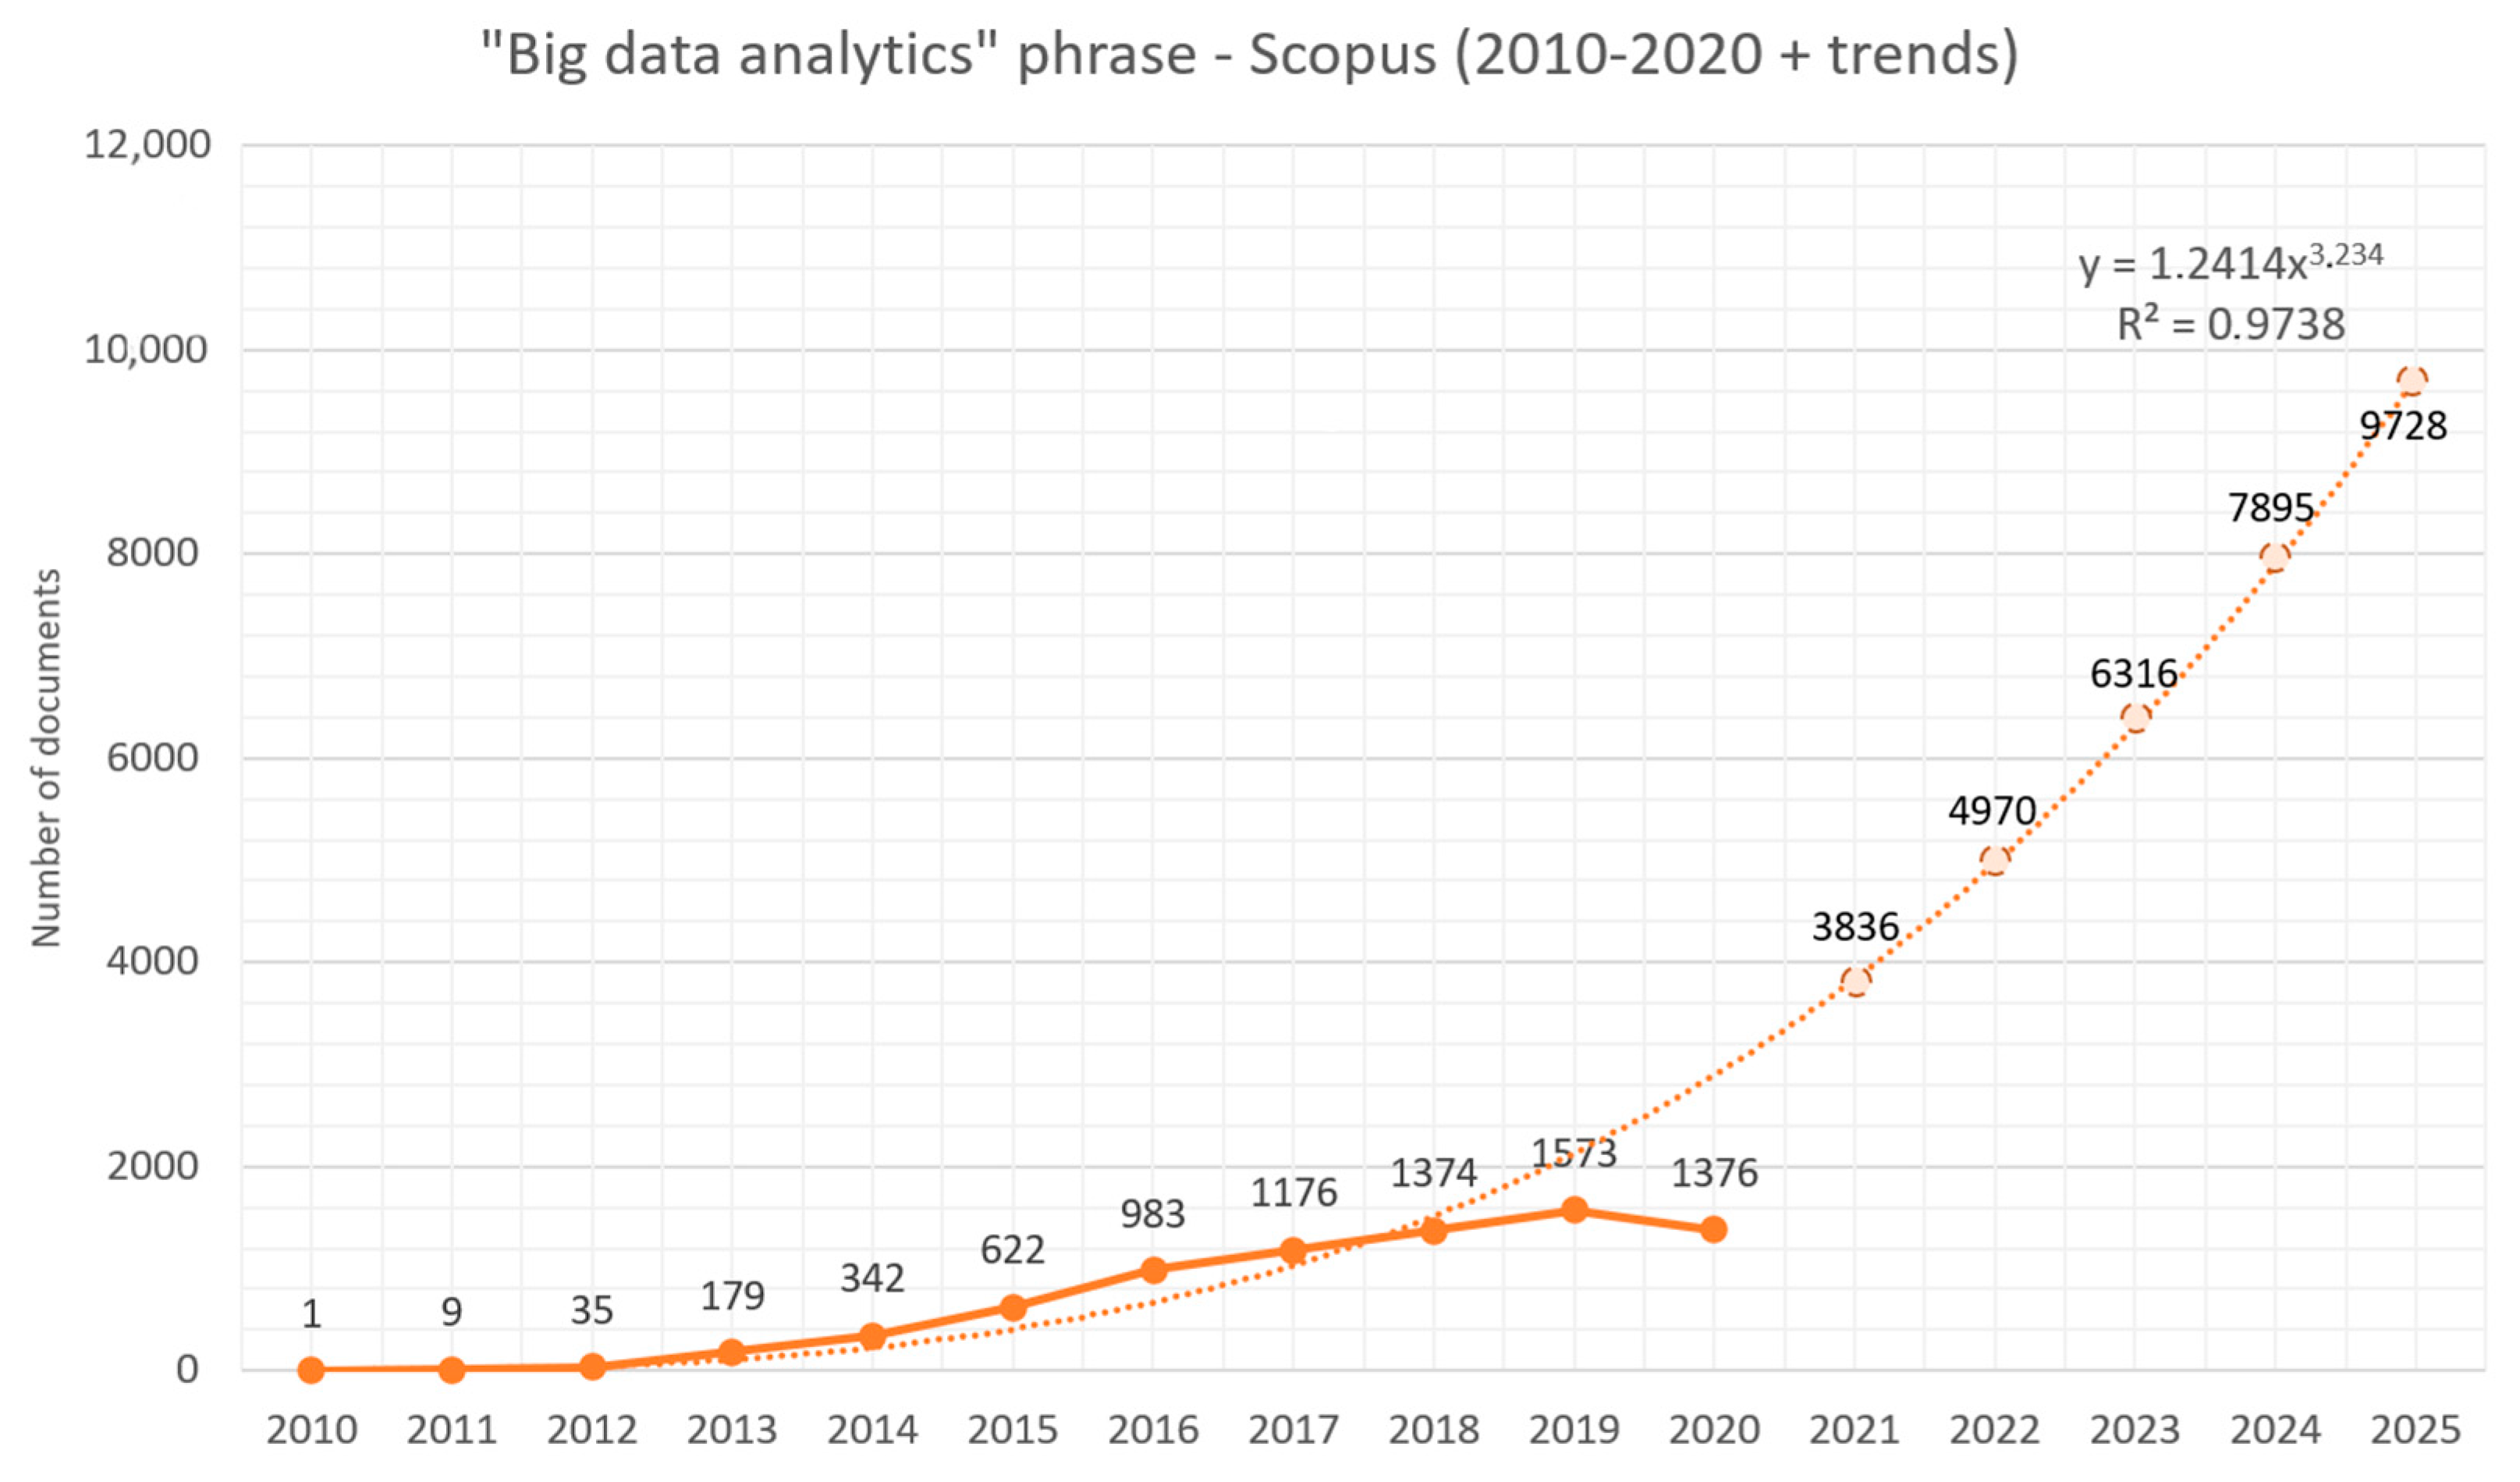
The trend function, which is a power function, finds the highest fit because its coefficient of determination R2 is the highest among the other types of functions. It is close to 1 (exactly 0.9738), which proves an extremely high data fit. From the definition of the power function (more precisely from the value of the exponent that is higher than 1 and a high positive scalar value), it follows that the growth dynamics increases with each period. This translates into the fact that the trend of choosing “big data analytics” as a topic of scientific work is constantly getting more popular. Moreover, it proves that the number of papers is growing at an increasing pace every year.
With the available data set from Scopus database, it is possible to predict the number of documents for subsequent years (periods) using the trend function. In this case, the function with the greatest fit (i.e., having the highest R2) was used to estimate the values for subsequent periods. All periods were included in the predictions, but the year 2021 was excluded, due to its incompleteness. Standardization for this period is carried out by predicting the value from the used trend function. Table 2 shows the prediction values for five consecutive periods after 2020, i.e., from 2021 to 2025. Figure 14 shows the power trend function plotted on a time series of scientific documents for the phrase “big data analytics” from the Scopus database with respect to the year, along with the plotted prediction values for subsequent periods. As the document cannot have decimals, it is assumed that the prediction values are the absolute value of the calculated trend values for the successive periods.

5.5.2. Trends for “Big Data Mining” Phrase

For the phrase “big data mining”, the coefficient of determination R2 is always greater than 0.8 (regardless of the type of trend function), which proves a very good fit of the data, similar to trends for the broader concept of “big data analytics”. The coefficients of determination R2 along with the equations of the trend function for the “big data mining” phrase are presented in Table 3.
As in the case of “big data analytics”, also here, the trend line with the highest coefficient of determination is the one expressed by the power function (R2 = 0.9806). It should be noted, however, that since “big data mining” is a narrower concept than the BDA, the number of observations (scientific articles dealing with this topic) is noticeably smaller. Nevertheless, this does not change the fact that BDM seems to be a topic desired by scientists and researchers, and the interest grows over time. Moreover, here, the value for 5 consecutive periods was predicted based on the trend with the highest coefficient of determination, analogous to the phrase “big data analytics”, as seen in the Table 4. It also depicts the number of scientific documents for the 2012–2020 period (value for 2021 was also standardized). The forecasted values are treated as the absolute value from the value of the trend function, to maintain the integer value. The power trendline plotted on a time series of scientific documents from the Scopus database is depicted in Figure 15, respectively. It conjuncts with the expression “temporal big data” with regard to the year, as well as the with projected forecast values for subsequent periods.

5.5.3. Trends for “Temporal Big Data” Phrase

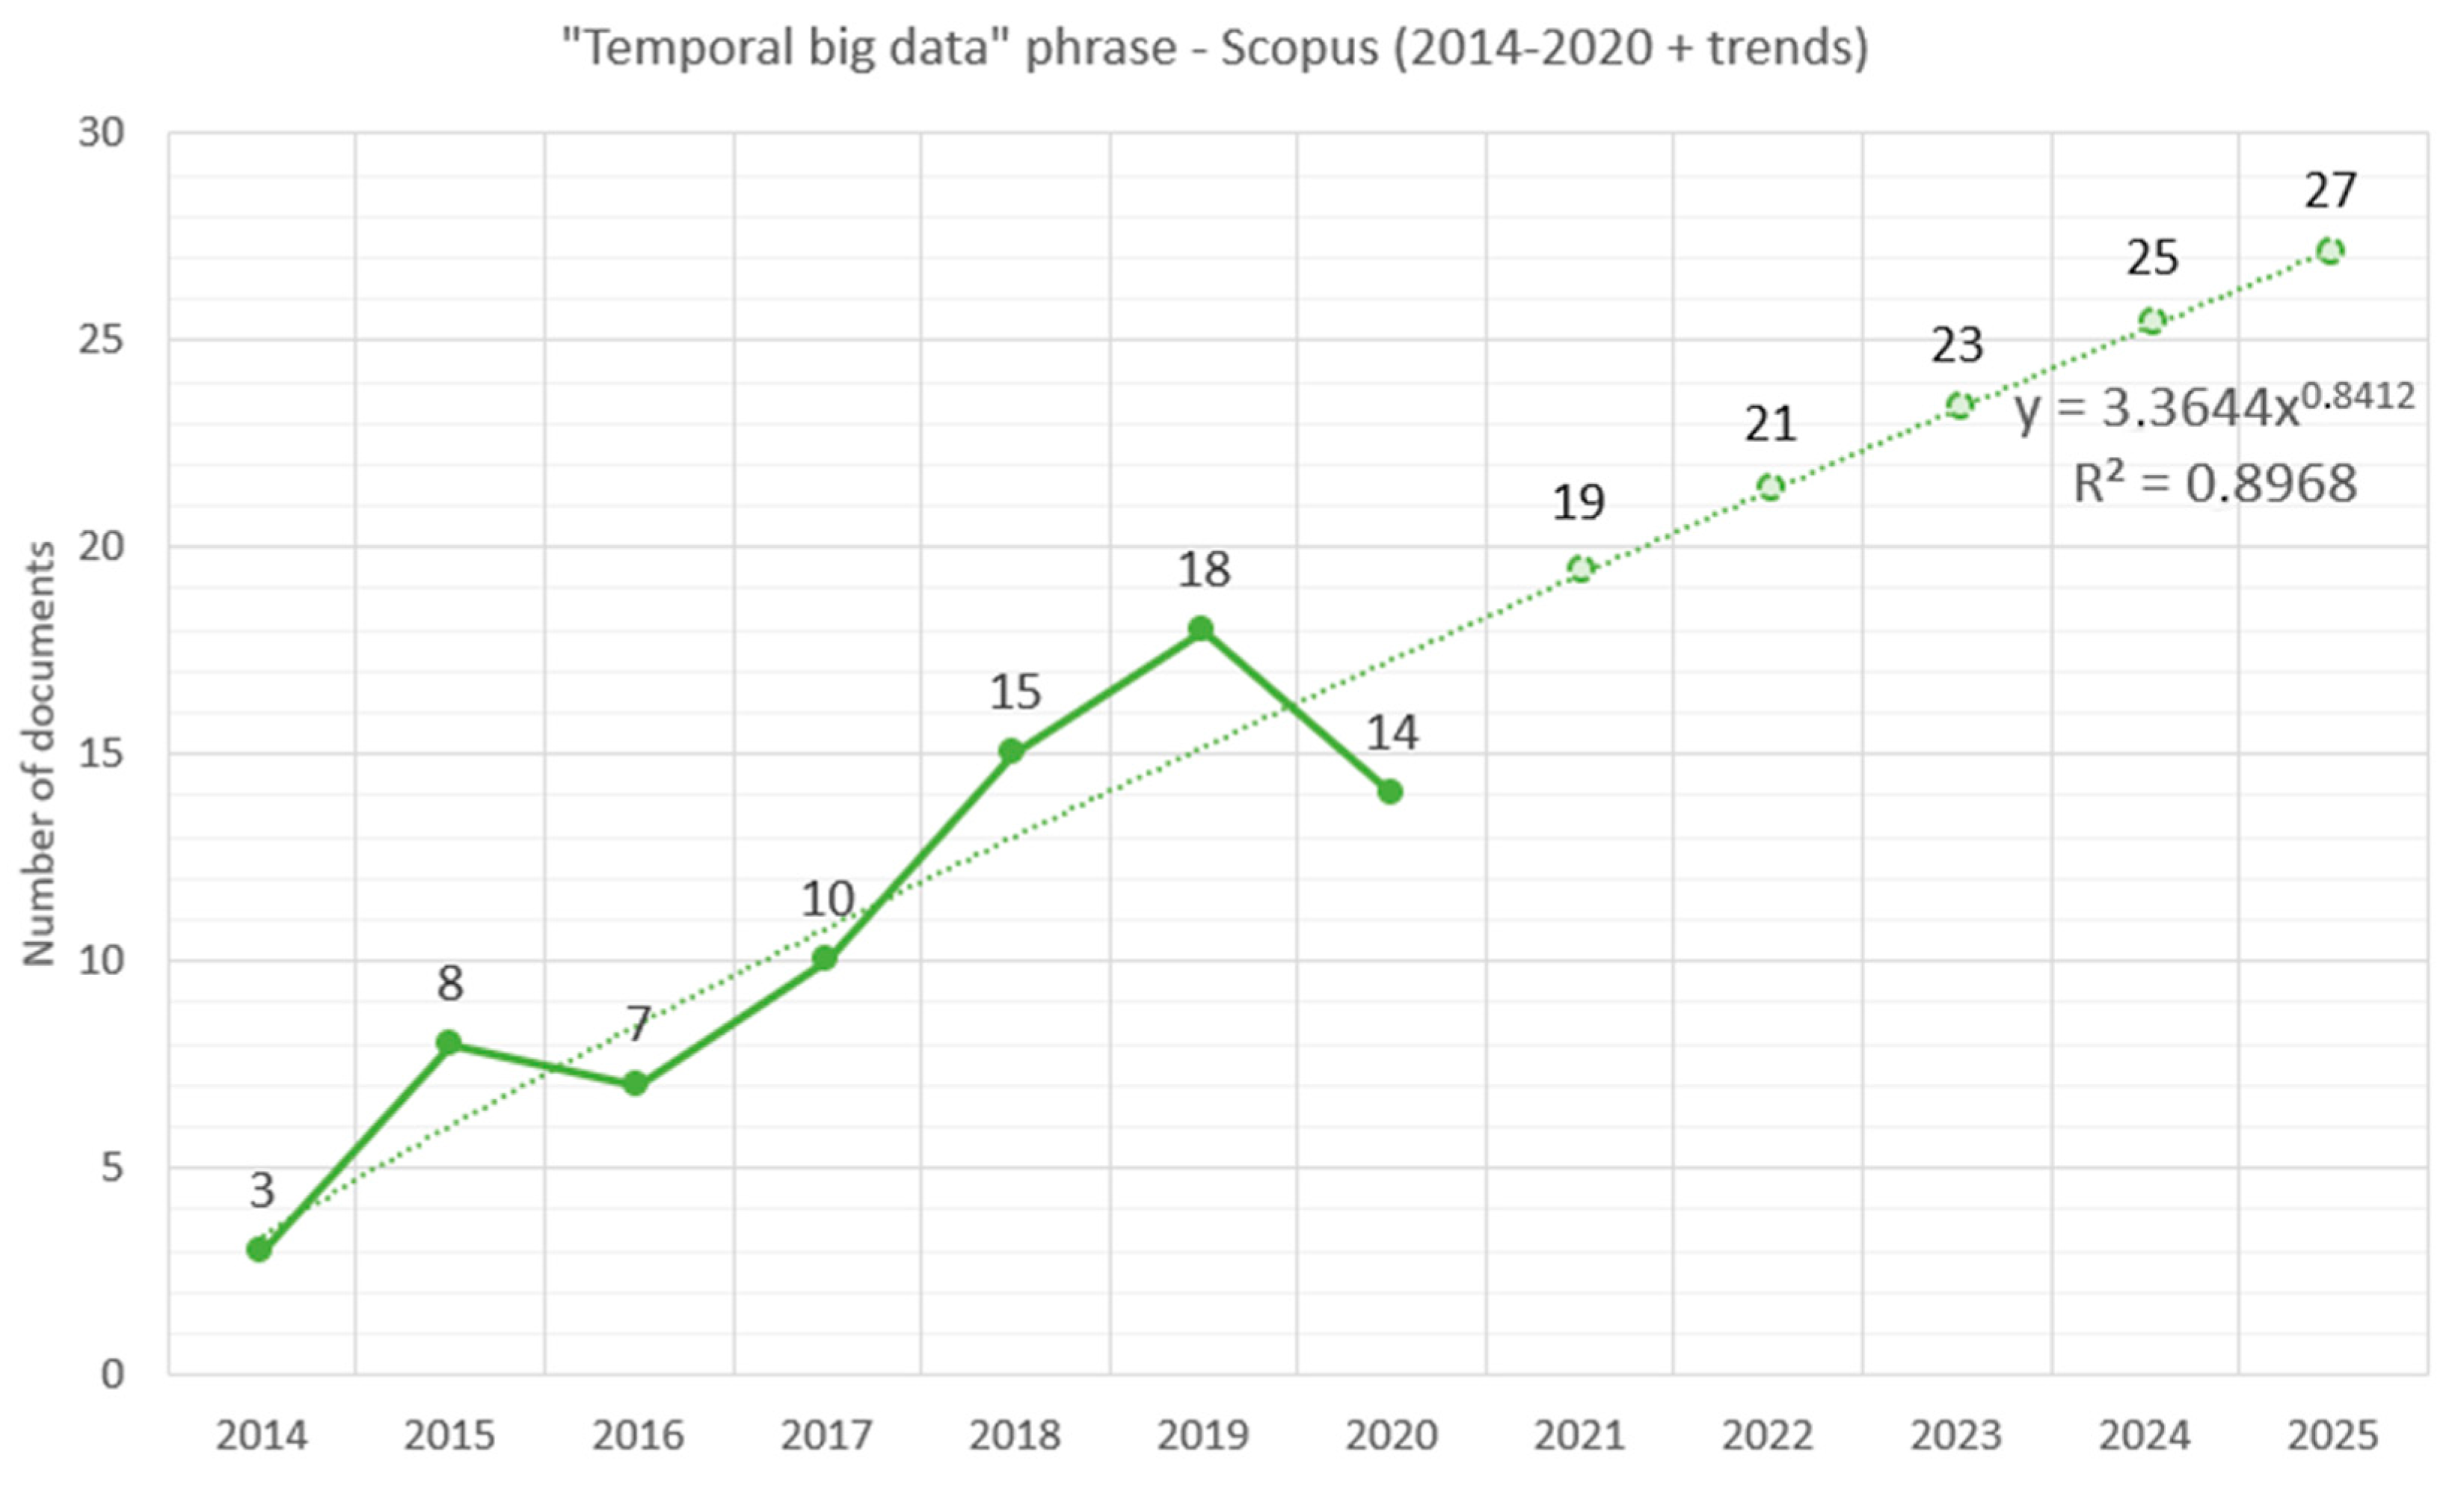
In the case of the time series, for the number of documents in the Scopus database corresponding to the phrase “temporal big data”, the same trend analysis methodology was used. Moreover, in this case, there are high levels of data fit, which are manifested in high values of the coefficient of determination R2. Note, however, that this phrase has a slightly less dynamic trend, but this may be the result of less data (in this case, the number of documents) that was used to create the trend. It does not change the fact that the trend is strongly growing and clearly outlined (due to the high value of the R2 coefficient). The highest fit level is also visible in the power trend, although this lower dynamics (in comparison to “big data mining” query) is manifested by a lower scalar value and a lower exponent value (which is less than 1—which indicates a slight stabilization over a long period of time). The coefficients of determination R2 along with the equations of the trend function for the “temporal big data” phrase are presented in Table 5.
For this query, values for future periods can also be predicted. This estimate is visible in Table 6, also excluding the year 2021 and treating it as the period for standardization. The table shows the values for the next 5 periods after 2020 (i.e., from 2021 to 2025 inclusive) and the prediction values are treated as the absolute value from the value of the trend function, to maintain the integer value. Figure 16, respectively, depicts the power trend function plotted on a time series of science documents from the Scopus database for the expression “temporal big data” regarding the year, as well as the projected forecast values for subsequent periods.

5.5.4. Trends for “Temporal Big Data Mining” Phrase

The last query concerned the “temporal big data mining” key phrase as a sum of the two previous key phrases. This query returned only one document from the Scopus database, dated 2016 (and one in press, dated 2021), with subject area named as “multidisciplinary” and, more precisely, geological sciences. The issue of temporal big data mining is a new research topic, and within the area of business, it seems completely unexplored. This result is in line with our findings presented in this paper. The research topic of temporal big data mining is challenging, and within business, management, and decision sciences, there is a vast area for future investigations.

5.5.5. Usefulness of Trend Analysis in the Context of Bibliographic Research

The usefulness of the trend analysis is confirmed in scientific research from various fields. Hence, in this paper, based primarily on the bibliographic research, we have decided to use the trend analysis to check whether our findings are confirmed. Naturally, the raising trend indicates the augmenting interest in the temporal issues regarding big data mining issues. It may seem apparent and undisputable; however, it is not. As noted in the Introduction, we understand “temporality” in its very deep context that is as the time dimension of phenomena being examined. Time is being understood not only as a simple (calendar) linear construct. It may be perceived and analyzed as a branching structure (branching to the future or to the past), as a structure composed of parallel timelines, or even as a cyclic structure [7]. The timeline may be composed of intervals, of points, or both [196,197]. So far, such a rich approach to the problem of time, both from the philosophical and logical side, has so far been typical for the area of artificial intelligence [6,198,199]. It enables, e.g., reasoning about change, analyzing causality, or introducing the notion of possibility. Time is philosophically treated as the fourth dimension [200,201,202], but it provides the basis for extending reasoning not only in everyday life, but also in the understanding and aspects of artificial intelligence (AI) [203]. This was a point for further considerations in the context of big data analysis. As such, “AI approach” to big data analytics and big data mining is not obvious; the trend analysis performed in this paper has proven that our observation about such a temporal research gap in BDM is confirmed.

6. Discussion

Consumer insights have been analyzed also before the big data era—by applying the data mining techniques to huge customer databases. Obviously, this concerned the structured data. These databases have been mined for various purposes and with various machine learning (ML) techniques. Liao et al. [204] mined customer data for new product development and for customer relationship management in the tourism industry. Rajagopal [205] applied database clustering to identify the high-value, and low-risk customers. Clustering has been also exploited, together with market basket analysis, in [206] with the ultimate goal to discover customer groups defined by lifestyle. As these examples show, the temporal aspect of analysis has been rarely addressed. It is touched in [207] where classification and clustering of time-stamped banking transaction data is performed for customer profiling. In [208] historical electricity consumption, data are mined to automatically estimate the absence probability of a customer. The input data are temporally ordered as time series. Hence, the temporal dimension is present only in the simple form of timestamping.
The advent of big data, with its heterogeneity, velocity, volume, and other features, offered quite new possibilities of mining customer insights. However, the big data mining approaches found in the literature seldom address the temporality. e.g., [209,210,211,212] propose various social media mining approaches, to analyze and visualize Twitter clusters, to extract customers’ opinions on product features, to analyze customer requirements. All these approaches do not touch any time aspects of data nor analytics. Similarly, in the e-commerce area, Ref. [213] combine machine learning methods: association rule mining, clustering, and classification to enhance precision marketing and personal referral services; Ref. [214] mine customer data to predict remanufactured product demand. These two approaches do not address the temporal dimension of data as well. Textual data of consumer complaints is mined with the Outcome-Driven Innovation method in [215] where the problem of time-dependent opinion changeability is omitted by introducing the concept of a job. The job is assumed to be stable in a certain period of time. Hassani et al. [216,217] offer two exhaustive literature reviews on big data mining in banking, and on textual big data mining, respectively. As for the banking area, no research with explicit time aspect is detected, only some publications on real-time analytics are pointed out. For textual big data analytics, the problem of changes over time, typical to social media data, has been noticed. Hence, Ref. [217] point out the research gap linked to temporal big data analytics, but it is limited to textual social media content analysis.
Temporal big data mining for consumer insights has been addressed in a limited number of research works. Ref. [218] propose the sentiment intelligence tool to analyze consumer complaints expressed via social media. Although the analysis is performed in real time, it is not fully temporal. It does not offer analysis of changes over time, of time structure, of causal relationships and other temporal characteristics. Only timestamping of complaints is used. Timestamping of events depicted by big data is used by several other researchers too. Ref. [219] use clustering of time series of smart meter data to discover time and intensity of water use by end customers. Refs. [220,221] mine processes in event logs and location data, respectively. In both cases, data is simply time-stamped which means that the simplest approach to time is used, namely linear calendar time. A more complete view of time is presented by [222], who address the problem of temporal clustering of sentiments in emails. Sentiment features are represented as a trajectory which enables the discovery of sentiment flow in emails with regard to topic and time.
Obviously then, some research on temporal big data mining for customer insights has already emerged, however, these attempts are few, and time is captured in a simplified way. As the analysis in Section 4 and Section 5 has shown, the temporal big data mining for customer insights area offers many more research possibilities and is generally unexplored.

7. Concluding Remarks

The usability of advanced big data analytics including big data mining for gaining valuable customer insights has already been investigated by many researchers [160,213,216,223,224,225]. The importance of time dimension in business operations is also widely recognized [226,227]. However, the existing research on big customer data mining has not yet brought the temporal dimension to the forefront. Our article identifies a significant research gap, consisting in the need to develop methods and techniques of temporal big data mining to obtain a complete picture of clients.
The results presented in our study have been successfully verified by querying the Scopus bibliographic database. We formulated four queries related to the notions of big data analytics, big data mining, temporal big data, and temporal big data mining. The results confirmed that especially the fourth area is still an unexplored field of research.
Our study makes several theoretical contributions to the relevant research. First, it organizes knowledge on the role of big data analytics in understanding client behavior and in gaining profound customer insights. Second, it indicates the importance of the temporal dimension of customer behavior and shows the role of time in customer analytics. Third, it identifies an interesting research gap: advanced analytics and mining of temporal big data for a complete picture of clients. The identified research gap opens a new perspective on the issue of exploring customers’ behaviors, needs, and expectations, thus offering new research and business possibilities to both academia and practitioners.
The main limitations of our research are twofold. First, the bibliographic data for the year 2021 may be incomplete, probably due to the COVID-19 pandemic and simply because the year has not ended yet. Second, only the Scopus database has been queried to verify our findings—other scientific databases, such as Thomson Reuters, DBLP, IEEE Xplore. Verification of our results against these databases may be one of the future research directions generated by our work. The other future research possibilities include: (1) to search the literature for temporal data mining solutions in a particular area of application; (2) to search other types of sources, such as case studies and corporate reports for existing temporal big data mining approaches; (3) to develop a framework for temporal big data mining tasks and verify it in business practice; (4) to verify the possibility of performing fully temporal reasoning—with the use of some temporal formalism—on the behavior of phenomena detected with big data mining.

Supplementary Materials

The following are available online at https://www.mdpi.com/article/10.3390/app11156993/s1, Scopus.xlsx (Supplementary File).

Author Contributions

Conceptualization, M.M.-K.; methodology, M.M.-K.; software, B.H; validation, M.M.-K. and B.H.; formal analysis, B.H.; investigation, M.M.-K. and B.H.; resources, M.M.-K. and B.H.; data curation, M.M.-K.; writing—original draft preparation, M.M.-K.; writing—review and editing, M.M.-K.; visualization, B.H.; supervision, M.M.-K.; project administration, M.M.-K. Both authors have read and agreed to the published version of the manuscript.

Funding

This research received no external funding.

Institutional Review Board Statement

Not applicable.

Informed Consent Statement

Not applicable.

Data Availability Statement

The data presented in this study are available in SupplementaryData-Scopus.xlsx.

Conflicts of Interest

The authors declare no conflict of interest.

Appendix A

The Supplementary File (called SupplementaryFile-Scopus.xlsx) attached to the manuscript contains data generated by the Scopus database for author queries. This Supplementary File is in the Microsoft Excel spreadsheet format (XLSX), which fully reflect all the CSV files, which were generated and downloaded on 10 May 2021 (on the date of the analysis) from the Scopus website. The sheets contain structured data in three categories: “documents by year”, “documents by subject area”, and “documents by type” for three phrases given by the authors: “big data mining”, “temporal big data”, and “big data analytics” which equates to nine sheets. The queries that correspond to the respective results are on each worksheet.

References

  1. Davenport, T.H.; Harris, J.G. Competing on Analytics: The New Science of Winning; Harvard Business School Press: Boston, MA, USA, 2007; ISBN 1422103323. [Google Scholar]
  2. Sun, S.; Cegielski, C.G.; Jia, L.; Hall, D.J. Understanding the Factors Affecting the Organizational Adoption of Big Data. J. Comput. Inf. Syst. 2018, 58, 193–203. [Google Scholar] [CrossRef]
  3. McAfee, A.; Brynjolfsson, E. Big Data: The Management Revolution. Harv. Bus. Rev. 2012, 90, 60–66, 68, 128. [Google Scholar]
  4. Mikalef, P.; Boura, M.; Lekakos, G.; Krogstie, J. Big Data Analytics and Firm Performance: Findings from a Mixed-Method Approach. J. Bus. Res. 2019, 98, 261–276. [Google Scholar] [CrossRef]
  5. Mikalef, P.; Pappas, I.O.; Krogstie, J.; Giannakos, M. Big Data Analytics Capabilities: A Systematic Literature Review and Research Agenda. Inf. Syst. e-Bus. Manag. 2018, 16, 547–578. [Google Scholar] [CrossRef]
  6. Fisher, M. Temporal Representation and Reasoning. In Foundations of Artificial Intelligence; van Harmelen, F., Lifschitz, V., Porter, B., Eds.; Elsevier: Amsterdam, The Netherlands, 2008; Volume 3, pp. 513–550. ISBN 9780444522115. [Google Scholar]
  7. Hajnicz, E. Time Structures: Formal Description and Algorithmic Representation; Springer Science & Business Media: Berlin/Heidelberg, Germany, 1996; ISBN 3540609415. [Google Scholar]
  8. Barney, J. Firm Resources and Sustained Competitive Advantage. J. Manag. 1991, 17, 99–120. [Google Scholar] [CrossRef]
  9. Barwise, P.; Meehan, S. Customer Insights That Matter. J. Advert. Res. 2011, 51, 342–344. [Google Scholar] [CrossRef]
  10. Soroka, A.; Liu, Y.; Han, L.; Haleem, M.S. Big Data Driven Customer Insights for SMEs in Redistributed Manufacturing. Procedia CIRP 2017, 63, 692–697. [Google Scholar] [CrossRef]
  11. Kitchens, B.; Dobolyi, D.; Li, J.; Abbasi, A. Advanced Customer Analytics: Strategic Value Through Integration of Relationship-Oriented Big Data. J. Manag. Inf. Syst. 2018, 35, 540–574. [Google Scholar] [CrossRef]
  12. Fiaidhi, J.; Mohammed, S. Thick Data: A New Qualitative Analytics for Identifying Customer Insights. IT Prof. 2019, 21, 4–13. [Google Scholar] [CrossRef]
  13. Erevelles, S.; Fukawa, N.; Swayne, L. Big Data Consumer Analytics and the Transformation of Marketing. J. Bus. Res. 2016, 69, 897–904. [Google Scholar] [CrossRef]
  14. Yom-Tov, G.B.; Ashtar, S.; Altman, D.; Natapov, M.; Barkay, N.; Westphal, M.; Rafaeli, A. Customer Sentiment in Web-Based Service Interactions: Automated Analyses and New Insights. In Proceedings of the The Web Conference 2018, Lyon, France, 23–27 April 2018; pp. 1689–1697. [Google Scholar]
  15. Jukić, N.; Sharma, A.; Nestorov, S.; Jukić, B. Augmenting Data Warehouses with Big Data. Inf. Syst. Manag. 2015, 32, 200–209. [Google Scholar] [CrossRef]
  16. Olszak, C.; Mach-Król, M. A Conceptual Framework for Assessing an Organization’s Readiness to Adopt Big Data. Sustainability 2018, 10, 3734. [Google Scholar] [CrossRef] [Green Version]
  17. Fosso Wamba, S.; Akter, S. Big Data Analytics for Supply Chain Management: A Literature Review and Research Agenda. In Enterprise and Organizational Modeling and Simulation; Lecture Notes in Business Information Processing; Springer International Publishing: Cham, Switzerland, 2015; pp. 61–72. [Google Scholar]
  18. Miah, S.J.; Vu, H.Q.; Gammack, J.; McGrath, M. A Big Data Analytics Method for Tourist Behaviour Analysis. Inf. Manag. 2017, 54, 771–785. [Google Scholar] [CrossRef] [Green Version]
  19. Mikalef, P.; van de Wetering, R.; Krogstie, J. Building Dynamic Capabilities by Leveraging Big Data Analytics: The Role of Organizational Inertia. Inf. Manag. 2020, 103412. [Google Scholar] [CrossRef]
  20. Elia, G.; Polimeno, G.; Solazzo, G.; Passiante, G. A Multi-Dimension Framework for Value Creation through Big Data. Ind. Mark. Manag. 2020, 90, 617–632. [Google Scholar] [CrossRef]
  21. von Hippel, E. The Sources of Innovation; Oxford University Press: New York, NY, USA, 1988. [Google Scholar]
  22. Kärkkäinen, H.; Piippo, P.; Puumalainen, K.; Tuominen, M. Assessment of Hidden and Future Customer Needs in Finnish Business-to-business Companies. RD Manag. 2001, 31, 391–407. [Google Scholar] [CrossRef]
  23. Holt, K.; Geschka, H.; Peterlongo, G. Need Assessment—A Key to User-Oriented Product Innovation. J. Prod. Innov. Manag. 1986, 3, 218–219. [Google Scholar] [CrossRef]
  24. Ulrich, K.; Eppinger, S.D. Product Design and Development, 1st ed.; McGraw-Hill, Inc.: New York, NY, USA, 1995; ISBN 9780070658110. [Google Scholar]
  25. The Sveriges Riksbank Prize in Economic Sciences in Memory of Alfred Nobel. 2001. Available online: https://www.nobelprize.org/prizes/economic-sciences/2001/summary/ (accessed on 27 July 2021).
  26. The Sveriges Riksbank Prize in Economic Sciences in Memory of Alfred Nobel. 2002. Available online: https://www.nobelprize.org/prizes/economic-sciences/2002/summary/ (accessed on 27 July 2021).
  27. Stone, M.; Bond, A.; Foss, B. Consumer Insight: How to Use Data and Market Research to Get Closer to Your Customer (Market Research in Practice); Kogan Page Publishers: London, UK, 2014; ISBN 978-0749442927. [Google Scholar]
  28. Smith, B.; Wilson, H.; Clark, M. Creating and Using Customer Insight: 12 Rules of Best Practice. J. Med. Mark. 2006, 6, 135–139. [Google Scholar] [CrossRef]
  29. Hergert, M.; Morris, D. Accounting Data for Value Chain Analysis. Strateg. Manag. J. 1989, 10, 175–188. [Google Scholar] [CrossRef]
  30. Takeuchi, H.; Subramaniam, L.V.; Nasukawa, T.; Roy, S. Getting Insights from the Voices of Customers: Conversation Mining at a Contact Center. Inf. Sci. 2009, 179, 1584–1591. [Google Scholar] [CrossRef]
  31. Hirschowitz, A. Closing the CRM Loop: The 21st Century Marketer’s Challenge: Transforming Customer Insight into Customer Value. J. Target. Meas. Anal. Mark. 2001, 10, 168–178. [Google Scholar] [CrossRef] [Green Version]
  32. Nath, V.; Gugnani, R.; Goswami, S.; Gupta, N. An Insight into Customer Relationship Management Practices in Selected Indian Service Industries. J. Mark. Commun. 2009, 4, 18–40. [Google Scholar]
  33. Kumar, V. Customer Relationship Management. In Wiley International Encyclopedia of Marketing; John Wiley & Sons, Ltd.: Chichester, UK, 2010. [Google Scholar]
  34. Valmohammadi, C.; Beladpas, M. Customer Relationship Management and Service Quality, a Survey within the Banking Sector. Ind. Commer. Train. 2014, 46, 77–83. [Google Scholar] [CrossRef]
  35. Plakoyiannaki, E.; Tzokas, N.; Dimitratos, P.; Saren, M. How Critical Is Employee Orientation for Customer Relationship Management? Insights from a Case Study. J. Manag. Stud. 2007, 45, 268–293. [Google Scholar] [CrossRef]
  36. Zerbino, P.; Aloini, D.; Dulmin, R.; Mininno, V. Big Data-Enabled Customer Relationship Management: A Holistic Approach. Inf. Process. Manag. 2018, 54, 818–846. [Google Scholar] [CrossRef]
  37. Valmohammadi, C. Customer Relationship Management: Innovation and Performance. Int. J. Innov. Sci. 2017, 9, 374–395. [Google Scholar] [CrossRef]
  38. Bailey, C.; Baines, P.R.; Wilson, H.; Clark, M. Segmentation and Customer Insight in Contemporary Services Marketing Practice: Why Grouping Customers Is No Longer Enough. J. Mark. Manag. 2009, 25, 227–252. [Google Scholar] [CrossRef] [Green Version]
  39. Locke, C.; Levine, R.; Searls, D.; Weinberger, D. The Cluetrain Manifesto: End of Business as Usual; Basic Books: Cambridge, MA, USA, 2000. [Google Scholar]
  40. Greenberg, P. The Impact of CRM 2.0 on Customer Insight. J. Bus. Ind. Mark. 2010, 25, 410–419. [Google Scholar] [CrossRef]
  41. Sigala, M. Integrating Customer Relationship Management in Hotel Operations: Managerial and Operational Implications. Int. J. Hosp. Manag. 2005, 24, 391–413. [Google Scholar] [CrossRef]
  42. Bieleń, M.; Kubiczek, J. Response of the Labor Market to the Needs and Expectations of Generation Z. E-Mentor 2020, 86, 87–94. [Google Scholar] [CrossRef]
  43. Itani, O.S.; Krush, M.T.; Agnihotri, R.; Trainor, K.J. Social Media and Customer Relationship Management Technologies: Influencing Buyer-Seller Information Exchanges. Ind. Mark. Manag. 2020, 90, 264–275. [Google Scholar] [CrossRef]
  44. Guha, S.; Harrigan, P.; Soutar, G. Linking Social Media to Customer Relationship Management (CRM): A Qualitative Study on SMEs. J. Small Bus. Entrep. 2018, 30, 193–214. [Google Scholar] [CrossRef]
  45. Marolt, M.; Zimmermann, H.-D.; Žnidaršič, A.; Pucihar, A. Exploring Social Customer Relationship Management Adoption in Micro, Small and Medium-Sized Enterprises. J. Theor. Appl. Electron. Commer. Res. 2020, 15, 38–58. [Google Scholar] [CrossRef] [Green Version]
  46. Olszak, C.M. Assessment of Business Intelligence Maturity in the Selected Organizations. In Proceedings of the 2013 Federated Conference on Computer Science and Information Systems, Kraków, Poland, 8–11 September 2013; IEEE: Kraków, Poland, 2013. [Google Scholar]
  47. Olszak, C.M. Business Intelligence in Cloud. Pol. J. Manag. Stud. 2014, 10, 115–125. [Google Scholar]
  48. Gottfried, A.; Hartmann, C.; Yates, D. Mining Open Government Data for Business Intelligence Using Data Visualization: A Two-Industry Case Study. J. Theor. Appl. Electron. Commer. Res. 2021, 16, 1042–1065. [Google Scholar] [CrossRef]
  49. Nethravathi, P.S.R.; Bai, G.V.; Spulbar, C.; Suhan, M.; Birau, R.; Calugaru, T.; Hawaldar, I.T.; Ejaz, A. Business Intelligence Appraisal Based on Customer Behaviour Profile by Using Hobby Based Opinion Mining in India: A Case Study. Econ. Res. Ekon. Istraž. 2020, 33, 1889–1908. [Google Scholar] [CrossRef]
  50. Jurić, S. Business Intelligence and Intellectual Capital—Concepts of Knowledge in the Function of Added Value Creation. J. Account. Manag. 2020, 10, 85–96. [Google Scholar]
  51. Tešendić, D.; Boberić Krstićev, D. Business Intelligence in the Service of Libraries. Inf. Technol. Libr. 2019, 38, 98–113. [Google Scholar] [CrossRef]
  52. Olszak, C.M.; Ziemba, E. Critical Success Factors for Implementing Business Intelligence Systems in Small and Medium Enterprises on the Example of Upper Silesia, Poland. Interdiscip. J. Inf. Knowl. Manag. 2012, 7, 129–150. [Google Scholar] [CrossRef] [Green Version]
  53. Tatić, K.; Džafić, Z.; Haračić, M.; Haračić, M. The Use of Business Intelligence (BI) in Small and Medium-Sized Enterprises (SMEs) in Bosnia and Herzegovina. Econ. Rev. J. Econ. Bus. 2018, 16, 23–37. [Google Scholar]
  54. Bimonte, S.; Antonelli, L.; Rizzi, S. Requirements-Driven Data Warehouse Design Based on Enhanced Pivot Tables. Requir. Eng. 2021, 26, 43–65. [Google Scholar] [CrossRef]
  55. Mach-Król, M. On Assessing an Organization’s Preparedness to Adopt and Make Use of Big Data. Inform. Ekon. 2016, 39, 75–82. [Google Scholar]
  56. Greenberg, P. CRM at the Speed of Light: Social CRM 2.0 Strategies, Tools, and Techniques for Engaging Your Customers, 4th ed.; McGraw-Hill, Inc.: Emeryville, CA, USA, 2009. [Google Scholar]
  57. Sommer, S.; Schieber, A.; Hilbert, A.; Heinrich, K. Analyzing Customer Sentiments in Microblogs—A Topic-Model-Based Approach for Twitter Datasets. AMCIS 2011 Proceedings—All Submissions. 2011. Available online: https://aisel.aisnet.org/amcis2011_submissions/ (accessed on 27 July 2021).
  58. Ko, E.H.; Klabjan, D. Semantic Properties of Customer Sentiment in Tweets. In Proceedings of the 2014 IEEE 28th International Conference on Advanced Information Networking and Applications Workshops, Victoria, BC, Canada, 13–16 May 2014; IEEE Computer Society: Washington, DC, USA, 2014; pp. 657–663. [Google Scholar]
  59. Newman, R.; Chang, V.; Walters, R.J.; Wills, G.B. Web 2.0—The Past and the Future. Int. J. Inf. Manag. 2016, 36, 591–598. [Google Scholar] [CrossRef] [Green Version]
  60. Gandomi, A.; Haider, M. Beyond the Hype: Big Data Concepts, Methods, and Analytics. Int. J. Inf. Manag. 2015, 35, 137–144. [Google Scholar] [CrossRef] [Green Version]
  61. Power, D.J. ‘Big Data’ Decision Making Use Cases. In Decision Support Systems V—Big Data Analytics for Decision Making; Springer: Belgrade, Serbia, 2015; pp. 1–9. [Google Scholar]
  62. Zakir, J.; Seymour, T.; Berg, K. Big Data Analytics. Issues Inf. Syst. 2015, 16, 81–90. [Google Scholar] [CrossRef]
  63. Sajana, T.; Sheela Rani, C.M.; Narayana, K.V. A Survey on Clustering Techniques for Big Data Mining. Indian J. Sci. Technol. 2016, 9, 1–12. [Google Scholar] [CrossRef]
  64. Bifet, A. Mining Big Data in Real Time. Informatica 2013, 37, 15–20. [Google Scholar]
  65. Jaseena, K.U.; David, J.M. Issues, Challenges and Solutions: Big Data Mining. In Computer Science & Information Technology (CS & IT), Proceedings of the Sixth International Conference on Networks & Communications, Chennai, India, 27–28 December 2014; Academy & Industry Research Collaboration Center (AIRCC): Chennai, Tamil Nadu, India, December 2014; pp. 131–140. [Google Scholar]
  66. Constantiou, I.D.; Kallinikos, J. New Games, New Rules: Big Data and the Changing Context of Strategy. J. Inf. Technol. 2015, 30, 44–57. [Google Scholar] [CrossRef] [Green Version]
  67. Akhtar, P.; Frynas, J.G.; Mellahi, K.; Ullah, S. Big Data-Savvy Teams’ Skills, Big Data-Driven Actions and Business Performance. Br. J. Manag. 2019, 30, 252–271. [Google Scholar] [CrossRef]
  68. Dubey, R.; Gunasekaran, A.; Childe, S.J.; Blome, C.; Papadopoulos, T. Big Data and Predictive Analytics and Manufacturing Performance: Integrating Institutional Theory, Resource-Based View and Big Data Culture. Br. J. Manag. 2019, 30, 341–361. [Google Scholar] [CrossRef]
  69. Awan, U.; Shamim, S.; Khan, Z.; Zia, N.U.; Shariq, S.M.; Khan, M.N. Big Data Analytics Capability and Decision-Making: The Role of Data-Driven Insight on Circular Economy Performance. Technol. Forecast. Soc. Chang. 2021, 168, 120766. [Google Scholar] [CrossRef]
  70. Wixom, B.H.; Yen, B.; Relich, M. Maximizing Value from Business Analytics. MIS Q. Exec. 2013, 12, 111–123. [Google Scholar]
  71. Raut, R.; Narwane, V.; Kumar Mangla, S.; Yadav, V.S.; Narkhede, B.E.; Luthra, S. Unlocking Causal Relations of Barriers to Big Data Analytics in Manufacturing Firms. Ind. Manag. Data Syst. 2021. [Google Scholar] [CrossRef]
  72. Balasaraswathi, M.; Srinivasan, K.; Udayakumar, L.; Sivasakthiselvan, S.; Sumithra, M.G. Big Data Analytic of Contexts and Cascading Tourism for Smart City. Mater. Today: Proc. 2020. [Google Scholar] [CrossRef]
  73. Gretzel, U.; Sigala, M.; Xiang, Z.; Koo, C. Smart Tourism: Foundations and Developments. Electron. Mark. 2015, 25, 179–188. [Google Scholar] [CrossRef] [Green Version]
  74. Qin, S.; Man, J.; Wang, X.; Li, C.; Dong, H.; Ge, X. Applying Big Data Analytics to Monitor Tourist Flow for the Scenic Area Operation Management. Discret. Dyn. Nat. Soc. 2019, 2019, 1–11. [Google Scholar] [CrossRef] [Green Version]
  75. Kozak, J.; Kania, K.; Juszczuk, P.; Mitręga, M. Swarm Intelligence Goal-Oriented Approach to Data-Driven Innovation in Customer Churn Management. Int. J. Inf. Manag. 2021. [Google Scholar] [CrossRef]
  76. Vassakis, K.; Petrakis, E.; Kopanakis, I. Big Data Analytics: Applications, Prospects and Challenges. In Mobile Big Data. Lecture Notes on Data Engineering and Communications Technologies; Skourletopoulos, G., Mastorakis, G., Mavromoustakis, C., Dobre, C., Pallis, E., Eds.; Springer: Cham, Switzerland; Berlin/Heidelberg, Germany, 2018; Volume 10, pp. 3–20. ISBN 978-3-319-67924-2. [Google Scholar]
  77. Wang, J.; Zhang, W.; Shi, Y.; Duan, S.; Liu, J. Industrial Big Data Analytics: Challenges, Methodologies, and Applications. arXiv 2018, arXiv:1807.01016. [Google Scholar]
  78. Kastouni, M.Z.; Ait Lahcen, A. Big Data Analytics in Telecommunications: Governance, Architecture and Use Cases. J. King Saud Univ. Comput. Inf. Sci. 2020. [Google Scholar] [CrossRef]
  79. Biesialska, K.; Franch, X.; Muntés-Mulero, V. Big Data Analytics in Agile Software Development: A Systematic Mapping Study. Inf. Softw. Technol. 2021, 132, 106448. [Google Scholar] [CrossRef]
  80. Sarin, P.; Kar, A.K.; Kewat, K.; Ilavarasan, P.V. Factors Affecting Future of Work: Insights from Social Media Analytics. Procedia Comput. Sci. 2020, 167, 1880–1888. [Google Scholar] [CrossRef]
  81. Most Popular Social Networks Worldwide as of January 2021, Ranked by Number of Active Users. Available online: https://de.statista.com/statistik/kategorien/kategorie/424/themen/540/branche/social-media-user-generated-content/#statistic3 (accessed on 15 June 2021).
  82. Anshari, M.; Almunawar, M.N.; Lim, S.A.; Al-Mudimigh, A. Customer Relationship Management and Big Data Enabled: Personalization & Customization of Services. Appl. Comput. Inform. 2019, 15, 94–101. [Google Scholar] [CrossRef]
  83. Rahmanti, A.R.; Ningrum, D.N.A.; Lazuardi, L.; Yang, H.-C.; (Jack) Li, Y.-C. Social Media Data Analytics for Outbreak Risk Communication: Public Attention on the “New Normal” During the COVID-19 Pandemic in Indonesia. Comput. Methods Programs Biomed. 2021, 106083. [Google Scholar] [CrossRef]
  84. Garg, P.; Gupta, B.; Dzever, S.; Sivarajah, U.; Kumar, V. Examining the Relationship between Social Media Analytics Practices and Business Performance in the Indian Retail and IT Industries: The Mediation Role of Customer Engagement. Int. J. Inf. Manag. 2020, 52, 102069. [Google Scholar] [CrossRef]
  85. Lee, H.J.; Lee, M.; Lee, H.; Cruz, R.A. Mining Service Quality Feedback from Social Media: A Computational Analytics Method. Gov. Inf. Q. 2021, 38, 101571. [Google Scholar] [CrossRef]
  86. Wedel, M.; Kannan, P.K. Marketing Analytics for Data-Rich Environments. J. Mark. 2016, 80, 97–121. [Google Scholar] [CrossRef]
  87. Lazer, D.; Kennedy, R.; King, G.; Vespignani, A. The Parable of Google Flu: Traps in Big Data Analysis. Science 2014, 343, 1203–1205. [Google Scholar] [CrossRef] [PubMed]
  88. Xu, Z.; Frankwick, G.L.; Ramirez, E. Effects of Big Data Analytics and Traditional Marketing Analytics on New Product Success: A Knowledge Fusion Perspective. J. Bus. Res. 2016, 69, 1562–1566. [Google Scholar] [CrossRef]
  89. Walls, C.; Barnard, B. Success Factors of Big Data to Achieve Organisational Performance: Theoretical Perspectives. Expert J. Bus. Manag. 2020, 8, 1–16. [Google Scholar]
  90. Olszak, C.M.; Zurada, J. Big Data in Capturing Business Value. Inf. Syst. Manag. 2020, 37, 240–254. [Google Scholar] [CrossRef]
  91. Fisher, D.; De Line, R.; Czerwinski, M.; Drucker, S. Interactions with Big Data Analytics. Interactions 2012, 19, 50–59. [Google Scholar] [CrossRef]
  92. Wu, X.; Zhu, X.; Wu, G.Q.; Ding, W. Data Mining with Big Data. IEEE Trans. Knowl. Data Eng. 2014, 26, 97–107. [Google Scholar] [CrossRef]
  93. Mohsenian-Rad, H.; Stewart, E.; Cortez, E. Distribution Synchrophasors: Pairing Big Data with Analytics to Create Actionable Information. IEEE Power Energy Mag. 2018, 16, 26–34. [Google Scholar] [CrossRef]
  94. Nadal, S.; Romero, O.; Abelló, A.; Vassiliadis, P.; Vansummeren, S. An Integration-Oriented Ontology to Govern Evolution in Big Data Ecosystems. Inf. Syst. 2019, 79, 3–19. [Google Scholar] [CrossRef] [Green Version]
  95. Akter, S.; Fosso Wamba, S. Big Data Analytics in E-Commerce: A Systematic Review and Agenda for Future Research. Electron. Mark. 2016, 26, 173–194. [Google Scholar] [CrossRef] [Green Version]
  96. Ghavare, P.; Ahire, P. Big Data Classification of Users Navigation and Behavior Using Web Server Logs. In Proceedings of the 2018 4th International Conference on Computing, Communication Control and Automation, ICCUBEA 2018, Pune, India, 16–18 August 2018; Institute of Electrical and Electronics Engineers Inc.: New York, NY, USA, 26–27 July 2018; pp. 1–6. [Google Scholar]
  97. Fan, S.; Lau, R.Y.K.; Zhao, J.L. Demystifying Big Data Analytics for Business Intelligence Through the Lens of Marketing Mix. Big Data Res. 2015, 2, 28–32. [Google Scholar] [CrossRef]
  98. Jacobs, B.J.D.; Donkers, B.; Fok, D. Model-Based Purchase Predictions for Large Assortments. Mark. Sci. 2016, 35, 389–404. [Google Scholar] [CrossRef]
  99. Ghani, N.A.; Hamid, S.; Targio Hashem, I.A.; Ahmed, E. Social Media Big Data Analytics: A Survey. Comput. Hum. Behav. 2019, 101, 417–428. [Google Scholar] [CrossRef]
  100. Liao, S.-H.; Yang, C.-A. Big Data Analytics of Social Network Marketing and Personalized Recommendations. Soc. Netw. Anal. Min. 2021, 11, 21. [Google Scholar] [CrossRef]
  101. Mosaddegh, A.; Albadvi, A.; Sepehri, M.M.; Teimourpour, B. Dynamics of Customer Segments: A Predictor of Customer Lifetime Value. Expert Syst. Appl. 2021, 172, 114606. [Google Scholar] [CrossRef]
  102. Urbanek, A. Big Data—A Challenge for Urban Transport Managers. Commun. Sci. Lett. Univ. Zilina 2017, 19, 36–42. [Google Scholar]
  103. Wali, A.F.; Nwokah, N.G. Aviation Customers’ Journey, Who Cares? Managing Customer Experiences with Customer Relationship Management Strategy: Insight into Nigerian Customers’ Perspectives. J. Glob. Sch. Mark. Sci. 2017, 27, 123–135. [Google Scholar] [CrossRef]
  104. Walker, R.S.; Brown, I. Big Data Analytics Adoption: A Case Study in a Large South African Telecommunications Organisation. S. Afr. J. Inf. Manag. 2019, 21, a1079. [Google Scholar] [CrossRef]
  105. Aguiar, A.B.; Szekut, A. Big Data and Tourism: Opportunities and Applications in Tourism Destination Management. Appl. Tour. 2019, 4, 36–47. [Google Scholar] [CrossRef]
  106. Visvizi, A.; Lytras, M.D.; Aljohani, N. Big Data Research for Politics: Human Centric Big Data Research for Policy Making, Politics, Governance and Democracy. J. Ambient Intell. Humaniz. Comput. 2021, 12, 4303–4304. [Google Scholar] [CrossRef]
  107. Talón-Ballestero, P.; González-Serrano, L.; Soguero-Ruiz, C.; Muñoz-Romero, S.; Rojo-Álvarez, J.L. Using Big Data from Customer Relationship Management Information Systems to Determine the Client Profile in the Hotel Sector. Tour. Manag. 2018, 68, 187–197. [Google Scholar] [CrossRef]
  108. Lim, C.; Kim, M.-J.; Kim, K.-H.; Kim, K.-J.; Maglio, P. Customer Process Management: A Framework for Using Customer-Related Data to Create Customer Value. J. Serv. Manag. 2019, 30, 105–131. [Google Scholar] [CrossRef]
  109. Mithas, S.; Lucas, H.C. What Is Your Digital Business Strategy? IT Prof. 2010, 12, 4–6. [Google Scholar] [CrossRef] [Green Version]
  110. Wang, Y.; Hajli, N. Exploring the Path to Big Data Analytics Success in Healthcare. J. Bus. Res. 2017, 70, 287–299. [Google Scholar] [CrossRef] [Green Version]
  111. Jiang, P.; Winkley, J.; Zhao, C.; Munnoch, R.; Min, G.; Yang, L.T. An Intelligent Information Forwarder for Healthcare Big Data Systems with Distributed Wearable Sensors. IEEE Syst. J. 2016, 10, 1147–1159. [Google Scholar] [CrossRef]
  112. Srinivasan, U.; Arunasalam, B. Leveraging Big Data Analytics to Reduce Healthcare Costs. IT Prof. 2013, 15, 21–28. [Google Scholar] [CrossRef]
  113. Marr, B. Big Data in Practice: How 45 Successful Companies Used Big Data Analytics to Deliver Extraordinary Results; John Wiley & Sons Ltd.: Chichester, UK, 2016; ISBN 978-1-119-23139-4. [Google Scholar]
  114. LaValle, S.; Lesser, E.; Shockley, R.; Hopkins, M.S.; Kruschwitz, N. Big Data, Analytics and the Path from Insights to Value. MIT Sloan Manag. Rev. 2011, 52, 21–32. [Google Scholar]
  115. Popovič, A.; Hackney, R.; Tassabehji, R.; Castelli, M. The Impact of Big Data Analytics on Firms’ High Value Business Performance. Inf. Syst. Front. 2018, 20, 209–222. [Google Scholar] [CrossRef] [Green Version]
  116. Fosso Wamba, S.; Akter, S.; Edwards, A.; Chopin, G.; Gnanzou, D. How ‘Big Data’ Can Make Big Impact: Findings from a Systematic Review and a Longitudinal Case Study. Int. J. Prod. Econ. 2015, 165, 234–246. [Google Scholar] [CrossRef]
  117. Saldivar, A.A.F.; Goh, C.; Chen, W.; Li, Y. Self-Organizing Tool for Smart Design with Predictive Customer Needs and Wants to Realize Industry 4.0. In Proceedings of the 2016 IEEE Congress on Evolutionary Computation (CEC), Vancouver, BC, Canada, 24–29 July 2016; IEEE: Vancouver, BC, Canada, 24–29 July 2016; pp. 5317–5324. [Google Scholar]
  118. Raguseo, E.; Vitari, C. Investments in Big Data Analytics and Firm Performance: An Empirical Investigation of Direct and Mediating Effects. Int. J. Prod. Res. 2018, 56, 5206–5221. [Google Scholar] [CrossRef]
  119. Joshi, M.; Biswas, P. An Empirical Investigation of Impact of Organizational Factors on Big Data Adoption. In Proceedings of the First International Conference on Smart System, Innovations and Computing, Smart Innovation, Systems and Technologies; Somani, A., Srivastava, S., Mundra, A., Rawat, S., Eds.; Springer: Singapore, 2018; Volume 79, pp. 809–824. ISBN 978-981-10-5827-1. [Google Scholar]
  120. Ma’ady, M.P.N.; Yang, C.-K.; Kusumawardani, R.P.; Suryotrisongko, H. Temporal Exploration in 2D Visualization of Emotions on Twitter Stream. Telkomnika 2018, 16, 376–384. [Google Scholar] [CrossRef] [Green Version]
  121. Sagaert, Y.R.; Aghezzaf, E.-H.; Kourentzes, N.; Desmet, B. Temporal Big Data for Tactical Sales Forecasting in the Tire Industry. Interfaces 2018, 48, 121–129. [Google Scholar] [CrossRef] [Green Version]
  122. Greco, F.; Polli, A. Emotional Text Mining: Customer Profiling in Brand Management. Int. J. Inf. Manag. 2020, 51, 101934. [Google Scholar] [CrossRef]
  123. Lim, W.M. How Can Challenger Marketers Target the Right Customer Organization? The A-C-O-W Customer Organization Profiling Matrix for Challenger Marketing. J. Bus. Ind. Mark. 2019, 34, 338–346. [Google Scholar] [CrossRef]
  124. Kuiper, E.; Constantinides, E.; de Vries, S.A. Two-Stage Clustering Approaches for Customer Profiling: A Practical Framework. In Proceedings of the 27th Annual High Technology Small Firms Conference, HTSF 2019, Enschede, The Netherlands, 27 May 2019. [Google Scholar]
  125. Sabuncu, İ.; Turkan, E.; Polat, H. Customer Segmentation and Profiling with RFM Analysis. Turk. J. Mark. 2020, 5, 22–36. [Google Scholar] [CrossRef] [Green Version]
  126. Sarkar, C.; Biswas, M. Adaptive Customer Profiling for Telecom Churn Prediction Using Computation Intelligence. In Computational Intelligence, Communications, and Business Analytics, Proceedings of the Second International Conference, CICBA 2018, Kalyani, India, 27–28 July 2018; Revised Selected Papers; Springer: Singapore, 2019; p. 70. [Google Scholar]
  127. Manivannan, R.; Saminathan, R.; Saravanan, S. An Improved Analytical Approach for Customer Churn Prediction Using Grey Wolf Optimization Approach Based on Stochastic Customer Profiling over a Retail Shopping Analysis: CUPGO. Evol. Intell. 2019, 1–10. [Google Scholar] [CrossRef]
  128. Kumar, V. A Theory of Customer Valuation: Concepts, Metrics, Strategy, and Implementation. J. Mark. 2018, 82, 1–19. [Google Scholar] [CrossRef] [Green Version]
  129. Lytras, M.D.; Visvizi, A. Big Data and Their Social Impact: Preliminary Study. Sustainability 2019, 11, 5067. [Google Scholar] [CrossRef] [Green Version]
  130. Holmlund, M.; Van Vaerenbergh, Y.; Ciuchita, R.; Ravald, A.; Sarantopoulos, P.; Ordenes, F.V.; Zaki, M. Customer Experience Management in the Age of Big Data Analytics: A Strategic Framework. J. Bus. Res. 2020, 116, 356–365. [Google Scholar] [CrossRef]
  131. Hand, D.J.; Adams, N.M. Data Mining. In Wiley StatsRef: Statistics Reference Online; John Wiley & Sons, Ltd.: Chichester, UK, 2015; pp. 1–7. [Google Scholar]
  132. Ascarza, E.; Neslin, S.A.; Netzer, O.; Anderson, Z.; Fader, P.S.; Gupta, S.; Hardie, B.G.S.; Lemmens, A.; Libai, B.; Neal, D.; et al. In Pursuit of Enhanced Customer Retention Management: Review, Key Issues, and Future Directions. Cust. Needs Solut. 2018, 5, 65–81. [Google Scholar] [CrossRef]
  133. Shirazi, F.; Mohammadi, M. A Big Data Analytics Model for Customer Churn Prediction in the Retiree Segment. Int. J. Inf. Manag. 2019, 48, 238–253. [Google Scholar] [CrossRef]
  134. Shrivastava, P.; Sahoo, L.; Pandey, M. Recognition of Telecom Customer’s Behavior as Data Product in CRM Big Data Environment. In Proceedings of the First International Conference on Smart System, Innovations and Computing. Smart Innovation, Systems and Technologies, Jaipur, India, 14–16 April 2017; Somani, A., Srivastava, S., Mundra, A., Rawat, S., Eds.; Springer: Singapore, 2018; Volume 79, pp. 165–173, ISBN 978-981-10-5827-1. [Google Scholar]
  135. Spiess, J.; T’Joens, Y.; Dragnea, R.; Spencer, P.; Philippart, L. Using Big Data to Improve Customer Experience and Business Performance. Bell Labs Tech. J. 2014, 18, 3–17. [Google Scholar] [CrossRef]
  136. Stieglitz, S.; Dang-Xuan, L.; Bruns, A.; Neuberger, C. Social Media Analytics. Bus. Inf. Syst. Eng. 2014, 6, 89–96. [Google Scholar] [CrossRef]
  137. Tinati, R.; Halford, S.; Carr, L.; Pope, C. Big Data: Methodological Challenges and Approaches for Sociological Analysis. Sociology 2014, 48, 663–681. [Google Scholar] [CrossRef] [Green Version]
  138. Zhong, R.Y.; Huang, G.Q.; Lan, S.; Dai, Q.Y.; Chen, X.; Zhang, T. A Big Data Approach for Logistics Trajectory Discovery from RFID-Enabled Production Data. Int. J. Prod. Econ. 2015, 165, 260–272. [Google Scholar] [CrossRef]
  139. Rajaraman, V. Big Data Analytics. Resonance 2016, 21, 695–716. [Google Scholar] [CrossRef]
  140. Kaisler, S.; Money, W.; Cohen, S. Smart Objects: An Active Big Data Approach. In Proceedings of the 51st Hawaii International Conference on System Sciences, Waikoloa Village, HI, USA, 3–6 January 2018; Hawaii International Conference on System Sciences: Waikaoloa Village, HI, USA, 2018. [Google Scholar]
  141. Ačko, B.; Weber, H.; Hutzschenreuter, D.; Smith, I. Communication and Validation of Metrological Smart Data in IoT-Networks. Adv. Prod. Eng. Manag. 2020, 15, 107–117. [Google Scholar] [CrossRef]
  142. Choi, T.M.; Wallace, S.W.; Wang, Y. Big Data Analytics in Operations Management. Prod. Oper. Manag. 2018, 27, 1868–1883. [Google Scholar] [CrossRef]
  143. Thejaswini, B.; Sree, R.D.; Suresh, K. Study of User’s Behaviour in Structured E-Commerce Websites. Int. J. Sci. Res. Eng. Trends 2018, 4, 665–668. [Google Scholar]
  144. della Valle, E.; Dell’Aglio, D.; Margara, A. Taming Velocity and Variety Simultaneously in Big Data with Stream Reasoning. In Proceedings of the 10th ACM International Conference on Distributed and Event-Based Systems—DEBS ’16, Irvine, CA, USA, 20–24 June 2016; ACM Press: New York, NY, USA, 2016; pp. 394–401. [Google Scholar]
  145. Mueller, E.T. Event calculus. In Foundations of Artificial Intelligence; van Harmelen, F., Lifschitz, V., Porter, B., Eds.; Elsevier: Amsterdam, The Netherlands, 2008; Volume 3, pp. 671–708. [Google Scholar]
  146. Mueller, E.T. Commonsense Reasoning: An Event Calculus Based Approach; Morgan Kaufmann: Amsterdam, The Netherlands, 2014; ISBN 0128016477. [Google Scholar]
  147. Lin, F. Situation calculus. In Foundations of Artificial Intelligence; van Harmelen, F., Lifschitz, V., Porter, B., Eds.; Elsevier: Amsterdam, The Netherlands, 2008; Volume 3, pp. 649–669. [Google Scholar]
  148. Ajah, I.A.; Nweke, H.F. Big Data and Business Analytics: Trends, Platforms, Success Factors and Applications. Big Data Cogn. Comput. 2019, 3, 32. [Google Scholar] [CrossRef] [Green Version]
  149. Shamim, S.; Zeng, J.; Shariq, S.M.; Khan, Z. Role of Big Data Management in Enhancing Big Data Decision-Making Capability and Quality among Chinese Firms: A Dynamic Capabilities View. Inf. Manag. 2019, 56, 103135. [Google Scholar] [CrossRef]
  150. Halaweh, M.; Massry, A.E. Conceptual Model for Successful Implementation of Big Data in Organizations. J. Int. Technol. Inf. Manag. 2015, 24, 2. [Google Scholar]
  151. Sivarajah, U.; Kamal, M.M.; Irani, Z.; Weerakkody, V. Critical Analysis of Big Data Challenges and Analytical Methods. J. Bus. Res. 2017, 70, 263–286. [Google Scholar] [CrossRef] [Green Version]
  152. Che, D.; Safran, M.; Peng, Z. From Big Data to Big Data Mining: Challenges, Issues, and Opportunities. In Database Systems for Advanced Applications; Hong, B., Meng, X., Chen, L., Winiwarter, W., Song, W., Eds.; Springer: Berlin/Heidelberg, Germany, 2013; pp. 1–15. ISBN 978-3-642-40270-8. [Google Scholar]
  153. Blazquez, D.; Domenech, J. Big Data Sources and Methods for Social and Economic Analyses. Technol. Forecast. Soc. Chang. 2018, 130, 99–113. [Google Scholar] [CrossRef]
  154. Rong, Y.; Xu, Z.; Yan, R.; Ma, X. Du-Parking: Spatio-Temporal Big Data Tells You Realtime Parking Availability. In Proceedings of the 24th ACM SIGKDD International Conference on Knowledge Discovery & Data Mining—KDD ’18, London, UK, 19–23 August 2018; ACM Press: New York, NY, USA, 2018; pp. 646–654. [Google Scholar]
  155. Syed, L.; Jabeen, S.; Manimala, S.; Elsayed, H.A. Data Science Algorithms and Techniques for Smart Healthcare Using IoT and Big Data Analytics: Towards Smarter Algorithms. In Studies in Fuzziness and Soft Computing; Mishra, M.K., Mishra, B.S.P., Patel, Y.S., Misra, R., Eds.; Springer: Cham, Switzerland, 2019; Volume 374, pp. 211–241. ISBN 978-3-030-03130-5. [Google Scholar]
  156. Ji-fan Ren, S.; Fosso Wamba, S.; Akter, S.; Dubey, R.; Childe, S.J. Modelling Quality Dynamics, Business Value and Firm Performance in a Big Data Analytics Environment. Int. J. Prod. Res. 2017, 55, 5011–5026. [Google Scholar] [CrossRef] [Green Version]
  157. Dhamodaran, S.; Sachin, K.R.; Kumar, R. Big Data Implementation of Natural Disaster Monitoring and Alerting System in Real Time Social Network Using Hadoop Technology. Indian J. Sci. Technol. 2015, 8, 1. [Google Scholar] [CrossRef] [Green Version]
  158. Chen, P.C.L.; Zhang, C.-Y. Data-Intensive Applications, Challenges, Techniques and Technologies: A Survey on Big Data. Inf. Sci. 2014, 275, 314–347. [Google Scholar] [CrossRef]
  159. Esposito, C.; Ficco, M.; Palmieri, F.; Castiglione, A. A Knowledge-Based Platform for Big Data Analytics Based on Publish/Subscribe Services and Stream Processing. Knowl. Based Syst. 2015, 79, 3–17. [Google Scholar] [CrossRef]
  160. Singh, S.; Yassine, A. Big Data Mining of Energy Time Series for Behavioral Analytics and Energy Consumption Forecasting. Energies 2018, 11, 452. [Google Scholar] [CrossRef] [Green Version]
  161. Kirkpatrick, K. It’s Not the Algorithm, It’s the Data. Commun. ACM 2017, 60, 21–23. [Google Scholar] [CrossRef]
  162. Abiteboul, S.; Stoyanovich, J. Transparency, Fairness, Data Protection, Neutrality. J. Data Inf. Qual. 2019, 11, 1–9. [Google Scholar] [CrossRef] [Green Version]
  163. Pouyanfar, S.; Chen, S.-C.; Shyu, M.-L. Deep Spatio-Temporal Representation Learning for Multi-Class Imbalanced Data Classification. In Proceedings of the 2018 IEEE International Conference on Information Reuse and Integration (IRI), Salt Lake City, UT, USA, 6–9 July 2018; Khan, L., Palanisamy, B., Mehedy Masud, M., Bifet, A., Eds.; IEEE: Salt Lake City, UT, USA, July 2018; pp. 386–393. [Google Scholar]
  164. Zhang, J.; Yao, C.; Sun, Y.; Fang, Z. Building Text-Based Temporally Linked Event Network for Scientific Big Data Analytics. Pers. Ubiquitous Comput. 2016, 20, 743–755. [Google Scholar] [CrossRef]
  165. Brandt, S.; Kalaycı, E.G.; Ryzhikov, V.; Xiao, G.; Zakharyaschev, M. Querying Log Data with Metric Temporal Logic. J. Artif. Intell. Res. 2018, 62, 829–877. [Google Scholar] [CrossRef] [Green Version]
  166. Güzel Kalayci, E.; Brandt, S.; Calvanese, D.; Ryzhikov, V.; Xiao, G.; Zakharyaschev, M. Ontology–Based Access to Temporal Data with Ontop: A Framework Proposal. Int. J. Appl. Math. Comput. Sci. 2019, 29, 17–30. [Google Scholar] [CrossRef] [Green Version]
  167. Kharlamov, E.; Brandt, S.; Jimenez-Ruiz, E.; Kotidis, Y.; Lamparter, S.; Mailis, T.; Neuenstadt, C.; Özçep, Ö.; Pinkel, C.; Svingos, C.; et al. Ontology-Based Integration of Streaming and Static Relational Data with Optique. In Proceedings of the 2016 ACM SIGMOD International Conference on Management of Data, San Francisco, CA, USA, 26 June–1 July 2016; Association for Computing Machinery: New York, NY, USA, 2016; pp. 2109–2112. [Google Scholar]
  168. Artale, A.; Kontchakov, R.; Kovtunova, A.; Ryzhikov, V.; Wolter, F.; Zakharyaschev, M. First-Order Rewritability of Temporal Ontology-Mediated Queries. In Proceedings of the Twenty-Fourth International Joint Conference on Artificial Intelligence, Buenos Aires, Argentina, 25–31 July 2015. [Google Scholar]
  169. Gutiérrez-Basulto, V.; Jung, J.C.; Kontchakov, R. Temporalized EL Ontologies for Accessing Temporal Data: Complexity of Atomic Queries. In Proceedings of the Twenty-Fifth International Joint Conference on Artificial Intelligence, New York, NY, USA, 9–15 July 2016; pp. 1102–1108. [Google Scholar]
  170. Xiao, G.; Calvanese, D.; Kontchakov, R.; Lembo, D.; Poggi, A.; Rosati, R.; Zakharyaschev, M. Ontology-Based Data Access: A Survey. In Proceedings of the Twenty-Seventh International Joint Conference on Artificial Intelligence, Stockholm, Sweden, 13 July 2018; International Joint Conferences on Artificial Intelligence Organization: San Francisco, CA, USA; Curran Associates, Inc.: Red Hook, NY, USA, July 2018; pp. 5511–5519. [Google Scholar]
  171. Kaplan, R.M.; Chambers, D.A.; Glasgow, R.E. Big Data and Large Sample Size: A Cautionary Note on the Potential for Bias. Clin. Transl. Sci. 2014, 7, 342–346. [Google Scholar] [CrossRef] [Green Version]
  172. Hargittai, E. Potential Biases in Big Data: Omitted Voices on Social Media. Soc. Sci. Comput. Rev. 2020, 38, 10–24. [Google Scholar] [CrossRef]
  173. Blank, G.; Lutz, C. Representativeness of Social Media in Great Britain: Investigating Facebook, LinkedIn, Twitter, Pinterest, Google+, and Instagram. Am. Behav. Sci. 2017, 61, 741–756. [Google Scholar] [CrossRef]
  174. Stern, M.J.; Bilgen, I.; McClain, C.; Hunscher, B. Effective Sampling From Social Media Sites and Search Engines for Web Surveys. Soc. Sci. Comput. Rev. 2017, 35, 713–732. [Google Scholar] [CrossRef]
  175. Saka, E. Big Data and Gender-Biased Algorithms. Int. Encycl. Gend. Media Commun. 2020, 1–4. [Google Scholar] [CrossRef]
  176. Thelwall, M. Gender Bias in Machine Learning for Sentiment Analysis. Online Inf. Rev. 2018, 42, 343–354. [Google Scholar] [CrossRef]
  177. Maugis, P.A.G. Big Data Uncertainties. J. Forensic Leg. Med. 2018, 57, 7–11. [Google Scholar] [CrossRef] [PubMed]
  178. Barrett, J.P. The Coefficient of Determination—Some Limitations. Am. Stat. 1974, 28, 19–20. [Google Scholar] [CrossRef]
  179. Wooldridge, J.M. Introductory Econometrics: A Modern Approach; Nelson Education: Scarborough, UK, 2016. [Google Scholar]
  180. Pollock, S.G. Estimation of Polynomial Trends. In Handbook of Time Series Analysis, Signal Processing, and Dynamics; Elsevier: Amsterdam, The Netherlands, 1999; pp. 261–291. [Google Scholar]
  181. Olanrewaju, S.O.; Olafioye, S.O.; Oguntade, E.S. Modelling Nigeria Population Growth: A Trend Analysis Approach. Int. J. Innov. Sci. Res. Technol. 2020, 5, 997–1017. [Google Scholar]
  182. Klóska, R.; Czyżycki, R. Klasyczne modele trendu w prognozowaniu liczby odprawionych pasażerów w porcie lotniczym Szczecin-Goleniów. In Koniunktura w Gospodarce Światowej a Rynki Żeglugowe i Portowe; Salmonowicz, H., Ed.; Wydawnictwo Kreos: Szczecin, Poland, 2009; pp. 351–358. [Google Scholar]
  183. Rzhetsky, A.; Nei, M. Statistical Properties of the Ordinary Least-Squares, Generalized Least-Squares, and Minimum-Evolution Methods of Phylogenetic Inference. J. Mol. Evol. 1992, 35, 367–375. [Google Scholar] [CrossRef]
  184. Stone, M.; Brooks, R.J. Continuum Regression: Cross-Validated Sequentially Constructed Prediction Embracing Ordinary Least Squares, Partial Least Squares and Principal Components Regression. J. R. Stat. Soc. Ser. B 1990, 52, 237–258. [Google Scholar] [CrossRef]
  185. Egbo, M.N.; Bartholomewew, D.C. Forecasting Students’ Enrollment Using Neural Networks and Ordinary Least Squares Regression Models. J. Adv. Stat. 2018, 3, 45–57. [Google Scholar] [CrossRef]
  186. Sanchez, J. Estimating Detection Limits in Chromatography from Calibration Data: Ordinary Least Squares Regression vs. Weighted Least Squares. Separations 2018, 5, 49. [Google Scholar] [CrossRef] [Green Version]
  187. Kubiczek, J. Corporate Bond Market in Poland—Prospects for Development. J. Risk Financ. Manag. 2020, 13, 306. [Google Scholar] [CrossRef]
  188. Cano, J.; O’neill, W.D.; Penn, R.D.; Blair, N.P.; Kashani, A.H.; Ameri, H.; Kaloostian, C.L.; Shahidi, M. Classification of Advanced and Early Stages of Diabetic Retinopathy from Non-Diabetic Subjects by an Ordinary Least Squares Modeling Method Applied to OCTA Images. Biomed. Opt. Express 2020, 11, 4666–4678. [Google Scholar] [CrossRef] [PubMed]
  189. Barrio, G.; Pulido, J.; Bravo, M.J.; Lardelli-Claret, P.; Jiménez-Mejías, E.; de la Fuente, L. An Example of the Usefulness of Joinpoint Trend Analysis for Assessing Changes in Traffic Safety Policies. Accid. Anal. Prev. 2015, 75, 292–297. [Google Scholar] [CrossRef]
  190. Caloiero, T.; Coscarelli, R.; Ferrari, E. Application of the Innovative Trend Analysis Method for the Trend Analysis of Rainfall Anomalies in Southern Italy. Water Resour. Manag. 2018, 32, 4971–4983. [Google Scholar] [CrossRef]
  191. Wang, Y.; Xu, Y.; Tabari, H.; Wang, J.; Wang, Q.; Song, S.; Hu, Z. Innovative Trend Analysis of Annual and Seasonal Rainfall in the Yangtze River Delta, Eastern China. Atmos. Res. 2020, 231, 104673. [Google Scholar] [CrossRef]
  192. Panda, A.; Sahu, N. Trend Analysis of Seasonal Rainfall and Temperature Pattern in Kalahandi, Bolangir and Koraput Districts of Odisha, India. Atmos. Sci. Lett. 2019, 20, e932. [Google Scholar] [CrossRef] [Green Version]
  193. Pourghasemi, H.R.; Pouyan, S.; Heidari, B.; Farajzadeh, Z.; Fallah Shamsi, S.R.; Babaei, S.; Khosravi, R.; Etemadi, M.; Ghanbarian, G.; Farhadi, A.; et al. Spatial Modeling, Risk Mapping, Change Detection, and Outbreak Trend Analysis of Coronavirus (COVID-19) in Iran (Days between 19 February and 14 June 2020). Int. J. Infect. Dis. 2020, 98, 90–108. [Google Scholar] [CrossRef]
  194. Murugesan, B.; Karuppannan, S.; Mengistie, A.T.; Ranganathan, M.; Gopalakrishnan, G. Distribution and Trend Analysis of COVID-19 in India: Geospatial Approach. J. Geogr. Stud. 2020, 4, 1–9. [Google Scholar] [CrossRef]
  195. Stedman, M.; Davies, M.; Lunt, M.; Verma, A.; Anderson, S.G.; Heald, A.H. A Phased Approach to Unlocking during the COVID-19 Pandemic—Lessons from Trend Analysis. Int. J. Clin. Pract. 2020, 74. [Google Scholar] [CrossRef]
  196. Allen, J.F. Towards a General Theory of Action and Time. Artif. Intell. 1984, 23, 123–154. [Google Scholar] [CrossRef]
  197. Kowalski, R.; Sergot, M. A Logic-Based Calculus of Events. In Foundations of Knowledge Base Management; Springer: Berlin/Heidelberg, Germany, 1989; pp. 23–55. [Google Scholar] [CrossRef]
  198. van Harmelen, F.; Lifschitz, V.; Porter, B. Handbook of Knowledge Representation; Elsevier: Amsterdam, The Netherlands, 2008; ISBN 0080557023. [Google Scholar]
  199. Fisher, M. An Introduction to Practical Formal Methods Using Temporal Logic; John Wiley & Sons: Hoboken, NJ, USA, 2011; ISBN 1119991463. [Google Scholar]
  200. Archibald, R.C. Time as a Fourth Dimension. Bull. Am. Math. Soc. 1914, 20, 409–412. [Google Scholar] [CrossRef] [Green Version]
  201. Friedman, W. About Time: Inventing the Fourth Dimension; The MIT Press: Cambridge, MA, USA, 1990; ISBN 0-262-06133-3. [Google Scholar]
  202. Walker, J. Time as the Fourth Dimension in the Globalization of Higher Education. J. High. Educ. 2009, 80, 483–509. [Google Scholar] [CrossRef]
  203. Shoham, Y. Reasoning about Change: Time and Causation from the Standpoint of Artificial Intelligence; MIT Press: Cambridge, MA, USA, 1987. [Google Scholar]
  204. Liao, S.; Chen, Y.-J.; Deng, M. Mining Customer Knowledge for Tourism New Product Development and Customer Relationship Management. Expert Syst. Appl. 2010, 37, 4212–4223. [Google Scholar] [CrossRef]
  205. Rajagopal, S. Customer Data Clustering Using Data Mining Technique. Int. J. Database Manag. Syst. 2011, 3, 1–11. [Google Scholar]
  206. Miguéis, V.L.; Camanho, A.S.; Falcão-Cunha, J.E. Customer Data Mining for Lifestyle Segmentation. Expert Syst. Appl. 2012, 39, 9359–9366. [Google Scholar] [CrossRef]
  207. Hassan, M.; Tabasum, M. Customer Profiling and Segmentation in Retail Banks Using Data Mining Techniques. Int. J. Adv. Res. Comput. Sci. 2018, 9, 24–29. [Google Scholar] [CrossRef]
  208. Pan, S.; Giannikas, V.; Han, Y.; Grover-Silva, E.; Qiao, B. Using Customer-Related Data to Enhance e-Grocery Home Delivery. Ind. Manag. Data Syst. 2017, 117, 1917–1933. [Google Scholar] [CrossRef] [Green Version]
  209. Birjali, M.; Beni-Hssane, A.; Erritali, M. Analyzing Social Media through Big Data Using InfoSphere BigInsights and Apache Flume. Procedia Comput. Sci. 2017, 113, 280–285. [Google Scholar] [CrossRef]
  210. Mars, A.; Gouider, M.S. Big Data Analysis to Features Opinions Extraction of Customer. Procedia Comput. Sci. 2017, 112, 906–916. [Google Scholar] [CrossRef]
  211. Chen, R.; Wang, Q.; Xu, W. Mining User Requirements to Facilitate Mobile App Quality Upgrades with Big Data. Electron. Commer. Res. Appl. 2019, 38, 100889. [Google Scholar] [CrossRef]
  212. Bala-Anand, M.; Karthikeyan, N.; Karthik, S. Envisioning Social Media Information for Big Data Using Big Vision Schemes in Wireless Environment. Wirel. Pers. Commun. 2019, 109, 777–796. [Google Scholar] [CrossRef]
  213. Rao, H.K.; Zeng, Z.; Liu, A.P. Research on Personalized Referral Service and Big Data Mining for E-Commerce with Machine Learning. In Proceedings of the 2018 4th International Conference on Computer and Technology Applications, ICCTA 2018, Istanbul, Turkey, 3–5 May 2018; Institute of Electrical and Electronics Engineers Inc.: New York, NY, USA, 27 June 2018; pp. 35–38. [Google Scholar]
  214. van Nguyen, T.; Zhou, L.; Chong, A.Y.L.; Li, B.; Pu, X. Predicting Customer Demand for Remanufactured Products: A Data-Mining Approach. Eur. J. Oper. Res. 2020, 281, 543–558. [Google Scholar] [CrossRef]
  215. Joung, J.; Jung, K.; Ko, S.; Kim, K. Customer Complaints Analysis Using Text Mining and Outcome-Driven Innovation Method for Market-Oriented Product Development. Sustainability 2018, 11, 40. [Google Scholar] [CrossRef] [Green Version]
  216. Hassani, H.; Huang, X.; Silva, E. Digitalisation and Big Data Mining in Banking. Big Data Cogn. Comput. 2018, 2, 18. [Google Scholar] [CrossRef] [Green Version]
  217. Hassani, H.; Beneki, C.; Unger, S.; Mazinani, M.T.; Yeganegi, M.R. Text Mining in Big Data Analytics. Big Data Cogn. Comput. 2020, 4, 1. [Google Scholar] [CrossRef] [Green Version]
  218. Kumar, A.; Dabas, V. A Social Media Complaint Workflow Automation Tool Using Sentiment Intelligence. In Proceedings of the World Congress on Engineering 2016, London, UK, 29 June–1 July 2016; pp. 176–181. [Google Scholar]
  219. Cominola, A.; Nguyen, K.; Giuliani, M.; Stewart, R.A.; Maier, H.R.; Castelletti, A. Data Mining to Uncover Heterogeneous Water Use Behaviors from Smart Meter Data. Water Resour. Res. 2019, 55, 9315–9333. [Google Scholar] [CrossRef] [Green Version]
  220. Dogan, O.; Oztaysi, B.; Fernandez-Llatas, C. Segmentation of Indoor Customer Paths Using Intuitionistic Fuzzy Clustering: Process Mining Visualization. J. Intell. Fuzzy Syst. 2020, 38, 675–684. [Google Scholar] [CrossRef]
  221. Dogan, O.; Bayo-Monton, J.-L.; Fernandez-Llatas, C.; Oztaysi, B. Analyzing of Gender Behaviors from Paths Using Process Mining: A Shopping Mall Application. Sensors 2019, 19, 557. [Google Scholar] [CrossRef] [PubMed] [Green Version]
  222. Liu, S.; Lee, I. Discovering Sentiment Sequence within Email Data through Trajectory Representation. Expert Syst. Appl. 2018, 99, 1–11. [Google Scholar] [CrossRef]
  223. Wang, F.; Li, M.; Mei, Y.; Li, W. Time Series Data Mining: A Case Study with Big Data Analytics Approach. IEEE Access 2020, 8, 14322–14328. [Google Scholar] [CrossRef]
  224. Li, Q.; Li, S.; Zhang, S.; Hu, J.; Hu, J. A Review of Text Corpus-Based Tourism Big Data Mining. Appl. Sci. 2019, 9, 3300. [Google Scholar] [CrossRef] [Green Version]
  225. Srividya, K.; Sowjanya, A.M.; Kumar, T.A. Sentiment Analysis of Facebook Data Using Naïve Bayes Classifier. Int. J. Comput. Sci. Inf. Secur. 2017, 15, 179–186. [Google Scholar]
  226. Wamba, S.F.; Gunasekaran, A.; Akter, S.; Ren, S.J.; Dubey, R.; Childe, S.J. Big Data Analytics and Firm Performance: Effects of Dynamic Capabilities. J. Bus. Res. 2017, 70, 356–365. [Google Scholar] [CrossRef] [Green Version]
  227. Radcliffe, J. Leverage a Big Data Maturity Model to Build Your Big Data Roadmap; Radcliffe Advisory Services Ltd.: Guildford, UK, 2014. [Google Scholar]
Figure 1. The summary of big data analytics on social media. Source: based on Ghani et al. [99].
Applsci 11 06993 g001
Figure 2. Consumer behavior as a sequence of events. Source: based on Thejaswini et al. [143].
Applsci 11 06993 g002
Figure 3. The marketing mix framework for big data management. Source: Fan et al. [97].
Applsci 11 06993 g003
Figure 4. Conceptual classification of big data challenges. Source: based on Sivarajah et al. [151].
Applsci 11 06993 g004
Figure 5. Documents found in Scopus for the “big data analytics” key phrase by year of publication.
Applsci 11 06993 g005
Figure 6. Documents found in Scopus for the “big data analytics” key phrase by subject area.
Applsci 11 06993 g006
Figure 7. Documents found in Scopus for the “big data analytics” key phrase by document type.
Applsci 11 06993 g007
Figure 8. Documents found in Scopus for the “big data mining” key phrase by year of publication.
Applsci 11 06993 g008
Figure 9. Documents found in Scopus for the “big data mining” key phrase by subject area.
Applsci 11 06993 g009
Figure 10. Documents found in Scopus for the “big data mining” key phrase by document type.
Applsci 11 06993 g010
Figure 11. Documents found in Scopus for the “temporal big data” key phrase by year of publication.
Applsci 11 06993 g011
Figure 12. Documents found in Scopus for the “temporal big data” key phrase by subject of publication.
Applsci 11 06993 g012
Figure 13. Documents found in Scopus for the “temporal big data” key phrase by document type.
Applsci 11 06993 g013
Figure 14. Time series for articles from the Scopus database corresponding to the phrase “big data analytics” (for the years 2010–2020) with the power trendline (with the highest value of R2) and forecasted values (absolute) for the years 2021–2025.
Applsci 11 06993 g014
Figure 15. Time series for articles from the Scopus database corresponding to the phrase “big data mining” (for the years 2012–2020) with the power trendline (with the highest value of R2) and forecasted values (absolute) for the years 2021–2025.
Applsci 11 06993 g015
Figure 16. Time series for articles from the Scopus database corresponding to the phrase “temporal big data” (for the years 2014–2020) with the power trendline (with the highest value of R2) and forecasted values (absolute) for the years 2021–2025.
Applsci 11 06993 g016
Table 1. Equations of trendlines for the Scopus dataset corresponding to the expression “big data analytics” (for the years 2012–2020).
TrendEquationR2 Value
exponential y = 4.0587 e 0.6602 x 0.8040
linear y = 179.85 x 381.8 0.9378
logarithmic y = 729.94 l n ( x ) 464.15 0.7797
polynomial (2nd order) y = 2.8706 x 2 + 145.4 x 307.16 0.9396
power y = 1.2414 x 3.234 0.97381
1 The value in bold is the highest R2 value which is chosen for the further analysis.
Table 2. Summary of the number of articles corresponding to the phrase “big data analytics” in the Scopus database in 2010–2020 along with the prediction of the number of articles in 2021–2025.
YearNumber of Articles
20101
20119
201235
2013179
2014342
2015622
2016983
20171176
20181374
20191573
20201376
20213836
20224970
20236316
20247895
202597281
1 The rows in italics are the power trend prediction values. The prediction values are absolute.
Table 3. Equations of trendlines for the Scopus dataset corresponding to the expression “big data mining” (for the years 2012–2020).
TrendEquationR2 Value
exponential y = 11.357 e 0.3569 x 0.8783
linear y = 24.433 x 25.722 0.9332
logarithmic y = 86.487 l n ( x ) 26.577 0.8066
polynomial (2nd order) y = 0.855 x 2 + 15.884 x 10.048 0.9391
power y = 8.7755 x 1.4357 0.98061
1 The value in bold is the highest R2 value which is chosen for the further analysis.
Table 4. Summary of the number of articles corresponding to the phrase “big data mining” in the Scopus database in 2012–2020 along with the prediction of the number of articles in 2021–2025.
YearNumber of Articles
20128
201328
201438
201573
201695
201791
2018147
2019206
2020182
2021239
2022274
2023311
2024349
20253881
1 The rows in italics are the power trend prediction values. The prediction values are absolute.
Table 5. Equations of trendlines for the Scopus dataset corresponding to the expression “temporal big data” (for the years 2014–2020).
TrendEquationR2 Value
exponential y = 3.4451 e 0.2502 x 0.7894
linear y = 2.1786 x + 2 0.8132
logarithmic y = 6.8921 l n ( x ) + 2.3205 0.8179
polynomial (2nd order) y = 0.25 x 2 + 4.1786 x 1 0.8453
power y = 3.3644 x 0.8412 0.89681
1 The value in bold is the highest R2 value which is chosen for the further analysis.
Table 6. Summary of the number of articles corresponding to the phrase “temporal big data” in the Scopus database in 2014–2020 along with the prediction of the number of articles in 2021–2025.
YearNumber of Articles
20143
20158
20167
201710
201815
201918
202014
202119
202221
202323
202425
2025271
1 The rows in italics are the power trend prediction values. The prediction values are absolute.
Publisher’s Note: MDPI stays neutral with regard to jurisdictional claims in published maps and institutional affiliations.

