Article

Broadband Strong-Motion Prediction for Future Nankai-Trough Earthquakes Using Statistical Green’s Function Method and Subsequent Building Damage Evaluation

1
Transportation Institute, Inner Mongolia University, Inner Mongolia 010070, China
2
College of Geographical Science, Inner Mongolia Normal University, Inner Mongolia 010022, China
3
DPRI, Kyoto University, Kyoto 606-0011, Japan
*
Author to whom correspondence should be addressed.
Appl. Sci. 2021, 11(15), 7041; https://doi.org/10.3390/app11157041
Submission received: 29 June 2021 / Revised: 23 July 2021 / Accepted: 26 July 2021 / Published: 30 July 2021
(This article belongs to the Special Issue Advances in Multihazard Science)

Abstract

:

Featured Application

The proposed method is applicable to the quantitative earthquake disaster impact evaluations in the areas of high seismic risk.

Abstract

We used the Green’s function summation method together with the randomly perturbed asperity sources to sum up broadband statistical Green’s functions of a moderate-size source and predict strong ground motions due to the expected M8.1 to 8.7 Nankai-Trough earthquakes along the southern coast of western Japan. We successfully simulated seismic intensity distributions similar to the past earthquakes and strong ground motions similar to the empirical attenuation relations of peak ground acceleration and velocity. Using these results, we predicted building damage by non-linear response analyses and find that at the regions close to the source, as well as regions with relatively thick, soft sediments such as the shoreline and alluvium valleys along the rivers, there is a possibility of severe damage regardless of the types of buildings. Moreover, the predicted damage ratios for buildings built before 1981 are much higher than those built after because of the significant code modifications in 1981. We also find that the damage ratio is highest for steel buildings, followed by wooden houses, and then reinforced concrete buildings.

1. Introduction

Off the Pacific coast of Tohoku, Japan, an earthquake of Mw 9.0 struck at 2:46 p.m., 11 March 2011, in the large regions of northeastern Japan. The ruptured area of this mega-thrust earthquake spanned a wide region from offshore Sanriku to offshore Ibaraki areas of the Pacific coast of Japan. More than 22,000 people were killed or missing, primarily due to the tsunami, and devastating damage was incurred, particularly along the Pacific coast of Tohoku. Although such massive M9-class earthquakes are expected to occur very infrequently, typical M8-class subduction-zone earthquakes have a relatively high probability of happening and still, a wide region in the order of a few hundred kilometers will be affected. In addition to the direct damage, such as casualties and building damage from strong ground motions, landslides, liquefaction, subsidence, and tsunami, there is secondary damage including fires, damage to industrial facilities, and disruption of transportation. As a result, the economy will be affected at the national level. The hypocenters are distributed along the Pacific coast of the Japanese islands, and taking earthquake disaster prevention measures suitable for each region is considered an urgent task all over Japan.
The possibility that a mega-thrust earthquake of a separated segment at the Tokai, Tonankai, or Nankai region along the Nankai Trough will happen within the next 30 years is estimated to be around 70~80% [1]. If one happens, severe damage by strong shaking and the subsequent tsunami is anticipated over a wide area, especially at the Pacific coast from the Tokai to Kyushu regions near the subducting Philippine Sea plate. To consider effective countermeasures, damage prediction that considers strong-motion characteristics and their building response is necessary to quantitatively evaluate the impact of the building damage from hypothesized earthquake scenarios that could happen in the future. There are still many old buildings that do not have sufficient earthquake resistance capacities in Japan. Grasping earthquake resistance performance of these actual buildings to predict damage is very important. Rigorous investigations after the 1995 Hyogo-ken Nanbu earthquake made damage prediction with considerable accuracy possible (e.g., Nagato and Kawase [2,3,4], Matsushima and Kawase [5,6]). However, several issues remain when predicting strong ground motions of subduction-zone earthquakes; for example, how to express the complex rupture process that can contribute various characteristics of strong ground motions in a wide frequency range. Moreover, the extremely important component to evaluate total damage using a quantitative damage prediction model of structures, rather than the conventional vulnerability function approach [7], and take damage mitigation measures based on the structural-type dependent evaluation is currently far from quantitative.
For strong motion prediction, various methods have been developed toward a more quantitative prediction for a wider range of frequencies. As a gross categorization, we have theoretical methods, semi-empirical methods, and empirical methods. The accuracy of the theoretical methods depends on the accuracy of the velocity model used, which may need significant efforts to predict ground motions in a broadband frequency range [8,9]. The accuracy of the empirical method, such as the ground motion prediction equation (GMPE) [10,11], depends on the density of the observed data that constrain empirical relationships. Because of the infrequent occurrence of mega-thrust events, the density of observed data with large magnitude is far from ideal. In this regard, the semi-empirical method where moderate-sized earthquake ground motions are used as empirical Green’s functions and the summation with space and time are performed to predict strong motions from a mega-thrust event would be the best, for its broadband characteristics are based on the observed ground motions and the abundance of observed data to choose from [12,13,14,15,16]. Therefore, we follow them with different representations of the statistical Green’s function used.
First, quantitative prediction of strong ground motions in a wide frequency range is provided based on the Green’s function summation technique using a statistical Green’s function valid from as low as 0.1 Hz up to 20 Hz derived from the observed strong motions in Japan [17]. Subduction-zone mega-thrust earthquakes along the Nankai Trough attract much concern and may lead to a chain rupture to adjacent fault segments (cascade model). Therefore, strong ground motions from hypothesized individual and chain ruptures of the Tokai, Tonankai, and Nankai segments in southwestern Japan are predicted in this paper. The predicted strong ground motions are compared with the seismic intensity distributions of past earthquakes. Their peak values in acceleration and velocity are also compared with empirical predictions from the well-calibrated GMPE [10]. Second, the predicted strong ground motions are used to estimate the damage of building structures using nonlinear response analysis models reflecting the characteristics of the seismic input and building types and their construction ages [2,3,4]. Finally, the merit of the proposed procedure for building damage prediction is discussed with special reference to the retrofitting policies for earthquake resistance performance of existing buildings based on the findings in this paper.

2. Development of a Statistical Green’s Function

To predict strong ground motions over a wide frequency range, Ho and Kawase [17] developed a method to create a statistical Green’s function that is valid in the frequency range from 0.12 to 20 Hz based on the strong motion database in Japan. Their empirical modeling of the dataset based on the generalized inversion technique of Kawase and Matsuo [18] covered the entirety of Japan and investigated 110 earthquakes (with 25 inland earthquakes, 34 subduction-zone intraplate earthquakes, and 51 subduction-zone interplate earthquakes) between August 1996 and March 2005, where the magnitude M ≥ 5.5, the hypocentral depth ≤ 60 km, the maximum acceleration ≤ 200 cm/s2, and the maximum distance to a hypocenter ≤ 400 km. Crustal earthquakes are defined by a hypocentral depth less than 25 km and an inland hypocenter location. Plate-boundary earthquakes have a hypocentral depth of more than 25 km, are low-angle reverse fault according to the fault mechanism solution by Harvard CMT [19] (before 1997) or F-net [20] (after 1997), and the slip direction is along the plate motion. The intraplate earthquakes have a hypocentral depth of more than 25 km and the fault mechanism solution is not a low angle reverse fault as in the interplate earthquakes. The K-NET, KiK-net [21], and Japan Meteorological Agency (JMA) network [22] data observed at 1684 sites for 110 earthquakes were used to separate source, path, and site terms in both spectral and envelope shapes first, and then the convolution scheme for a statistical Green’s function from a specific source valid up to a long period (<8 s) was derived. Using the estimated source, path, and site characteristics to evaluate strong ground motion over the entirety of Japan allows us to generate a quantitative input seismic motion for design or damage evaluation at any strong motion observation sites that considers the earthquake type and regional dependence in the source and path characteristics.
Figure 1 shows how the entirety of Japan is separated into six regions and where measurement points are located. Regions are determined based on the location distribution of crustal, intraplate, and interplate earthquakes, regional attenuation difference across the volcanic front, and the Itoigawa–Shizuoka Tectonic Line, as in Kawase and Matsuo [18]. Details of the Green’s function construction and its validation exercise, including modeling of time-varying characteristics, can be found in Ho and Kawase [17], so here we only briefly explain the scheme used.
First, the logarithm of the observed Fourier spectra Fij as a function of frequency from an event i at a site j can be expressed as
logF ij = logS i n l ( i ) logX ij + k b l ( i ) k X ijk + logG j
where Si is the source spectrum, nl(i) is the geometrical spreading factor, bl(i)k is the region-specific intrinsic and scattering attenuation, and Gj is the site factor. We use l(i) to describe earthquake types (C: crustal, I: intraplate, and B: plate boundary), while we use k to describe regions with different attenuations (Figure 1d). Xij is the hypocentral distance, whereas Xijk is a part of the distance within the k-th region. The statistical characteristics of the Fourier spectra are extracted in the range of 0.12 to 20 Hz, in which the root mean square values of NS and EW components are used to reduce the influence of the radiation characteristics from the source. Fourier spectra were smoothed using a 0.05 Hz Parzen window. Because at least one constraint condition is required for the spectral inversion based on Equation (1), the site coded as YMGH01 of KiK-net is used as the reference observation site, and the amplification factor calculated by the 1D multiple-reflection theory [8] from the inverted ground structure at YMGH01 is given as a constraint. Therefore, the site characteristics of the other sites can be obtained as a ratio relative to this reference. Because we extracted the site amplification factor from the observed spectra at YMGH01 relative to the bottommost layer, whose S-wave velocity (Vs) is more than 3400 m/s, the obtained site characteristics of the other sites are considered to be absolute values from the seismological bedrock. A more complete picture of the delineated spectral characteristics with additional recent events can be found in Nakano et al. [23], where we obtained statistical properties to model the source, path, and site characteristics. In this study, however, we used directly a source spectrum separated from a selected moderate-sized event without using any moment-source spectra regressions in our statistical Green’s function method to predict strong ground motions for mega-thrust earthquakes.
The time-varying characteristics of seismic motion are characterized by the envelope form and its duration or phase characteristics. In this study, the time-varying characteristics are modeled by the envelope function W(t) of Boore [12] and we identified its parameters. Boore’s model is specified by the duration Td, the time to the maximum amplitude Tr, ε the ratio of Tr to Td, and η the ratio of the amplitude at time Td relative to the maximum amplitude. The equation of W(t) is given below.
W ( t ) = a × t b × exp ( ct ) × H ( t )
a = ( 2.7182 ε × T d ) b
b = ε × ln η [ 1 + ε × ( ln ε 1 ) ]
c = b ε × T d
H(t) in Equation (2) represents the unit Heaviside step function, and a in Equation (3) is so specified that the maximum value of the function W(t) is 1. First, the observed waveform was selected for 120 s from the onset of S-wave, and a cosine taper of 2 s was applied before and after the extracted part. The maximum value of the observed waveform was normalized to 1, and the section-wise maximum of its absolute amplitude per 1 s was taken and used to fit the envelope to W(t) with the fixed η of 1/20. The fitting target was the entire observation waveform, and the optimal value was searched by varying ε in the range of 0.05 to 0.95 in every 0.02 increments. Next, the obtained Td and Tr were regressed on the magnitude M and the hypocentral distance X. In order to eliminate the possibility of a mutual trade-off between M and X, a two-step regression analysis method was used.
As an example of the modeling of the time-varying characteristics, Figure 2 shows the relationship between Tr (or Td) and magnitude M or the distance X, as well as an example of the statistical envelope identified for a specific observed record. The resultant Tr and Td are shown in Equations (6) and (7).
logT r = 0.0943 × M + 0.5109 × logX 1.0396
logT d = 0.0884 × M + 0.6868 × logX 0.7946

3. Strong Ground Motion Prediction of the Nankai-Trough Earthquake

3.1. Modeling of the Seismogenic Fault and Analyzed Points

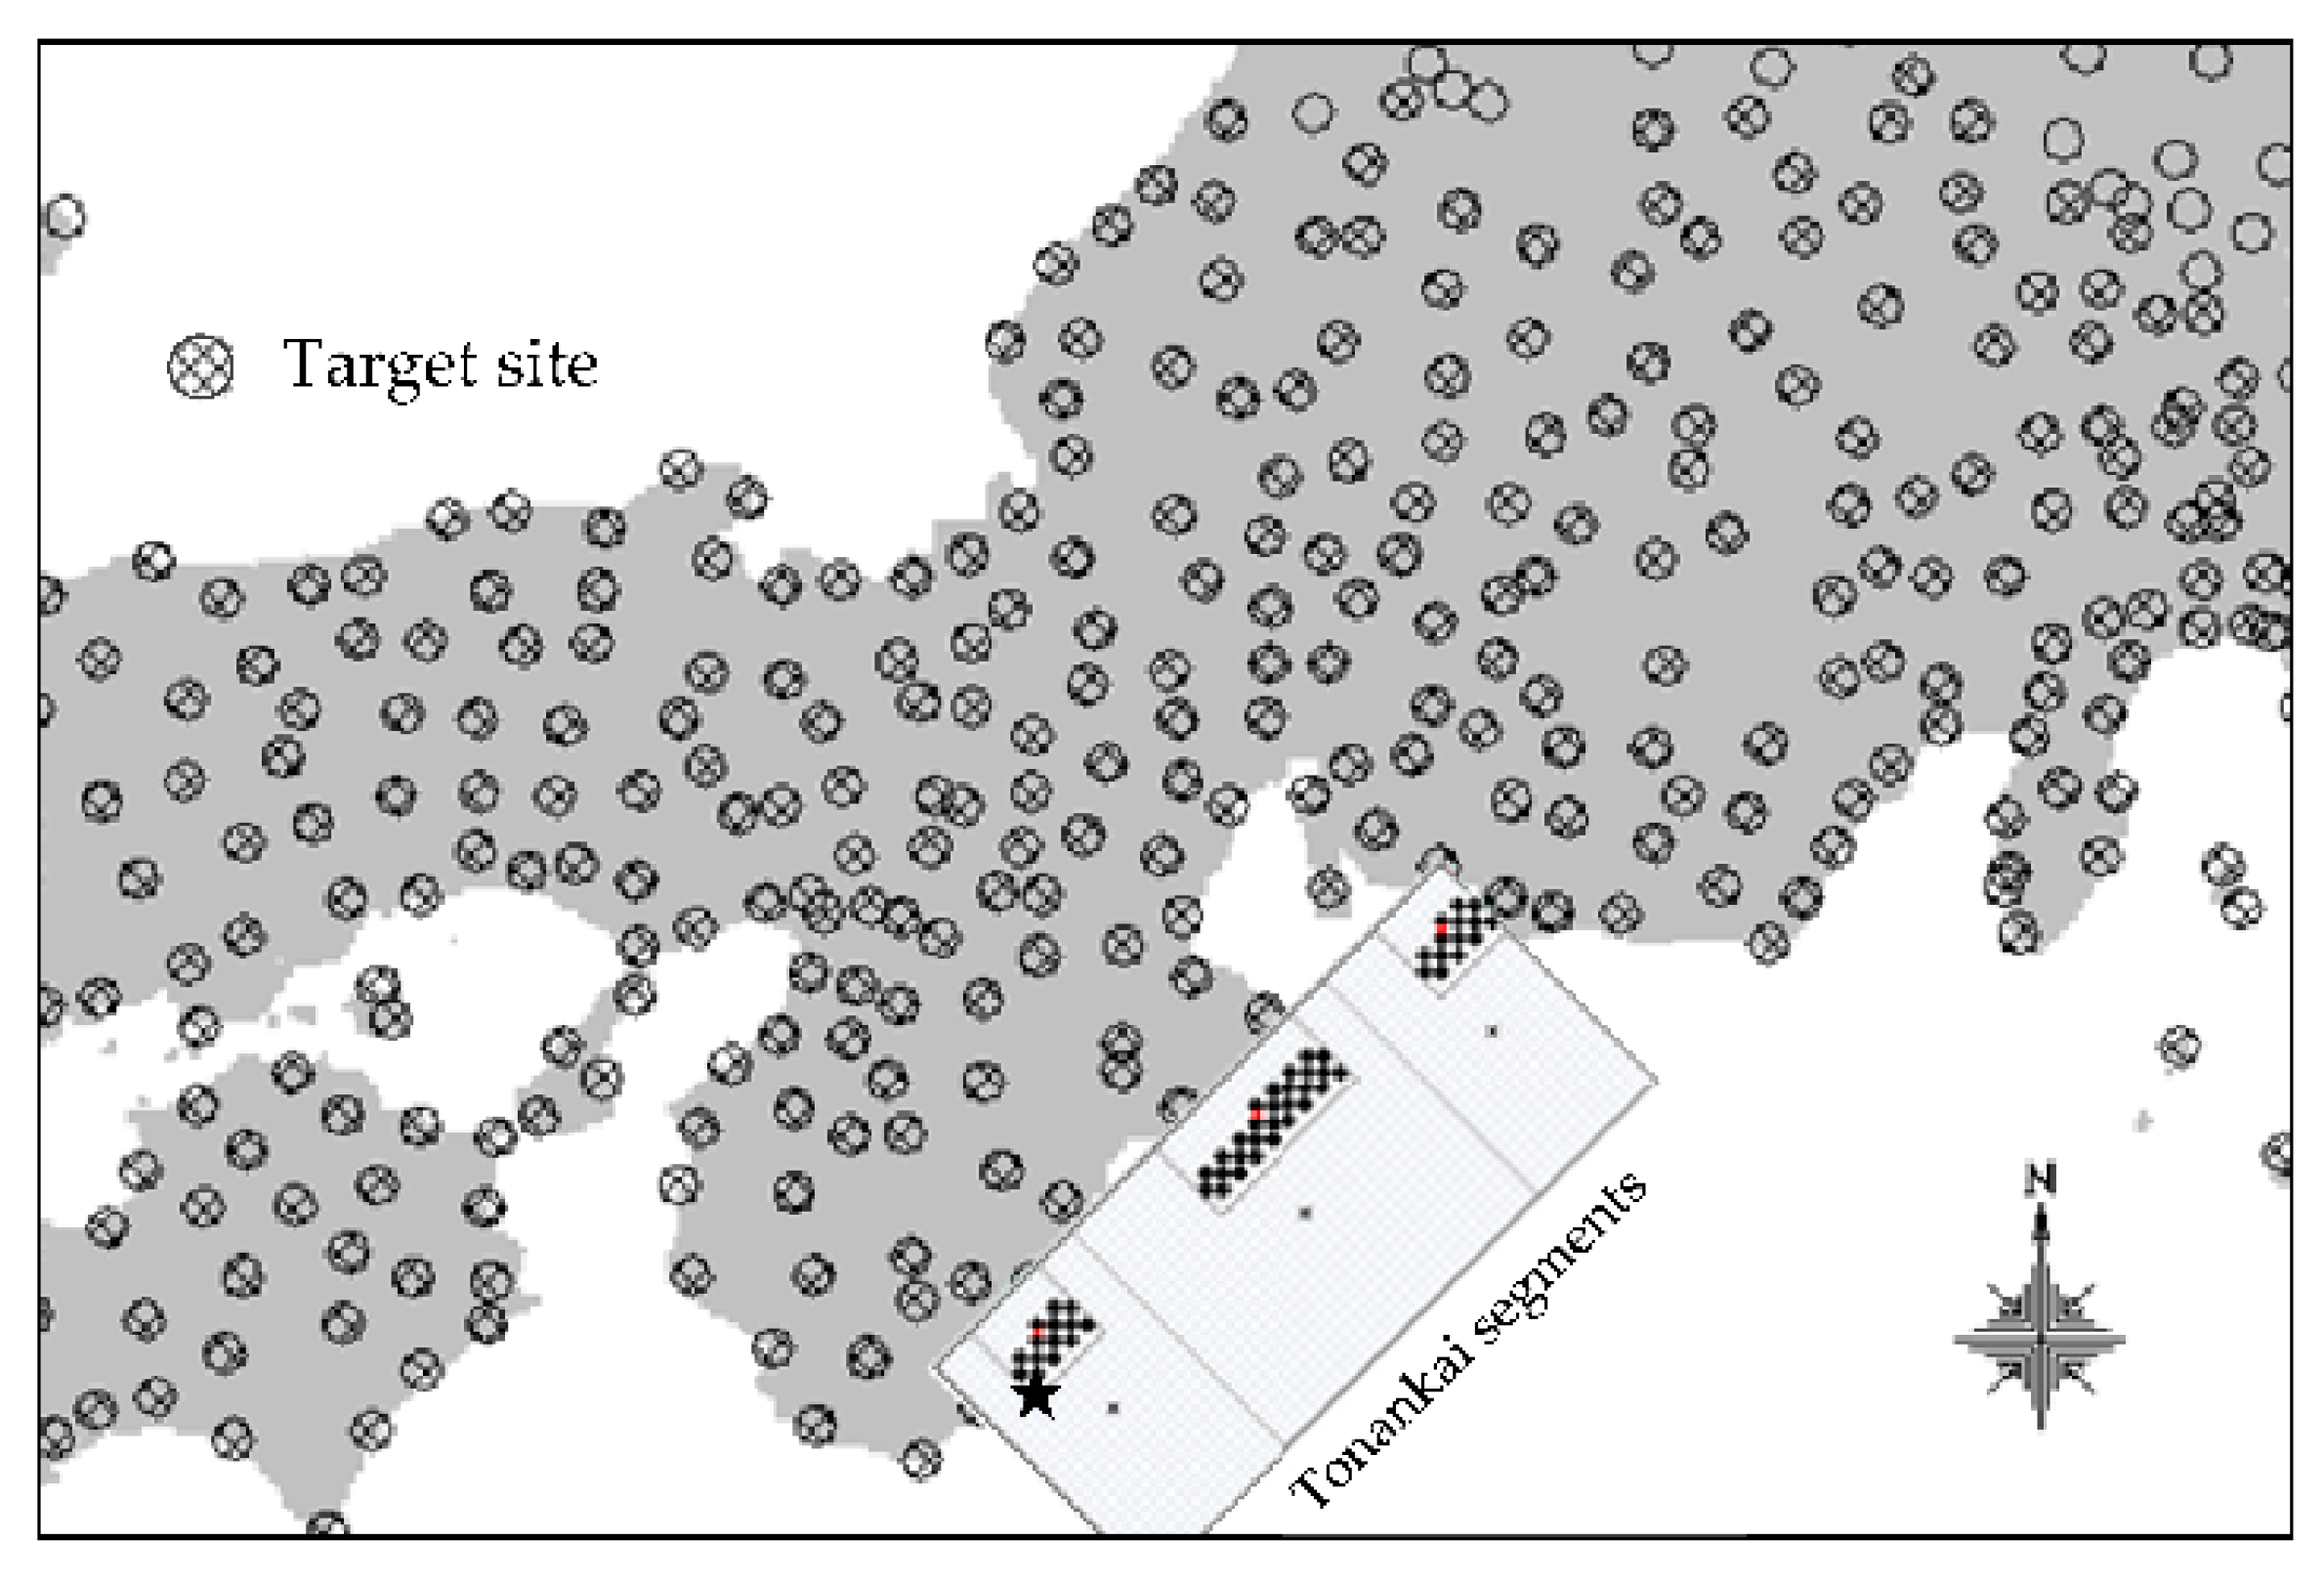
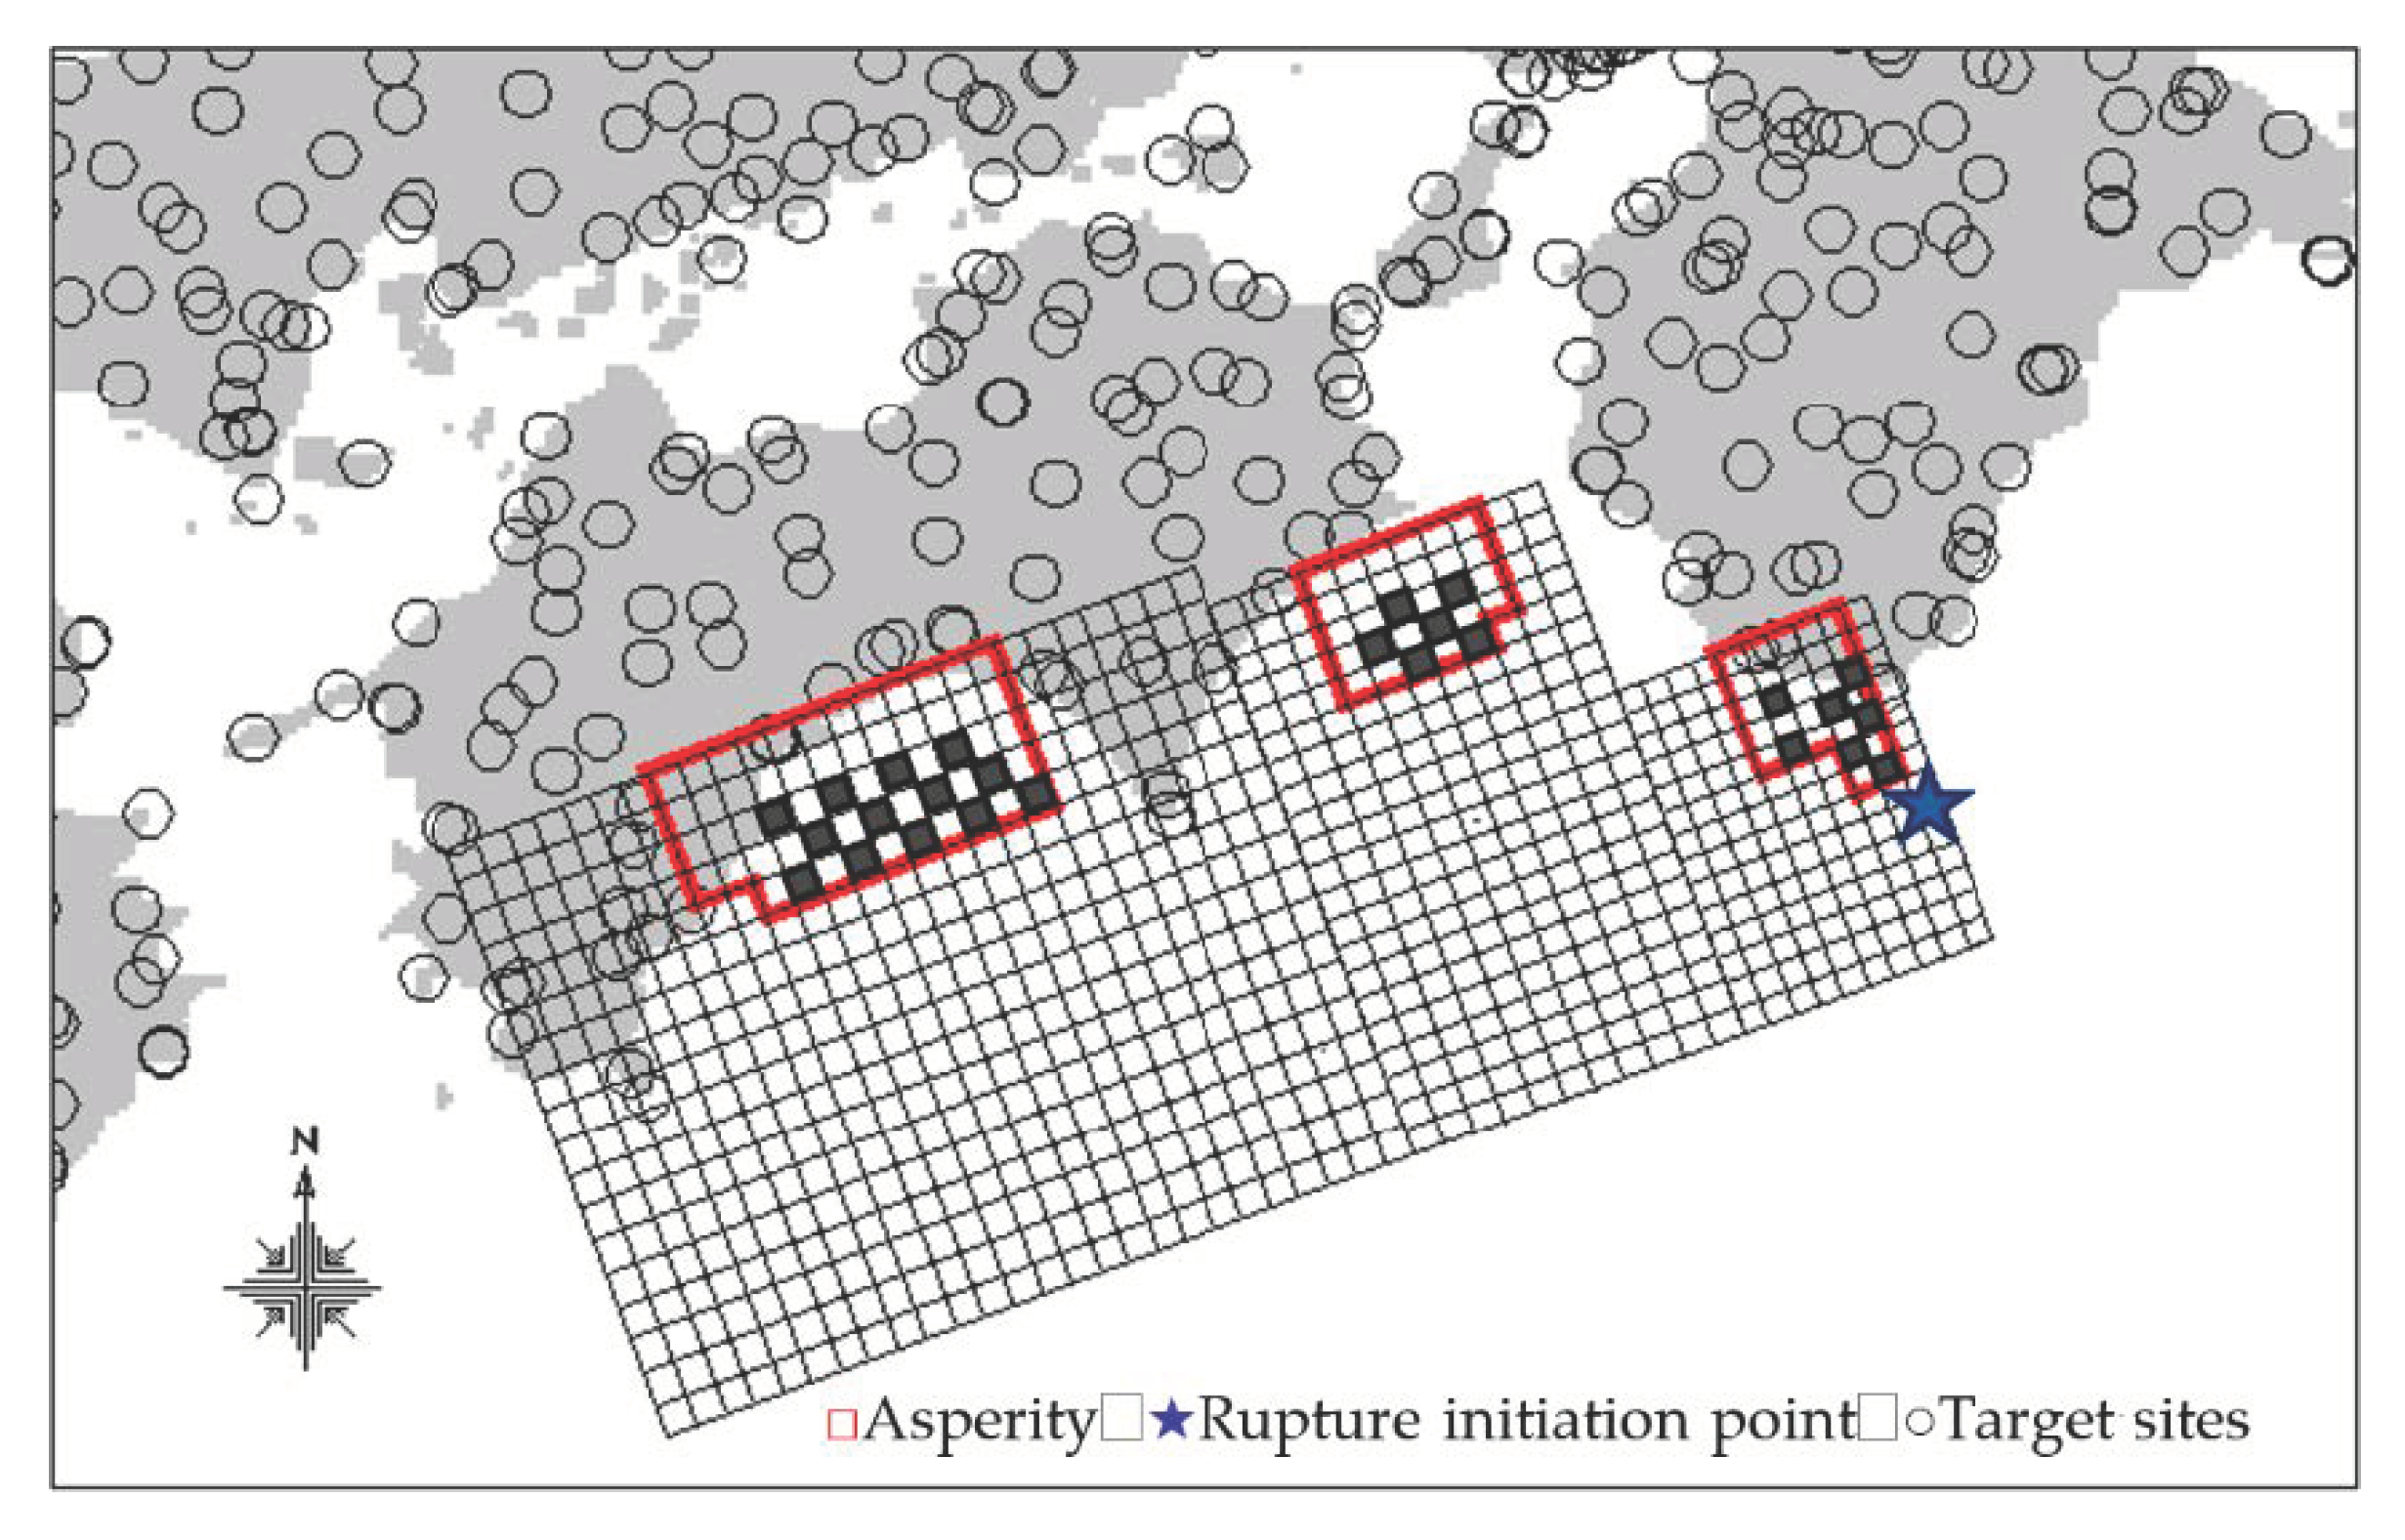
The source model of the hypothesized Tonankai earthquake that we used in this article is a non-uniform kinematic source model consisting of three large asperities and a background region. This conforms with the model proposed for the estimation of strong motions by the Headquarters for Earthquake Research Promotion (HERP) where Irikura’s recipe [24] is employed for a standardized setting procedure regarding macroscopic (outer) and microscopic (inner) fault parameters. We also refer to the model by Kawabe and Kamae [25] for the Nankai earthquake. The so-called asperity (or SMGA) model assumes that there is a non-uniform slip distribution on the fault surface, where the relative slip amount is twice as much as the average slip as Somerville et al. (1999) found from the kinematic source inversions [26]. Here, 22% of the entire fault area is considered to be asperities. As shown in Ho and Kawase [17], however, we found that if we consider only a couple of smooth asperities for a mega-thrust event, their sizes seem to be too large to radiate sufficient energy in the intermediate frequency range around 1 Hz. Therefore, we further divide the asperities into small square sections where we assign slip fluctuations with the amount of slip 1.5 times of the average asperity slip (parts denoted with ■ symbols) and the remaining areas should have slips less than the average. The earthquake moment is always conserved. The target analyzed points are K-NET, KiK-net, and JMA sites within 400 km of the assumed fault area of the Tonankai earthquake and are mostly in the Kinki and Chubu regions. Figure 3 shows the positions of asperities, together with the higher slip elements (■), in the three-segment seismogenic fault of the hypothesized Tonankai earthquake, the center of the background region (*), and the assumed rupture starting point (★). The target analyzed sites are shown as circles. Table 1 shows the major fault parameters of this Tonankai earthquake. The aforementioned statistical Green’s functions are used together with the waveform summation method by Irikura [13] to predict strong ground motions of the hypothesized Tonankai earthquake over a wide region in western Japan. As we show later, the estimated seismic intensity of the past earthquakes that repeatedly happen at the Nankai Trough (e.g., 1854 Tokai earthquake and 1944 Tonankai earthquake) was reproduced. At the same time, predicted waveforms correspond well with the empirical attenuation function [10] frequently referred to in Japan.

3.2. Waveform Summation Scheme

The strong ground motion waveform of the hypothesized Tonankai earthquake was synthesized using the estimated subduction-zone earthquake elementary source and propagation characteristics, site characteristics of each target site, and the empirical Green’s function summation method by Irikura [13]. The empirical Green’s function method is a waveform synthesis method that considers the difference in the seismic moment and stress drop between large and small earthquakes according to the ω−2 scaling law, which is shown in Equation (8).
U ( t ) = i = 1 N j = 1 N ( r / r ij ) × F ( t ) * ( C   u ij ( t ) ) F ( t ) = δ ( t t ij ) + ( 1 / n ) k = 1 ( N 1 ) n [ δ { t t ij ( k 1 ) T / ( N 1 ) n } ]     t ij = ( r ij r o ) / V s + ξ ij / V r
Here, U(t) is the mainshock waveform, u(t) is the elementary source waveform with a small moment, N is the ratio of the fault plane dimension (i.e., the length and width) between large and small earthquakes, C is the stress drop ratio, and * indicates convolution. F(t) is a correction function expressing the difference in slip time function between large and small earthquakes, δ(t) is Dirac’s delta function, and T is the rise time of a large earthquake. Further, Vs is the S-wave velocity, Vr is the rupture velocity, r is the assumed hypocentral distance between the representative elementary source and the target site, r0 is the distance between the rupture initiation point and the site, rij is the distance between each elementary source at (i,j) on the fault plane of a large earthquake and the target site, and ξij is the distance between the rupture initiation point and the elementary source, n’ is an arbitrary integer to avoid effects of artifact frequency components from constant superposition.
Regarding the correction function F(t), Miyake et al. [27] used a revised equation as Equation (9) to avoid the dip in the amplitude spectrum of the synthesized waveform, which is adopted here:
F ( t ) = δ ( t t ij ) + { 1 / n ( 1 exp ( 1 ) ) } × k = 1 ( N 1 ) n [ exp { ( k 1 ) / ( N 1 ) n } × δ { t t ij ( k 1 ) T / ( N 1 ) n } ]
The stress drop is estimated from the relation between the seismic moment M0 and corner frequency f0 as Equation (10), where β is the S-wave velocity of the seismogenic zone. The numbers of superposition of the elementary sources N and C are derived from Equations (11) and (12) as proposed in [13], where the subscript e refers to the values of the elementary sources.
Δ σ = ( f o 4.9 × 10 6 β ) 3 Μ 0
N = ( Μ 0 C × Μ oe ) 1 / 3
C = Δ σ o Δ σ oe

3.3. Waveform Synthesis and Its Validation

A statistical Green’s function was generated using the source, path, and site characteristics for each target site, as estimated in Section 2. Strong ground motion waveforms of the hypothesized Tonankai earthquake (Figure 3), a hypothesized Tokai earthquake, and a hypothesized Nankai earthquake were generated by the summation method of Irikura [13]. Then, a hypothesized consecutive rupture scenario of all the three segments (Tokai, Tonankai, and Nankai) along the Nankai Trough were evaluated by adding these three earthquake waveforms with proper time differences.
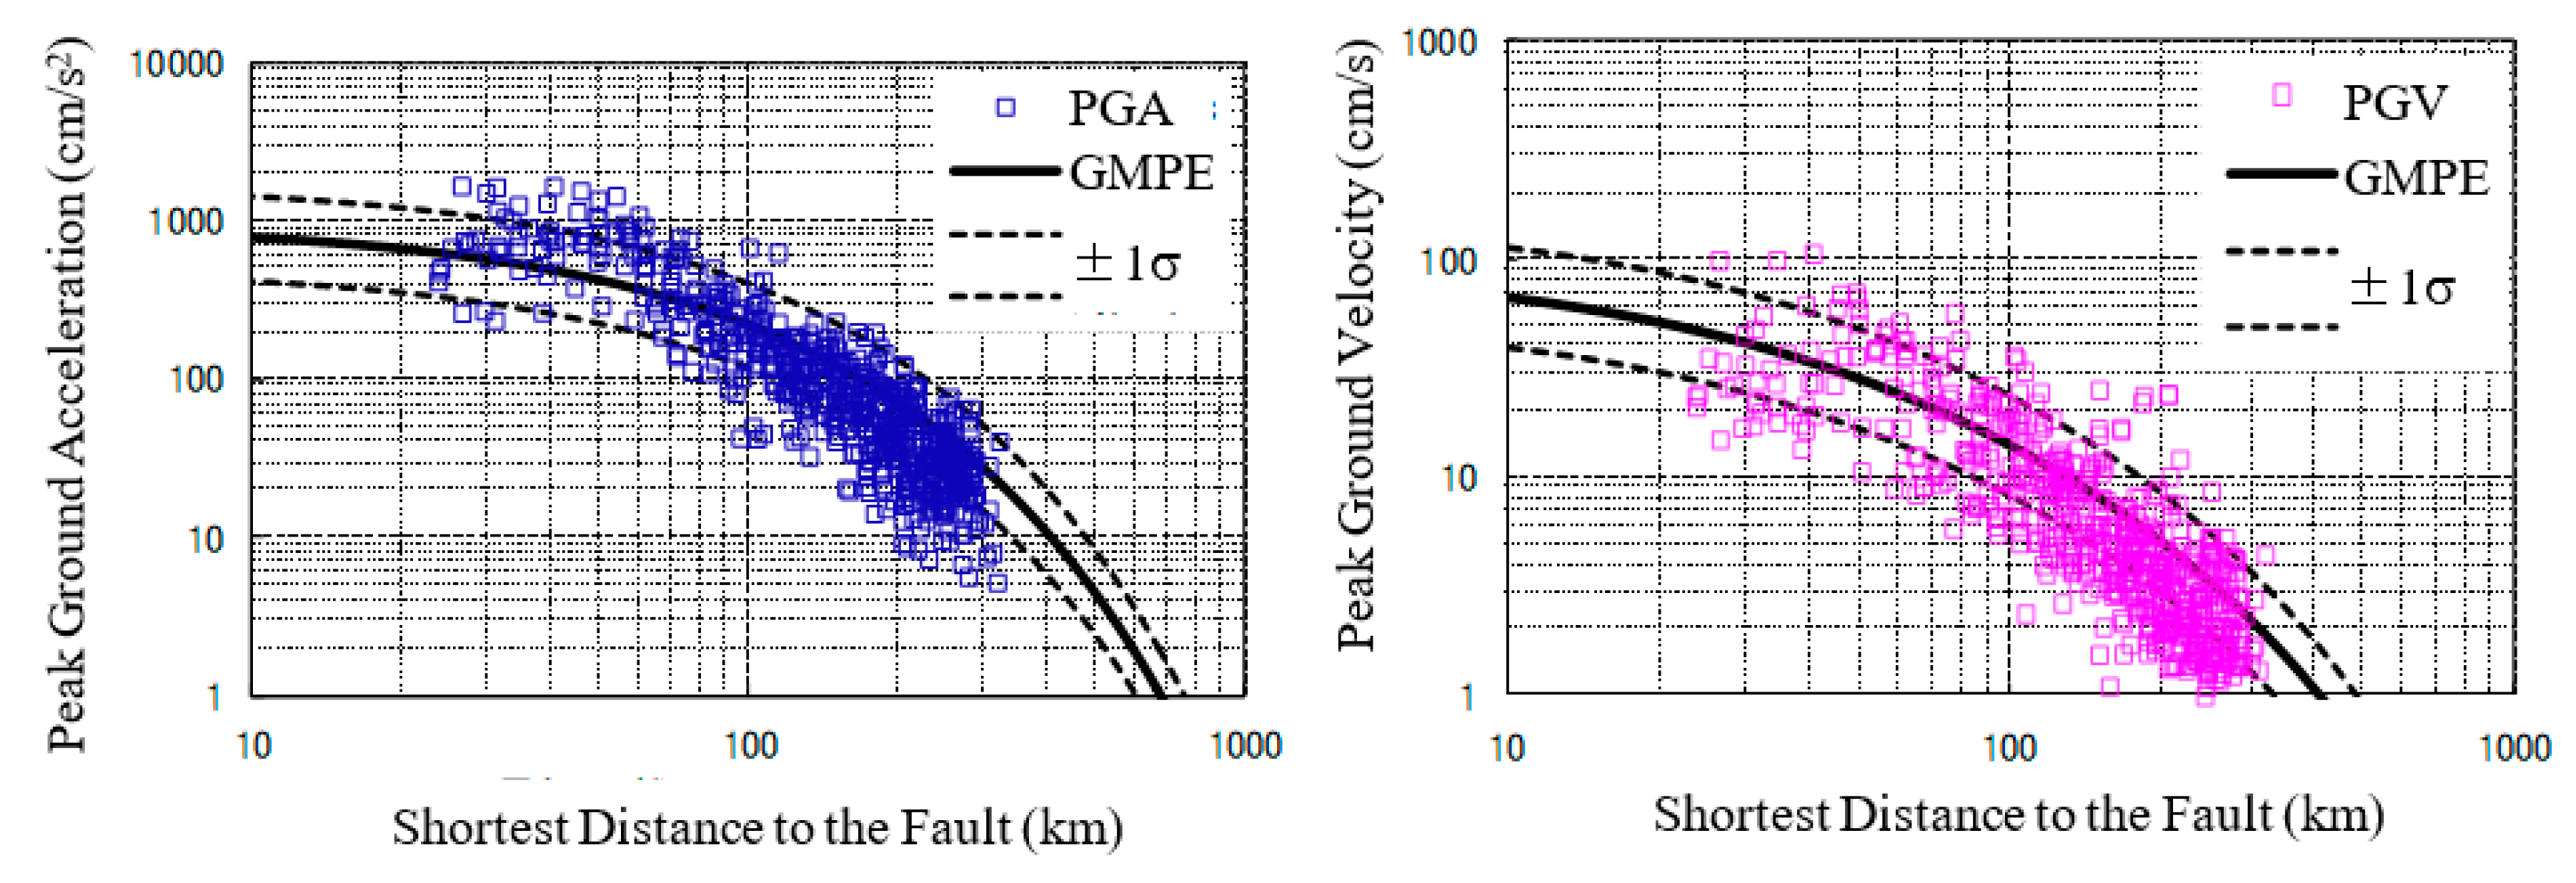
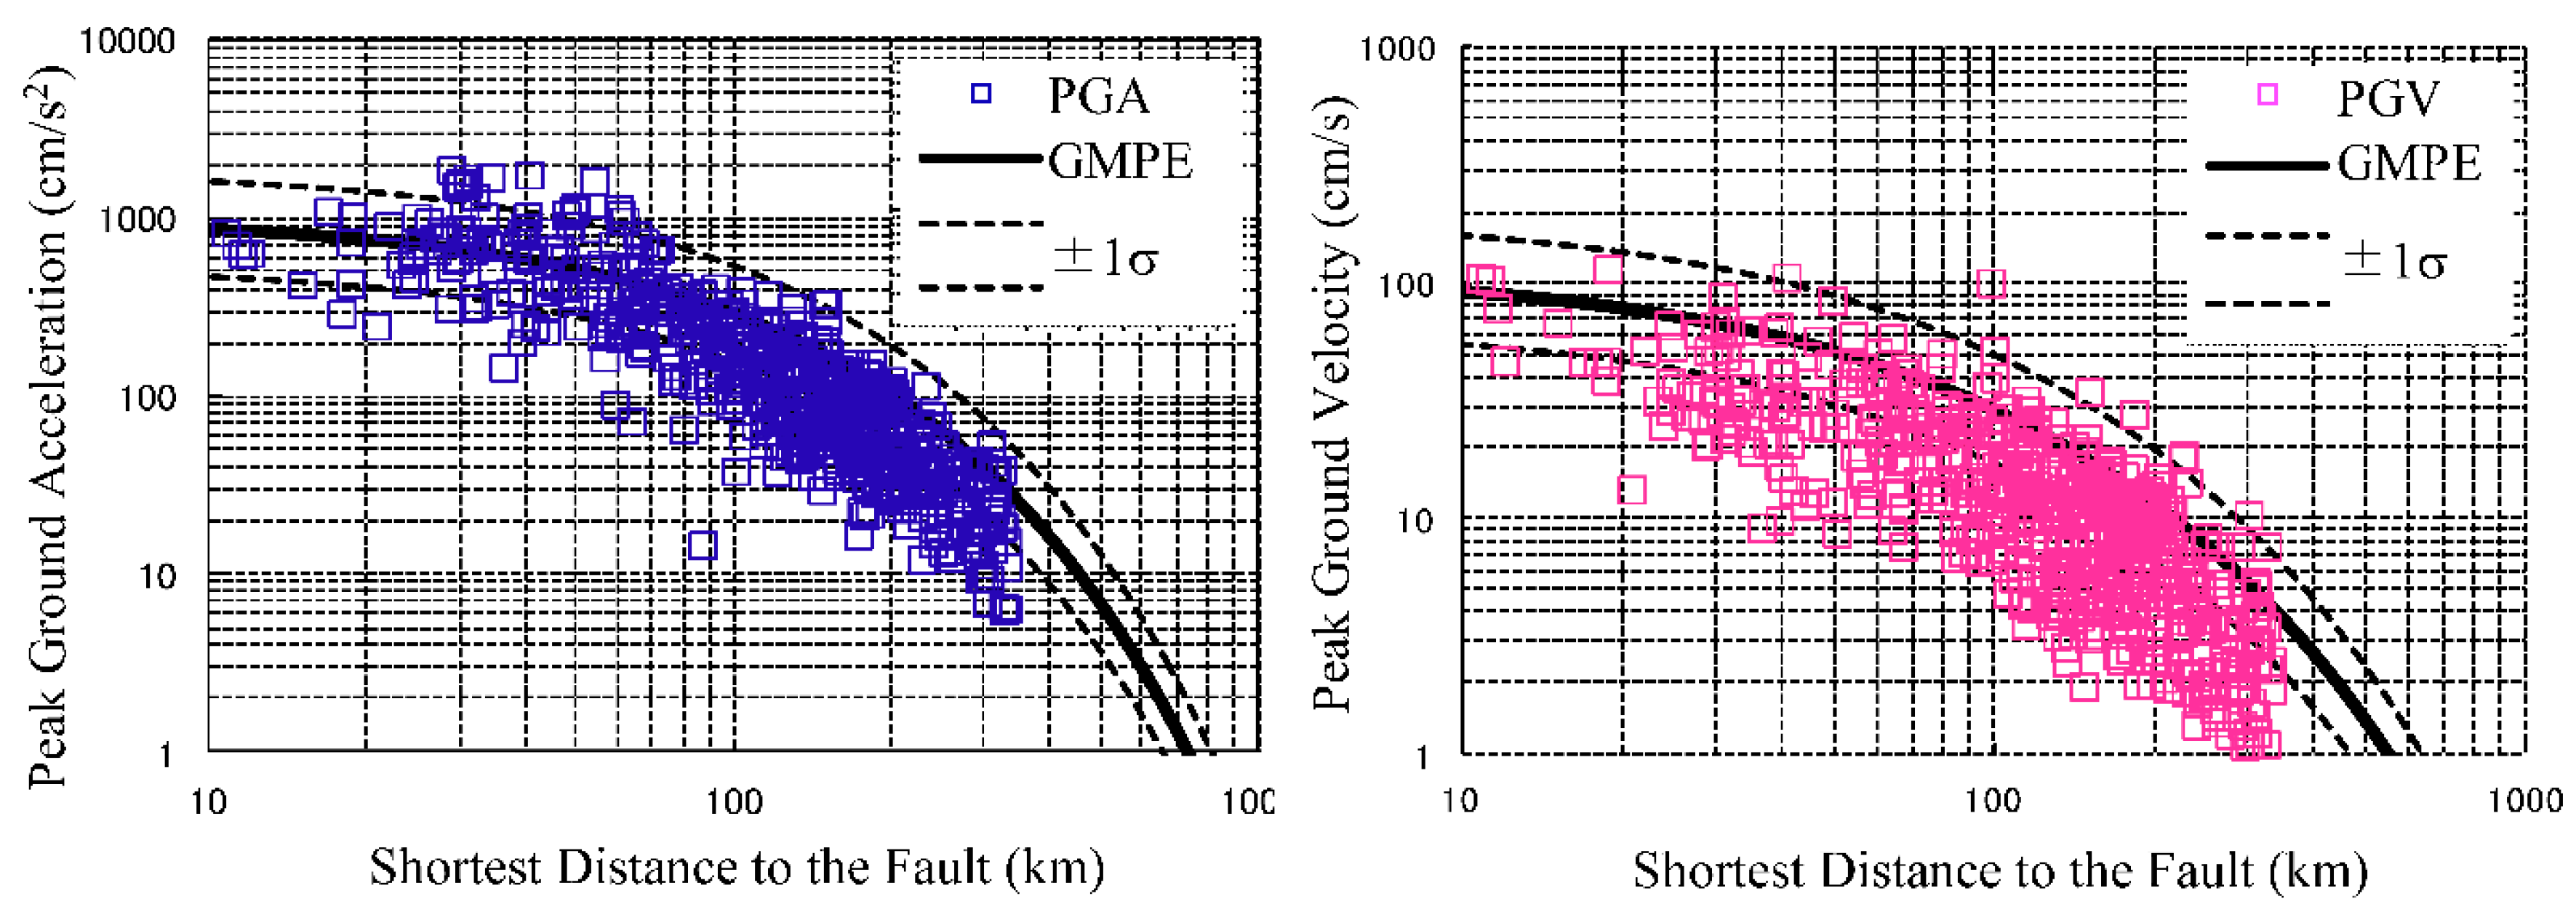
Figure 4 shows a comparison between the peak ground acceleration (PGA) or peak ground velocity (PGV) calculated in this work for the hypothesized Tonankai earthquake and the attenuation relation (ground motion prediction equation, GMPE) by Si and Midorikawa [10]. The synthetic PGAs from the Green’s function summation method agree quite well with the attenuation relation. The synthetic PGVs also correspond well to the GMPE; however, we need to consider the difference in the assumed average velocity for site amplification. When we plot the velocity GMPE by Si and Midorikawa [10], we assume that the average S-wave velocity in the top 30 m (Vs30) to be 600 m/s, whereas the overall average Vs30 of K-NET and KiK-net is around 400 m/s. A comparison of the PGV of the elementary source and the velocity GMPE for the same magnitude shows that the synthetic values are underestimated to the same extent as shown in Figure 4, and thus the PGV of the elementary source based on the assumed source spectrum is confirmed to be slightly smaller than the average of previously observed events.
One issue that we should consider is that the time-varying characteristics are determined from the acceleration envelope when generating our statistical Green’s function, thus the envelope is mostly governed by short-period components so that PGV would not be directly regulated. Therefore, data should be added in the future to increase the stability of separation properties and improve modeling of long-period phase characteristics that may govern PGV. Note that the maximum magnitude in the database used to derive the empirical attenuation relation in Si and Midorikawa [10] was 8.0, and thus the comparison shown here is a small extrapolation.
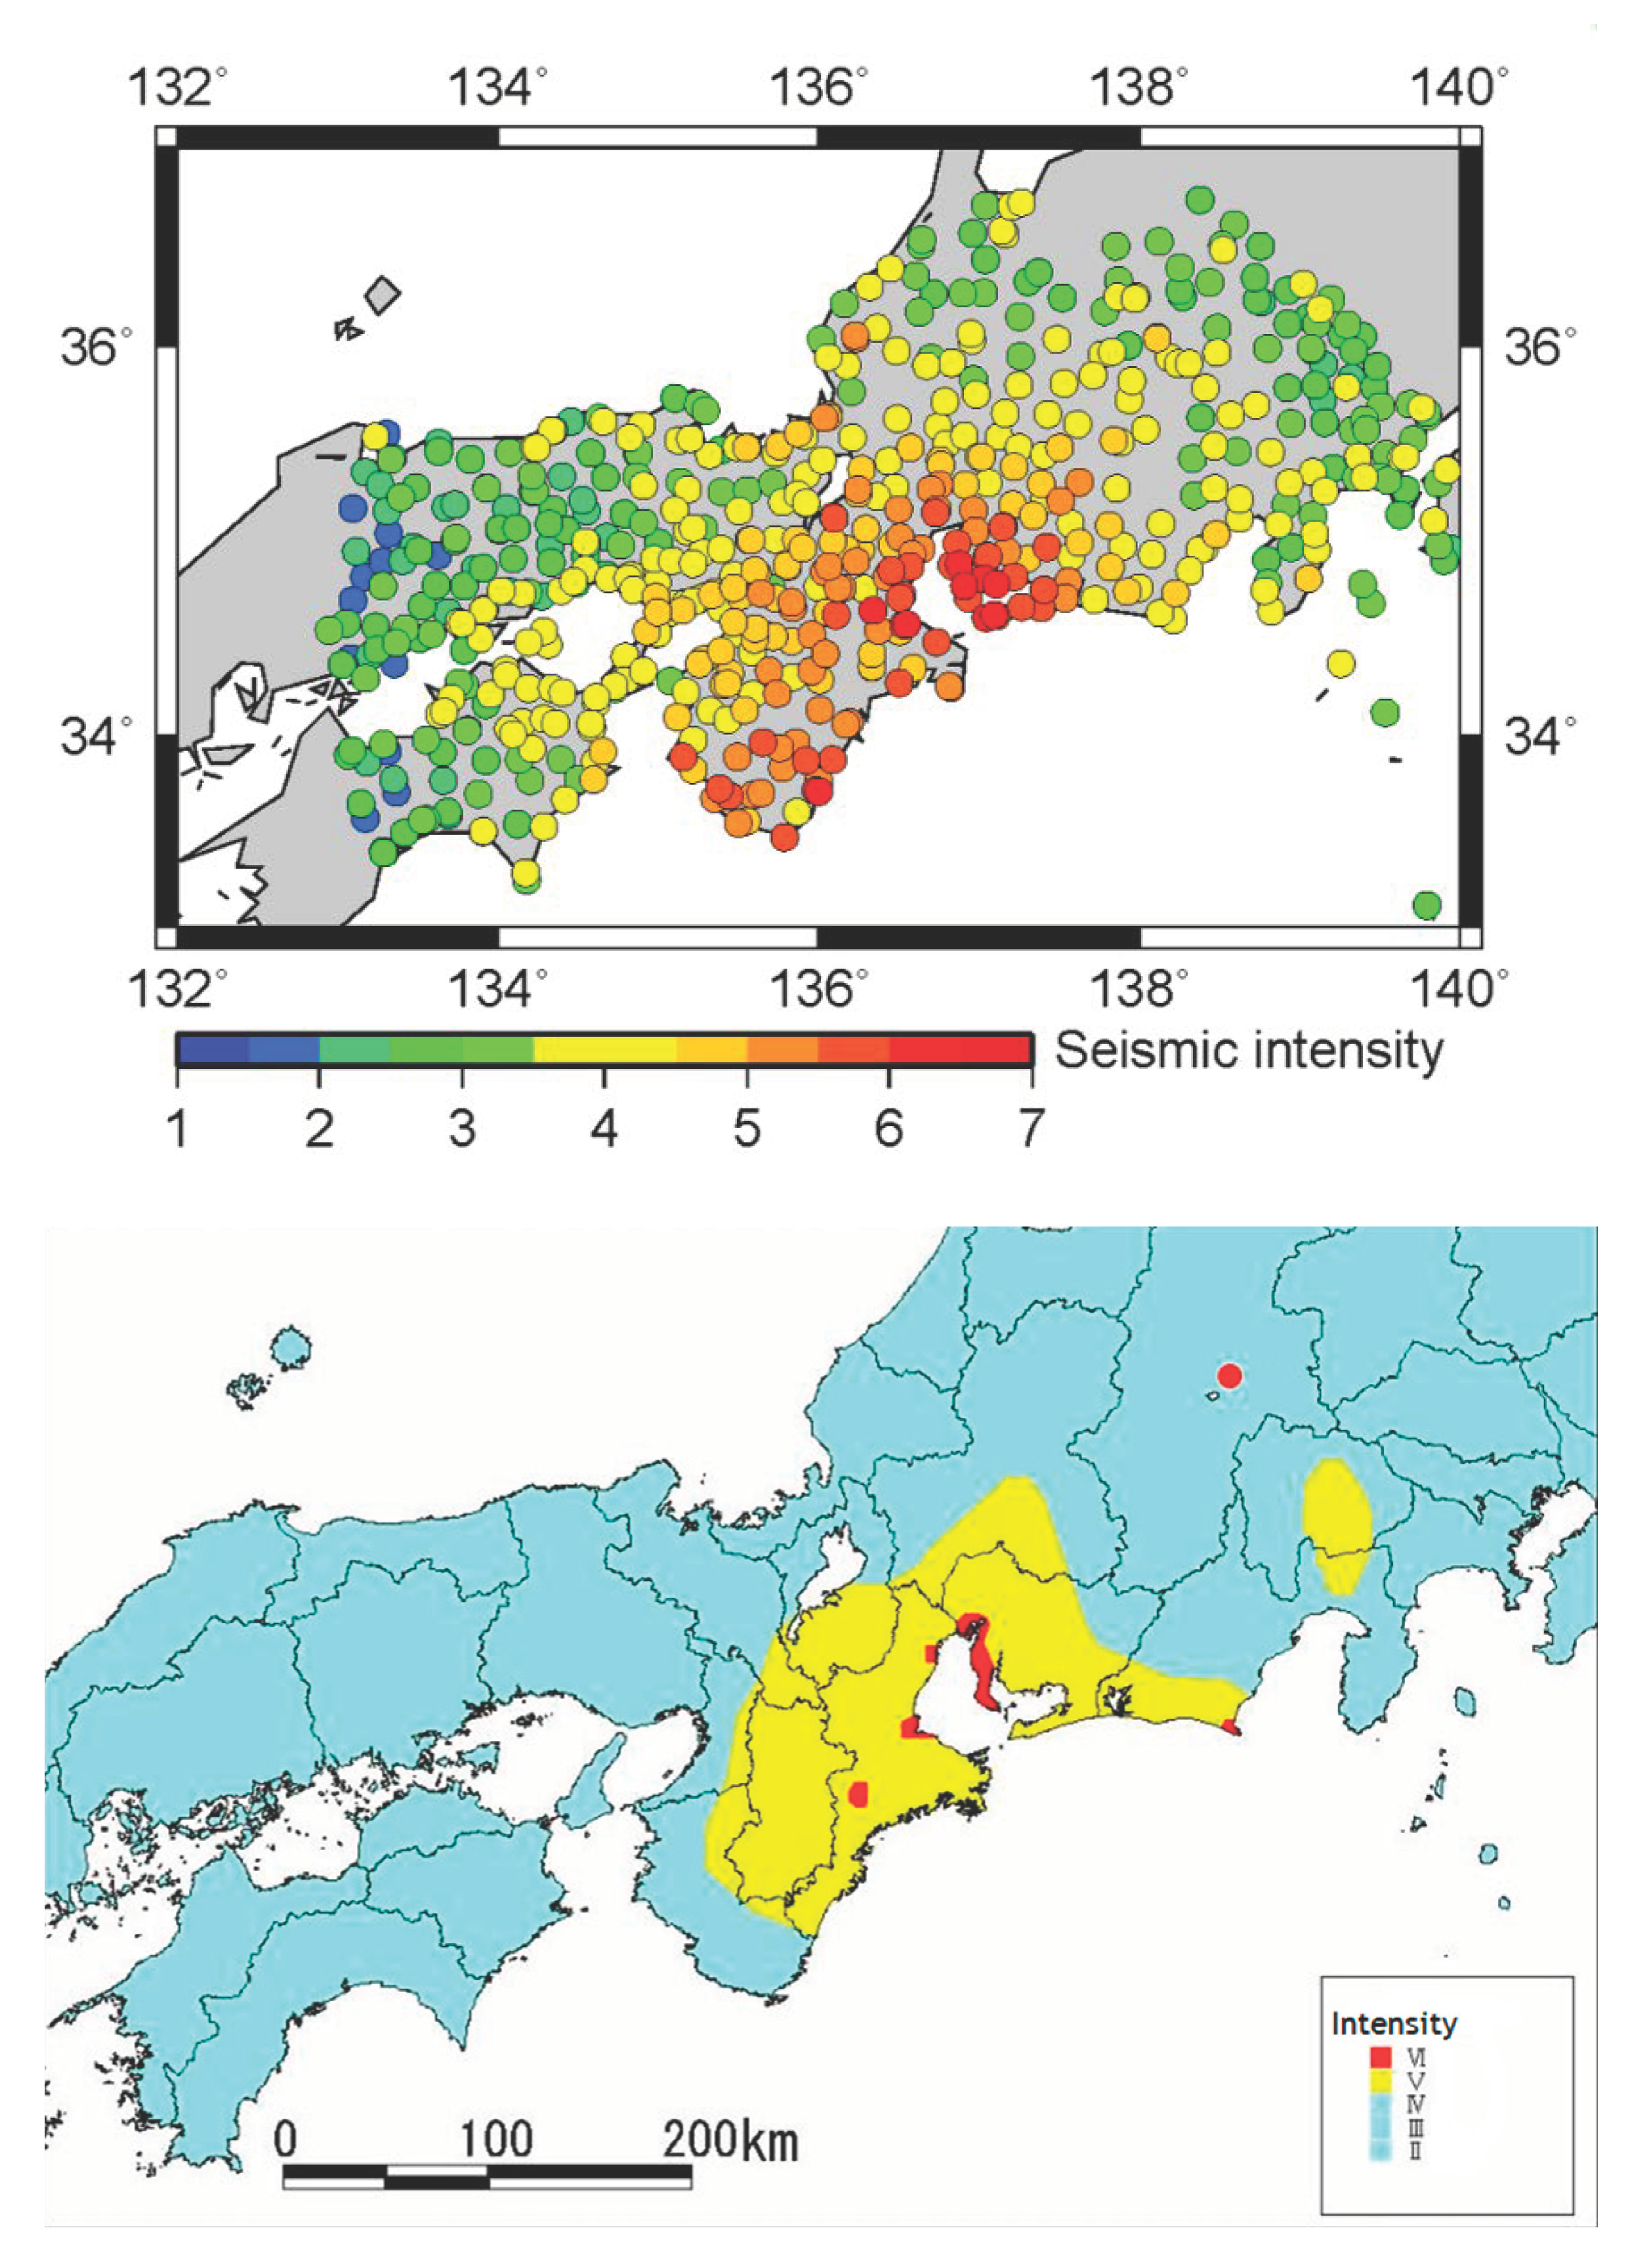
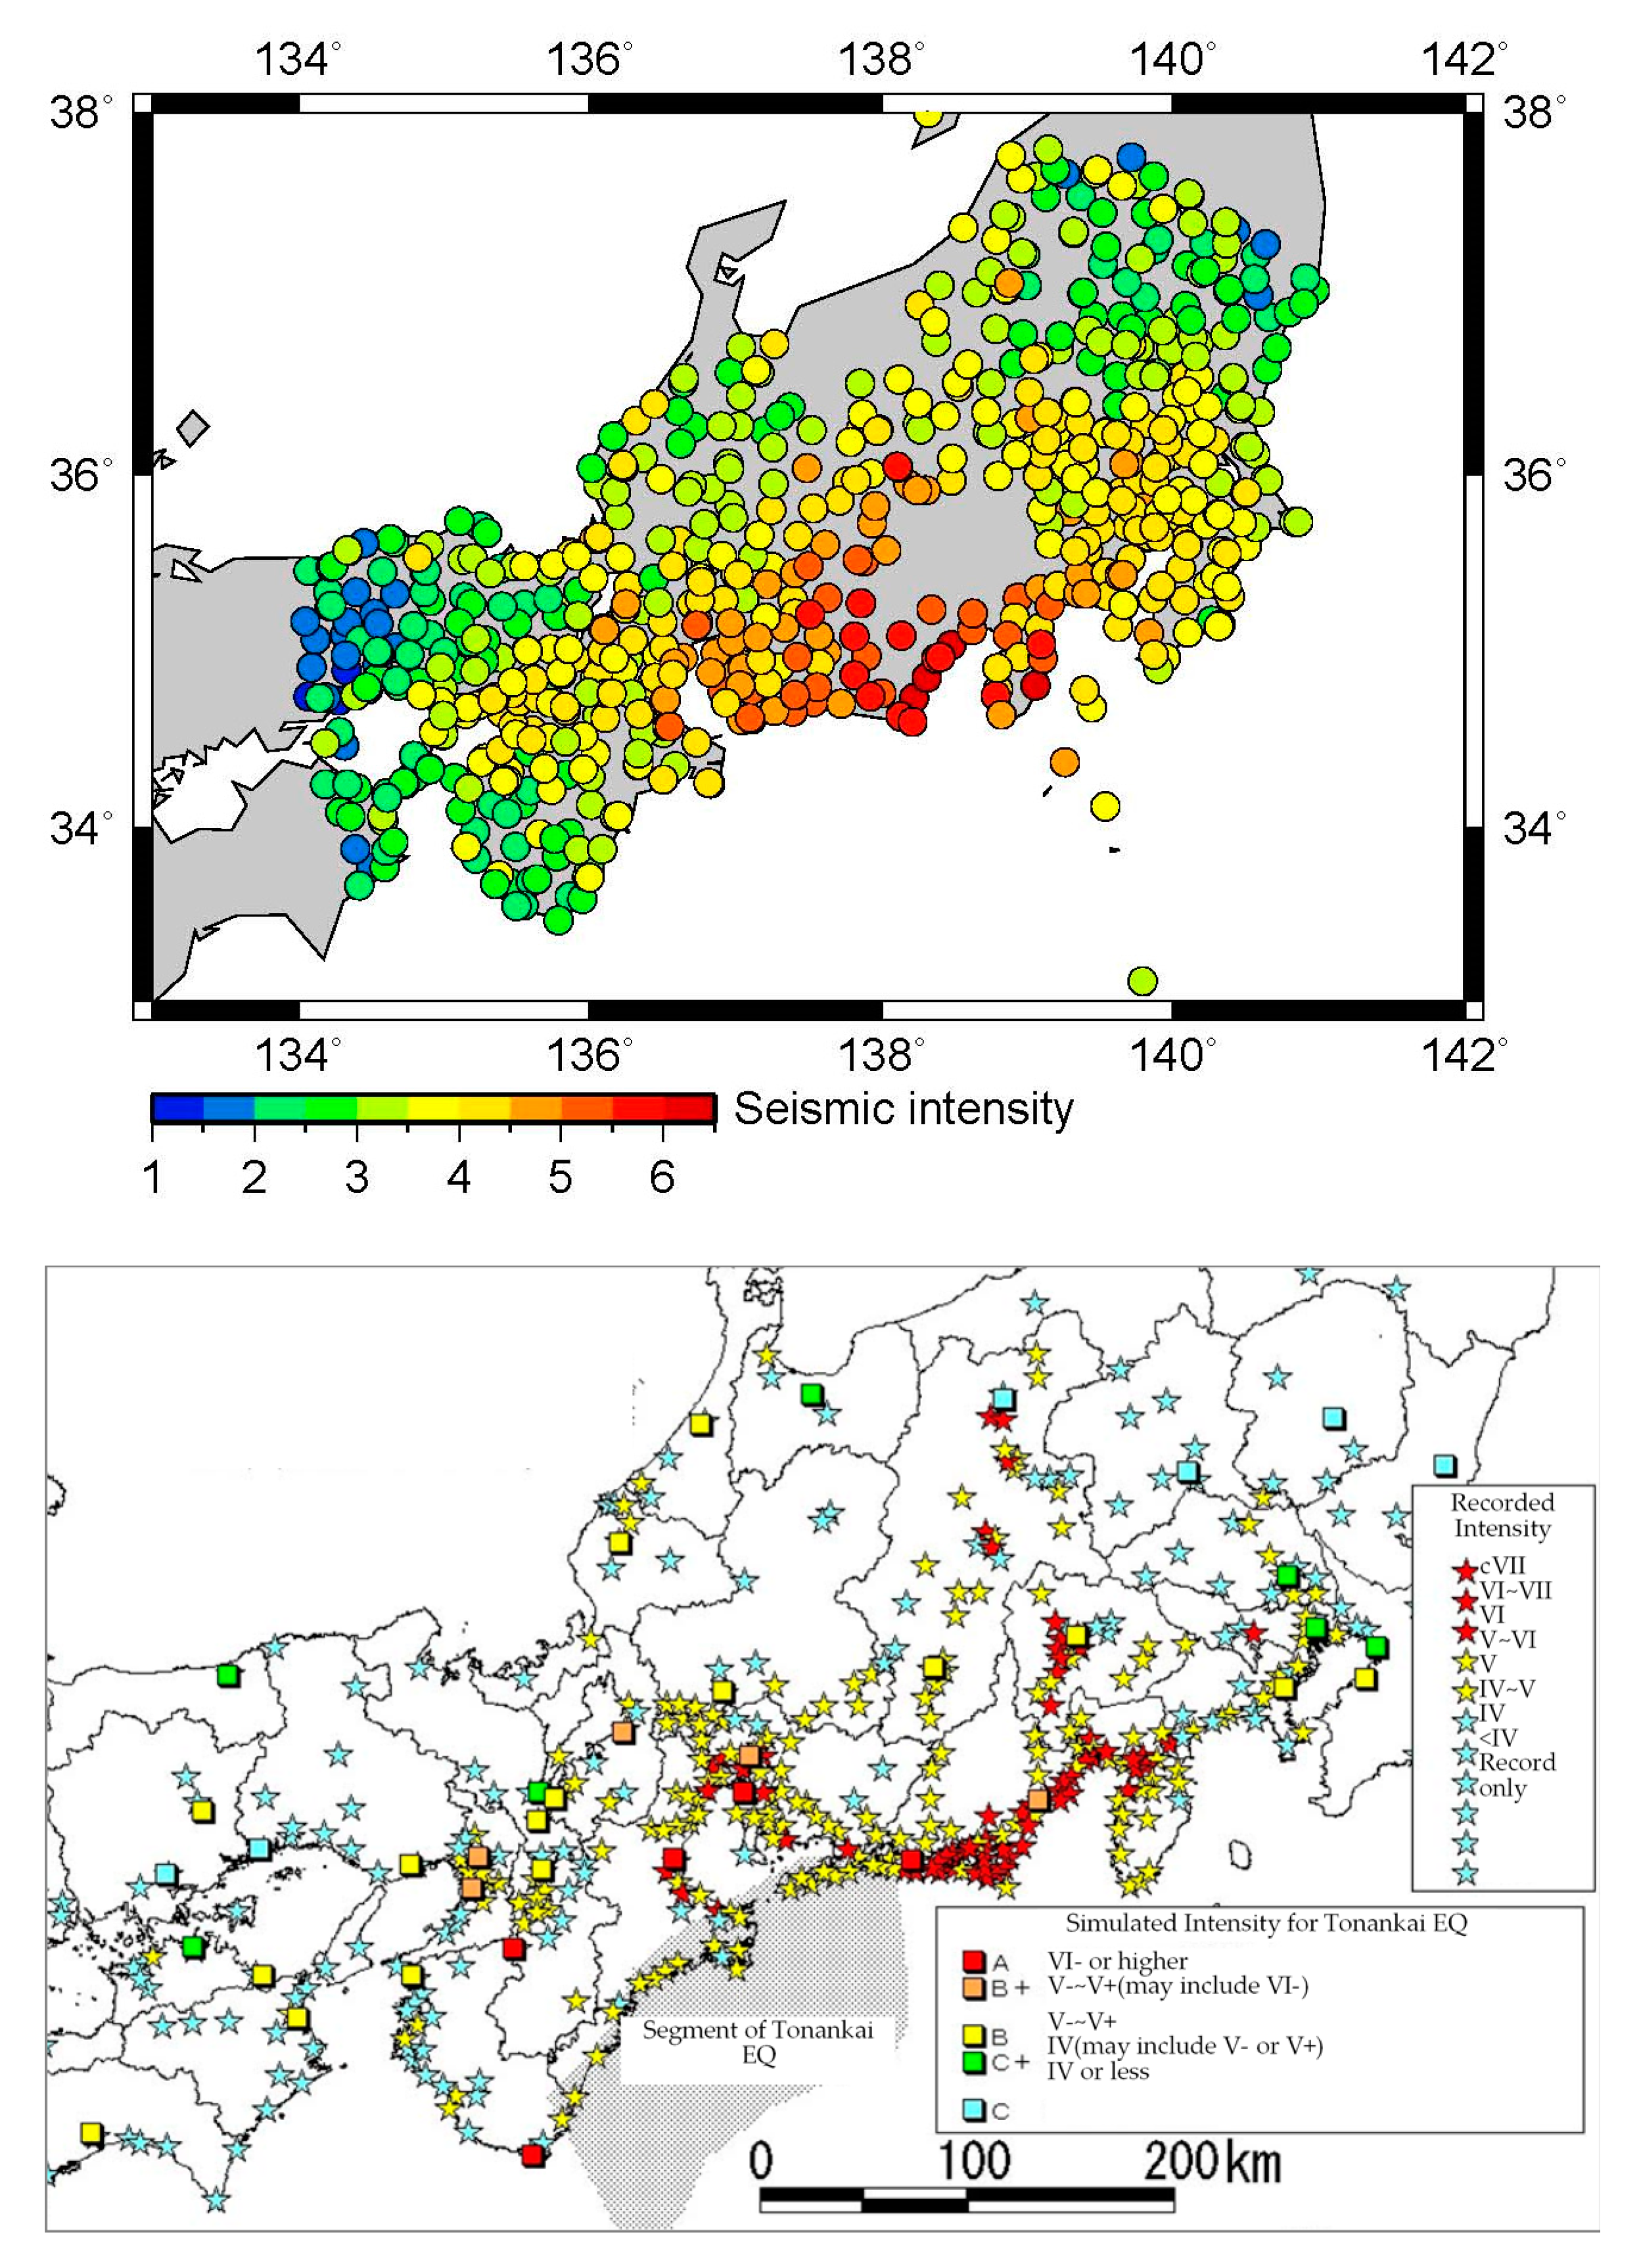
Figure 5 shows a comparison of seismic intensity scale according to the converted seismic intensity from the synthesized strong ground motions of the hypothesized Tonankai earthquake in this study and the contour map from the damage survey of the 1944 Tonankai earthquake according to the publicly available information from HERP [28]. The seismic intensity scale of VI lower and VI upper in red circles in this study corresponds to the maximum rank of VI lower equivalent or higher in HERP, also marked in red. The seismic intensity scale of V in orange circles also corresponds to the same class marked in yellow. The strong ground motion of the hypothesized Tonankai earthquake in this work does not consider a saturation phenomenon near the fault and non-linearity of the underground structure. As described in the figures by HERP, there is uncertainty in the source characteristics and some fluctuation of the designated underground structure within the same municipality is inevitable. The overall seismic intensity scale distributions of these two results match well, as seismic intensity may easily change by one between these two results for the reasons mentioned above. Please note that the converted seismic intensity was calculated as shown in [22,29], whereas the intensity estimated from the damage survey was based on the table by JMA [30].
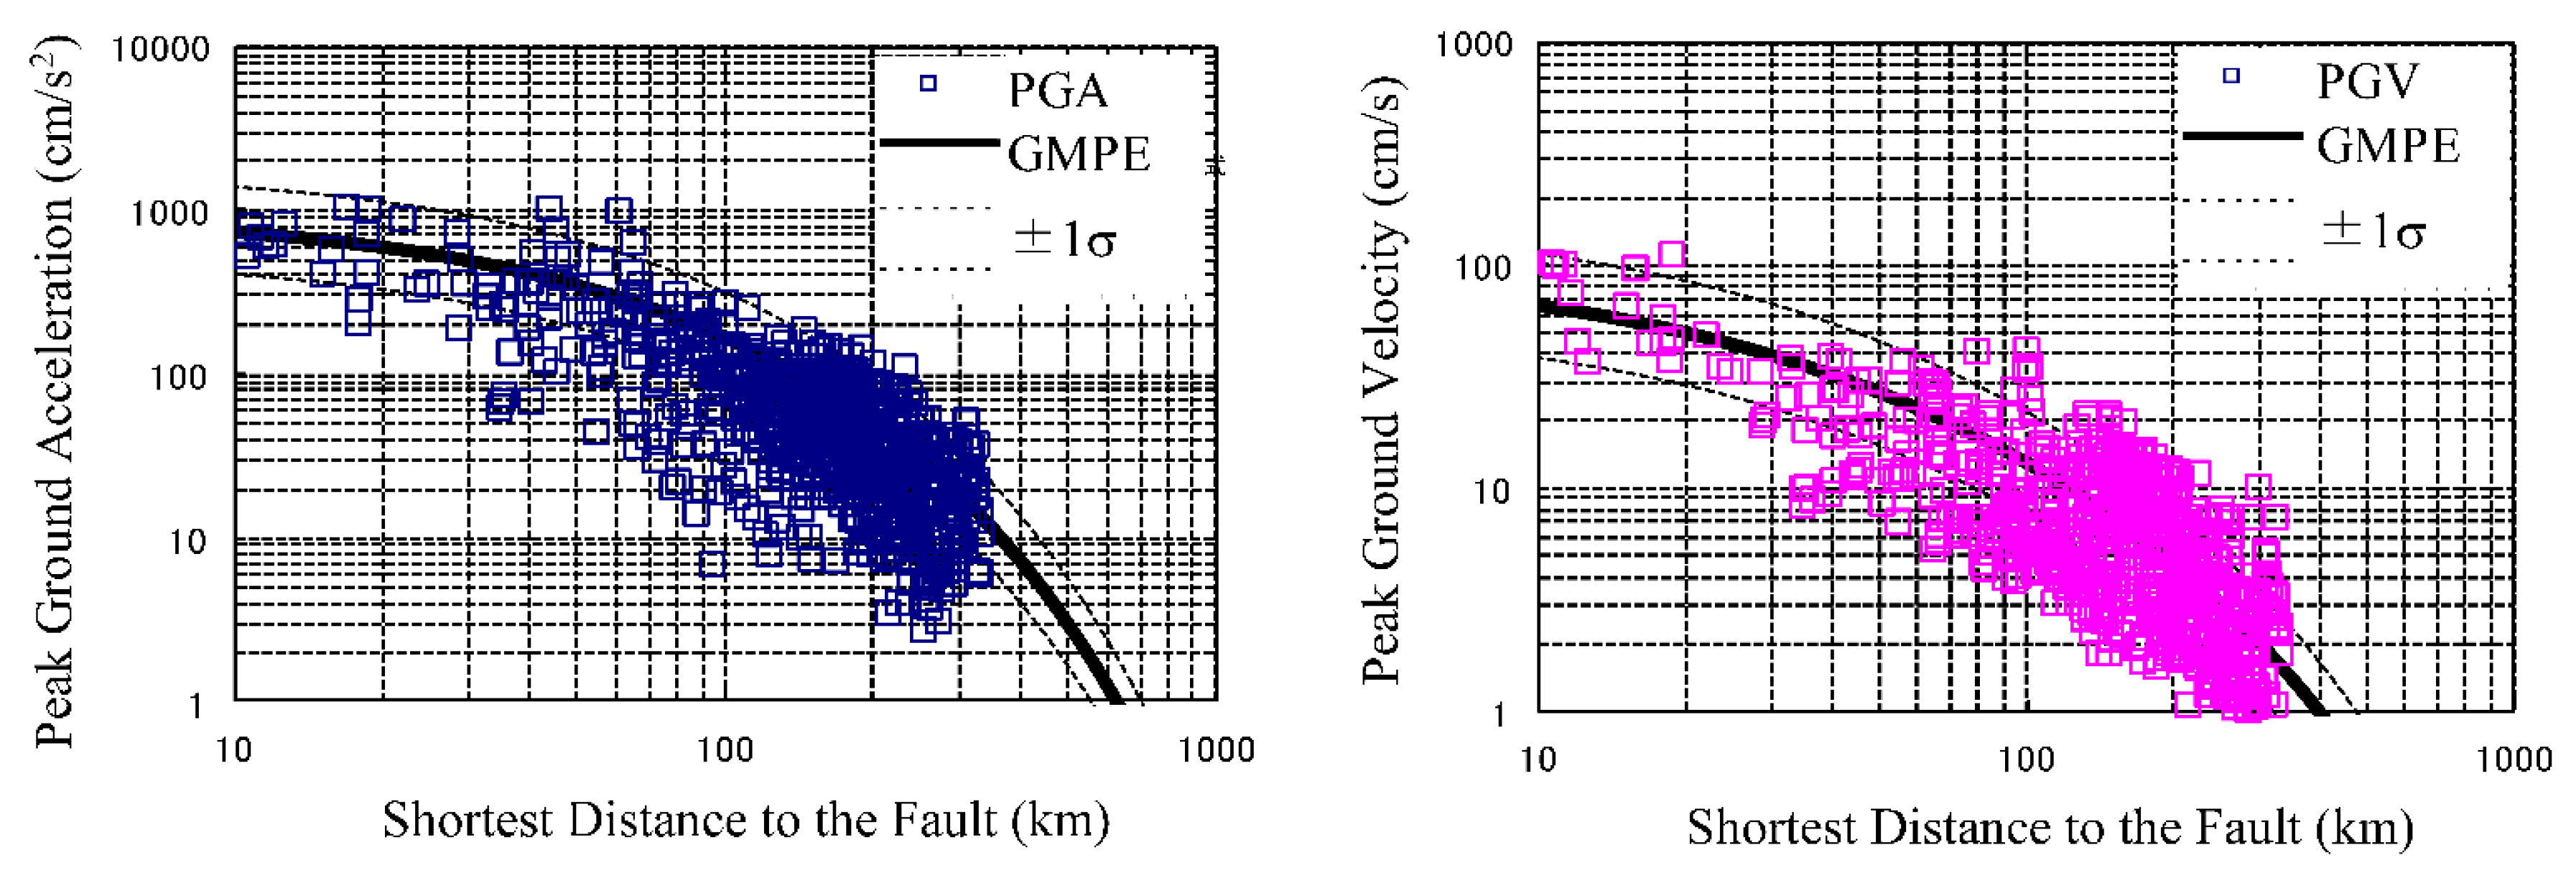
Although it is difficult to consider nowadays to have an independent rupture at the Tokai segment before the Tonankai and Nankai earthquakes, the Tokai segment had been considered to rupture as an independent Tokai earthquake within the foreseeable future in the 1970s based on the slip deficit in the segment (e.g., Ishibashi, 1981 [31]). Therefore, the Central Disaster Management Council (CDMC), Cabinet Office of Japan, had been evaluating strong ground motions based on the hypothesized Tokai earthquake as an independent event until recently. We adopted the fault rupture scenario proposed by CDMC [32] and used the same method as the Tonankai earthquake described above to calculate strong-motion waveforms. Figure 6 shows a comparison of the synthetic PGAs or PGVs calculated for the hypothesized Tokai earthquake with GMPE by Si and Midorikawa [10] as in Figure 4. Furthermore, Figure 7 shows a comparison of seismic intensity scales estimated from the synthetic strong ground motions of the Tokai earthquake and the estimated seismic intensity scale of the 1854 Tokai earthquake (stars), which ruptured much larger areas including (but not limited to) the Tokai segment. Again, correspondence of the synthetic strong motions with the empirical prediction by GMPE as well as the intensity estimated for the previous earthquake is fairly good.
The strong ground motions of the hypothesized Nankai earthquakes had been predicted by Ho and Kawase [17] in which they used the same statistical Green’s function and summation method shown in the previous section. Figure 8 shows the fault model of Ho and Kawase [17] and Figure 9 shows the comparison of the synthetic PGAs or PGVs calculated for the hypothesized Nankai earthquake with GMPE by Si and Midorikawa [10] reproduced from Ho and Kawase [17].
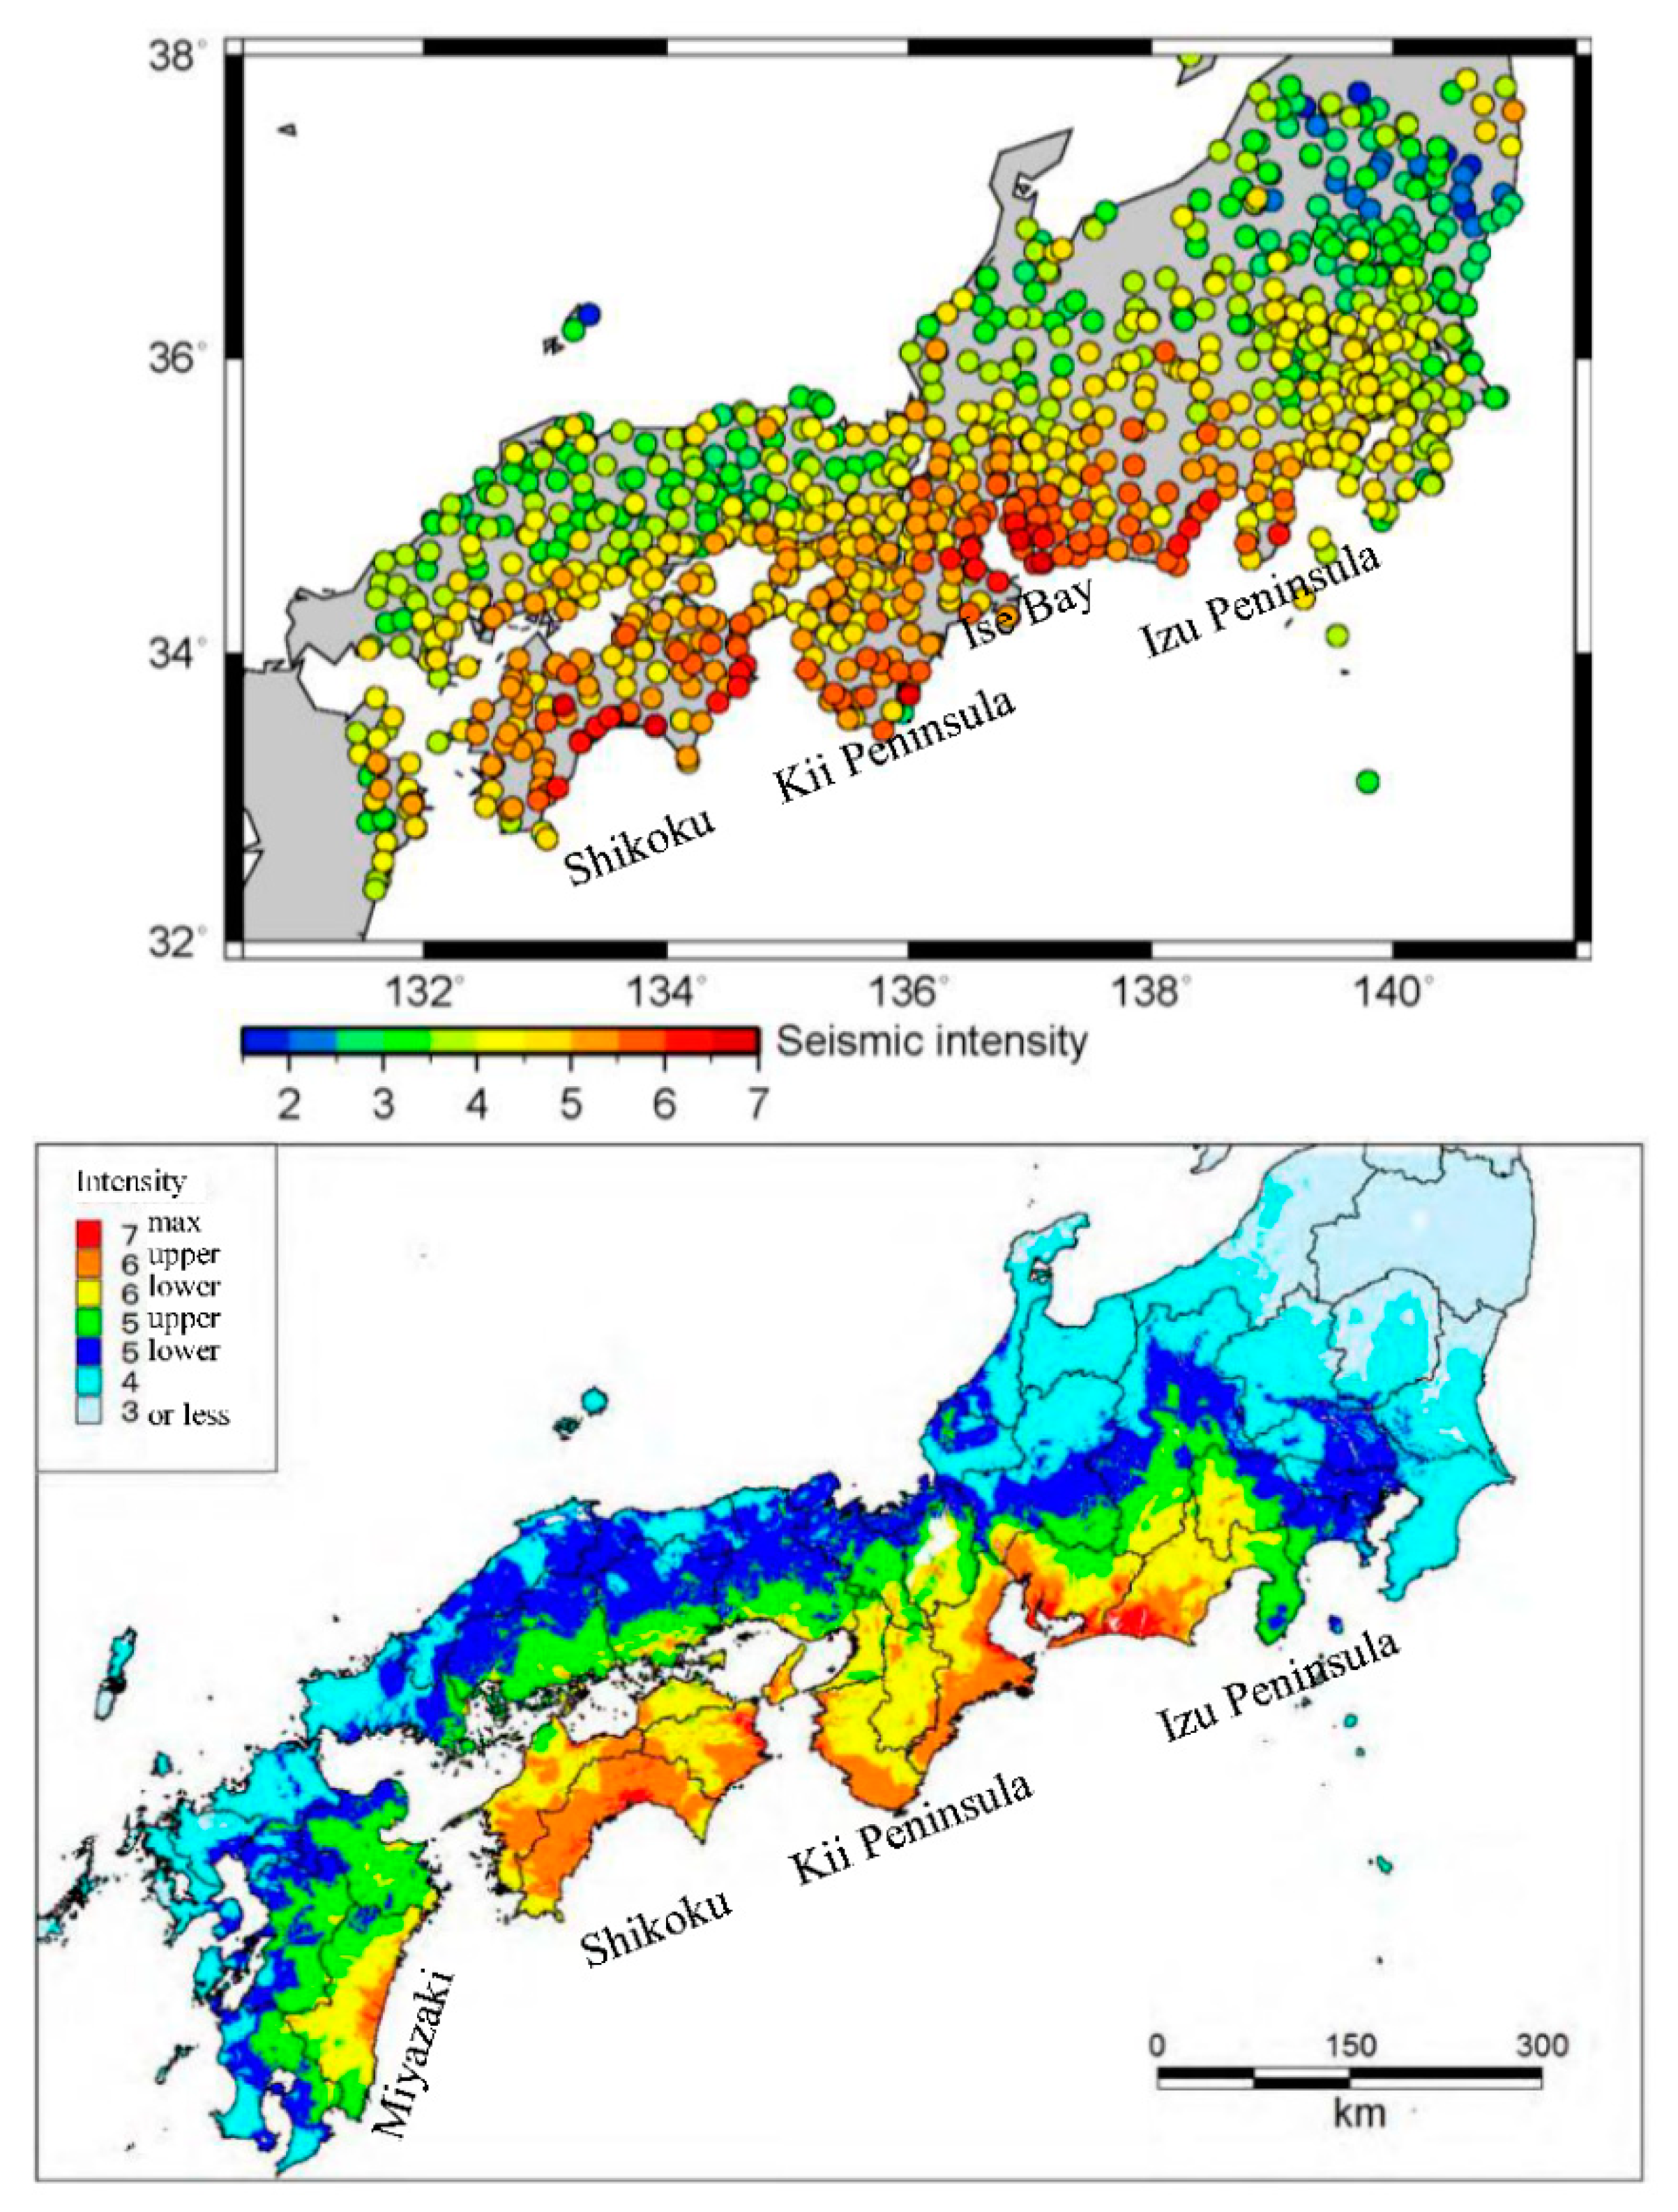
Finally, we considered here a consecutive rupture scenario of all the three segments along the Nankai Trough, namely, Tokai, Tonankai, and Nankai segments, as a hypothesized worst-case scenario. Here, the calculated strong ground motions from each earthquake were superimposed along with the time history, while considering the delay in the rupture start time of each segment by assuming the constant rupture velocity of 2.7 km/s between the next rupture initiation point and the closest point of the adjacent segment already ruptured. Figure 10 shows a comparison between PGA or PGV calculated for the whole earthquake scenario along the Nankai Trough and the GMPE by Si and Midorikawa [10]. Figure 11 compares the seismic intensity scales converted from the synthesized waveforms of this study and the seismic intensity distribution from the similar whole earthquake scenario calculated by the Central Disaster Management Council [7]. The distribution of the sites estimated to result in a seismic intensity scale of VI upper or higher in this study is concentrated in coastal areas of Shikoku, Kii Peninsula, and around Ise Bay, as well as the areas with relatively soft sediments such as areas with an alluvial plain or basin. The results in this study slightly underestimate the CDMC’s estimated seismic intensity distribution in the east coast of Miyazaki Prefecture and slightly overestimate in the Izu Peninsula, but the predicted results almost match those of CDMC at coastal areas near Shikoku and Kii Peninsula. Please note that PGAs and PGVs calculated by our method are slightly less than those from GMPE as shown in Figure 10. This is because there would be only a small contribution from different segments arriving at the same instance so that our PGAs and PGVs are very close to the highest values among the independent waveforms from the three segments. On the other hand, the assumed magnitude, which is much larger in the whole rupture scenario than the individual earthquakes, will act to increase predicted PGA or PGV by GMPE proportionally. Thus, the difference in Figure 10 shows that PGAs and PGVs based on GMPE could be overestimated if the whole rupture scenario is a cascading rupture scenario as assumed here.

4. Building Damage Prediction Based on the Calculated Ground Motions

4.1. Motivation

The earthquake off the Pacific coast of Tohoku, Japan (Tohoku) of 11 March 2011, of Mw9.0 forced a radical revision of previously hypothesized source characteristics for subduction zone earthquakes along the Pacific coast of Japan. The CDMC doubled or tripled the hypocentral areas and its magnitude of a hypothesized whole rupture scenario along the Nankai Trough in March 2012 and simultaneously made public the estimated seismic intensity distributions and tsunami heights of various sites. Then, in August 2012, the CDMC revised the tsunami height prediction and estimated structural damage and subsequent human casualties [32]. Their estimation suggested a maximum of 320,000 casualties, half of which would be associated with structural damage and subsequent fire. However, this estimation uses an empirical building damage prediction formula (i.e., the so-called vulnerability function) derived primarily from the field survey data during the 1995 Hyogo-ken Nanbu earthquake, which may be leading to an overestimation for the subduction zone earthquake because of the large difference of their frequency content, as evidenced by the observed damage during the 2011 Tohoku earthquake [33]. Therefore, structural damage prediction with much higher precision is necessary which employs a method of using dynamic nonlinear response analysis for the calculated seismic waveform. Such a method can reflect the difference in the input ground motion characteristics between crustal and subduction-zone earthquakes. In this section, we used the calculated strong ground motions of the hypothesized (independent) Tonankai earthquake and the whole rupture scenario obtained in the previous section. Nonlinear response analyses based on nonlinear building properties with statistical variabilities [2,3,4] were carried out to calculate damage ratio distributions that consider characteristics such as the building structure type, height, and the construction age in the epicentral regions of these two large earthquake scenarios along the Nankai Trough in southwestern Japan.

4.2. Method of Damage Prediction

The damage prediction method for realistic damage prediction should reflect both the difference of the input motion characteristics and the difference in the seismic capacity of the target category of buildings. Empirical methods represented by the conventional vulnerability function use a strength index for the former and the building types for the latter based on the statistical properties of the observed damage during the past devastating earthquakes [34,35]. The former, such as PGA or PGV, is a crude index to represent the real damaging demand of the input. The latter, such as wooden houses or reinforced concrete (RC) buildings, is also a crude category to differentiate their seismic capacity. The method proposed by Nagato and Kawase [2,3,4], hereafter referred to as the Nagato–Kawase model, uses multiple structural models in their nonlinear response analyses with the input acceleration waveforms calculated at a target site. By comparing the observed damage ratios from the 1995 Hyogo-ken Nanbu earthquake and the results of the earthquake response analyses from the reproduced strong ground motions in Kobe by Matsushima and Kawase [5], Nagato and Kawase [2,3,4] successfully constructed a total of 15 nonlinear response models for different structural categories and construction ages, namely, for a two-storied wooden house without age differences, three-, six-, nine-, and twelve-storied RC buildings, as well as three-, four-, and five-storied steel buildings with the construction age considered (before 1981 large code modification and after 1981). The criterion for a wooden house is considered to suffer heavy damage or collapse when the maximum inter-story deformation angle exceeds 1/10 rad, whereas those for RC and steel structures are defined as the maximum inter-story deformation angle being more than 1/30 rad. In the actual calculation of the damage ratio from a single waveform at a site, we utilized 12 sub-models for each category to represent the statistical variation of the building capacities in Japan, without which we cannot reproduce statistical properties of the observed damage distribution. Figure 12 shows an example of the log-normal distribution for RC buildings. Figure 13 shows an example of the comparison of the reproduced and observed damage ratio distributions for wooden houses in the Higashinada Ward during the 1995 Hyogo-ken Nanbu earthquake, calculated by Nagato and Kawase [4].

4.3. Results of Building Damage Predictions

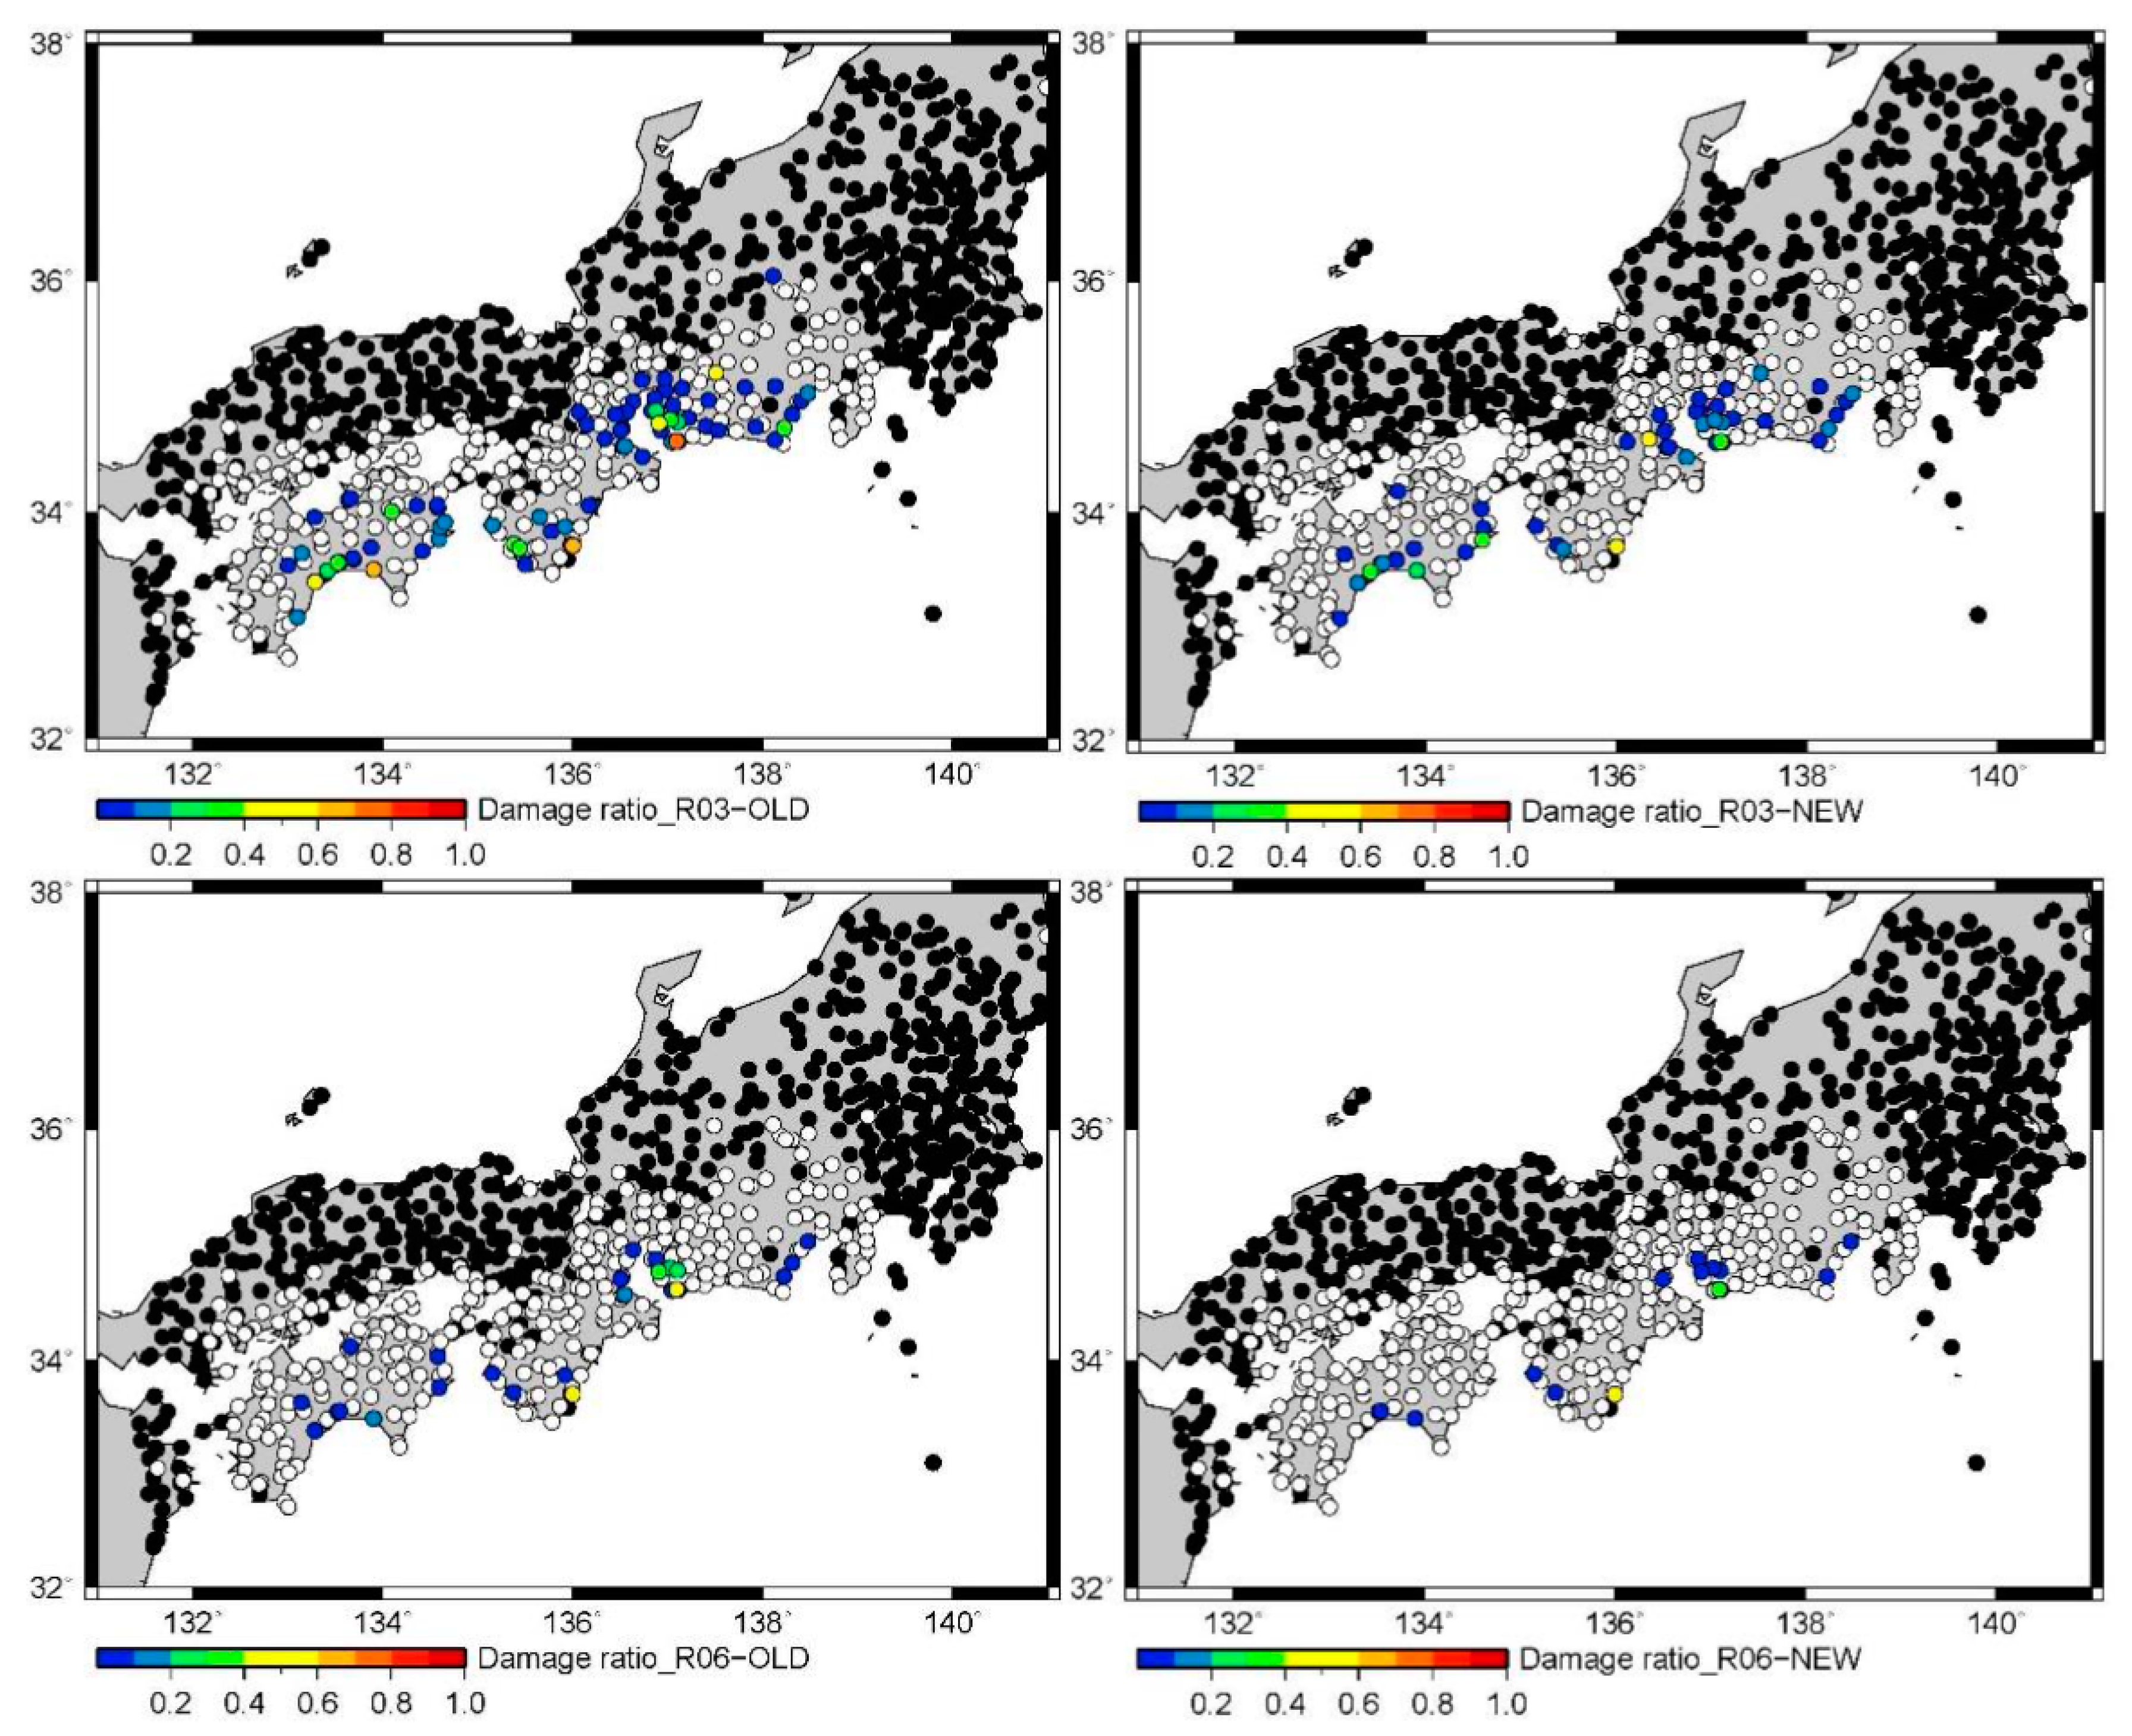
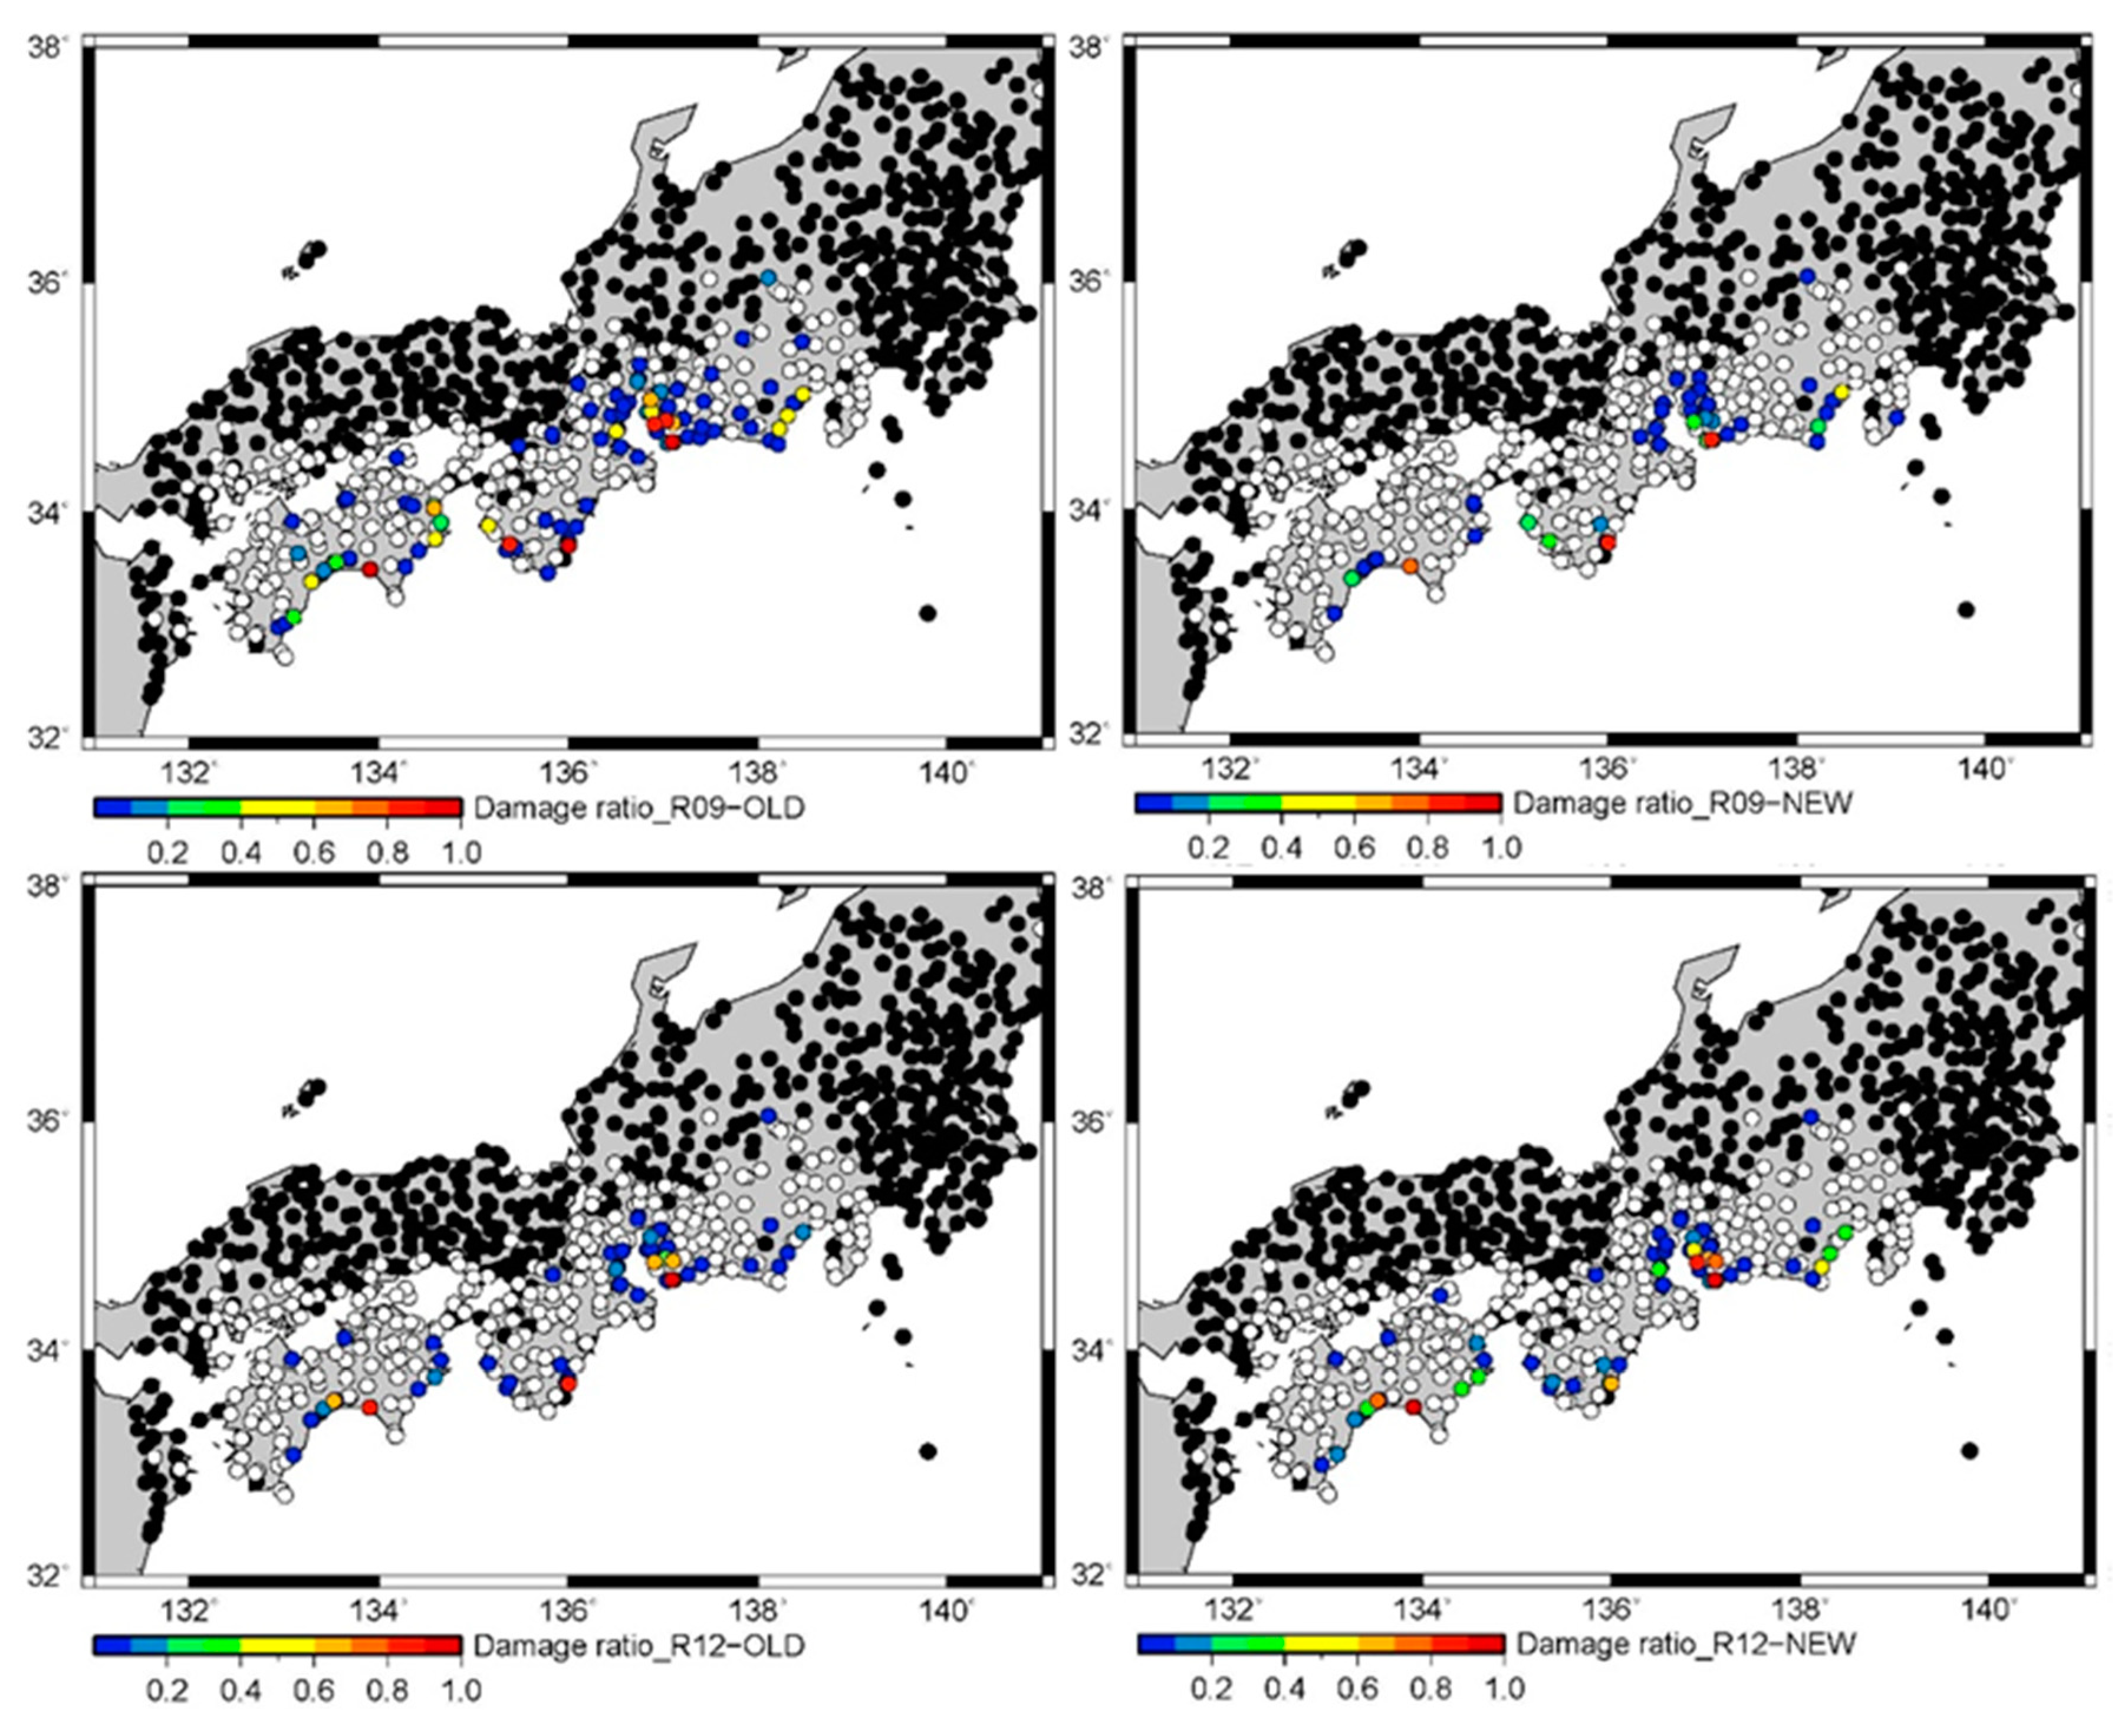
When we predicted building damage distributions based on the synthetic ground motions in the previous section, we restricted the calculation of the damage ratios to the K-NET, KiK-net, and JMA strong motion network sites within 400 km of the assumed fault surface with the PGA higher than 200 cm/s2. The threshold in PGA was primarily based on our experience that showed that heavy damage or higher does not occur in almost all buildings when the maximum acceleration is 200 cm/s2 or less. The damage distribution figures in this section onward distinguish sites where no calculation was conducted because the input seismic motion is less than 200 cm/s2 using black (solid) circles and sites where the damage calculation was conducted but no damage was estimated using white (open) circles. Hereafter, we show the building damage estimation of the hypothesized Tonankai earthquake and the whole rupture scenario along the Nankai Trough.
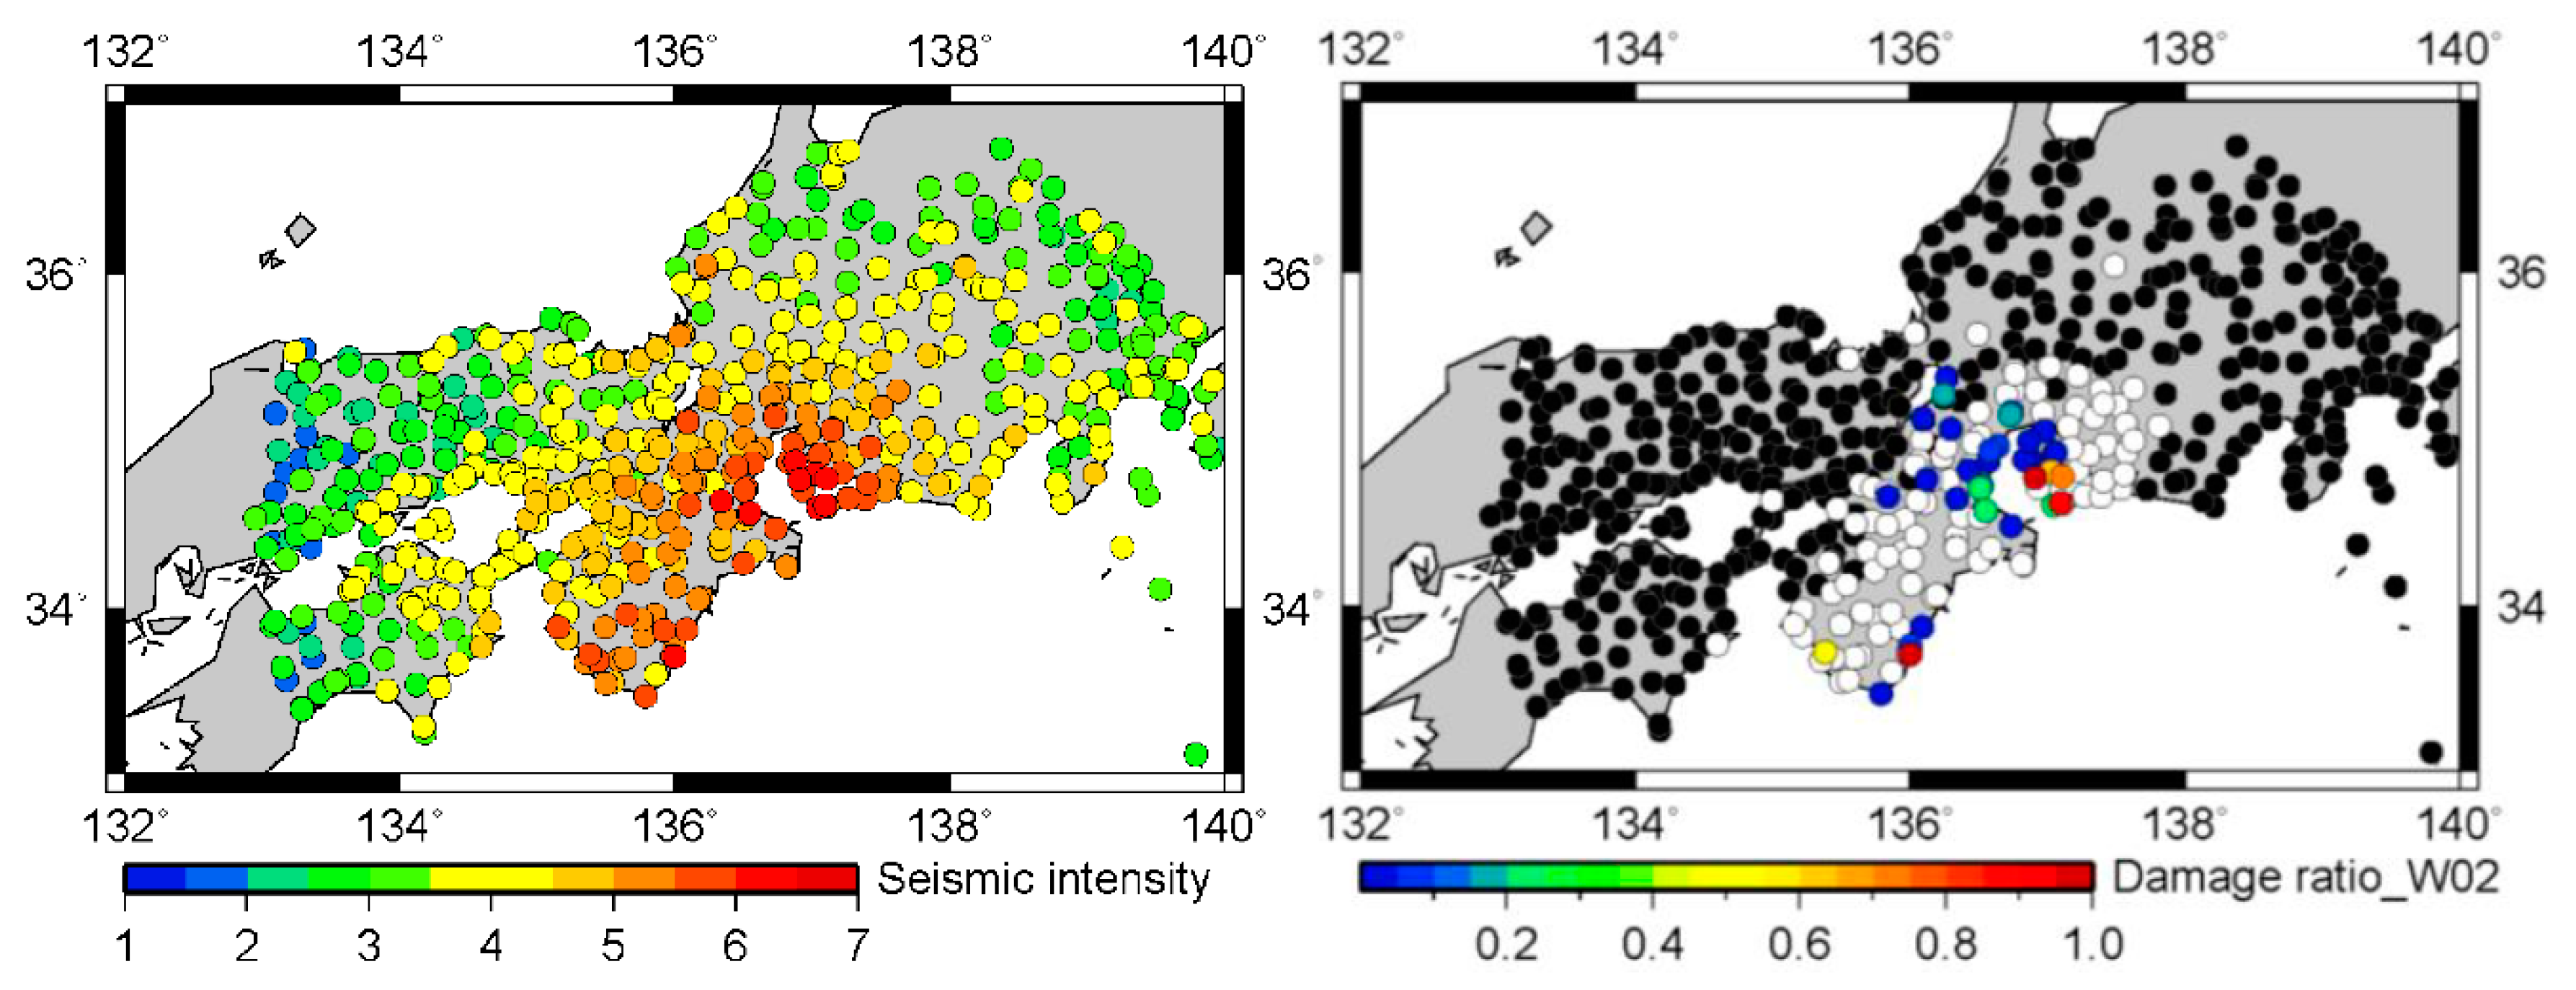
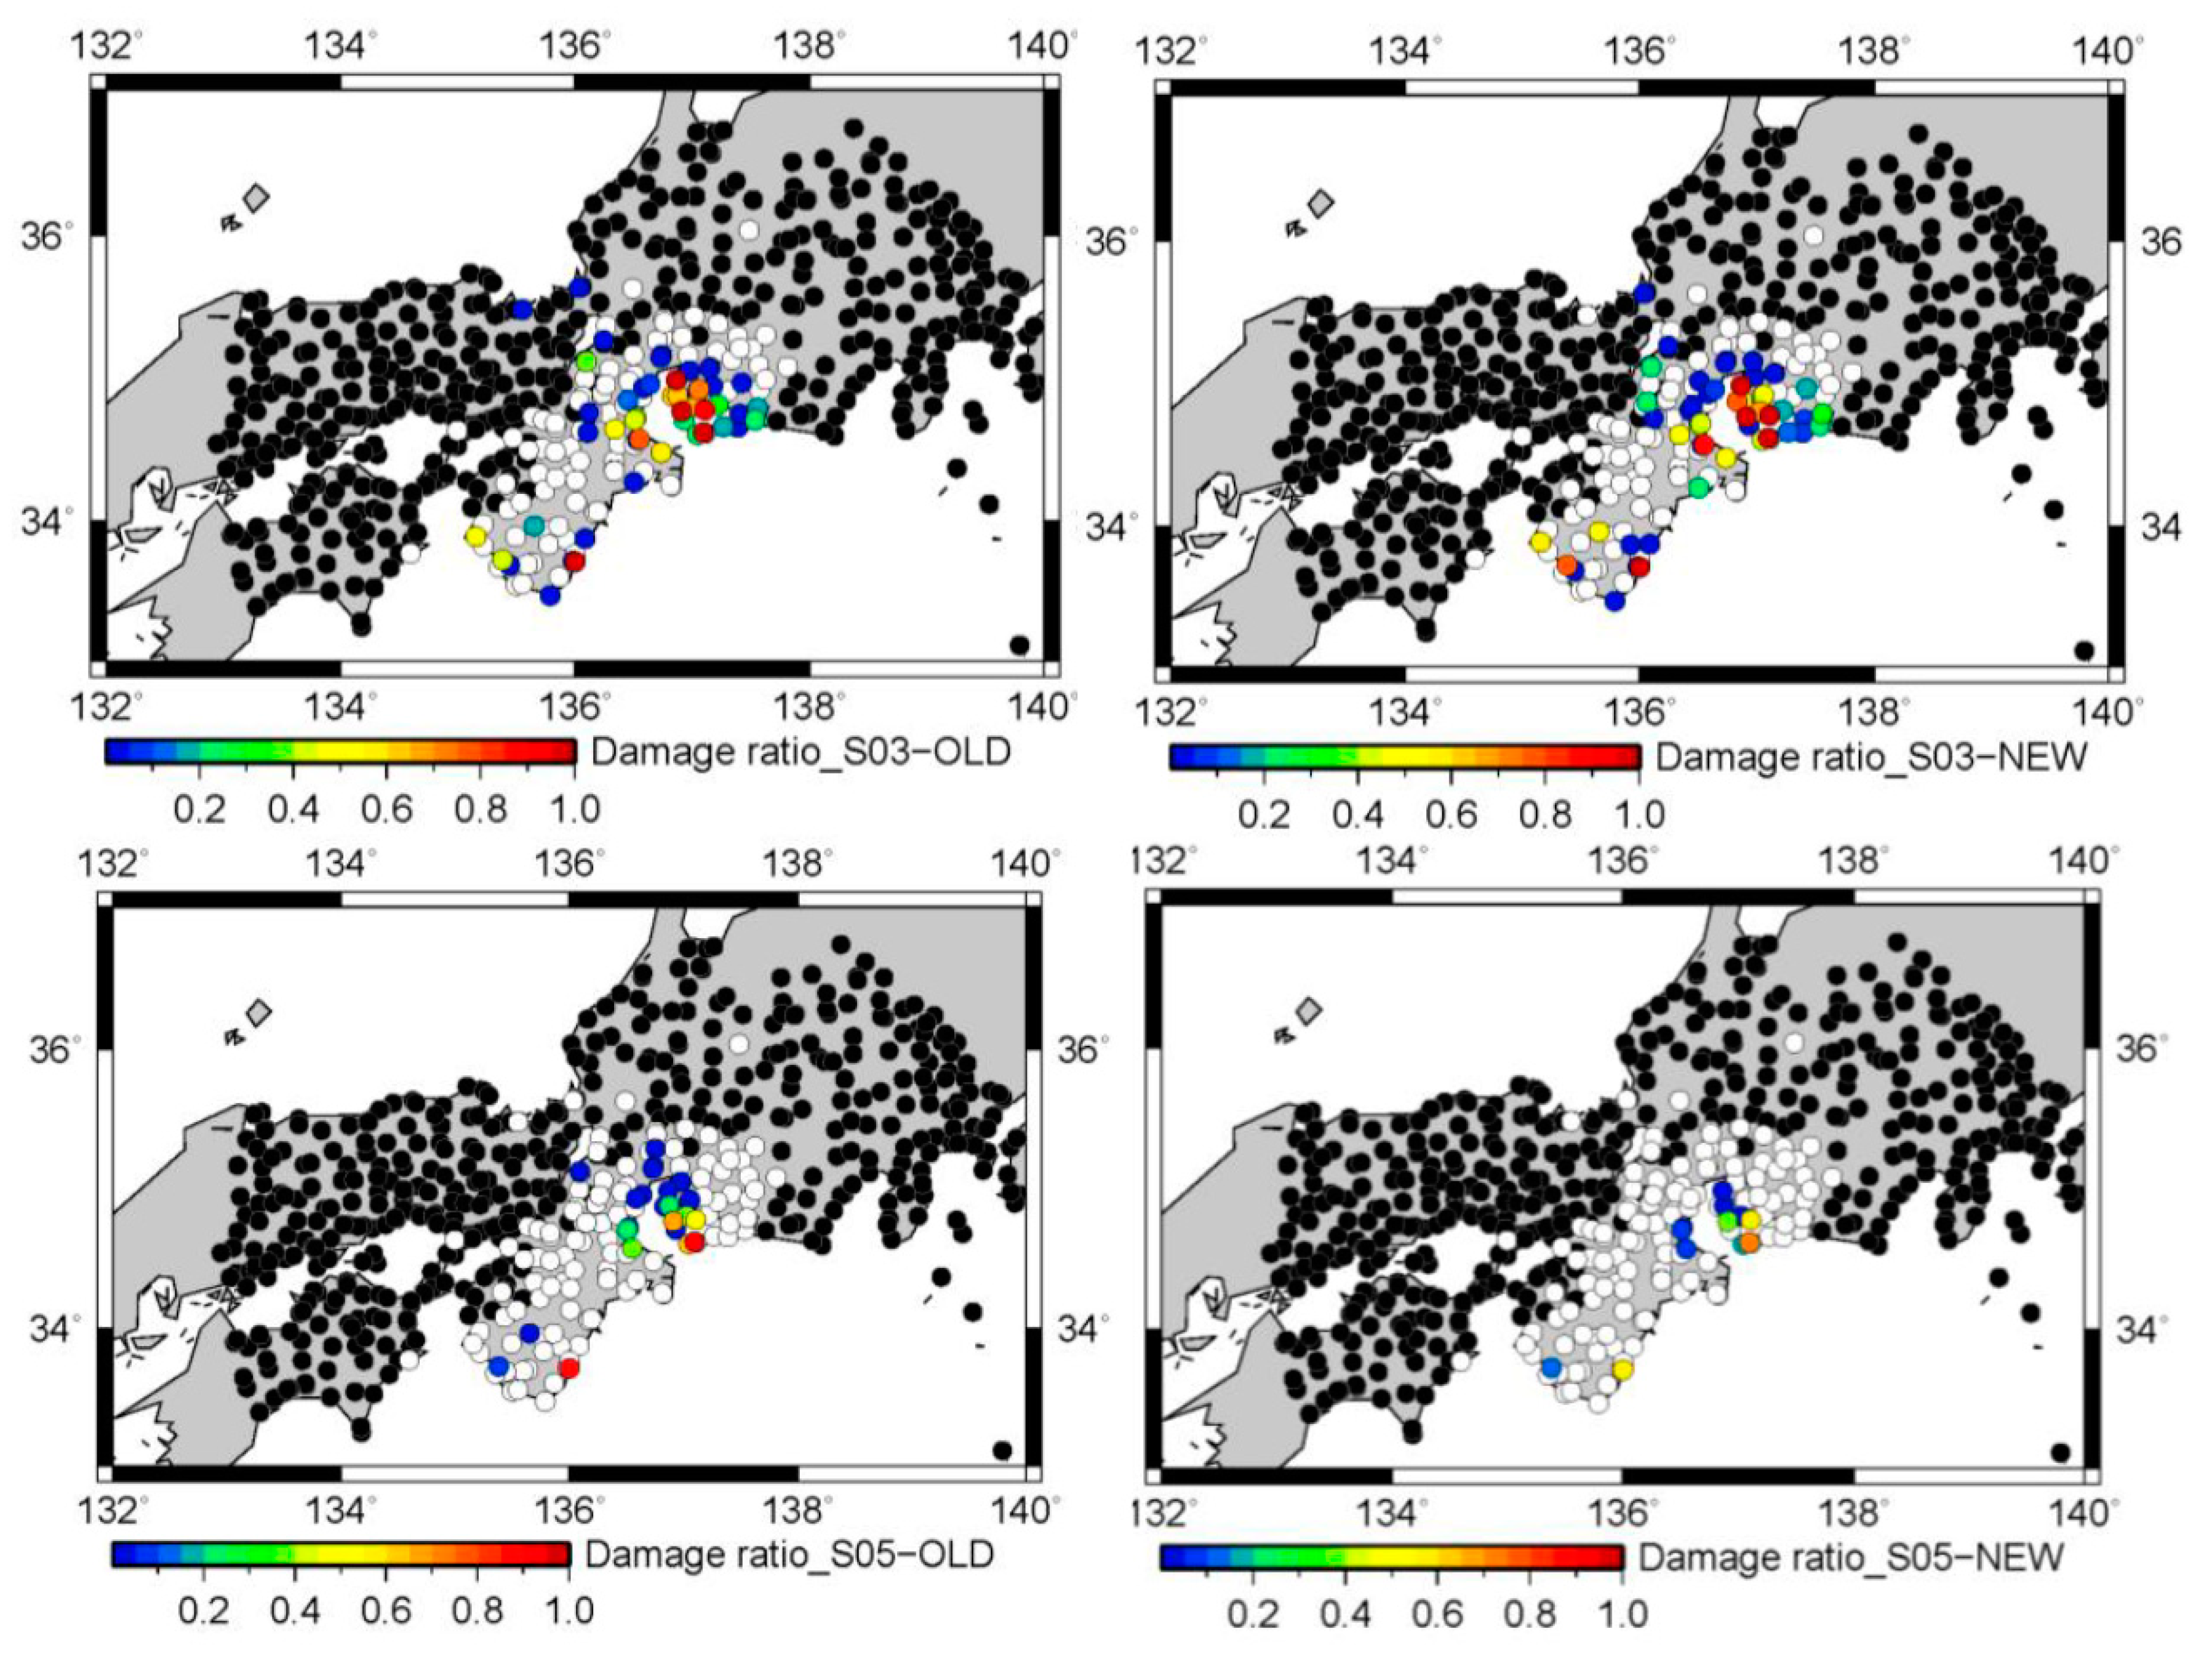
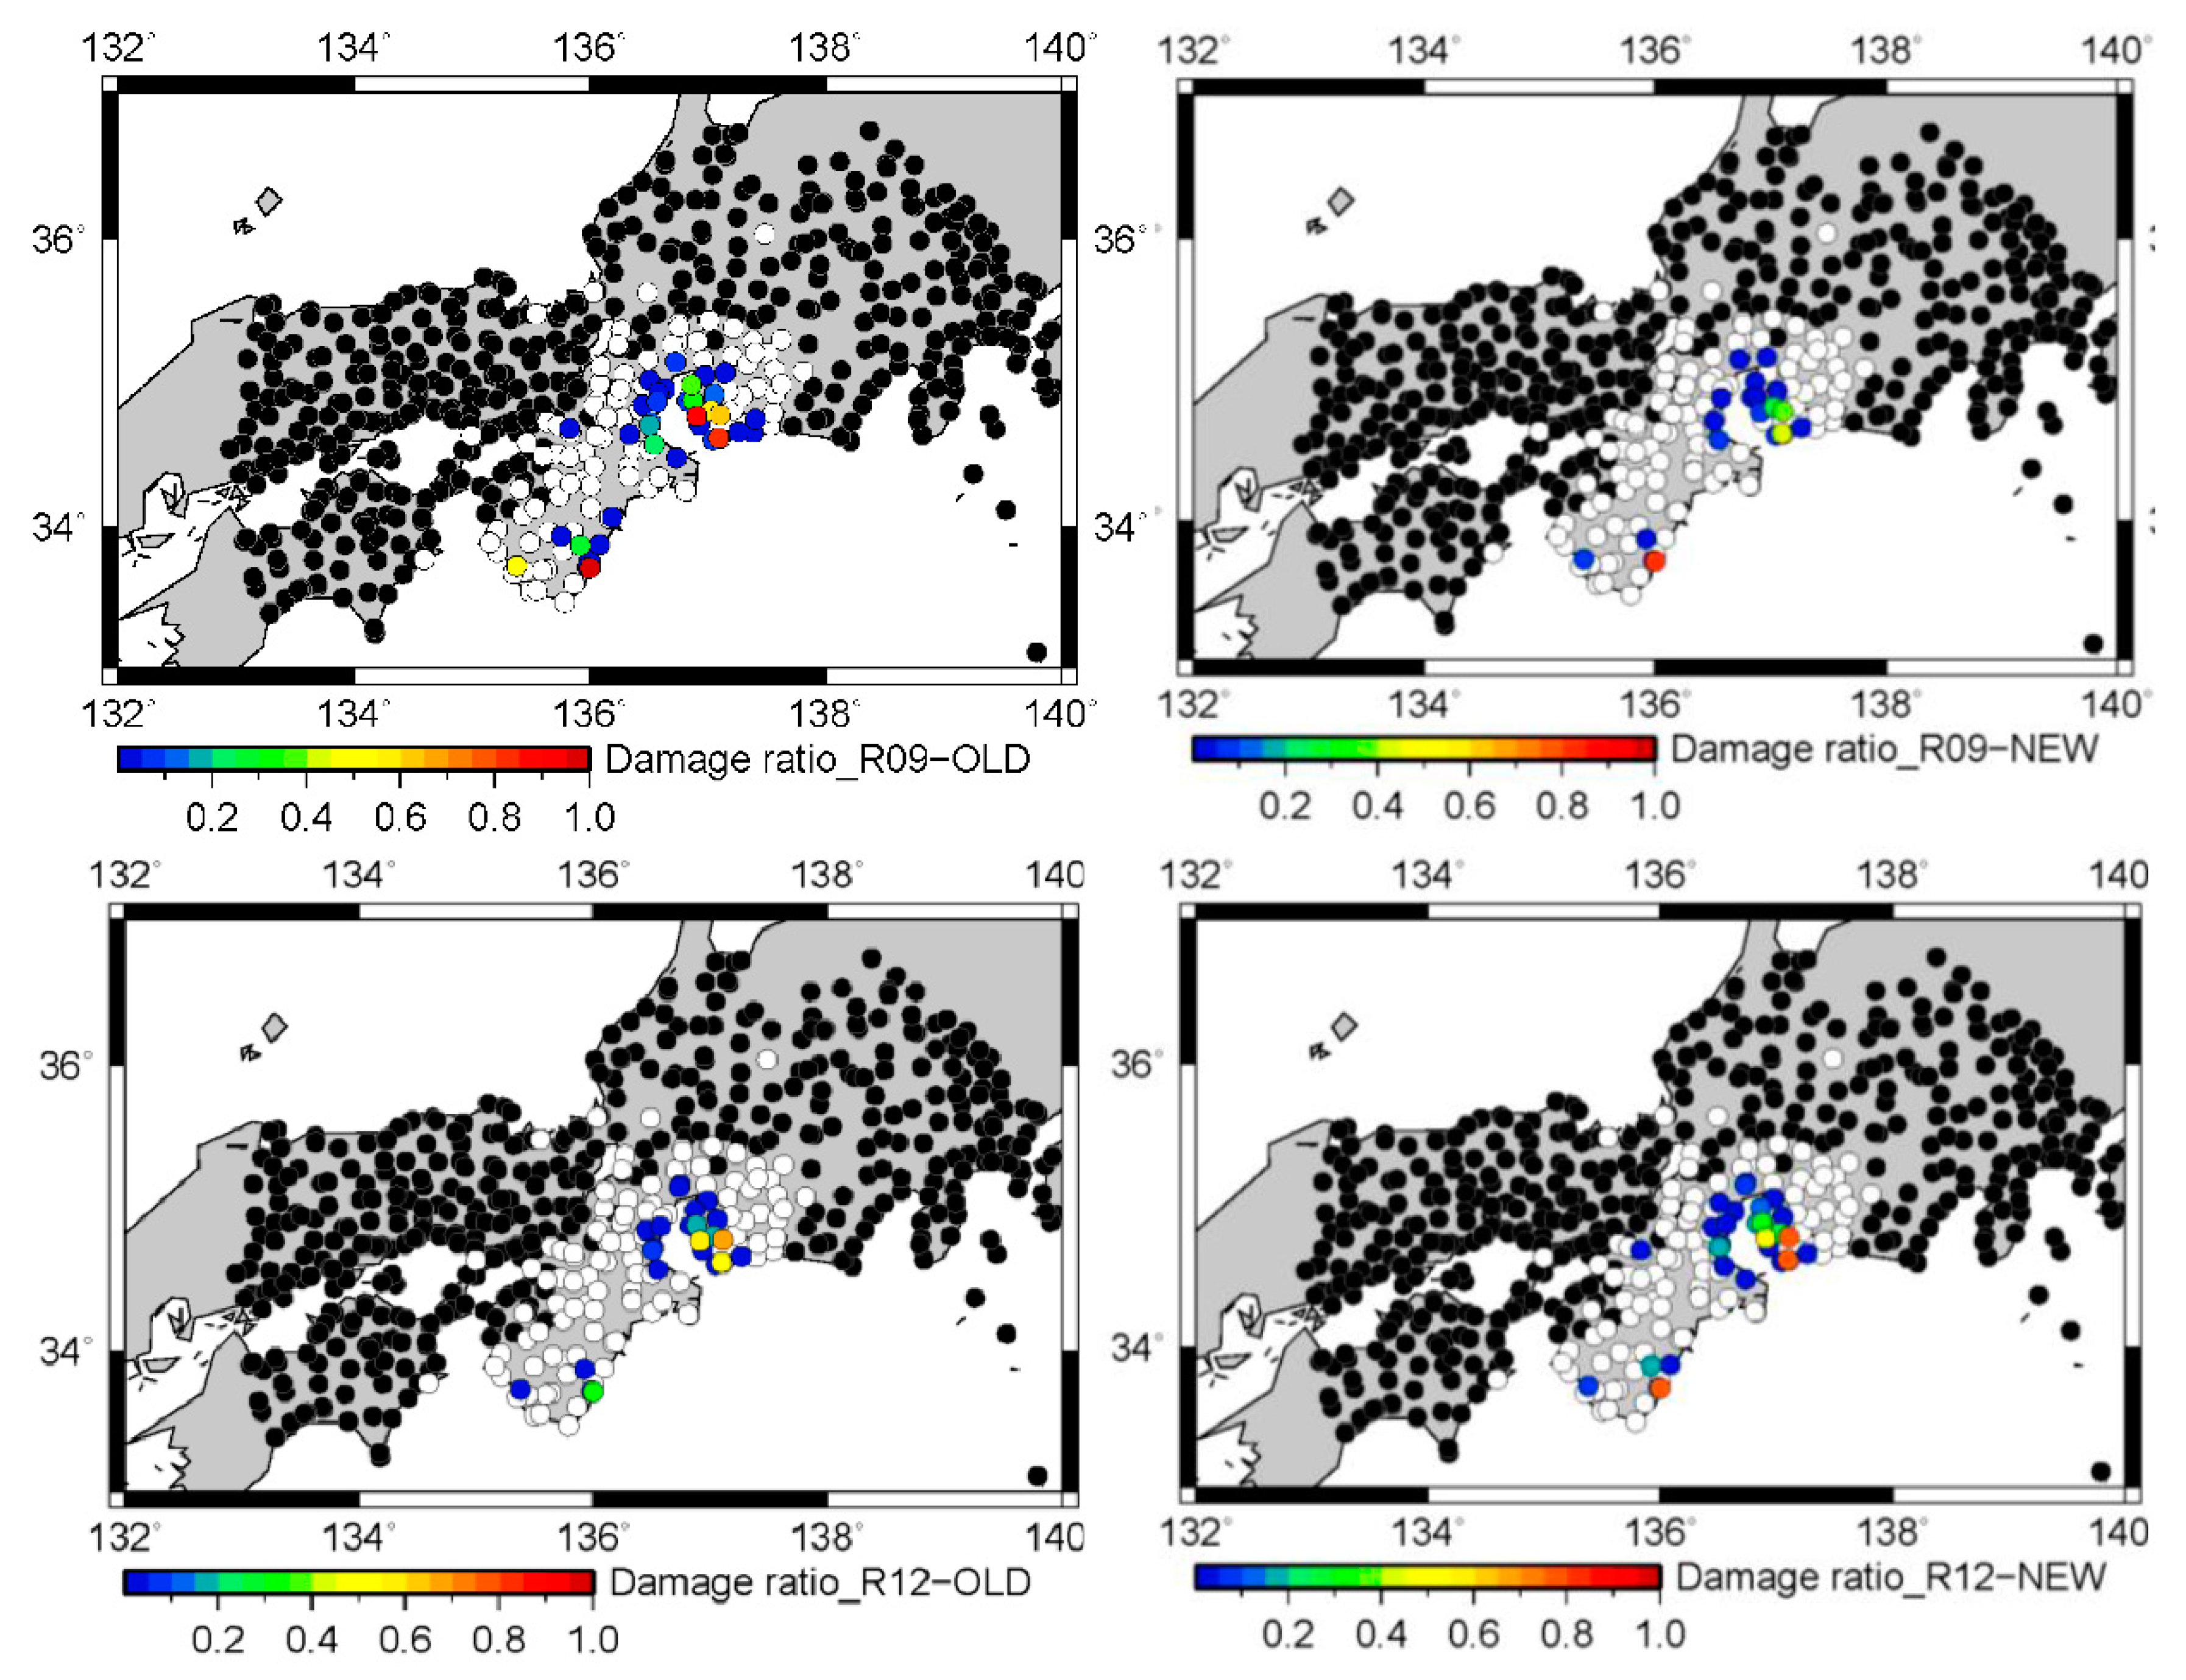
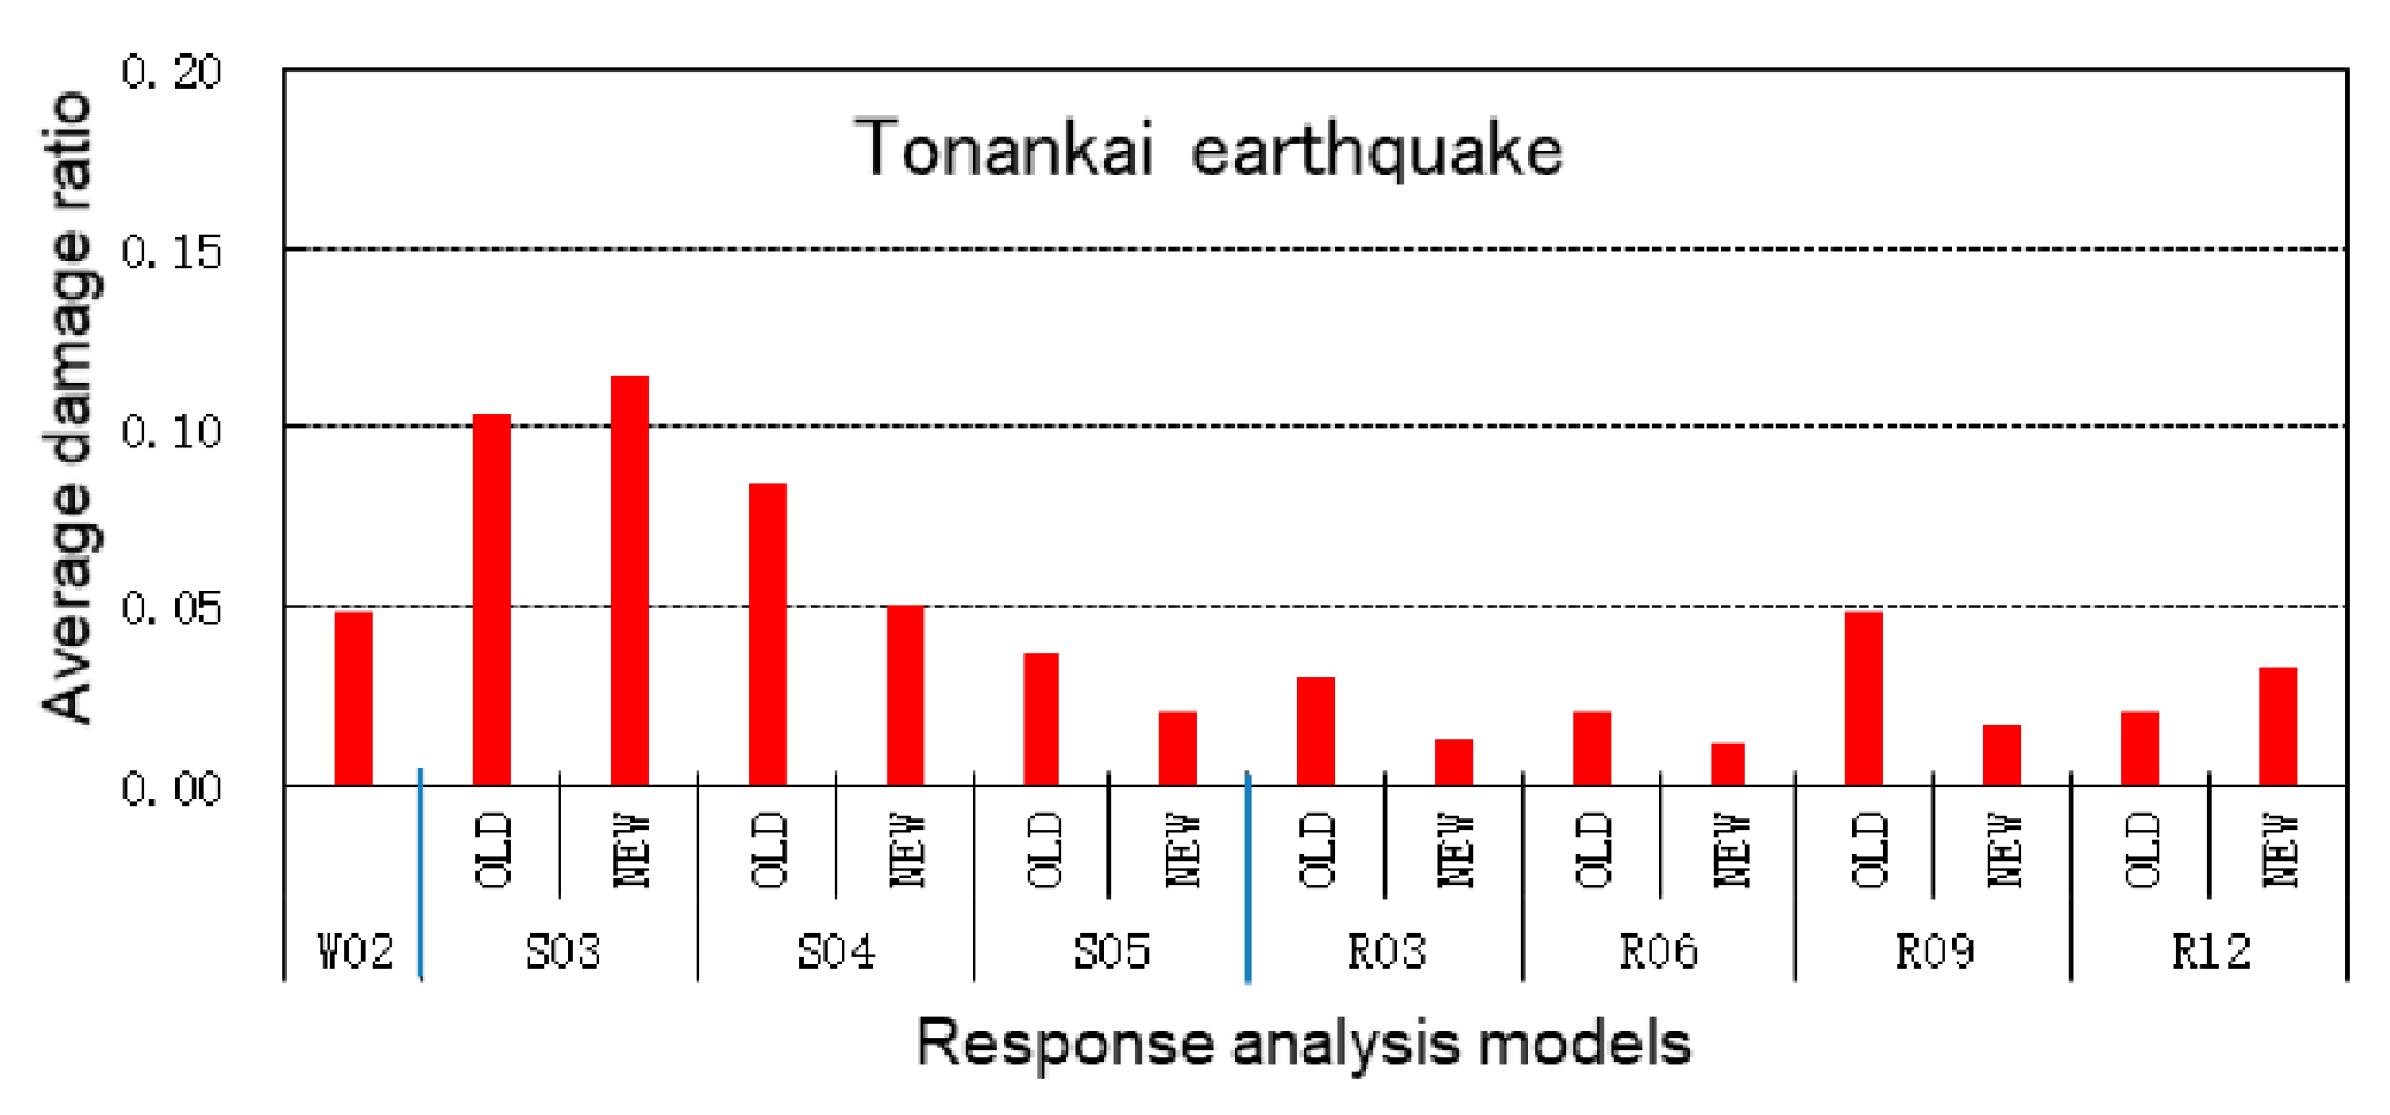
Figure 14, Figure 15, Figure 16 and Figure 17 show the damage ratio distributions based on the Nagato–Kawase model from the strong ground motion of a hypothesized Tonankai earthquake for wooden houses W02 (Figure 14, together with the estimated seismic intensity distribution), three- and five-storied steel structures, S03 and S05 (Figure 15), three- and six-storied RC structures, R03 and R06 (Figure 16), and nine- and twelve-storied RC structures, R09 and R12 (Figure 17). The old (pre-1981) and new (post-1981) building standard for seismic performance is distinguished except for wooden houses. Figure 18 shows simple average damage ratios at all the sites where the damage ratios are calculated for different structural types, the number of stories, and construction ages. From these figures it is apparent that the old buildings built before 1981 have higher damage ratios than new buildings built after 1981, low-rise steel structures have the highest damage ratios in lower stories, and old nine-storied RC buildings have highest damage ratio among RC structures. Based on the structural type, the damage ratio is highest in steel structures, followed by wooden houses, and then RC structures.
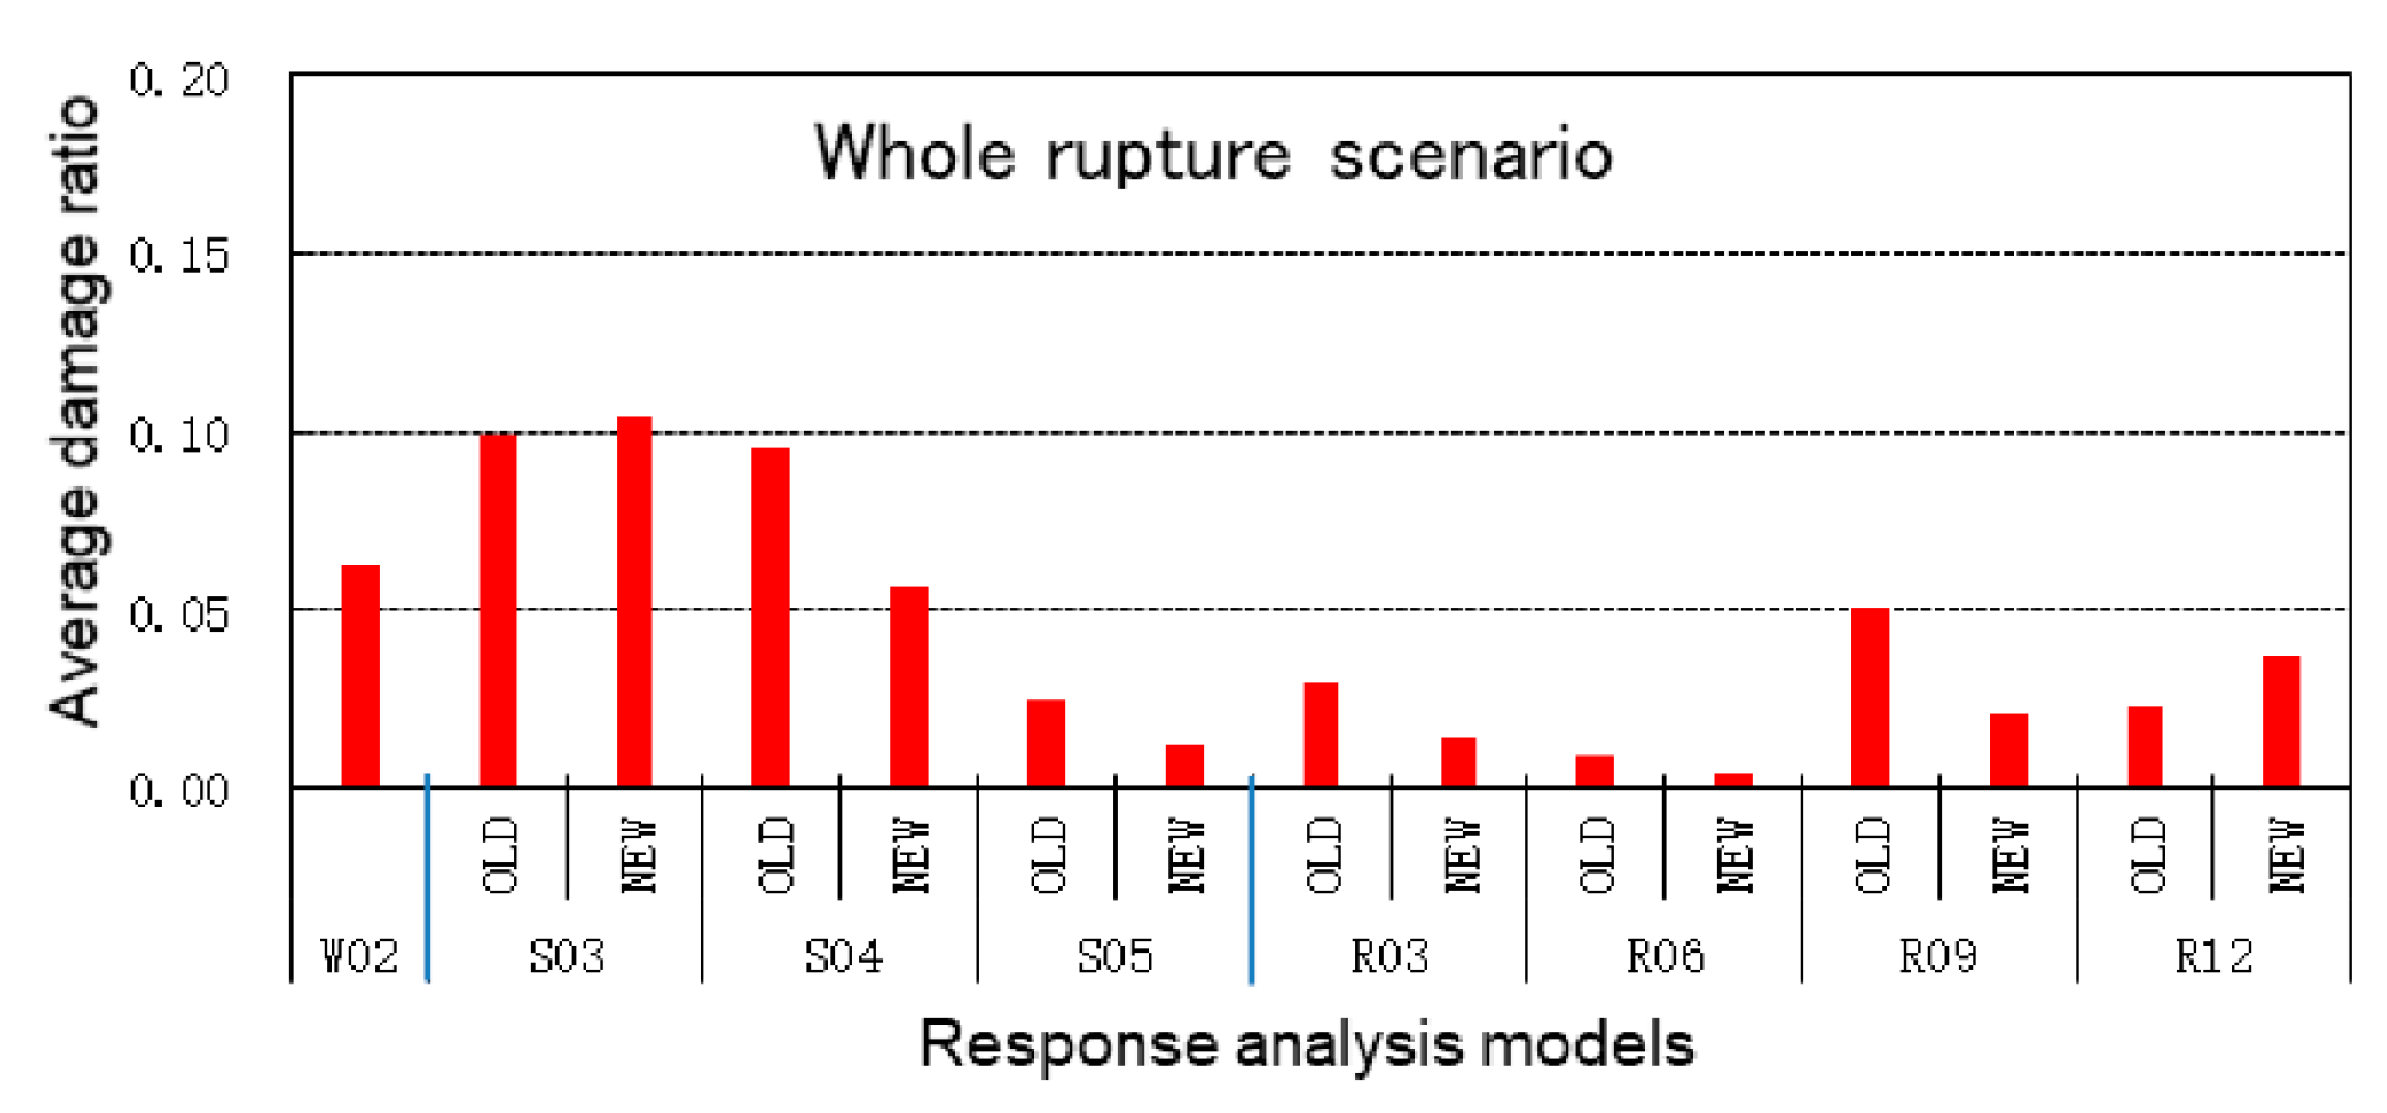
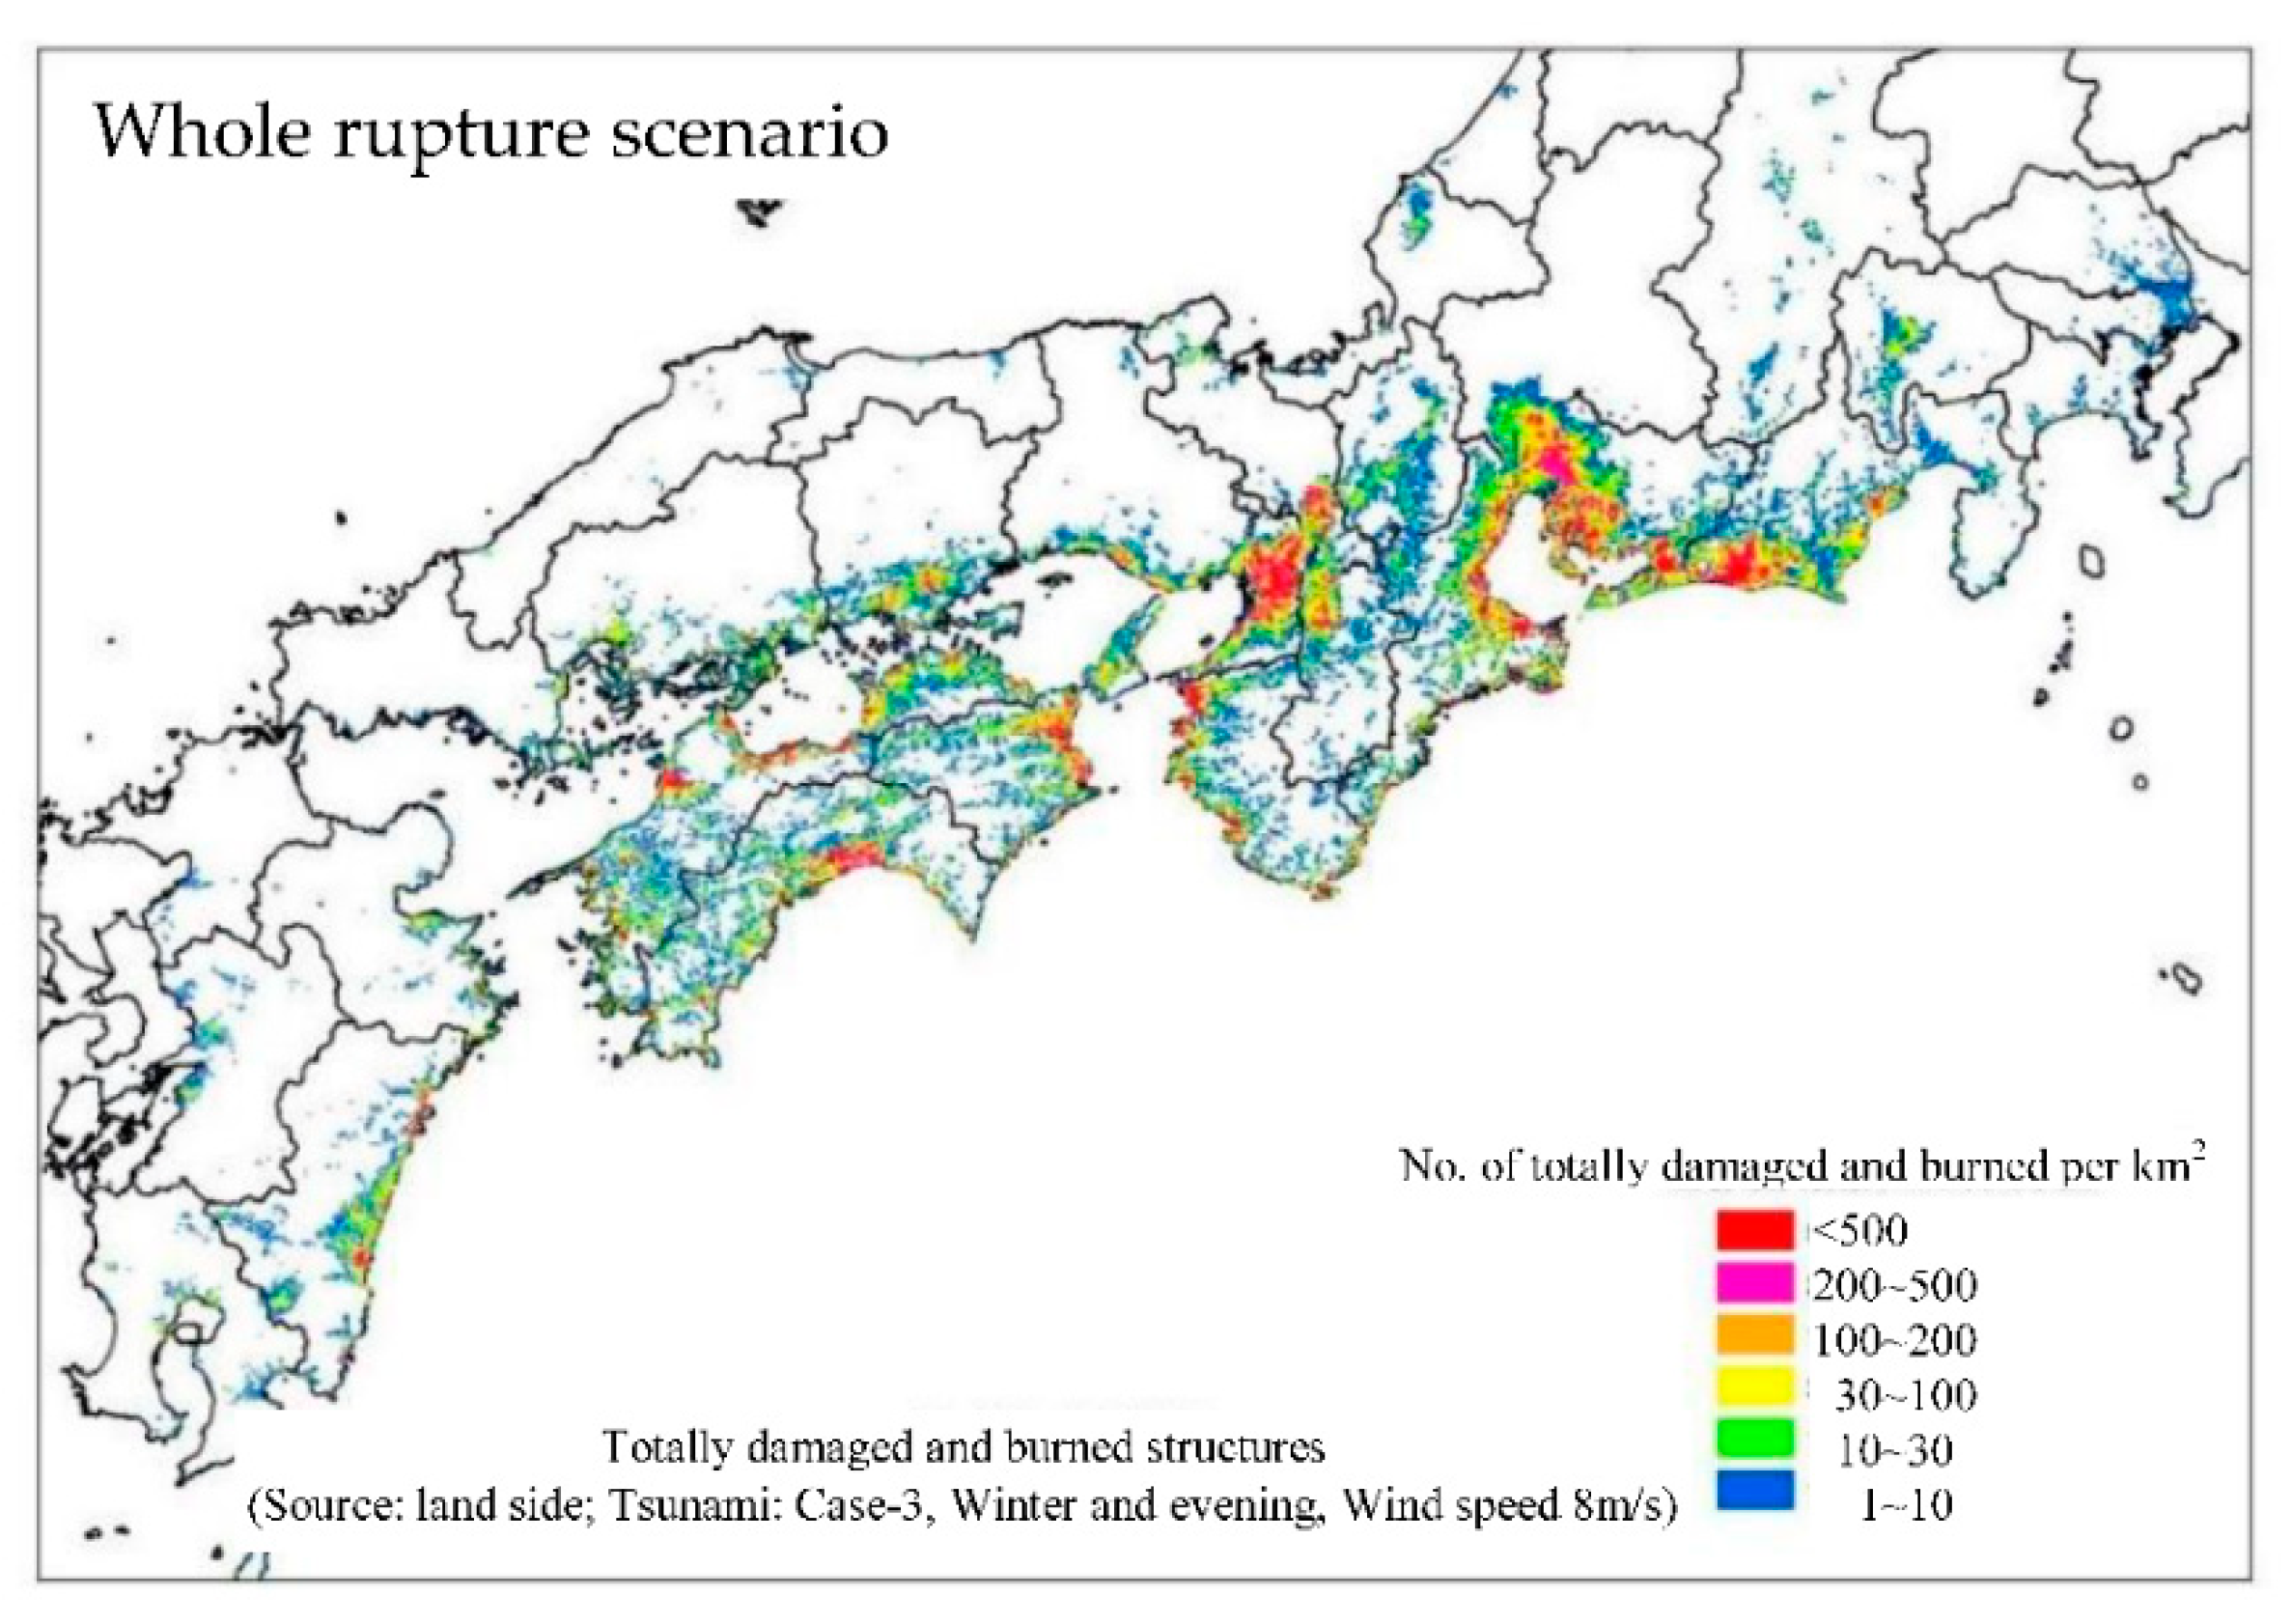
Similarly, Figure 19, Figure 20, Figure 21 and Figure 22 compare damage ratio distributions from the hypothesized whole rupture scenario along the Nankai Trough for wooden houses (W02), three- and five-storied steel structures (S03, S05), three- and six-storied RC structures (R03, R06), and nine- and twelve-storied RC structures (R09, R12). The corresponding average damage ratios at all the sites with non-zero damage ratios are shown in Figure 23. When we compare these overall damage ratios for the whole rupture scenario with those for the Tonankai earthquake shown in Figure 18, we found that the percentage of increase is only 10 to 20% from the damage ratios of the Tonankai earthquake and the increased ratios are only a few percent at most. A comparison of the damage ratio distributions presented here against the distribution of the numbers of damaged buildings per unit area from the CDMC report [32], which is reproduced in Figure 24, shows that the calculated damage ratios in this study are high at places where not a large population exists and so the resultant numbers of buildings could not be so high at these places as in the CDMC map. On the other hand, the overall estimate of the numbers of damaged buildings per unit area (i.e., density) in the urbanized districts such as Osaka City and Nagoya City seems too high in the CDMC prediction considering the not-so-high damage ratios predicted in this study. There are several reasons to which we can attribute the source of this significant discrepancy, which will be discussed later.

5. Discussion

In this paper, we calculated the strong ground motions in southwestern Japan for a hypothesized Tonankai earthquake and the whole rupture scenario along the Nankai Trough using a non-uniform slip model and a statistical Green’s function derived from observed ground motions. The resultant synthetics were compared with well-established GMPE predictions and seismic intensity estimates from the historical damage records as well as the predicted maps made by CDMC for disaster preparation activities inside the Japanese government. As long as the stochastic nature of the source, path, and site effects is properly represented in the elementary source and the scaling relationships from the elementary source to the hypothesized mega-thrust events are properly expressed, the resultant synthetics would be quantitatively predicted. The major drawback of the current approach, which is based on the observed strong motions, is its inability of prediction at an arbitrary point; we need to deploy a seismic station at a target site if it is not close to any of the stations that we used.
There are several ways to skip that kind of time-consuming effort in order to obtain a site-specific site amplification factor. One way is to use observed microtremors at the site and apply the recently proposed double correction method on the horizontal-to-vertical spectral ratio (HVSR) of microtremors [37]. In the double correction method, first, the HVSR of microtremors should be converted to the HVSR of earthquakes using an empirically determined spectral ratio. Then, the transformed HVSR of earthquakes should be converted to the horizontal site amplification factor using an empirically determined average vertical amplification correction factor. The validity of the latter has also been reported by Ito et al. [38].
Another viable way is to use ground response analysis (GRA) to calculate the site-specific site amplification factor through 1D/2D/3D numerical modeling of the underground structure around the site. However, we need to have a good velocity structure from the surface down to the seismological bedrock where we need not consider any site effects, which means the layer whose S-wave velocity should be 3 km/s or higher. It is not easy to delineate a reliable velocity structure of that scale at an arbitrary point without a significant investment. Recently, we have proposed an innovative way to interpolate site amplification factors in between the strong motion stations using 1D GRA based on the detailed velocity profiles with the spatial resolution of 250 m in the Kanto and Tokai regions [39].
After synthetic ground motions were obtained, we performed the damage prediction of wooden houses, steel structures, and RC structures using the building damage prediction model that relies on the nonlinear structural responses with multiple sub-models with different yield capacities. As a result, the possibility of heavy building damage or collapse was identified in the coastal regions close to the fault and regions with relatively thick, soft sediments, such as areas inside alluvial plains. These dangerous cities are found mainly around near-fault regions such as Kochi, Tokushima, and Wakayama Prefecture, and areas around the Ise Bay. The damage ratio by structure type is highest in steel structures, followed by wooden houses, and then RC structures.
The overall geographical pictures of our damage prediction are similar to the previous simulations by the government; however, we found that the prediction by CDMC [32] for the whole rupture scenario (Figure 24) seems to be overestimated by several reasons, although we have not translated yet our damage ratio prediction into the number of damaged buildings per unit area as conducted by CDMC. What are the possible sources of the difference between our prediction and theirs? The most influential problem of overestimation in CDMC prediction would be the use of the empirical vulnerability function based on the estimated PGVs and the damage ratios from the field survey during the past devastating earthquakes. In Japan, the majority of such data are coming from the 1995 Kobe earthquake [34,35], which is a typical crustal earthquake. The observed high PGVs in the epicentral areas of this earthquake were primarily controlled by the asperity pulses with a coherent nature in the intermediate period range around 1 s [5,6]. On the other hand, the high PGVs would be obtained inside a deep basin structure with thick and soft sediments during the mega-thrust events away from the shore, as is the case for the 2011 Tohoku earthquake. As mentioned before, we did not see any emergence of the high PGV regions in the intermediate period range and, subsequently, we did not see any significant structural damage during the Tohoku earthquake [33]. In our prediction of building damage, the Nagato–Kawase model also relies on the strong ground motions and the damage statistics during the 1995 Kobe earthquake; however, Nagato and Kawase utilized them to construct the nonlinear response models that consider basic dynamic structural behavior from the current building standard and to optimize the realistic yield capacities in order to reproduce observed damage ratios. Thus, the model can be used to predict damage for synthetic ground motions from not only crustal earthquakes but also mega-thrust events.
We also need to point out the potential problem of the strength index of the ground motion to be used in the damage prediction. As mentioned above, no matter what we use as the representative strength index of the ground motion at a site, they would be a kind of extracted value from the whole ground motion time history. This means that we cannot have a perfect strength index to be used for damage prediction. By any operation to the time history in order to obtain the strength index, we are losing some valuable information from the whole time history of ground motion. It is not so meaningful to find a better strength index among so many possibilities because of the fundamental nature of the extraction. It would be better to use the whole time history of ground motion when we predict structural damage because the structural damage is a direct consequence of the input ground motion, not the direct consequence of the strength index extracted from the ground motion. For example, among the strength index based on the peak value of the ground motion, PGV would be the best index for damage prediction (e.g., [34,35]). However, a ground motion with high PGV in a long-period (>2 s) range could not cause any heavy structural damage because ordinary low- and middle-rise buildings would not respond to such a long-period input.
As an advantage of using the Nagato–Kawase model, we can evaluate the effectiveness of countermeasures such as seismic retrofitting and increase of seismic demand in the regulations for new construction. Although we would like to report separately, we have conducted two case studies by introducing the policy to retrofit all the buildings to have 1.25 or 1.5 times the current yield capacity. We found that, roughly speaking, we can reduce damage ratios by about 20% for a 1.25 times increased case and by 30% for a 1.5 times increased case with respect to the average damage ratios shown in Figure 18 or Figure 23. It is a kind of significant number, however, if we consider the necessary cost as a whole and the benefit of this retrofitting when the event occurs; it turns out that this kind of countermeasure for all the buildings in the area does not make sense. This means that when we consider countermeasures using earthquake resistance reinforcement against a coming mega-thrust earthquake along the Nankai Trough, such efforts should be focused only on the regions and structures with high damage potential as delineated by our prediction maps (Figure 14, Figure 15, Figure 16, Figure 17, Figure 19, Figure 20, Figure 21, and Figure 22). Although it may not be easy to implement such a selective strategy as a public policy, it is not rational to reinforce all the buildings in the whole target area, most of which will survive without reinforcement.
It is still early to practically implement the earthquake prediction and subsequent broadcast of the warning message for the expected Nankai Trough mega-thrust events; the emerging discovery reported recently by Sarlis et al. [40] could make it possible for such an earthquake prediction a few months before the mainshock in future. Once it becomes possible, we can better prepare for such an event by using the damage prediction shown in this paper for the specific location and size of the predicted event. Our damage prediction shows that the structural damage would be concentrated in several areas and cities with strong dependence on the type of the building and number of stories and therefore, the effective countermeasures should be made by reflecting these differences in the predicted structural damage. Our damage prediction here is much more modest than those worst-case scenarios of CDMC (e.g., Figure 24), and each local government could make a concrete plan for the immediate actions toward the potential disaster in such a short time.
As a necessary process for more quantitative prediction of building damage, we need to carry out earthquake response analysis using building models in the historical events during these last several hundreds of years along the Nankai Trough [31] to calibrate both our modeling technique for the rupture complexity on the fault and the proper representation of the source, path, and site effects during these events in the past.

6. Conclusions

We calculated the strong ground motions in southwestern Japan from a hypothesized Tonankai earthquake and a hypothesized whole rupture scenario along the Nankai Trough using a seismogenic fault model with a kinematic representation of heterogeneous slip distribution and a statistical Green’s function based on the observed ground motions by the nationwide strong-motion networks. Then, we performed the damage prediction of wooden houses, RC structures, and steel structures using the synthetic strong ground motions from these two types of events as input to building damage prediction models that utilize statistical properties of the nonlinear behavior of buildings with different types, stories, and construction ages. As a result, the possibility of serious building damage was identified in the coastal regions and regions with relatively soft sediments where we have stronger ground motions. We found that spatial irregularities of the predicted damage level are quite strong and different from structural types, stories, and construction ages. The damage ratio by structure type is highest in steel structures, followed by wooden houses and RC structures. When we consider countermeasures including earthquake resistance reinforcement against a mega-thrust event along the Nankai Trough, we need to reflect the strong spatial dependence of the higher damage potential for cost-effective implementation of such countermeasures.

Author Contributions

Conceptualization, H.K.; methodology, H.K. and N.M.; software, N.M.; validation, B. and N.M.; formal analysis, B.; investigation, B.; resources, B. and H.K.; data curation, B.; writing—original draft preparation, B.; writing—review and editing, H.K.; visualization, B.; supervision, H.K.; project administration, H.K.; funding acquisition, H.K. All authors have read and agreed to the published version of the manuscript.

Funding

This research was partially funded by Hanshin Consultants Co., Ltd (2-4-25 Ohmiyacho, Nara 630-8115, JAPAN), as a donation for the chair of Sophisticated Earthquake Risk Evaluation, Disaster Prevention Research Institute, Kyoto University.

Institutional Review Board Statement

Not applicable.

Informed Consent Statement

Not applicable.

Data Availability Statement

Strong motion data used in this paper are available at https://www.kyoshin.bosai.go.jp/ (accessed on 28 April 2021) for K-NET and KiK-net, whereas at https://www.data.jma.go.jp/svd/eqev/data/kyoshin/jishin/index.html (accessed on 28 April 2021) for JMA seismic intensity meters.

Acknowledgments

We would like to express our acknowledgment to NIED and JMA who offered observed strong ground motions and related metadata. The comments from anonymous reviewers contributed to improve the quality of the manuscript.

Conflicts of Interest

There is no conflict of interest as far as the authors are concerned.

References

  1. The Headquarters of Earthquake Research Promotion (HERP). Report: “National Seismic Hazard Maps for Japan (2020)”. Available online: https://www.jishin.go.jp/main/chousa/20_yosokuchizu/yosokuchizu2020_tk_3.pdf (accessed on 28 April 2021). (In Japanese).
  2. Nagato, K.; Kawase, H. A Set of Dynamic Models of Steel Buildings for Damage Evaluation. J. Struct. Constr. Eng. (Trans. AIJ) 2002, 67, 101–106, (In Japanese with English abstract). [Google Scholar] [CrossRef] [Green Version]
  3. Nagato, K.; Kawase, H. Damage Evaluation Models of Reinforced Concrete Buildings Based on the Damage Statistics and Simulated Strong Motions During the 1995 Hyogo-ken Nanbu Earthquake. Earthq. Eng. Struct. Dyn. 2004, 33, 755–774. [Google Scholar] [CrossRef]
  4. Nagato, K.; Kawase, H. A Set of Wooden House Models for Damage Evaluation Based on Observed Damage Statistics and Non-Linear Response Analysis and Its Application to Strong Motions of Recent Earthquakes. In Proceedings of the 11th Japan Earthquake Engineering Symposium, Tokyo, Japan, 20–22 November 2002. [Google Scholar]
  5. Matsushima, S.; Kawase, H. Multiple Asperity Source Model of the Hyogo-Ken Nanbu Earthquake of 1995 and Strong Motion Simulation in Kobe. J. Struct. Constr. Eng. (Trans. AIJ) 2000, 65, 33–40, (In Japanese with English abstract). [Google Scholar] [CrossRef] [Green Version]
  6. Matsushima, S.; Kawase, H. Re-Evaluation of Strong Motion and Damage of Wooden Houses in Kobe City during the 1995 Kobe Earthquake. J. Struct. Eng. Ser. B 2009, 55B, 537–543, (In Japanese with English abstract). [Google Scholar]
  7. Central Disaster Management Council (CDMC). Report of the Special Committee for Tonankai and Nankai Earthquakes. Report for 10th Committee Meeting. 2004. Available online: http://www.bousai.go.jp/kaigirep/chuobou/senmon/tounankai_nankaijishin/10/index.html (accessed on 28 April 2021). (In Japanese).
  8. Kawase, H. Site Effects on Strong Ground Motions. In International Handbook of Earthquake and Engineering Seismology, Part B; Lee, W.H.K., Kanamori, H., Eds.; Academic Press: London, UK, 2003; pp. 1013–1030. [Google Scholar]
  9. Koketsu, K.; Miyake, H.; Suzuki, H. Japan Integrated Velocity Structure Model, Version 1. In Proceedings of the 15th World Conference on Earthquake Engineering, Lisbon, Portugal, 24–28 September 2012. [Google Scholar]
  10. Si, H.; Midorikawa, S. New Attenuation Relations for Peak Ground Acceleration and Velocity Considering Effects of Fault Type and Site Condition. J. Struct. Constr. Eng. (Trans. AIJ) 1999, 523, 63–70, (In Japanese with English abstract). [Google Scholar] [CrossRef] [Green Version]
  11. Kanno, T.; Narita, A.; Morikawa, N.; Fujiwara, H.; Fukushima, Y. A New Attenuation Relation for Strong Ground Motion in Japan Based on Recorded Data. Bull. Seismol. Soc. Am. 2006, 96, 879–897. [Google Scholar] [CrossRef]
  12. Boore, D.M. Stochastic Simulation of High Frequency Ground Motions Based on Seismological Models of the Radiated Spectra. Bull. Seism. Soc. Am. 1983, 73, 1865–1894. [Google Scholar]
  13. Irikura, K. Prediction of Strong Acceleration Motions Using Empirical Green’s Function. In Proceedings of the 7th Japan Earthquake Engineering Symposium, Tokyo, Japan, 10–12 December 1986; pp. 151–156. [Google Scholar]
  14. Dan, K.; Watanabe, T.; Tanaka, T. A semi-empirical method to synthesize earthquake ground motions based on approximate far-field shear-wave displacement. J. Struct. Constr. Eng. (Trans. AIJ) 1989, 396, 27–36. [Google Scholar] [CrossRef] [Green Version]
  15. Kamae, K.; Irikura, K. Source Model of the 1995 Hyogo-Ken Nanbu Earthquake and Simulation of Near-Source Ground Motion. Bull. Seism. Soc. Am. 1998, 88, 400–412. [Google Scholar]
  16. Kamae, K.; Kawabe, H. Source Model Composed of Asperities for The 2003 Tokachi-Oki, Japan, Earthquake (MJMA = 8.0) Estimated by the Empirical Green’s Function Method. Earth Planets Space 2004, 56, 323–327. [Google Scholar] [CrossRef] [Green Version]
  17. Ho, N.; Kawase, H. Broadband Stochastic Green’s Functions Based on Observed Data by Strong Motion Networks and Its Application to Nankai earthquake. J. Jpn. Assoc. Earthq. Eng. 2007, 7, 80–95, (In Japanese with English abstract). [Google Scholar]
  18. Kawase, H.; Matsuo, H. Separation of Source, Path, and Site Effects based on the Observed Data by K-NET, KiK-net, and JMA Strong Motion Network. J. Jpn. Assoc. Earthq. Eng. 2004, 4, 33–52, (In Japanese with English abstract). [Google Scholar]
  19. Dziewonski, A.M.; Chou, T.-A.; Woodhouse, J.H. Determination of Earthquake Source Parameters from Waveform Data for Studies of Global and Regional Seismicity. J. Geophys. Res. 1981, 86, 2825–2852. [Google Scholar] [CrossRef]
  20. Fukuyama, E.; Ishida, M.; Dreger, D.S.; Kawai, H. Automated Seismic Moment Tensor Determination by Using On-line Broadband Seismic Waveforms. Zisin Ser. II 1998, 51, 149–156, (In Japanese with English abstract). [Google Scholar] [CrossRef] [Green Version]
  21. Aoi, S.; Kunugi, T.; Fujiwara, H. Strong-motion seismograph network operated by NIED: K-NET and KiK-net. J. Jpn. Assoc. Earthq. Eng. 2004, 4, 65–74. [Google Scholar] [CrossRef] [Green Version]
  22. Shabestari, T.K.; Yamazaki, F. A Proposal of Instrumental Seismic Intensity Scale Compatible with the MMI Evaluated from Three-Component Acceleration Records. Earthq. Spectra 2001, 17, 711–723. [Google Scholar] [CrossRef] [Green Version]
  23. Nakano, K.; Matsushima, S.; Kawase, H. Statistical Properties of Strong Ground Motions from the Generalized Spectral Inversion of Data Observed by K-NET, KiK-Net, and the JMA Shindokei Network in Japan. Bull. Seism. Soc. Am. 2015, 105, 2662–2680. [Google Scholar] [CrossRef]
  24. Irikura, K.; Miyake, H. Recipe for Predicting Strong Ground Motion from Crustal Earthquake Scenarios. Pure Appl. Geophys. 2011, 168, 85–104. [Google Scholar] [CrossRef] [Green Version]
  25. Kawabe, H.; Kamae, K. Prediction of Long-Period Ground Motions from Huge Subduction Earthquakes in Osaka, Japan. J. Seismol. 2008, 12, 173–184. [Google Scholar] [CrossRef]
  26. Somerville, P.; Irikura, K.; Graves, R.; Sawada, S.; Wald, D.; Abrahamson, N.; Iwasaki, Y.; Kagawa, T.; Smith, N.; Kowada, A. Characterizing Crustal Earthquake Slip Models for the Prediction of Strong Ground Motion. Seism. Res. Lett. 1999, 70, 59–80. [Google Scholar] [CrossRef]
  27. Miyake, H.; Iwata, T.; Irikura, K. Source Characterization for Broadband Ground-Motion Simulation: Kinematic Heterogeneous Source Model and Strong Motion Generation Area. Bull. Seism. Soc. Am. 2003, 93, 2531–2545. [Google Scholar] [CrossRef]
  28. The Headquarters of Earthquake Research Promotion (HERP). Interim Report: “Strong Motion Prediction Method for Nankai Trough Earthquakes”. 2001. Available online: https://www.jishin.go.jp/main/kyoshindo/pdf/20011207nankai.pdf (accessed on 28 April 2021). (In Japanese).
  29. Karim, K.R.; Yamazaki, F. Correlation of JMA instrumental seismic intensity with strong motion parameters. Earthq. Eng. Struct. Dyn. 2002, 31, 1191–1212. [Google Scholar] [CrossRef]
  30. Japan Meteorological Agency (JMA). Monitoring of Earthquakes, Tsunamis and Volcanic Activity. Available online: https://www.jma.go.jp/jma/en/Activities/earthquake.html (accessed on 28 April 2021).
  31. Ishibashi, K. Specification of a Soon-To-Occur Seismic Faulting in the Tokai District, Central Japan, Based upon Seismotectonics. In Earthquake Prediction: An International Review; Simpson, D.W., Richards, P.G., Eds.; Maurice Ewing Series 4; AGU: Washington, DC, USA, 1981; pp. 297–332. [Google Scholar]
  32. The Central Disaster Management Council (CDMC). Report: “Damage Estimate of the Huge Earthquake of Nankai Trough (Initial Report)”. Available online: http://www.bousai.go.jp/jishin/nankai/taisaku/pdf/2_1.pdf (accessed on 28 April 2021). (In Japanese).
  33. Kawase, H.; Matsushima, S.; Baoyintu. 2.1 Earthquake and Ground Motions. In AIJ Preliminary Reconnaissance Report of the 2011 Tohoku-Chiho Taiheiyo-Oki Earthquake Section 2.1; Springer: Berlin, Germany, 2012; Available online: https://www.springer.com/gp/book/9784431540960 (accessed on 25 July 2021).
  34. Hayashi, Y.; Miyakoshi, J.; Tamura, K.; Kawase, H. Peak Ground Velocity Evaluated from Damage Ratio of Low-Rise Buildings during the Hyogo-Ken Nambu Earthquake of 1995. J. Struct. Constr. Eng. (Trans. AIJ) 1997, 62, 59–66, (In Japanese with English abstract). [Google Scholar] [CrossRef]
  35. Yamazaki, F.; Murao, O. Vulnerability Functions for Japanese Buildings Based on Damage Data from the 1995 Kobe Earthquake. In Implications of Recent Earthquakes on Seismic Risk; Imperial College Press: London, UK, 2000; Volume 2, pp. 91–102. [Google Scholar]
  36. Shibata, A. Prediction of the Probability of Earthquake Damage to Reinforced Concrete Building Groups in a City. In Proceedings of the 7th World Conference on Earthquake Engineering, Istanbul, Turkey, 8–13 September 1980; Volume 4, pp. 395–402. [Google Scholar]
  37. Kawase, H.; Nagashima, F.; Nakano, K.; Mori, Y. Direct Evaluation of S-Wave Amplification Factors from Microtremor H/V Ratios: Double Empirical Corrections to “Nakamura” Method. Soil Dyn. Earthq. Eng. 2018, 126, 10567. [Google Scholar] [CrossRef]
  38. Ito, E.; Nakano, K.; Nagashima, F.; Kawase, H. A Method to Directly Estimate S-Wave Site Amplification Factor from Horizontal-to-Vertical Spectral Ratio of Earthquakes (eHVSRs). Bull. Seismol. Soc. Am. 2020, 110, 2892–2911. [Google Scholar] [CrossRef]
  39. Ito, E.; Nakano, K.; Senna, S.; Kawase, H. S-Wave Site Amplification Factors from Observed Ground Motions in Japan: Validation of Delineated Velocity Structures and Proposal for Empirical Correction. In Earthquake; Salazar, W., Ed.; IntechOpen: London, UK, 2020. [Google Scholar] [CrossRef]
  40. Sarlis, N.V.; Skordas, E.S.; Varotsos, P.A.; Nagao, T.; Kamogawa, M.; Uyeda, S. Spatiotemporal Variations of Seismicity before Major Earthquakes in the Japanese Area and Their Relation with the Epicentral Locations. Proc. Nat. Acad. Sci. USA 2015, 112, 986–989. [Google Scholar] [CrossRef] [PubMed] [Green Version]
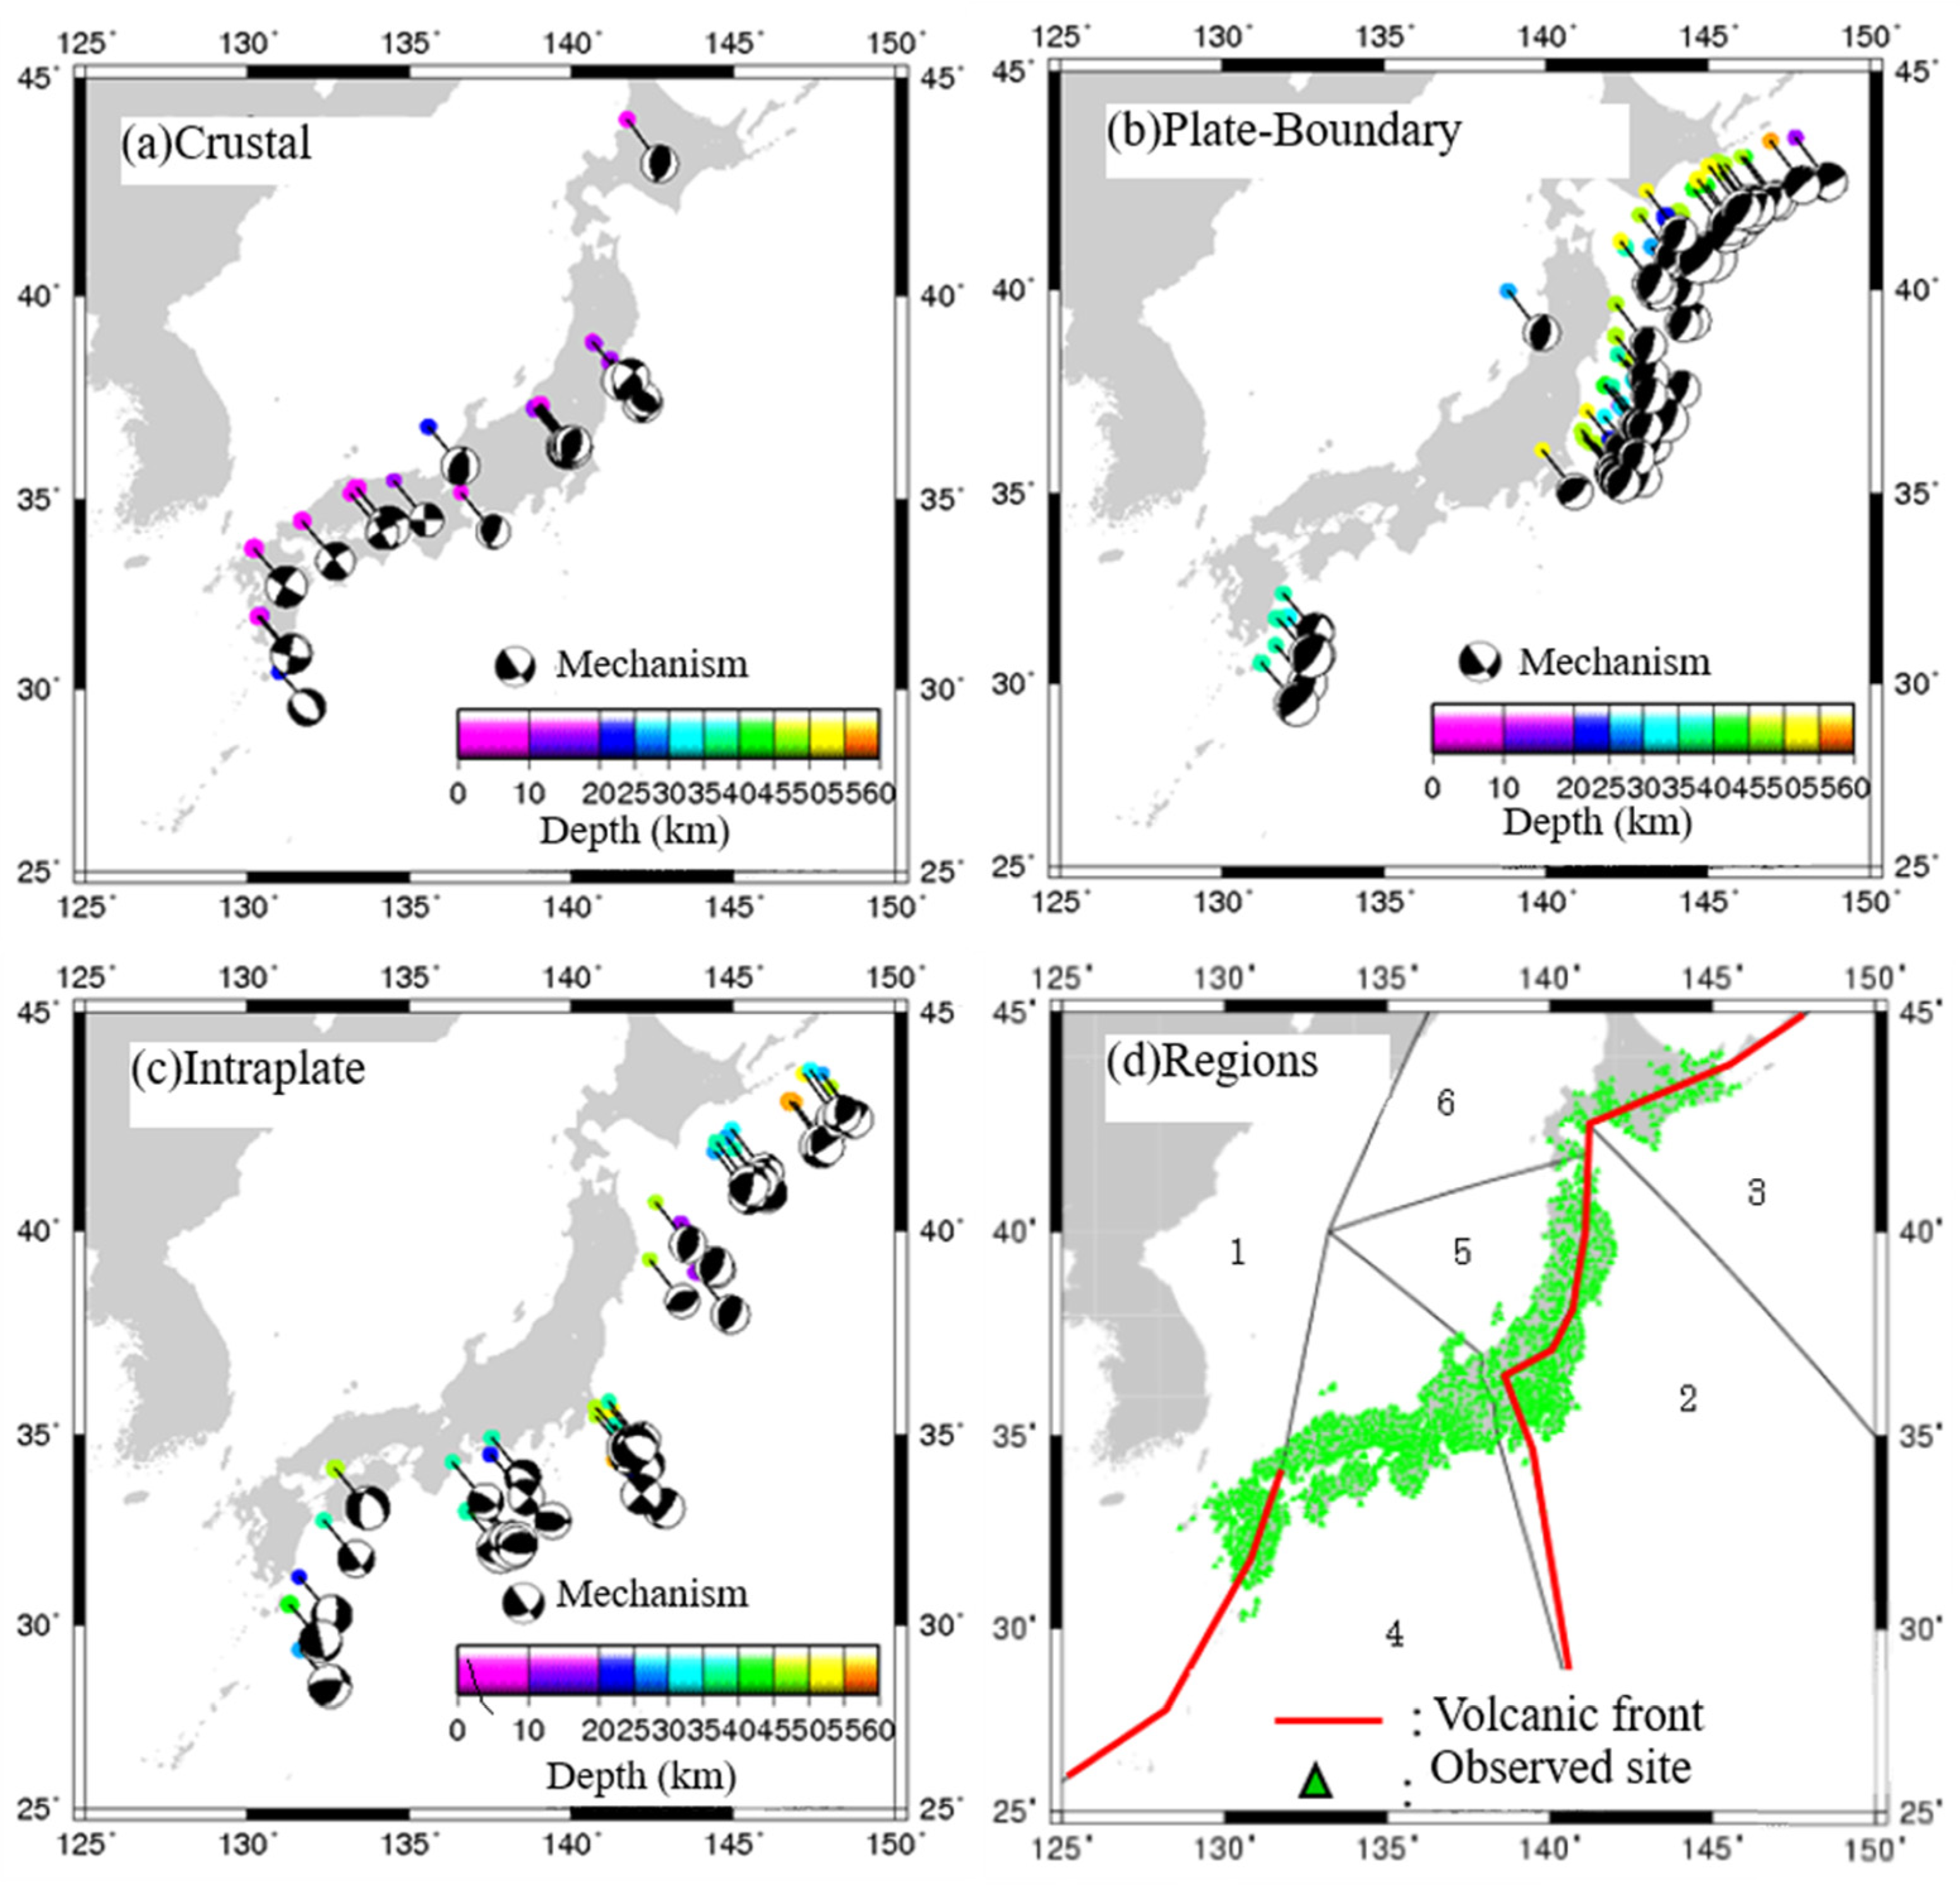
Figure 1. Source locations and mechanisms of (a) crustal earthquakes, (b) plate-boundary earthquakes, and (c) intraplate earthquakes, and (d) positions of observed sites and regions of different attenuations referring to the volcanic front [18].
Applsci 11 07041 g001
Figure 2. Statistical time-varying characteristics from observed data; (a) relationship between Tr versus magnitude, (b) Td versus magnitude, (c) Tr versus hypocentral distance, and (d) Td versus hypocentral distance. We also show (e) an example of the comparison of the statistical envelope derived from the regression relationship and the observed acceleration amplitude characteristics normalized by PGA.
Applsci 11 07041 g002
Figure 3. Location of asperities, with higher slip elements (■), the center of the background region (*), and the rupture starting point (★) of the seismogenic fault of the hypothesized Tonankai earthquake.
Applsci 11 07041 g003
Figure 4. Peak ground acceleration and velocity from a hypothesized Tonankai earthquake by the statistical Green’s function summation method of this study (symbols) and by the GMPE of Si and Midorikawa [10] as a function of the shortest distance to the fault.
Applsci 11 07041 g004
Figure 5. A comparison of the seismic intensity scale distribution of strong ground motions calculated from the hypothesized Tonankai earthquake in this study (top) and that of the estimated ones from the damage survey of the 1944 Tonankai earthquake according to HERP (bottom).
Applsci 11 07041 g005
Figure 6. Peak ground acceleration and velocity from a hypothesized Tokai earthquake by the statistical Green’s function summation method of this study (symbols) and by the GMPE of Si and Midorikawa [10] as a function of the shortest distance to the fault.
Applsci 11 07041 g006
Figure 7. A comparison of the seismic intensity scale distribution of strong ground motions calculated from the hypothesized Tokai earthquake in this study (top) and that of the estimated ones () from the damage survey of the 1854 Ansei Tokai earthquake (bottom). Squares in the bottom panel indicate the same results as in Figure 5 (bottom), based on the numerical calculation for the Tonankai earthquake according to HERP and so we should not refer to them for the Tokai earthquake simulation. Please note that the map scales are different.
Applsci 11 07041 g007
Figure 8. Location of asperities, large slip segments (■), and the rupture starting point () of the seismogenic fault of the hypothesized Nankai earthquake used by Ho and Kawase [17].
Applsci 11 07041 g008
Figure 9. Peak ground acceleration and velocity from a hypothesized Nankai earthquake by the statistical Green’s function summation method of Ho and Kawase [17] (symbols) and by the GMPE of Si and Midorikawa [10] as a function of the shortest distance to the fault.
Applsci 11 07041 g009
Figure 10. Peak ground acceleration and velocity from a hypothesized whole rupture scenario along the Nankai Trough by superimposing three individual earthquakes (symbols) and by the GMPE of Si and Midorikawa [10] as a function of the shortest distance to the fault.
Applsci 11 07041 g010
Figure 11. A comparison of the seismic intensity scale distribution of strong ground motions calculated from the hypothesized whole rupture scenario along the Nankai Trough in this study (top) and the distribution of the estimated seismic intensity by the Central Disaster Management Council [7] for a similar three-segment model (bottom).
Applsci 11 07041 g011
Figure 12. An example of the degrading trilinear models used for RC buildings based on the current building standard in Japan (left) and the log-normal distribution of existing ratios with different yield capacity ratios for RC buildings based on the field survey by Shibata [36] (right).
Applsci 11 07041 g012
Figure 13. A comparison of the reproduced (left) and observed (right) damage ratio (heavy or higher) distributions during the Hyogo-ken Nanbu earthquake of wooden houses [4].
Applsci 11 07041 g013
Figure 14. The seismic intensity scale distribution of strong ground motions calculated from the hypothesized Tonankai earthquake in this study (left) and the damage ratio distribution for wooden houses calculated from strong ground motions for the hypothesized Tonankai earthquake and the Nagato–Kawase model [4] (right).
Applsci 11 07041 g014
Figure 15. Damage ratio distribution from the hypothesized Tonankai earthquake for steel structures by the Nagato–Kawase model. Top row: three-storied structures (S03), bottom row: five-storied structures (S05); left column: old structures (pre-1981), right column: new structures (post-1981).
Applsci 11 07041 g015
Figure 16. Damage ratio distribution from the hypothesized Tonankai earthquake for RC structures by the Nagato–Kawase model. Top row: three-storied structures (R03), bottom row: six-storied structures (R06); left column: old structures (pre-1981), right column: new structures (post-1981).
Applsci 11 07041 g016
Figure 17. Damage ratio distribution from the hypothesized Tonankai earthquake for RC structures by the Nagato–Kawase model. Top row: nine-storied structures (R09), bottom row: twelve-storied structures (R12); left column: old structures (pre-1981), right column: new structures (post-1981).
Applsci 11 07041 g017
Figure 18. Average damage ratios for different structural types (W: wooden, S: steel, R: reinforced concrete), the number of stories (nn = 02, 03, 04, 05, 06, 09, 12), and construction ages (OLD: before 1981, NEW: after 1981).
Applsci 11 07041 g018
Figure 19. The seismic intensity scale distribution of strong ground motions calculated from the hypothesized whole rupture scenario in this study (left) and the damage ratio distribution for wooden houses calculated from strong ground motions for the hypothesized whole rupture scenario and the Nagato–Kawase model [4] (right).
Applsci 11 07041 g019
Figure 20. Damage ratio distribution from the hypothesized whole rupture scenario for steel structures by the Nagato–Kawase model. Top row: three-storied structures (S03), bottom row: five-storied structures (S05); left column: old structures (pre-1981), right column: new structures (post-1981).
Applsci 11 07041 g020
Figure 21. Damage ratio distribution from the hypothesized whole rupture scenario for RC structures by the Nagato–Kawase model. Top row: three-storied structures (R03), bottom row: six-storied structures (R06); left column: old structures (pre-1981), right column: new structures (post-1981).
Applsci 11 07041 g021
Figure 22. Damage ratio distribution from the hypothesized whole rupture scenario for RC structures by the Nagato–Kawase model. Top row: nine-storied structures (R09), bottom row: twelve-storied structures (R12); left column: old structures (pre-1981), right column: new structures (post-1981).
Applsci 11 07041 g022
Figure 23. Average damage ratios for different structural types (W: wooden, S: steel, R: reinforced concrete), the number of stories (nn = 02, 03, 04, 05, 06, 09, 12), and construction ages (OLD: before 1981, NEW: after 1981).
Applsci 11 07041 g023
Figure 24. The distribution of the numbers of damaged buildings per unit area by CDMC [32].
Applsci 11 07041 g024
Table 1. Major fault parameters of the hypothesized Tonankai earthquake.
Magnitude M8.1
Total area (km2)14,040
Seismic moment (N m)2.119 × 10²¹
Average static stress drop (MPa)3.0
Rupture speed (km/s)2.7
Strike, dip, and rake (degree)250.7/14.0/122.7
Slip in asperities (left/center/right, cm)601/850/601
Slip in background (cm)299
Publisher’s Note: MDPI stays neutral with regard to jurisdictional claims in published maps and institutional affiliations.