Article

Assessing the Impact of the Loss Function, Architecture and Image Type for Deep Learning-Based Wildfire Segmentation

by
Jorge Francisco Ciprián-Sánchez
1,*,†,
Gilberto Ochoa-Ruiz
2,†,
Lucile Rossi
3,*,† and
Frédéric Morandini
3
1
School of Engineering and Sciences, Tecnologico de Monterrey, Av. Lago de Guadalupe KM 3.5, Margarita Maza de Juárez, Ciudad López Mateos 52926, Mexico
2
School of Engineering and Sciences, Tecnologico de Monterrey, Av. Eugenio Garza Sada 2501, Monterrey 64849, Mexico
3
Laboratoire Sciences Pour l’Environnement, Campus Grimaldi—BP 52, Università di Corsica, 20250 Corte, France
*
Authors to whom correspondence should be addressed.
These authors contributed equally to this work.
Appl. Sci. 2021, 11(15), 7046; https://doi.org/10.3390/app11157046
Submission received: 8 July 2021 / Revised: 26 July 2021 / Accepted: 27 July 2021 / Published: 30 July 2021
(This article belongs to the Special Issue Advanced Approaches in Fire Detection and Prediction)

Abstract

:
Wildfires stand as one of the most relevant natural disasters worldwide, particularly more so due to the effect of climate change and its impact on various societal and environmental levels. In this regard, a significant amount of research has been done in order to address this issue, deploying a wide variety of technologies and following a multi-disciplinary approach. Notably, computer vision has played a fundamental role in this regard. It can be used to extract and combine information from several imaging modalities in regard to fire detection, characterization and wildfire spread forecasting. In recent years, there has been work pertaining to Deep Learning (DL)-based fire segmentation, showing very promising results. However, it is currently unclear whether the architecture of a model, its loss function, or the image type employed (visible, infrared, or fused) has the most impact on the fire segmentation results. In the present work, we evaluate different combinations of state-of-the-art (SOTA) DL architectures, loss functions, and types of images to identify the parameters most relevant to improve the segmentation results. We benchmark them to identify the top-performing ones and compare them to traditional fire segmentation techniques. Finally, we evaluate if the addition of attention modules on the best performing architecture can further improve the segmentation results. To the best of our knowledge, this is the first work that evaluates the impact of the architecture, loss function, and image type in the performance of DL-based wildfire segmentation models.

1. Introduction

Wildfires represent a considerable threat, as they can have a significant and negative impact on the environment, properties, and lives. In 2020, hundreds of fires were registered across Northern California. They were the largest fires in California’s history, with a total of 1.03 million acres burned [1]. In the United States alone, an estimated 17,904 structures burned in wildfires in 2020, most of them in California [2].
Currently, there are three main categories of forest fire remote monitoring and detection techniques: ground-based systems, manned aerial vehicle-based systems, and satellite-based systems. These techniques present several disadvantages: ground-based systems display limited operation ranges, while satellite-based systems lack path planning flexibility, and manned aerial vehicle-based systems are expensive and potentially dangerous for their operators [3,4]. Additionally, sensor-based fire detection can display false alarms, in addition to the high costs associated with the installation of multiple sensors across large areas [5]. In contrast, unmanned aerial vehicles (UAVs) with computer vision-based sensing systems provide a flexible, low-cost alternative [3,4].
In the field of computer vision-based fire detection, different algorithms to detect fire in video or image sequences have been proposed [6,7,8,9,10]. However, the results of these algorithms refer only to the presence of fire on an image, that is, classifying an image as either fire or non-fire. These techniques are thus not adequate to perform a precise segmentation of the fire [11], that is, the detection of fire pixels in an image. Fire segmentation is of great interest as it represents the first step of several processing stages for both the detection of fire departure and the monitoring and modeling of the fire [5]. The segmentation of fire areas in an image allows us to obtain relevant information regarding its position, rate of spread, height, inclination, surface, and volume [12].
Visible images contain textural details with a high spatial resolution that are consistent with the human visual system. In the visible spectrum, the performance of the segmentation process can vary depending on the color and the texture of the fire coupled with the presence of varying quantities of black or white smoke [11]. In contrast, the presence of fire in infrared images is more distinguishable thanks to large temperature differences with the background [13]. However, it is also not trivial to detect fire on infrared images, as they present problems such as thermal reflections and infrared (IR) blocking [14]. Thus, the fusion of both the textural and thermal information in a single image has the potential to increase the segmentation efficiency, potentially improving the robustness, accuracy, and reliability of fire segmentation systems [3].
In recent years, Deep Learning (DL) has displayed state-of-the-art performance in different tasks such as image classification [15,16,17], object detection [18,19,20], and image segmentation [21,22,23]. DL is an area of Machine Learning (ML) based on artificial neural networks, such as convolutional neural networks (CNNs), that represents a statistical technique for classifying patterns based on sample or training data using multi-layer neural networks [24]. Most DL algorithms consist of a hierarchical architecture with multiple layers; each layer constitutes a non-linear information processing unit [25]. Additionally, in image segmentation, a relevant element in a DL model is the loss function (for the supervised learning case). The loss function evaluates how well the predicted segmentation matches its corresponding ground truth. The latter is a necessary step in the training of a DL model [26].
There exist several approaches for visible-infrared image fusion in the state-of-the-art, both with traditional image processing techniques [4,27,28] and with DL-based methods [29,30,31]. In the particular context of fire imagery, Nemalidinne et al. [4] and Toulouse [32] addressed visible-infrared image fusion with traditional methods. In recent years, there has been a growing interest in DL as a technique for image fusion. This is due to its reduced complexity compared to methods on the multi-scale transform and representation learning domains [33]. Up to now, the only DL-based approach model was developed by Ciprián-Sánchez et al. [34].
In the context of wildfire detection, several approaches have been proposed for both fire image classification (as mentioned previously, to classify a full image as either fire or non-fire) [8,9,10,35] and fire semantic segmentation. [5,36,37,38,39]. DL-based wildfire semantic segmentation methods seek to classify each pixel in an image as fire or non-fire. Figure 1 shows an example of wildfire image classification and segmentation.
Most of the existing DL-based wildfire segmentation methods employ visible images; for the particular context of DL-based wildfire segmentation, it is still unclear if the inclusion of fused information would enable a significant improvement in the fire segmentation performance of a model or if factors such as the architecture and loss function play a more relevant role in the said performance.
In order to investigate these questions, in this work, we train three SOTA DL architectures [5,36,38], coupled with three loss functions (Dice [40], Focal Tversky [41], and Unified Focal [42]) and four fire image types (visible, near-infrared (NIR), and fused generated from two methods [29,34]). Then, we evaluate the resulting thirty-six combinations to assess the impact of each of the mentioned parameters in the wildfire segmentation performance. We use standard metrics to compare the segmented images to their corresponding ground truths to identify the best performing combination. We employ the Matthews Correlation Coefficient (MCC) [43], the F1 score [44], and the Hafiane quality index (HAF) [45] as in the work by Toulouse et al. [11] to benchmark the best identified combination against the traditional methods evaluated by Toulouse et al. as baselines. Finally, we explore the use of attention modules [46,47,48] for this particular segmentation task.
The main contributions of this work are two-fold:
  • We perform a comprehensive evaluation of thirty-six combinations of three selected architectures and loss functions, as well as four image types, to assess which of these elements affects wildfire segmentation performance the most, exploring as well the use of attention modules for the particular task of fire segmentation.
  • We benchmark the best combination against traditional fire segmentation methods to assess if it provides a significant advantage over them.
The rest of this paper proceeds as follows. First, Section 2 introduces related work in the area of DL-based semantic segmentation. Afterward, in Section 3, we present the datasets, architectures, loss functions, image types and metrics employed in this study. In Section 4, we discuss the results of the generated combinations, as well as the benchmarking results against traditional methods. Finally, in Section 5, we embark on a discussion of the obtained results, the conclusions, and potential avenues for future work.

2. Related Work

Semantic image segmentation is a relevant task in the field of computer vision, which seeks to assign a label to each pixel or region within an image or video. It plays a pivotal role in computer vision-based applications such as autonomous vehicles [49], medical imaging [50], and geolocalization for Unmanned Autonomous Vehicles (UAVs) [51,52]. Deep Learning methods have displayed precise and faster segmentation capabilities than previous approaches such as random forest classifiers, amongst others [53].
In particular, convolutional neural networks (CNNs) were first proposed by Fukushima and Miyake [54] and are amongst the most successful architectures in the field of DL, particularly for computer vision tasks. In general, CNNs consist of three types of layers [55]:
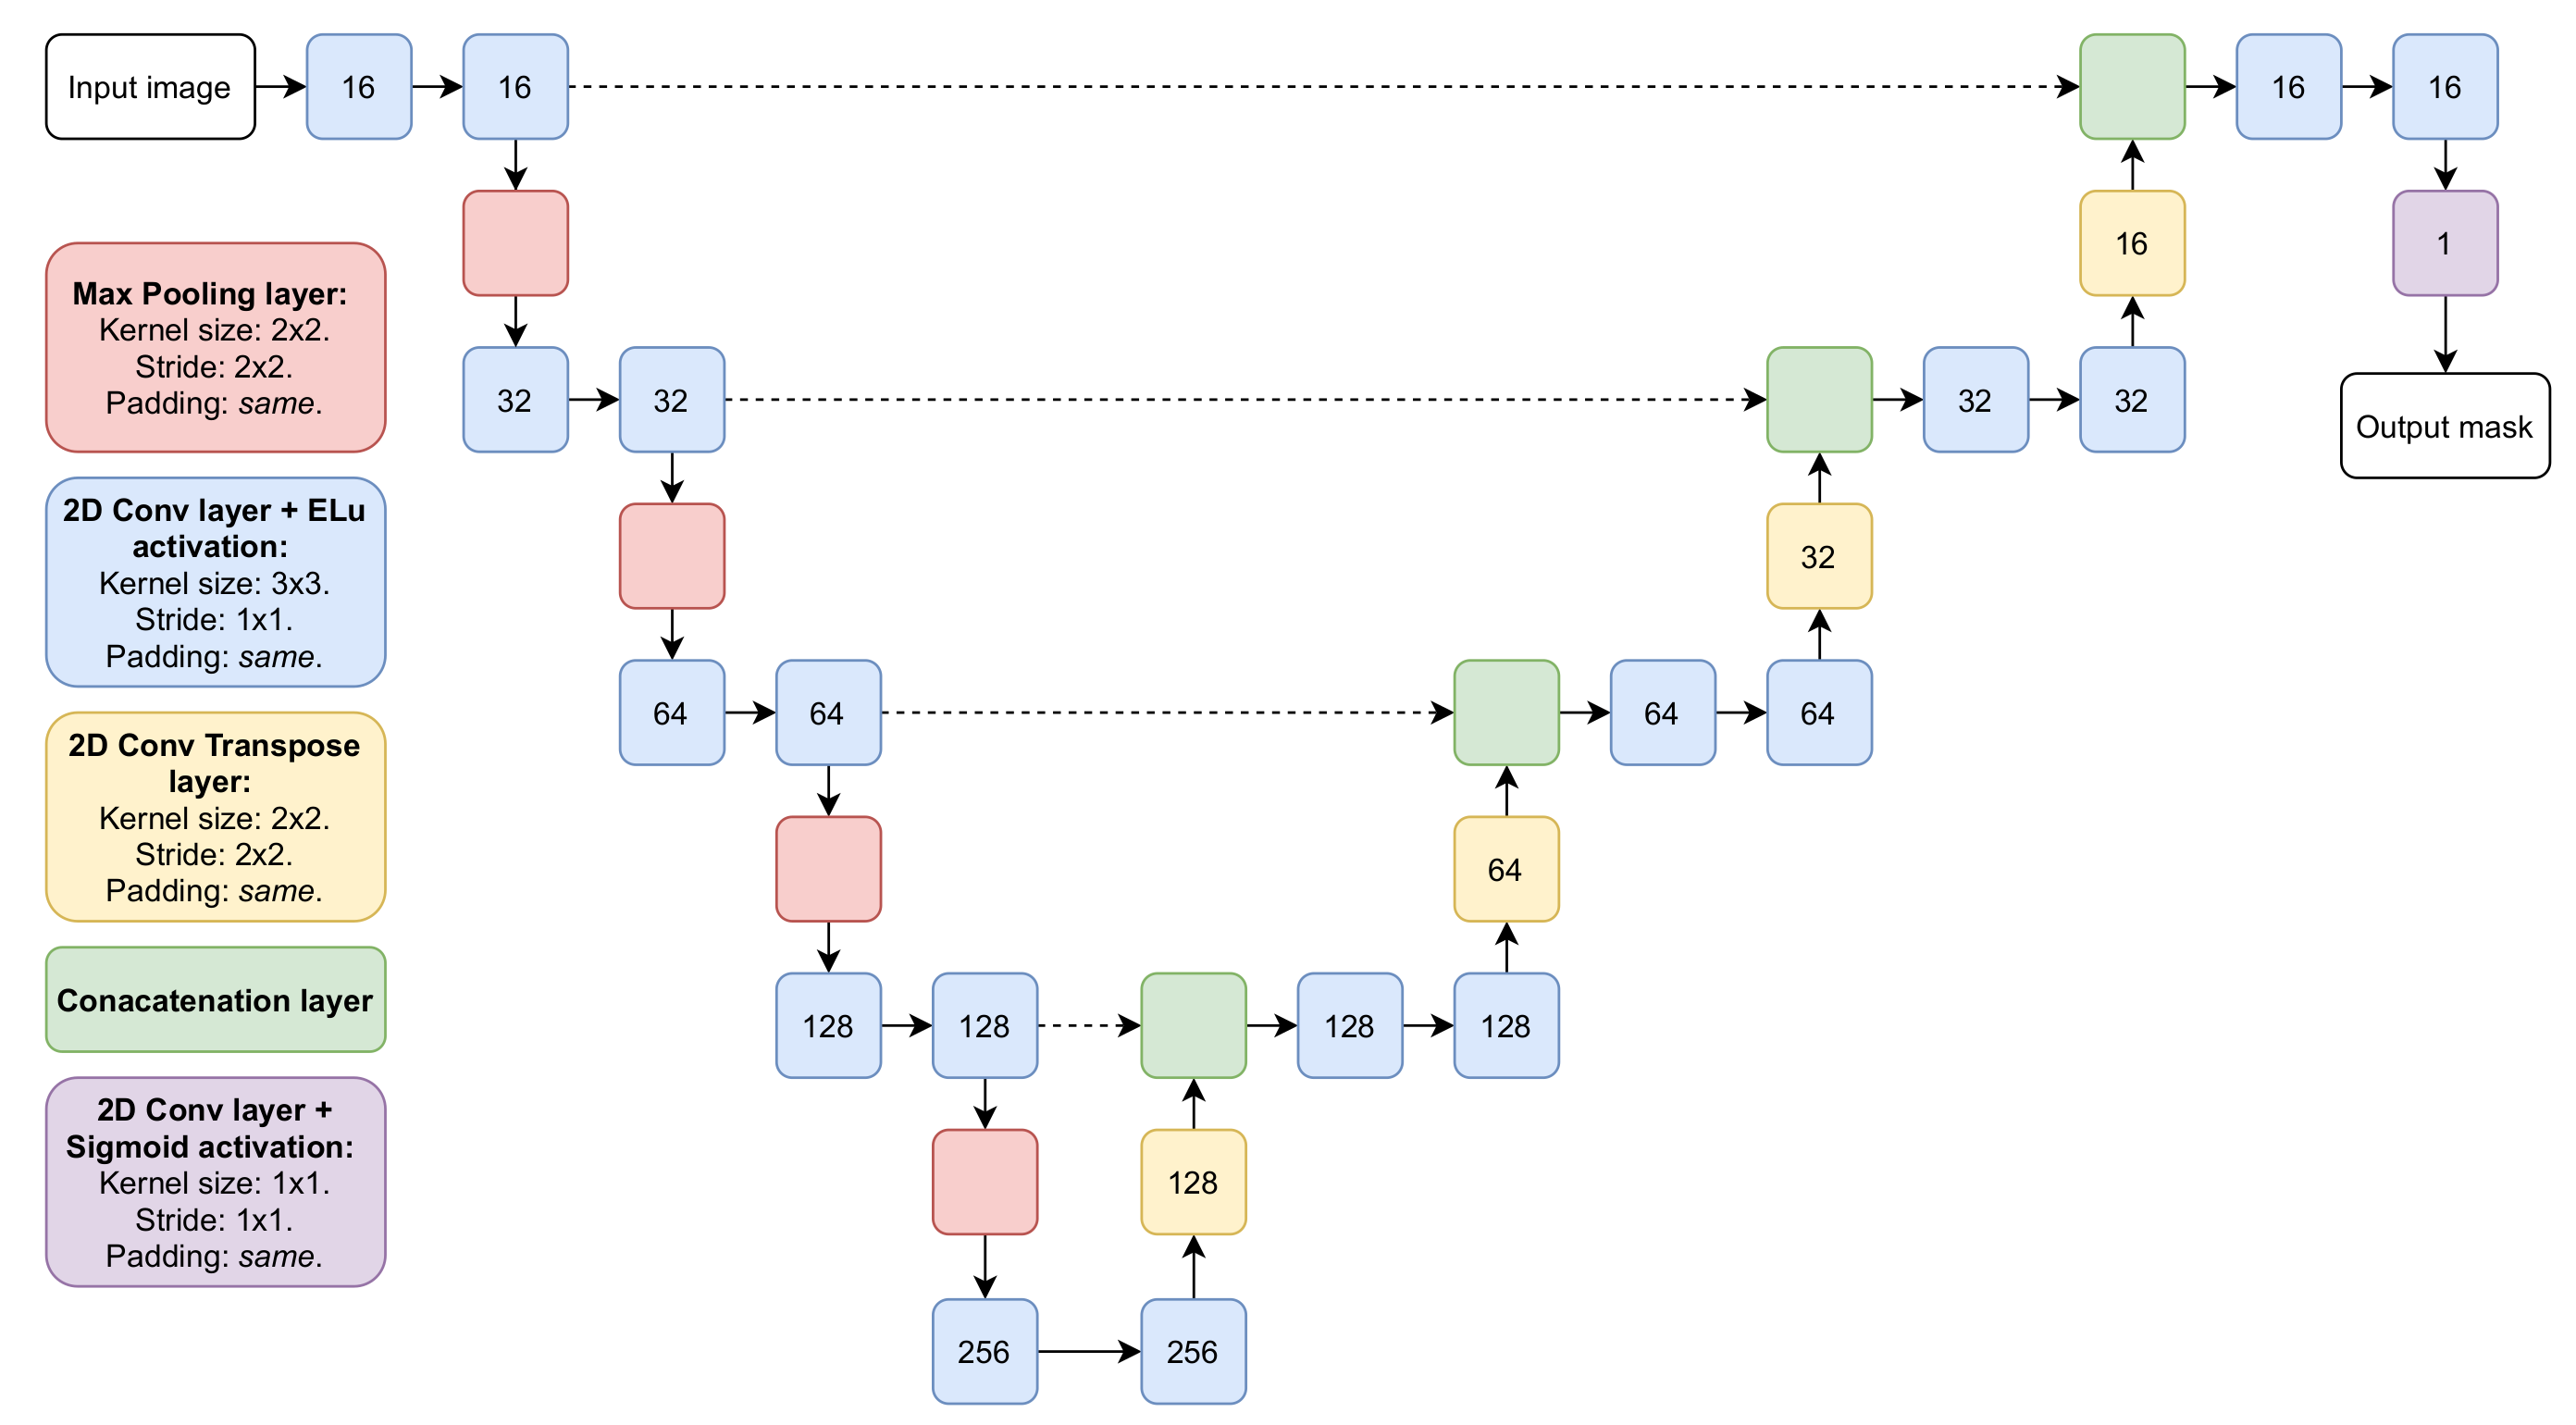
  • Convolutional layers: In these layers, a filter (also referred to as kernel) is convolved with the input to perform feature extraction, constructing a 2D activation map of such filter. The CNN learns the weights of its filters, which activate when a particular type of feature is observed [56].
  • Non-linear layers: These layers apply an activation function (e.g., sigmoid, Tanh, ReLU, amongst others [57]) on the obtained feature maps to allow the network to successfully learn non-linear functions.
  • Pooling layers: These layers reduce the spatial resolution of a feature map by replacing neighborhoods with given statistical information of said neighborhood, such as its mean, maximum, among other strategies [55]. The latter reduces the number of parameters and calculations in the model, thus improving the training and inference times as well as addressing the issue of overfitting [56].
Figure 2 shows the basic structure of a CNN. It is worth noting that the structure of the last layers of a CNN may differ depending on the particular application, for instance, image classification, image segmentation, amongst others.
In recent years, many different DL models for semantic segmentation have been proposed in the state-of-the-art. Lateef and Ruicheck [53] and Minaee et al. [55] provide comprehensive reviews of over one hundred architectures; in Section 2.1, we introduce some of the most relevant approaches and outline their characteristics, and in Section 2.2, we introduce architectures designed for the particular task for wildfire segmentation.

2.1. Deep Learning-Based Semantic Segmentation

The VGG [58] and ResNet [59] architectures are amongst the most widely used for feature extraction. VGG-based methods [58,60] have displayed good segmentation performance and have simple, straightforward structures. However, these models require high computational power during training, as they use a large number of parameters. The latter can also affect their inference time and limit their use in real-time applications.
Architectures that take the residual block as its focus address the vanishing gradient problem effectively. Models such as ResNet [59], FusionNet [61], and Faster-RCNN [62], amongst others, have shown robust segmentation results. However, it is worth noting that large-scale usage of skip connections can lead to memory problems [53], with the In-Place Activated Batch Normalization (INPLACE-ABN) model [63] seeking to reduce the training memory footprint of ResNet-based architectures. The FRRN architecture [64] proposes a two-stream structure that incorporates elements of both VGG and ResNet approaches.
The DeepLab architecture [65] follows an approach that focuses on recovering the spatial resolution through the use of atrous convolutions to generate high-resolution feature maps [53]. It is worth noting that methods based on Atrous Spatial Pyramid Pooling (ASPP) modules display a steep computational cost [66]. There have been several expansions on the DeepLab architecture [67,68]. The most recent one is the DeepLabV3+ [66] model, in which the authors seek to reduce the computational complexity through the application of depth-wise separable convolutions to the ASPP and decoder modules.
It is worth noting that the VGG, residual block, and atrous convolution-based approaches rely on considerably big datasets for training. Depending on the application context, datasets of sufficient scale may not be available.
In contrast, the U-Net architecture [69] aims to perform image segmentation on smaller datasets. This architecture consists of convolution and deconvolution layers in an encoder–decoder fashion, where the high-resolution features from the encoder layers are combined with the up-sampled outputs of the decoder’s layers. An advantage of this model is its small number of parameters, which allows for fast training and inference times; however, the use of skip connections tends to use redundant information in low-level encoder features, particularly in multi-scale approaches [70]. The Attention U-Net [46] builds upon the U-Net concept through the proposal of Attention Gates (AGs), which learn to focus on specific structures without additional supervision, suppressing feature activations in irrelevant regions [69]. A more recent approach is the spatial-channel attention gate (scAG) [70] that implements an attention mechanism that emphasizes meaningful information along both the channel and spatial dimensions to overcome the mentioned drawbacks of the U-Net’s skip connections. Finally, it is worth noting that most of the U-Net-based models are proposed and evaluated for the particular task of biomedical image segmentation.
It is worth noting that all the discussed techniques have displayed robust results for semantic segmentation. However, they have different characteristics that may be desirable given a specific application. Table 1 shows a summary of their associated advantages and disadvantages.

2.2. Deep Learning-Based Wildfire Segmentation

As discussed in Section 1, we are interested in the task of wildfire segmentation as it allows us to obtain information like the position, rate of spread, height, inclination, surface, and volume of the fire, which are relevant characteristics that play a significant role in the development and improvement of fire behavior models [11]. In this section, we describe some of the most relevant works pertaining to DL-based wildfire segmentation.
Akhloufi et al. [38] propose the Deep-Fire network, a deep convolutional neural network (DCNN) based on the U-Net architecture. They employed visible R G B images of forest fires as inputs. The model outputs a binary mask representing the fire pixels in an image. The authors then use the Corsican Fire Database [71] for the training and testing of their model. Akhloufi et al. report good results with the Dice similarity coefficient as the loss function for the model, with an F1-Score ranging between 64.2% and 99% on the test set.
Harkat et al. [37] train the Deeplabv3+ architecture on wildfire images from the Corsican Fire Database. The authors employ the Dice similarity and Tversky loss functions with cross-entropy. Additionally, they test the model with two different backbones, ResNet-18 and ResNet-50. Finally, Harkat et al. identify the Dice loss and the ResNet-50 backbones as the best performing combination, reporting an accuracy of 97.53%.
Frizzi et al. [36] propose a DCNN model that generates fire and smoke segmentation masks taking visible R G B images as inputs. The authors propose an architecture based on the VGG16 network [58] for the coding phase. Frizzi et al. use transpose convolutions for up-sampling in the decoding phase and add skip connections to several layers of the coding phase. They collected visible images containing fire and smoke from the internet and manually segmented them to construct the dataset they used for training and testing the model. Finally, the authors report an average accuracy of 98% for this model.
Choi et al. [5] propose a DCNN similar to FusionNet for fire segmentation. They implement an encoder–decoder architecture, with skip connections between encoding and decoding layers in a U-Net-like fashion. The authors implemented ResNet blocks instead of traditional convolutional blocks for both the encoding and decoding process alongside simple convolution and deconvolution layers. Choi et al. train and test the model in the FiSmo Dataset [72] and the Corsican Fire Database, using the mean square error (MSE) as the loss function. Finally, the model displays an accuracy of 99% on the FiSmo Dataset and a 97% accuracy on the Corsican Fire Database.
Finally, the work proposed by Toan et al. [39] is, to the best of our knowledge, the only DL model that leverages multispectral images to perform wildfire segmentation. The authors propose a DCNN that incorporates both spectral and spatial information that they obtain through the GOES-16 satellite. As spectral images have an additional dimension of spectral bands with partial dependencies between them [39], Toan et al. propose a 3D version of a convolutional layer, in which each neuron in the following layer is connected only to a cube of neurons in the previous layer [39]. The model proposed by Toan et al. employs three of the mentioned 3D convolutional layers. Using this model, the authors report a precision of 96.05% on their analyzed dataset.
Although Harkat et al. [37] report good results on the Deeplabv3+ architecture, for the present paper, we focus on the architectures that are designed specifically for the task of wildfire segmentation. The model proposed by Toan et al. [39] employs multi-channel multispectral satellite images, and thus its structure is not compatible with the dataset we use in this work, described in Section 3.1. In consequence, we select the architectures by Choi et al. [5], Frizzi et al. [36] and Akhloufi et al. [38] as the ones to be employed in this study. We analyze these architectures in detail in Section 3.3.

3. Materials and Methods

3.1. Data

For the present paper, we employ the visible-infrared image pairs of the Corsican Fire Database, first presented by Toulouse et al. [71]. This dataset contains 640 pairs of visible and near-infrared (NIR) fire images, alongside their corresponding ground truths for fire region segmentation.
Figure 3 displays a sample visible-NIR image pair from the Corsican Fire Database with its corresponding ground truth. The ground truths of this dataset were manually generated by experts. We resize all images to a uniform width of 512 and a height of 384 pixels.
The fused images employed in this work are generated through two SOTA DL-based fusion methods. In Section 3.2, we introduce the mentioned fusion techniques and display sample resulting fused images.

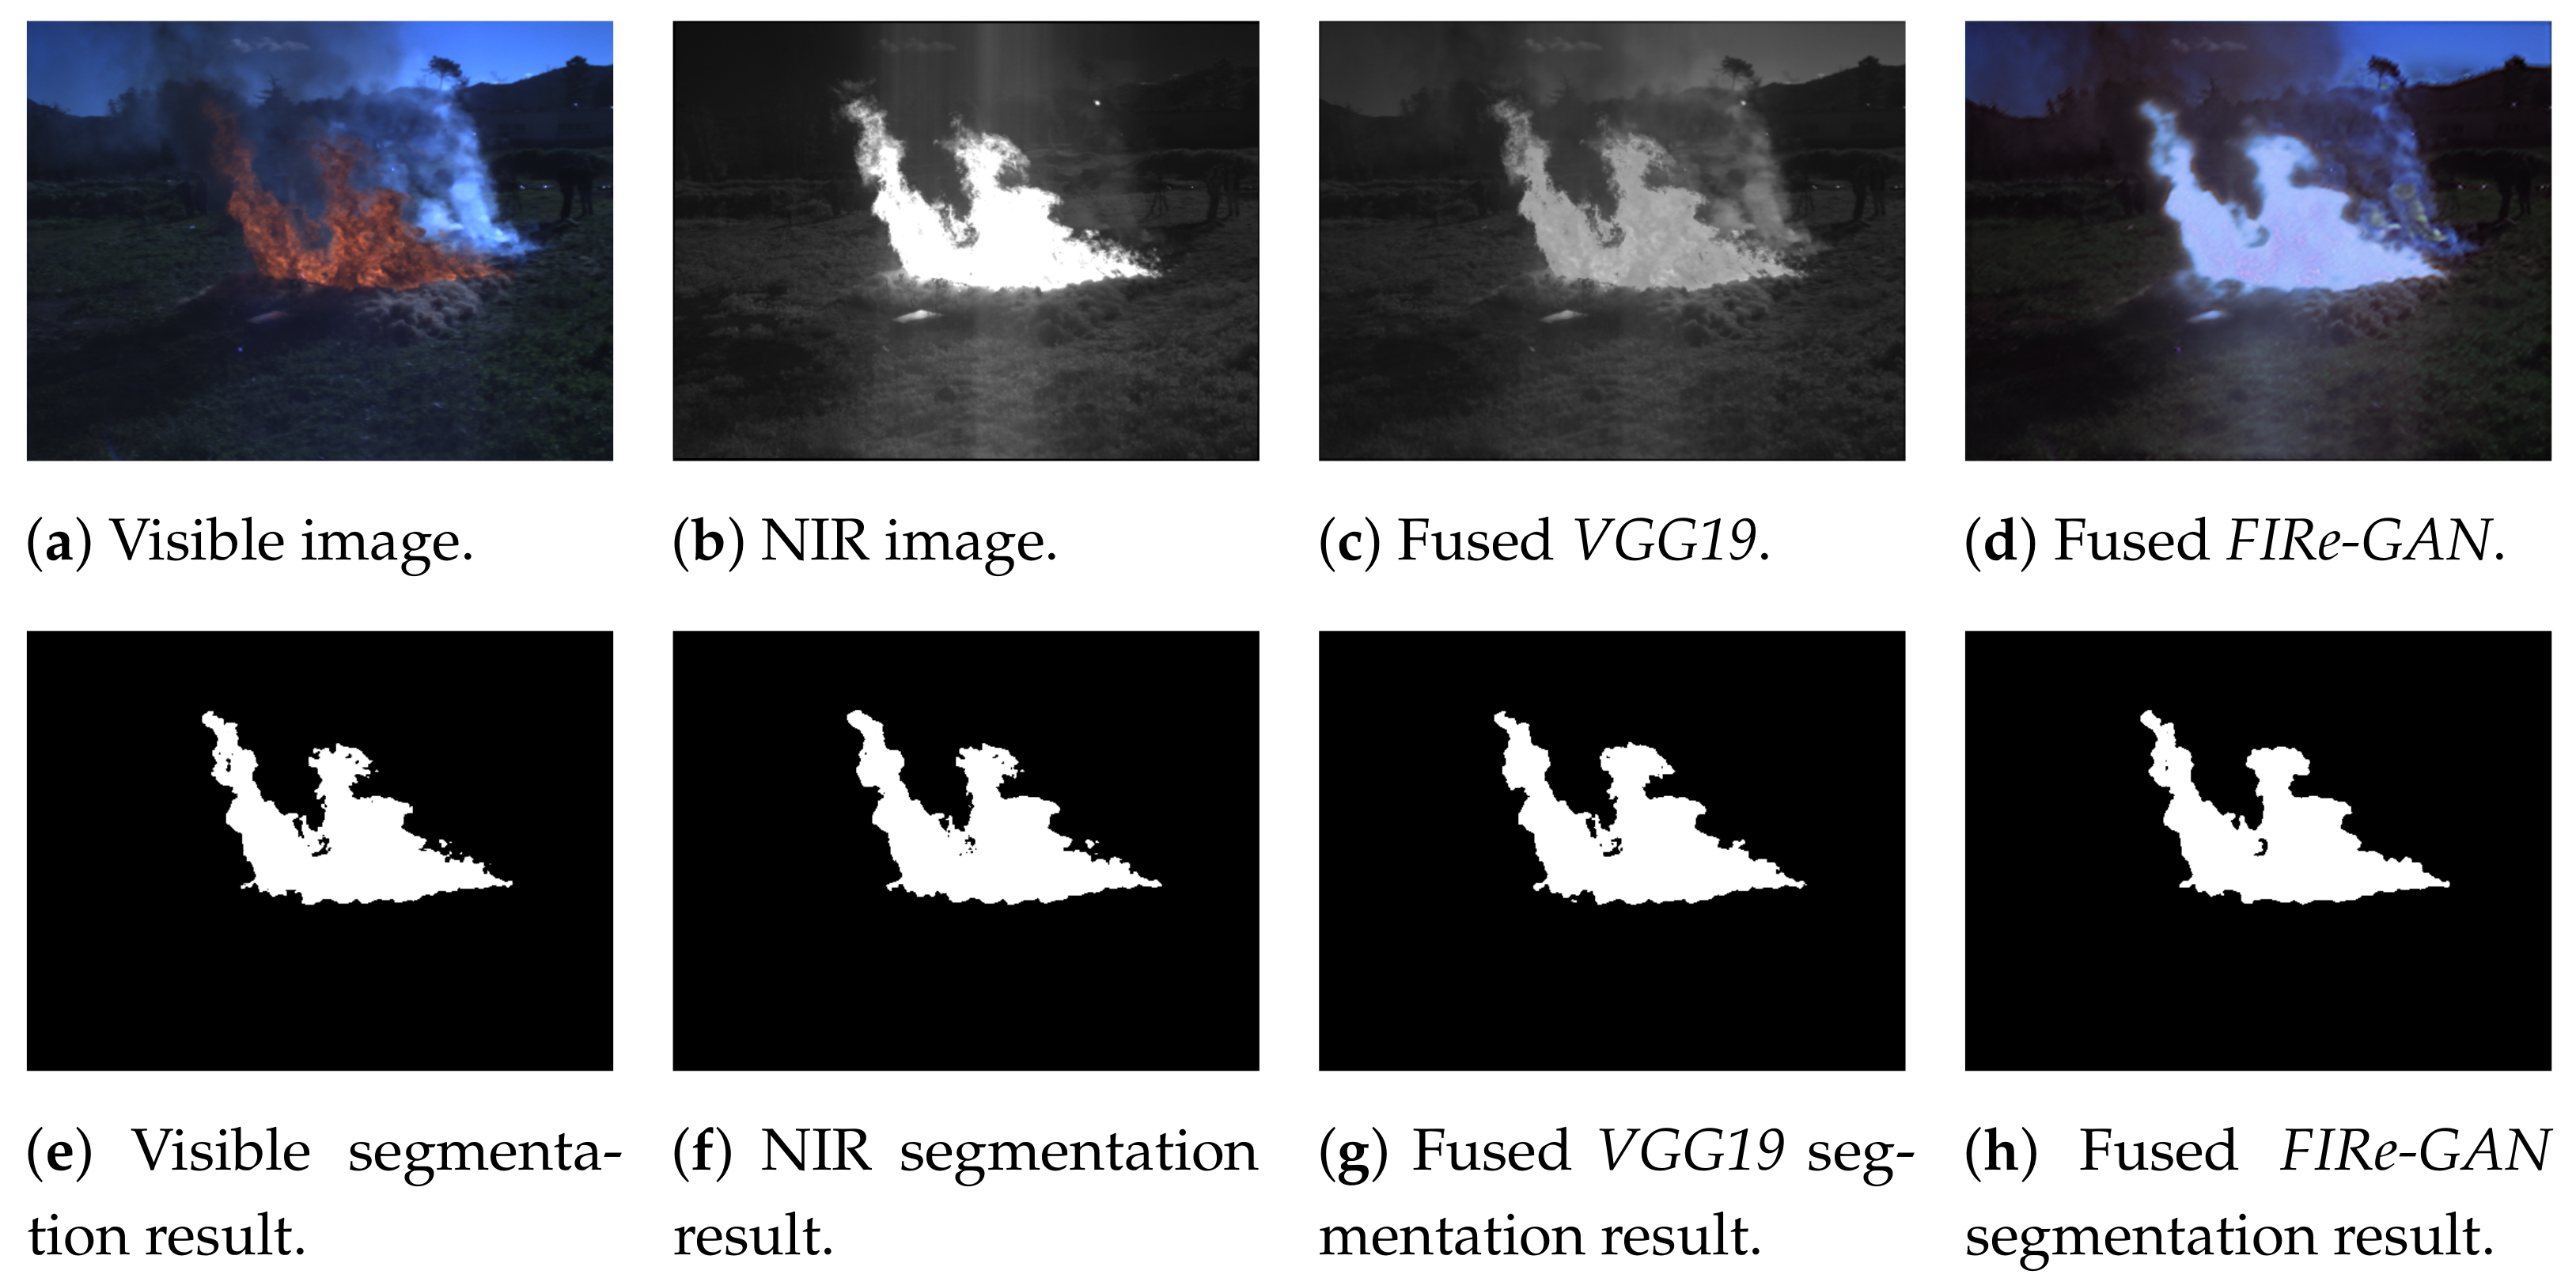
3.2. Image Fusion Methods

We selected two DL-based methods [29,34] to generate the fused images employed in the present study; we chose these methods because they present several desirable features. The method proposed by Li et al. [29] uses a pre-trained VGG19 DCNN as a part of its process to extract multi-layer features of the detail content of the source images. Since Li et al. employ only specific layers of the said pre-trained network, no further training on new datasets is needed. The Fire-GAN model proposed by Ciprián-Sánchez et al. [34] is, to the best of our knowledge, the only DL-based method that addresses the fusion of visible-NIR images for fire imagery. It is based on a Generative Adversarial Network (GAN) that expands on the one proposed by Zhao et al. in [31] to allow for the preservation of color in the generated fused images, the processing of higher resolution images, and to control the amount of visible or thermal information included in the fusion process, to account for the particular thermal characteristics of fire NIR images.
In the following subsections, we present both methods in greater detail, succinctly addressing their characteristics and their associated advantages and disadvantages.

3.2.1. Infrared and Visible Image Fusion Using a Deep Learning Framework

This method, proposed by Li et al. [29] in 2018, presents a DL-based framework for the fusion of visible and infrared images. The output of this method is a grayscale image containing the features present in both the source visible and infrared images.
First, the authors decompose the original images into base and detail parts. Next, Li et al. fuse the base parts through weight-averaging. Regarding the detail parts, the authors employ a VGG19 DCNN pre-trained on the ImageNet [73] to extract multi-layer features. The authors use L1 normalization and a weighted average strategy on the extracted features to generate candidates for the fused detail content. They use a max selection strategy to pick the final fused candidate, with the final output image constructed through the combination of the obtained detail and base contents. This method has the advantage of using only selected pre-trained layers of a VGG19 network, thus not needing further training on application-specific datasets. However, since it also employs traditional computer vision and image processing techniques, it is not an end-to-end model, increasing its implementation complexity. Additionally, the final fused images lose color information. This is relevant due to the color being one of the most used features in traditional visible image-based fire detection methods [3]. Throughout this paper, we will be referring to this method as the VGG19 method.
Figure 4 shows the framework of the method proposed by Li et al. [29] with a sample image pair from the Corsican Fire Database.

3.2.2. Fire-GAN: A Novel Deep Learning-Based Infrared-Visible Fusion Method for Wildfire Imagery

This method, proposed by Ciprián-Sánchez et al. [34] in 2021, presents a GAN-based approach that builds upon the one proposed by Zhao et al. [31] in 2020 for the particular context of fire imagery. The Fire-GAN model takes as an input a visible image, generating an artificial infrared one and then fusing these two to produce the final output image. It is relevant to note that the kind of infrared images, that is, NIR, short-wavelength (SWIR), mid-wavelength (MWIR), or long-wavelength (LWIR), that the model learns to generate is dependent on the source infrared images present in the training set. This means that if the training set contains NIR images, this method generates approximate NIR images, and so forth. For the case of the present paper, the model learns to generate approximate NIR images.
First, the visible image is given as an input to a U-Net-like generator G1 to create an approximate NIR image. Then, the two (approximate NIR and visible) are concatenated and fed to a second generator G2, generating an RGB fused image as output. A discriminator D1 has the task of distinguishing between the source visible image and the generated fused one. The latter motivates G2 to include more textural details, thus making the fused image closer to the visible one. At the same time, a second discriminator D2 seeks to distinguish between the source NIR image, the approximate one, and the final fused image, thus encouraging G1 to output more accurate NIR images and also allowing G2 to incorporate more thermal information in the final fused image. Finally, due to the particular thermal characteristics of the fire NIR images, the authors include a constant γ term in the loss function of G2 to control and prioritize, as needed, the inclusion of visible information. Figure 5 shows the structure of the Fire-GAN model with sample images from the Corsican Fire Database.
This model is, to the best of our knowledge, the first one to address DL-based visible-infrared fusion of fire imagery. It has the advantage of being end-to-end, which significantly reduces its implementation complexity. It is capable of preserving color information in the fused images, which can potentially aid in the segmentation of the fire.
Additionally, it is worth noting that the fusion process requires perfectly aligned source images [13]. For the particular context of fire images, the generation of artificial NIR images presents an advantage, given the difficulties of obtaining perfectly matched visible-NIR images on operative scenarios. However, since it is a DL model, it needs to train on high amounts of visible-NIR image pairs, thus making its performance dependent on the quality of the training dataset. Finally, although the authors include several techniques to stabilize the training of the network, it is relevant to note that, in general, GANs have the open problem of training stability [74].
Finally, in Figure 6, we show a sample of all the image types employed in the present paper.

3.3. Architectures

As mentioned in Section 2.2, for this study, we have selected three SOTA DL architectures [5,36,38]. These architectures are, to the best of our knowledge, the only three that have been proposed and designed for the particular task of fire segmentation and that are compatible with the images of the Corsican Fire Database. In the following subsections, we describe the structure and characteristics of the selected architectures.

3.3.1. Wildland Fires Detection and Segmentation using Deep Learning

Akhloufi et al. propose in [38] the DeepFire model for wildfire segmentation based on the U-Net architecture [69]. The network outputs a single-channel binary mask that represents the fire pixels of the image.
In this architecture, the images are reduced four times through max-pooling layers in the encoder section and then are expanded through transpose convolution layers in the decoder section to their original size. The last convolution layer of the model employs a 1 × 1 kernel and a sigmoid activation function to produce the final binary mask. Figure 7 shows the in-detail architecture of the DeepFire model.
This model has the advantage of having approximately two million trainable parameters, a relatively low number for DL standards. The latter allows for faster training and inference times. The authors employ 419 visible RGB wildfire images from the Corsican Fire Database, using 377 for training and 42 for testing. Finally, Akhloufi et al. report good results with the Dice similarity coefficient as the loss function for the model, with an F1-Score ranging between 64.2% and 99% on the test set.

3.3.2. Semantic Fire Segmentation Model Based on Convolutional Neural Network for Outdoor Image

Choi et al. [5] propose a model based on the FusionNet [61], adding input and output convolution layers. They add middle skip-connections in a U-Net-like fashion between the layers of the encoder and the decoder. The authors employ residual blocks such as the one illustrated in Figure 8, which are in turn nested in blocks such as the one shown in Figure 9. Thanks to this nested structure, the authors can increase the ensemble effect [75] of the residual block and thus enable a deeper network architecture. In the decoder segment, the authors employ transpose convolutions to upscale the image until it recovers its original size. Finally, in the last layer, the output convolution generates a single-channel output with pixel values ranging between zero and one. To obtain the binary mask required as output for the present paper, we binarize the output images by assigning a value of one to every non-zero pixel. Figure 10 shows the complete architecture proposed by Choi et al. [5].
This model is the largest of the three that we analyze in the present paper, with approximately seventy-six million trainable parameters. This has the net effect of producing training and inference times longer than those of the other models. Finally, Choi et al. train and test the model in the FiSmo Dataset and the Corsican Fire Database, using the MSE as the loss function. The model displays an accuracy of 99% on the FiSmo Dataset and a 97% accuracy on the Corsican Fire Database.

3.3.3. Convolutional Neural Network for Smoke and Fire Semantic Segmentation

Frizzi et al. [36] propose a CNN-based architecture for fire and smoke segmentation. The authors base their model on the VGG16 [58] for the feature extraction (encoding) phase. They replace the fully connected layers of the VGG16 architecture with a 7x7 convolution layer that connects the encoder and the decoder. To generate a high-resolution segmentation mask with the three classes (fire, smoke, other), Frizzi et al. employ skip connections that connect layers of the encoder with those of the decoder in a U-Net-like fashion, although it is relevant to note that the architecture proposed by Frizzi et al. does not have the symmetric structure of the U-Net model. In the decoding phase, the authors employ transpose convolutions to up-sample the image to its original size. They also use ReLU activation functions after each convolution layer.
Additionally, Frizzi et al. employ a pre-trained VGG16 architecture for the encoder pre-trained on the ImageNet. They collect visible images containing fire and smoke from the internet and manually segment them to construct the dataset they use for training and testing the model, reporting an average accuracy of 98% for this model with a binary cross-entropy loss function.
It is relevant to note that the authors do not specify if they use an activation function after the transpose convolution layers of their proposed model. For the present study, we change the number of filters of the last layer from three to one to adapt it to the task of fire-only segmentation. Additionally, we obtained better results using ReLU activation functions after the transpose convolution layers and when we train the VGG16-based encoder without any pre-training. Finally, Figure 11 shows the in-detail architecture proposed by Frizzi et al. with the mentioned adjustments that we perform for the present paper.

3.4. Attention Modules

In this study, we explore the addition of attention modules to further improve the segmentation results. We explore the use of the Attention Gate (AG) presented by Oktay et al. [46], the Spatial Attention (SA) module employed by Guo et al. [47], and the Modified Efficient Channel Attention (MECA) module proposed by Guo et al. [48]. In the following subsections, we succinctly describe these attention modules.

3.4.1. Attention Gate

Oktay et al. [46] propose the Attention Gate for their Attention U-Net model. Said AGs automatically learn to focus on relevant structures in the images without the need for additional supervision [46]. They do so by suppressing feature activations in irrelevant regions without adding a significant number of parameters to the model.
The AG module is positioned before the concatenation step between a layer in the decoder and a corresponding layer in the encoder. It receives a gating signal g, which is the feature map of a layer in the decoder, and an input x l , which is the feature map obtained from a corresponding layer in the encoder and has a coarser resolution. Then, both g and x l go through a convolutional layer that allows their dimensions to match. Next, the resulting feature maps are summed element-wise and then go through a ReLU activation function. Then, the result goes through a 1 × 1 convolution layer and a sigmoid activation function that scales the resulting vector to a range between zero and one. This output contains the attention coefficients, where values closer to one indicate relevant features. Then, the attention coefficients are up-sampled through trilinear interpolation to the original dimensions of the x l input. Finally, the up-sampled attention coefficients are multiplied element-wise to the x l input. Lastly, the resulting feature map x ^ l is then concatenated to the corresponding layer in the decoder, just as in a regular U-Net model. Figure 12 shows the structure of the AG proposed by Oktay et al.
Finally, the authors incorporate their proposed AG to a regular U-Net architecture and test it on biomedical image datasets, showing an increase in the segmentation performance with different types of images and different sizes of the training set.

3.4.2. Spatial Attention Module

Guo et al. [47] present the Spatial Attention U-Net (SA-UNet) model that incorporates SA modules. These SA modules, first proposed by Woo et al. [76], are capable of inferring an attention map along the spatial dimension, then multiplying said attention map by the input feature map to perform adaptive feature refinement [47].
Guo et al. position the SA module between the encoder and the decoder. The SA module makes use of the spatial relationship between features to create a spatial attention map. First, the SA module applies both max-pooling and average-pooling along the channel axis of the input features. Then, it concatenates them to create a feature descriptor. Next, the feature descriptor goes through a convolutional layer and a sigmoid activation to generate a spatial attention map. Finally, this spatial attention map is multiplied element-wise with the input features. Figure 13 shows the structure of the SA module.
Finally, Guo et al. employ the SA-UNet model to perform semantic segmentation of medical imagery with SOTA performance on relatively small datasets.

3.4.3. Channel Attention Module

Guo et al. [48] propose a novel Modified Efficient Channel Attention that enhances the discriminative capabilities of a model by taking into account the interdependence between feature maps. The authors apply this MECA module to the skip connections of the traditional U-Net architecture to construct their proposed Channel Attention Resiudal U-Net (CAR-UNet).
The MECA module is structured as follows: First, the input features go through channel-wise max-pooling and average pooling. Next, the two obtained descriptors are input to a shared-weight 1D convolutional layer to generate a channel attention map. Then, the MECA module applies a channel-wise addition operation to combine the output feature vectors generated by the 1D convolutional layer. Finally, the generated feature map goes through a sigmoid activation function. Figure 14 shows the structure of the MECA module.
Finally, Guo et al. employ the CAR-UNet model to perform semantic segmentation of medical imagery with SOTA performance.

3.5. Loss Functions

For the present study, we employ three widely used loss functions for image segmentation. The said loss functions are the Dice loss, the Focal Tversky loss, and the Unified Focal loss. In the following subsections, we succinctly describe these loss functions and their characteristics.

3.5.1. Dice Loss

The Dice loss is a region-based loss function that aims to maximize the overlap regions between the ground truth and a segmentation prediction [26]. It is based on the Dice Similarity Coefficient (DSC), which can be defined in a per-pixel classification as follows [42]:
D S C = 2 T P 2 T P + F P + F N ,
where T P refers to the true positives, F P to the false positives, and F N to the false negatives. Then, we can formulate the loss function as follows [42]:
L D S C = 1 D S C .
There are several, more complex variations of the Dice loss function [77,78], with the version that we employ providing an equal weighting to each class.

3.5.2. Focal Tversky Loss

The Focal Tversky loss was proposed by Abraham and Khan [41] and is an adaptation of the Tversky loss [79] that attempts to focus on hard examples by down-weighting easy or common ones [40]. It achieves the latter through a γ coefficient and is defined as follows [42]:
L F T = c = 1 C ( 1 T I ) 1 γ ,
where C represents the total number of classes, T I the Tversky Index [79], and γ a coefficient that defines the degree to which it focuses on harder examples. Finally, it is relevant to note that when γ < 1 , the Focal Tversky loss increases its focus on harder examples, while when γ = 1 , it simplifies to the Tversky loss.

3.5.3. Unified Focal Loss

The Unified Focal loss, proposed by Yeung et al. [42], generalizes Dice-based and cross-entropy-based losses to handle class imbalance. First, the authors modify the Asymmetric Focal loss [80], which removes the focal parameter for the component of the loss that relates to a rare class r [42], by adding a δ parameter to handle class imbalance. They define this modified Asymmetric Focal loss as follows:
L m a F = δ N y i : r log ( p t , r ) 1 δ N c r ( 1 p t , c ) γ log ( p t , r ) ,
where the added δ term controls the relative contribution of positive and negative examples [42], N is the total number of samples, y refers to the ground truth class, and p t is defined as follows:
p t = log ( p ) , if y = 1 log ( 1 p ) , otherwise ,
where p is the estimated probability for the class y = 1 [81].
Then, Yeung et al. propose a modified version of the Tversky Index [79], replacing its α and a β coefficients with a single δ term as follows:
m T I = i = 1 N p 0 i g 0 i i = 1 N p 0 i g 0 i + δ i = 1 N p 0 i g 1 i + ( 1 δ ) i = 1 N p 1 i g 0 i ,
where p 0 i is the probability that a pixel i belongs to the foreground class and p 1 i the probability of a pixel belonging to the background class.
Next, the authors remove the focal parameter for the component of the Focal Tversky loss function that relates to the background, thus preserving the enhancement of the rare class r [42], and define the Asymmetric Focal Tverksy loss as follows:
L a F T = c r ( 1 m T I ) + c = r ( 1 m T I ) 1 γ .
With the proposed L m a F and L a F T loss functions, Yeung et al. define the Unified Focal loss as follows:
L U F = λ L m a F + ( 1 λ ) L a F T ,
where λ is in the range between zero and one and determines the relative weighting of the two losses [42]. Finally, the authors note that their proposed Unified Focal loss generalizes Dice-based and cross-entropy-based losses into a single framework, as the Dice and cross-entropy losses can be recovered by setting the hyperparameters λ , δ , and γ to certain values.

3.6. Metrics

To assess the performance of the evaluated architecture, loss function, and image type combinations, we employ three standard metrics for image segmentation, namely the Matthews Correlation Coefficient (MCC) [43], the F1 score [44], and the Hafiane quality index (HAF) [45] as in the paper by Toulouse et al. [11]. This allows us to benchmark the best-identified combination against the traditional methods evaluated by Toulouse et al. as baselines. In the following subsections, we introduce and describe the said metrics.

3.6.1. Matthews Correlation Coefficient

First proposed by Matthews [43], it measures the correlation of the true classes with their predicted labels [82]. The MCC represents the geometric mean of the regression coefficient and its dual and is defined as follows [11]:
M C C = ( T P T N ) ( F P F N ) ( T N + F N ) ( T N + F P ) ( T P + F N ) ( T P + F P ) ,
where T P refers to the true positives, T N to the true negatives, F P to the false positives, and F N to the false negatives.

3.6.2. F1 Score

Also known as the Dice coefficient or overlap index [83], the F1 score is the harmonic mean of the precision P r and recall R e , which are in turn defined as follows:
P r = T P T P + F P ,
R e = T P T P + F N .
We can also define the F1 score in terms of P r and R e as follows [11]:
F 1 = 2 P r R e P r + R e .

3.6.3. Hafiane Quality Index

Proposed by Hafiane et al. [45] for fire segmentation evaluation, it measures the overlap between the ground truth and the segmentation results, penalizing as well the over- and under-segmentation [45].
First, the authors define a matching index M as follows [11]:
M = 1 Card ( I S ) j = 1 N R s Card ( R i G T R j S ) × Card ( R j S ) Card ( R i G T R j S ) ,
where N R s represents the number of connected regions in the segmentation result I S , R j S is one of the mentioned connected regions, and R i G T represents the region in the ground truth image I G T that presents the most relevant overlapping surface with the R j S region [11].
Next, Hafiane et al. define an additional index η to take into account the over- and under-segmentation as follows [11]:
η = N R G T / N R S , if N R S N R G T log ( 1 + ( N R S / N R G T ) ) , otherwise .
Finally, Hafiane et al. define the Hafiane quality index as follows:
H A F = M + m × η 1 + m ,
where m is a weighting factor with a value of 0.5 [11].

4. Results

We evaluate all thirty-six resulting combinations of the architectures, loss functions, and image types introduced in Section 3. For all image types, we split the Corsican Fire Database into a training set that, after data augmentation, contains 8192 images and a test set comprised of 128. We use fixed hyper-parameters for all training runs, with a batch size of four (due to hardware constraints), a learning rate of 10 4 , ADAM optimizer, and 100 training epochs. We conducted the training on an NVIDIA DGX workstation using two NVIDIA P100 GPUs and the TensorFlow framework. First, we identify in Table 2 the best five performing combinations per metric.
We can observe that, for all metrics, the Akhloufi + Dice + Visible combination shows the best results, albeit by a close margin. Additionally, we can observe a high presence of the Akhloufi architecture and the Focal Tversky loss in the top five for all metrics. It is also relevant to note that the visible images consistently appear in the top three combinations, with the NIR images also present, and the FIRe-GAN images, that is, fused images produced by the FIRe-GAN method, are the only fused ones to appear in the best performing combinations. In Figure 15, we show sample segmentation results for the best three combinations of Table 2 for all metrics.
Additionally, we are interested in the parameters (architecture, loss function, and image type) that allow for robust and consistent results. We then group the results by these parameters and visualize their performance across all metrics to observe the variability in the results. In Figure 16, we show the scores for all metrics grouped by architecture (Figure 16a–c), image type (Figure 16d–f) and loss function (Figure 16g–i).
We can observe that the Akhloufi architecture and the Focal Tversky loss show by far the most robust results, displaying high and consistent scores across all metrics. In contrast, the image type appears to have very little influence on the segmentation performance, as the results are considerably similar for all image types, with only a slight advantage for the visible images on the MCC and F1 metrics. In Figure 17, we can see the resulting segmentation masks for the Akhloufi + Focal Tversky combination for all image types to visually assess the similarity in the results.
Next, we obtain and visualize in Figure 18 the Spearman correlation matrix of every parameter to evaluate its monotonic correlation with the evaluation metrics.
We can observe that the architecture and loss function parameters show strong correlations with the evaluation metrics, with the Akhloufi architecture and Focal Tversky loss displaying a strong positive correlation with the evaluation metrics. Regarding the image type parameter, we can observe significantly weak correlations with the evaluation metrics for all image types, with the visible images displaying a weak positive correlation with the evaluation metrics. Additionally, we can observe a near-perfect positive correlation between the three evaluation metrics. The latter indicates that for future works, one of these metrics is sufficient to evaluate the performance of a model when working with the Corsican Fire Database.
Considering the obtained results, both in terms of performance and robustness, we choose the Akhloufi + Focal Tversky + visible combination as the best one and use it for comparison against the best traditional method identified by Toulouse et al. [11]. Table 3 shows the results of this comparison.
We can observe that the best combination that we identify clearly outperforms the best traditional method identified by Toulouse et al. [11] across all metrics.
Next, we take this Akhloufi + Focal Tversky + visible and fine-tune its hyperparameters on the training set through five-fold cross-validation. Although the learning rate, optimizer, and batch size proved to be already at optimal values, we were able to halve the training epochs to 50, maintaining the performance reported in Table 3.
We then incorporate the three different attention modules introduced in Section 3.4 to the Akhloufi architecture as shown in Figure 19, Figure 20 and Figure 21, and benchmark the Akhloufi + Focal Tversky + visible combination with and without attention modules and the fine-tuned hyperparameters to explore if the inclusion of these modules further improves the segmentation performance. Table 4 presents the results of this comparison.
Finally, we can observe that the inclusion of attention modules, in particular of the MECA ones, increases the segmentation performance across all metrics; however, this improvement is too small to be considered significant.

5. Discussion

In the present work, we evaluate the three SOTA DL architectures designed for wildfire segmentation, three loss functions, and four image types to assess the impact of each of these factors in the segmentation performance of a model. We provide a comprehensive review and evaluate the U-Net-based Akhloufi architecture [38], the FusionNet-based Choi architecture [5], and the VGG16-based Frizzi architecture [36], the Dice [26], Focal Tversky [41], Unified Focal [42] losses, and the visible and NIR images of the Corsican Fire Database [71] alongside two types of fused visible-NIR images produced by the methods by Li et al. [29] and Ciprián-Sánchez et al. [34] for a total of thirty-six combinations.
We evaluate these combinations through three metrics, namely the Matthews Correlation Coefficient [43], F1 score [83], and the Hafiane quality index [45]. Next, we obtain the top five best performing combinations across all metrics, with the Akhloufi + Dice + visible scoring the best performance on all metrics by a close margin. However, after grouping the results by architecture, loss function, and image type, we observe that the Akhloufi architecture and the Focal Tversky loss function have by far the most robust performance, displaying scant variance in their results. The performance of the combinations, when grouped by image type, displayed an almost identical behavior, pointing to a very little influence of the image type in the segmentation performance.
We also obtain the Spearman correlation matrix for each parameter for all combinations to assess the monotonic relation between the evaluated architectures, loss functions, and image types concerning the scores of the three metrics. In this analysis, we find that the architecture and loss function parameters display high correlations with the three metrics, with the Akhloufi architecture and Focal Tversky loss function showing a high positive correlation with these metrics. Additionally, we can observe that all image types show significantly weak correlations with the evaluation metrics, with the visible images showing a small positive correlation. In this correlation analysis, we can also see a near-perfect positive correlation between the MCC, F1, and HAF metrics. The latter means that, for future works, one of these metrics can suffice for the evaluation of the segmentation performance of a model.
Taking into account the performance evaluation and correlation analysis, we consider the Akhloufi + Focal Tversky + visible combination as the best performing one and fine-tune its training hyperparameters, with a learning rate of 10 4 , ADAM optimizer, 50 training epochs, and a batch size of four showing the best results. In this regard, it is relevant to note that the batch size is, in our case, a hard constraint imposed by the employed hardware. Furthermore, the Akhloufi architecture has the additional advantage of being the one with the least amount of parameters amongst the three, allowing for faster training and inference times. The latter shows promise for its application in real-time scenarios.
Finally, we compare the results of the best-identified combination against the best traditional fire segmentation method identified by Toulouse et al. [11], with the DL-based approach displaying the better performance by a considerable margin. We then explore if the use of attention modules [46] can further improve the fire segmentation performance. In this regard, we find that the attention modules, in particular the MECA [48] ones, do improve the segmentation results, albeit by a margin so small that we cannot consider it relevant.

6. Conclusions

We identify the architecture and loss function as the elements with the most influence on the fire segmentation performance of a DL model. The inclusion of fused information does not appear to make a significant difference in the segmentation performance.
Two of the image types (the visible and Fire-GAN fused) that we used possess color information, and the other two are grayscale images (the NIR and VGG19 fused). Thus, the inclusion of color information appears to be of little value for the performance of a DL-based fire segmentation model, in contrast with traditional methods in which the color information is amongst the most relevant features.
Additionally, the present paper analyses infrared and fused images that contain information on the NIR wavelength spectrum; however, the DL models themselves for both fusion and segmentation do not distinguish between particular types of infrared images (NIR, long-wave infrared (LWIR), amongst others). Thus, we expect them to extend seamlessly to other types of infrared images as long as an appropriate and consistent dataset is provided.
It is relevant to note that the results of this study are representative of the images of the Corsican Fire Database only. This dataset contains images that are not challenging, that is, with no significant occlusion of the fire shape due to smoke, and with the fire occupying a relatively large region of the images. The latter means that there is little difference in the fire region present in the visible, NIR, and fused images, which could account for the lack of impact of the image type in the segmentation performance.
It is highly likely that the image type, in particular the NIR and fused ones, would provide a more significant advantage in more challenging scenarios, e.g., with images with considerable smoke occlusion. Additionally, since the DL models for both fusion and segmentation were trained only in these non-challenging samples, their generalization capabilities to challenging, operative-scenario images may be limited.
A promising avenue for further analysis is the inclusion and analysis of more loss functions relevant in the field of semantic segmentation, such as the Lovász-Softmax loss [85], the Region Mutual Information (RMI) [86] loss, and the affinity loss [87]. Additionally, in recent times, there has been work proposing different training paradigms for DL-based semantic segmentation, such as the pixel-wise contrastive framework proposed by Wang et al. [88]. The inclusion of the training paradigm as an additional parameter can provide further insight into the relevance of the different elements involved in DL-based wildfire segmentation performance.
Finally, given the ability of the fused images to preserve both thermal and textural information, we can expect them to provide further advantages for smoke and fire segmentation. The generation of more challenging datasets containing visible-infrared image pairs with ground truths for fire and smoke segmentation arises as a promising path for future work. Additionally, exploring few-shot learning approaches that can enable DL-based image fusion and segmentation models to learn and generalize with the limited visible-infrared fire datasets currently available is another promising avenue for further research.

Author Contributions

Conceptualization, J.F.C.-S. and G.O.-R.; methodology, J.F.C.-S. and G.O.-R.; software, J.F.C.-S.; validation, J.F.C.-S.; formal analysis, J.F.C.-S.; investigation, J.F.C.-S., G.O.-R. and L.R.; resources, G.O.-R., L.R. and F.M.; data curation, L.R. and F.M.; writing—original draft preparation, J.F.C.-S.; writing—review and editing, G.O.-R., L.R. and F.M.; visualization, J.F.C.-S.; supervision, G.O.-R.; project administration, G.O.-R.; funding acquisition, J.F.C.-S., G.O.-R. and L.R. All authors have read and agreed to the published version of the manuscript.

Funding

This research was supported in part by Tecnologico de Monterrey tuition scholarship A01373326, the Mexican National Council of Science and Technology (CONACYT), the Jalisco State Council of Science and Technology (COECYTJAL) project number 7817-2019, the Corsican Region, the French Ministry of Research, and the CNRS under Grant CPER 2014–2020.

Data Availability Statement

The Corsican Fire Database is available upon request to the University of Corsica at http://cfdb.univ-corse.fr/ (accessed on 22 March 2021).

Acknowledgments

The authors wish to thank the AI Hub and the Centro de Innovacion de Internet de las Cosas (CIIOT) at Tecnologico de Monterrey for their support for carrying the experiments in this paper on their NVIDIA’s DGX computer.

Conflicts of Interest

The authors declare no conflict of interest. The funders had no role in the design of the study; in the collection, analyses, or interpretation of data; in the writing of the manuscript, or in the decision to publish the results.

Abbreviations

The following abbreviations are used in this manuscript:
DLDeep Learning
MLMachine Learning
AGAttention gate
SPSpatial Attention
UAVUnmanned aerial vehicle
NIRNear-infrared
MCCMatthews Correlation Coefficient
HAFHafiane quality index
GANGenerative Adversarial Network
CNNConvolutional neural network
RMIRegion Mutual Information
SOTAState-of-the-art
DCNNDeep convolutional neural network
LWIRLong-wave infrared
MECAModified Efficient Channel Attention

References

  1. Insurance Information Institute. Facts + Statistics: Wildfires. 2021. Available online: https://www.iii.org/fact-statistic/facts-statistics-wildfires (accessed on 3 June 2021).
  2. Congressional Research Service. Wildfire Statistics; Technical Report; Congressional Research Service: Washington, DC, USA, 2021. [Google Scholar]
  3. Yuan, C.; Zhang, Y.; Liu, Z. A Survey on Technologies for Automatic Forest Fire Monitoring, Detection and Fighting Using UAVs and Remote Sensing Techniques. Can. J. For. Res. 2015, 45, 150312143318009. [Google Scholar] [CrossRef]
  4. Nemalidinne, S.M.; Gupta, D. Nonsubsampled contourlet domain visible and infrared image fusion framework for fire detection using pulse coupled neural network and spatial fuzzy clustering. Fire Saf. J. 2018, 101, 84–101. [Google Scholar] [CrossRef]
  5. Choi, H.S.; Jeon, M.; Song, K.; Kang, M. Semantic Fire Segmentation Model Based on Convolutional Neural Network for Outdoor Image. Fire Technol. 2021. [Google Scholar] [CrossRef]
  6. Namozov, A.; Cho, Y.I. An Efficient Deep Learning Algorithm for Fire and Smoke Detection with Limited Data. Adv. Electr. Comput. Eng. 2018, 18, 121–128. [Google Scholar] [CrossRef]
  7. Frizzi, S.; Kaabi, R.; Bouchouicha, M.; Ginoux, J.; Moreau, E.; Fnaiech, F. Convolutional neural network for video fire and smoke detection. In Proceedings of the IECON 2016—42nd Annual Conference of the IEEE Industrial Electronics Society, Florence, Italy, 23–26 October 2016; pp. 877–882. [Google Scholar] [CrossRef]
  8. Valente de Almeida, R.; Crivellaro, F.; Narciso, M.; Sousa, A.; Vieira, P. Bee2Fire: A Deep Learning Powered Forest Fire Detection System. In Proceedings of the 12th International Conference on Agents and Artificial Intelligence, Valletta, Malta, 22–24 February 2020; ICAART: Setúbal, Portugal, 2020. [Google Scholar] [CrossRef]
  9. Zhang, Q.; Xu, J.; Xu, L.; Guo, H. Deep Convolutional Neural Networks for Forest Fire Detection. In Proceedings of the 2016 International Forum on Management, Education and Information Technology Application, Guangzhou, China, 30–31 January 2016; Atlantis Press: Dordrecht, The Netherland, 2016; pp. 568–575. [Google Scholar] [CrossRef] [Green Version]
  10. Muhammad, K.; Ahmad, J.; Baik, S.W. Early fire detection using convolutional neural networks during surveillance for effective disaster management. Neurocomputing 2018, 288, 30–42, Learning System in Real-time Machine Vision. [Google Scholar] [CrossRef]
  11. Toulouse, T.; Rossi, L.; Akhloufi, M.; Celik, T.; Maldague, X. Benchmarking of wildland fire colour segmentation algorithms. IET Image Process. 2015, 9, 1064–1072. [Google Scholar] [CrossRef] [Green Version]
  12. Ciullo, V.; Rossi, L.; Pieri, A. Experimental Fire Measurement with UAV Multimodal Stereovision. Remote Sens. 2020, 12, 3546. [Google Scholar] [CrossRef]
  13. Ma, J.; Ma, Y.; Li, C. Infrared and visible image fusion methods and applications: A survey. Inf. Fusion 2019, 45, 153–178. [Google Scholar] [CrossRef]
  14. Çetin, A.E.; Dimitropoulos, K.; Gouverneur, B.; Grammalidis, N.; Günay, O.; Habiboǧlu, Y.H.; Töreyin, B.U.; Verstockt, S. Video fire detection—Review. Digit. Signal Process. 2013, 23, 1827–1843. [Google Scholar] [CrossRef] [Green Version]
  15. Rawat, W.; Wang, Z. Deep Convolutional Neural Networks for Image Classification: A Comprehensive Review. Neural Comput. 2017, 29, 2352–2449. [Google Scholar] [CrossRef]
  16. Sun, Y.; Xue, B.; Zhang, M.; Yen, G.G. Evolving Deep Convolutional Neural Networks for Image Classification. IEEE Trans. Evol. Comput. 2020, 24, 394–407. [Google Scholar] [CrossRef] [Green Version]
  17. Wan, S.; Liang, Y.; Zhang, Y. Deep convolutional neural networks for diabetic retinopathy detection by image classification. Comput. Electr. Eng. 2018, 72, 274–282. [Google Scholar] [CrossRef]
  18. Zhao, Z.Q.; Zheng, P.; Xu, S.T.; Wu, X. Object Detection With Deep Learning: A Review. IEEE Trans. Neural Netw. Learn. Syst. 2019, 30, 3212–3232. [Google Scholar] [CrossRef] [Green Version]
  19. Ouyang, W.; Wang, X.; Zeng, X.; Qiu, S.; Luo, P.; Tian, Y.; Li, H.; Yang, S.; Wang, Z.; Loy, C.C.; et al. DeepID-Net: Deformable Deep Convolutional Neural Networks for Object Detection. In Proceedings of the IEEE Conference on Computer Vision and Pattern Recognition (CVPR), Boston, MA, USA, 7–12 June 2015; IEEE: Piscataway, NJ, USA, 2015. [Google Scholar]
  20. Farfade, S.S.; Saberian, M.J.; Li, L.J. Multi-View Face Detection Using Deep Convolutional Neural Networks. In Proceedings of the 5th ACM on International Conference on Multimedia Retrieval, Shanghai, China, 23–26 June 2015; Association for Computing Machinery: New York, NY, USA ICMR ’15. , 2015; pp. 643–650. [Google Scholar] [CrossRef] [Green Version]
  21. Sultana, F.; Sufian, A.; Dutta, P. Evolution of Image Segmentation using Deep Convolutional Neural Network: A Survey. Knowl. Based Syst. 2020, 201–202, 106062. [Google Scholar] [CrossRef]
  22. Badrinarayanan, V.; Kendall, A.; Cipolla, R. SegNet: A Deep Convolutional Encoder-Decoder Architecture for Image Segmentation. IEEE Trans. Pattern Anal. Mach. Intell. 2017, 39, 2481–2495. [Google Scholar] [CrossRef]
  23. Zhang, S.; Ma, Z.; Zhang, G.; Lei, T.; Zhang, R.; Cui, Y. Semantic Image Segmentation with Deep Convolutional Neural Networks and Quick Shift. Symmetry 2020, 12, 427. [Google Scholar] [CrossRef] [Green Version]
  24. Döllner, J. Geospatial Artificial Intelligence: Potentials of Machine Learning for 3D Point Clouds and Geospatial Digital Twins. PFG—J. Photogramm. Remote Sens. Geoinf. Sci. 2020, 88, 15–24. [Google Scholar] [CrossRef] [Green Version]
  25. Liu, W.; Wang, Z.; Liu, X.; Zeng, N.; Liu, Y.; Alsaadi, F.E. A survey of deep neural network architectures and their applications. Neurocomputing 2017, 234, 11–26. [Google Scholar] [CrossRef]
  26. Ma, J. Segmentation Loss Odyssey. arXiv 2020, arXiv:2005.13449. [Google Scholar]
  27. Luo, X.; Zhang, Z.; Zhang, B.; Wu, X. Image Fusion With Contextual Statistical Similarity and Nonsubsampled Shearlet Transform. IEEE Sens. J. 2017, 17, 1760–1771. [Google Scholar] [CrossRef]
  28. Chen, J.; Wu, K.; Cheng, Z.; Luo, L. A saliency-based multiscale approach for infrared and visible image fusion. Signal Process. 2021, 182, 107936. [Google Scholar] [CrossRef]
  29. Li, H.; Wu, X.; Kittler, J. Infrared and Visible Image Fusion using a Deep Learning Framework. In Proceedings of the 2018 24th International Conference on Pattern Recognition (ICPR), Beijing, China, 20–24 August 2018; IEEE: Piscataway, NJ, USA, 2018; pp. 2705–2710. [Google Scholar]
  30. Ma, J.; Yu, W.; Liang, P.; Li, C.; Jiang, J. FusionGAN: A generative adversarial network for infrared and visible image fusion. Inf. Fusion 2019, 48, 11–26. [Google Scholar] [CrossRef]
  31. Zhao, Y.; Fu, G.; Wang, H.; Zhang, S. The Fusion of Unmatched Infrared and Visible Images Based on Generative Adversarial Networks. Math. Probl. Eng. 2020, 2020, 3739040. [Google Scholar] [CrossRef]
  32. Toulouse, T. Estimation par Stéréovision Multimodale de Caractéristiques Géométriques d’un feu de Végétation en Propagation. Ph.D. Thesis, Université De Corse—Pasquale Paoli, Corte, France, 2015. [Google Scholar]
  33. Li, H.; Wu, X.J.; Kittler, J. MDLatLRR: A Novel Decomposition Method for Infrared and Visible Image Fusion. IEEE Trans. Image Process. 2020, 29, 4733–4746. [Google Scholar] [CrossRef] [Green Version]
  34. Ciprián-Sánchez, J.F.; Ochoa-Ruiz, G.; Gonzalez-Mendoza, M.; Rossi, L. FIRe-GAN: A Novel Deep Learning-Based Infrared-Visible Fusion Method for Wildfire Imagery. arXiv 2021, arXiv:2101.11745. [Google Scholar]
  35. Zhao, Y.; Ma, J.; Li, X.; Zhang, J. Saliency Detection and Deep Learning-Based Wildfire Identification in UAV Imagery. Sensors 2018, 18, 712. [Google Scholar] [CrossRef] [Green Version]
  36. Frizzi, S.; Bouchouicha, M.; Ginoux, J.M.; Moreau, E.; Sayadi, M. Convolutional neural network for smoke and fire semantic segmentation. IET Image Process. 2021, 15, 634–647. [Google Scholar] [CrossRef]
  37. Harkat, H.; Nascimento, J.; Bernardino, A. Fire segmentation using a DeepLabv3+ architecture. In Image and Signal Processing for Remote Sensing XXVI; Bruzzone, L., Bovolo, F., Santi, E., Eds.; International Society for Optics and Photonics, SPIE: Bellingham, MA, USA, 2020; Volume 11533, pp. 134–145. [Google Scholar] [CrossRef]
  38. Akhloufi, M.A.; Tokime, R.B.; Elassady, H. Wildland fires detection and segmentation using deep learning. In Pattern Recognition and Tracking XXIX; Alam, M.S., Ed.; International Society for Optics and Photonics, SPIE: Bellingham, MA, USA, 2018; Volume 10649, pp. 86–97. [Google Scholar] [CrossRef]
  39. Toan, N.T.; Thanh Cong, P.; Viet Hung, N.Q.; Jo, J. A deep learning approach for early wildfire detection from hyperspectral satellite images. In Proceedings of the 2019 7th International Conference on Robot Intelligence Technology and Applications (RiTA), KAIST, Daejeon, Korea, 1–3 November 2019; IEEE: Piscataway, NJ, USA, 2019; pp. 38–45. [Google Scholar] [CrossRef]
  40. Jadon, S. A survey of loss functions for semantic segmentation. In Proceedings of the 2020 IEEE Conference on Computational Intelligence in Bioinformatics and Computational Biology (CIBCB), Fully Virtual, Online, 27–29 October 2020; IEEE: Piscataway, NJ, USA, 2020; pp. 1–7. [Google Scholar] [CrossRef]
  41. Abraham, N.; Khan, N.M. A Novel Focal Tversky Loss Function With Improved Attention U-Net for Lesion Segmentation. In Proceedings of the 2019 IEEE 16th International Symposium on Biomedical Imaging (ISBI 2019), Venice, Italy, 8–11 April 2019; IEEE: Piscataway, NJ, USA, 2019; pp. 683–687. [Google Scholar] [CrossRef] [Green Version]
  42. Yeung, M.; Sala, E.; Schönlieb, C.B.; Rundo, L. Unified Focal Loss: Generalising Dice and Cross Entropy-Based Losses to Handle Class Imbalanced Medical Image Segmentation. arXiv 2021, arXiv:2102.04525. [Google Scholar]
  43. Matthews, B. Comparison of the predicted and observed secondary structure of T4 phage lysozyme. Biochim. Biophys. Acta (BBA) Protein Struct. 1975, 405, 442–451. [Google Scholar] [CrossRef]
  44. Collumeau, J.F.; Laurent, H.; Hafiane, A.; Chetehouna, K. Fire scene segmentations for forest fire characterization: A comparative study. In Proceedings of the 2011 18th IEEE International Conference on Image Processing, Brussels, Belgium, 11–14 September 2011; IEEE: Piscataway, NJ, USA, 2011; pp. 2973–2976. [Google Scholar] [CrossRef]
  45. Hafiane, A.; Chabrier, S.; Rosenberger, C.; Laurent, H.A.; Chabrier, S.; Rosenberger, C.; Laurent, H. A New Supervised Evaluation Criterion for Region Based Segmentation Methods. In Advanced Concepts for Intelligent Vision Systems; Blanc-Talon, J., Philips, W., Popescu, D., Scheunders, P., Eds.; Springer: Berlin/Heidelberg, Germany, 2007; pp. 439–448. [Google Scholar]
  46. Oktay, O.; Schlemper, J.; Folgoc, L.L.; Lee, M.; Heinrich, M.; Misawa, K.; Mori, K.; McDonagh, S.; Hammerla, N.Y.; Kainz, B.; et al. Attention U-Net: Learning Where to Look for the Pancreas. arXiv 2018, arXiv:1804.03999. [Google Scholar]
  47. Guo, C.; Szemenyei, M.; Pei, Y.; Yi, Y.; Zhou, W. SD-Unet: A Structured Dropout U-Net for Retinal Vessel Segmentation. In Proceedings of the 2019 IEEE 19th International Conference on Bioinformatics and Bioengineering (BIBE), Athens, Greece, 28–30 October 2019; IEEE: Piscataway, NJ, USA, 2019; pp. 439–444. [Google Scholar]
  48. Guo, C.; Szemenyei, M.; Hu, Y.; Wang, W.; Zhou, W.; Yi, Y. Channel Attention Residual U-Net for Retinal Vessel Segmentation. arXiv 2020, arXiv:2004.03702. [Google Scholar]
  49. Jung, S.; Lee, U.; Jung, J.; Shim, D.H. Real-time Traffic Sign Recognition system with deep convolutional neural network. In Proceedings of the 2016 13th International Conference on Ubiquitous Robots and Ambient Intelligence (URAI), Xi’an, China, 19–22 August 2016; IEEE: Piscataway, NJ, USA, 2016; pp. 31–34. [Google Scholar] [CrossRef]
  50. Wang, G.; Li, W.; Zuluaga, M.A.; Pratt, R.; Patel, P.A.; Aertsen, M.; Doel, T.; David, A.L.; Deprest, J.; Ourselin, S.; et al. Interactive Medical Image Segmentation Using Deep Learning With Image-Specific Fine Tuning. IEEE Trans. Med. Imaging 2018, 37, 1562–1573. [Google Scholar] [CrossRef]
  51. Yuan, X.; Shi, J.; Gu, L. A review of deep learning methods for semantic segmentation of remote sensing imagery. Expert Syst. Appl. 2021, 169, 114417. [Google Scholar] [CrossRef]
  52. Nassar, A.; Amer, K.; ElHakim, R.; ElHelw, M. A Deep CNN-Based Framework for Enhanced Aerial Imagery Registration With Applications to UAV Geolocalization. In Proceedings of the IEEE Conference on Computer Vision and Pattern Recognition (CVPR) Workshops, Salt Lake City, UT, USA, 18–23 June 2018; IEEE: Piscataway, NJ, USA, 2018. [Google Scholar]
  53. Lateef, F.; Ruichek, Y. Survey on semantic segmentation using deep learning techniques. Neurocomputing 2019, 338, 321–348. [Google Scholar] [CrossRef]
  54. Fukushima, K.; Miyake, S. Neocognitron: A Self-Organizing Neural Network Model for a Mechanism of Visual Pattern Recognition. In Competition and Cooperation in Neural Nets; Amari, S.I., Arbib, M.A., Eds.; Springe: Berlin/Heidelberg, Germany, 1982; pp. 267–285. [Google Scholar]
  55. Minaee, S.; Boykov, Y.Y.; Porikli, F.; Plaza, A.J.; Kehtarnavaz, N.; Terzopoulos, D. Image Segmentation Using Deep Learning: A Survey. IEEE Trans. Pattern Anal. Mach. Intell. 2021. Early Access. [Google Scholar] [CrossRef] [PubMed]
  56. Dhillon, A.; Verma, G.K. Convolutional neural network: A review of models, methodologies and applications to object detection. Prog. Artif. Intell. 2020, 9, 85–112. [Google Scholar] [CrossRef]
  57. Aloysius, N.; Geetha, M. A review on deep convolutional neural networks. In Proceedings of the 2017 International Conference on Communication and Signal Processing (ICCSP), Melmaruvathur, Tamilnadu, India, 6–8 April 2017; IEEE: Piscataway, NJ, USA, 2017; pp. 0588–0592. [Google Scholar] [CrossRef]
  58. Simonyan, K.; Zisserman, A. Very Deep Convolutional Networks for Large-Scale Image Recognition. arXiv 2015, arXiv:1409.1556. [Google Scholar]
  59. He, K.; Zhang, X.; Ren, S.; Sun, J. Deep Residual Learning for Image Recognition. In Proceedings of the IEEE Conference on Computer Vision and Pattern Recognition (CVPR), Las Vegas, NV, USA, 27–30 June 2016; IEEE: Piscataway, NJ, USA, 2016. [Google Scholar]
  60. Noh, H.; Hong, S.; Han, B. Learning Deconvolution Network for Semantic Segmentation. In Proceedings of the 2015 IEEE International Conference on Computer Vision (ICCV), Santiago, Chile, 7–13 December 2015; IEEE: Piscataway, NJ, USA, 2015; pp. 1520–1528. [Google Scholar] [CrossRef] [Green Version]
  61. Quan, T.M.; Hildebrand, D.G.C.; Jeong, W.K. FusionNet: A Deep Fully Residual Convolutional Neural Network for Image Segmentation in Connectomics. Front. Comput. Sci. 2021, 3. [Google Scholar] [CrossRef]
  62. Ren, S.; He, K.; Girshick, R.; Sun, J. Faster R-CNN: Towards Real-Time Object Detection with Region Proposal Networks. IEEE Trans. Pattern Anal. Mach. Intell. 2017, 39, 1137–1149. [Google Scholar] [CrossRef] [Green Version]
  63. Rota Bulò, S.; Porzi, L.; Kontschieder, P. In-Place Activated BatchNorm for Memory-Optimized Training of DNNs. In Proceedings of the IEEE Conference on Computer Vision and Pattern Recognition, Salt Lake City, UT, USA, 18–23 June 2018; IEEE: Piscataway, NJ, USA, 2018. [Google Scholar]
  64. Pohlen, T.; Hermans, A.; Mathias, M.; Leibe, B. Full-Resolution Residual Networks for Semantic Segmentation in Street Scenes. In Proceedings of the IEEE Conference on Computer Vision and Pattern Recognition (CVPR), Honolulu, HI, USA, 21–26 July 2017; IEEE: Piscataway, NJ, USA, 2017. [Google Scholar]
  65. Chen, L.C.; Papandreou, G.; Kokkinos, I.; Murphy, K.; Yuille, A.L. Semantic Image Segmentation with Deep Convolutional Nets and Fully Connected CRFs. arXiv 2016, arXiv:1412.7062. [Google Scholar]
  66. Chen, L.C.; Zhu, Y.; Papandreou, G.; Schroff, F.; Adam, H. Encoder-Decoder with Atrous Separable Convolution for Semantic Image Segmentation. In Proceedings of the European Conference on Computer Vision (ECCV), Munich, Germany, 8–14 September 2018; Springer: London, UK, 2018. [Google Scholar]
  67. Chen, L.C.; Papandreou, G.; Kokkinos, I.; Murphy, K.; Yuille, A.L. DeepLab: Semantic Image Segmentation with Deep Convolutional Nets, Atrous Convolution, and Fully Connected CRFs. IEEE Trans. Pattern Anal. Mach. Intell. 2018, 40, 834–848. [Google Scholar] [CrossRef] [PubMed]
  68. Chen, L.C.; Papandreou, G.; Schroff, F.; Adam, H. Rethinking Atrous Convolution for Semantic Image Segmentation. arXiv 2017, arXiv:1706.05587. [Google Scholar]
  69. Ronneberger, O.; Fischer, P.; Brox, T. U-Net: Convolutional Networks for Biomedical Image Segmentation. In Medical Image Computing and Computer-Assisted Intervention—MICCAI 2015; Navab, N., Hornegger, J., Wells, W.M., Frangi, A.F., Eds.; Springer International Publishing: Cham, Switzerland, 2015; pp. 234–241. [Google Scholar]
  70. Khanh, T.L.B.; Dao, D.P.; Ho, N.H.; Yang, H.J.; Baek, E.T.; Lee, G.; Kim, S.H.; Yoo, S.B. Enhancing U-Net with Spatial-Channel Attention Gate for Abnormal Tissue Segmentation in Medical Imaging. Appl. Sci. 2020, 10, 5729. [Google Scholar] [CrossRef]
  71. Toulouse, T.; Rossi, L.; Campana, A.; Celik, T.; Akhloufi, M.A. Computer vision for wildfire research: An evolving image dataset for processing and analysis. Fire Saf. J. 2017, 92, 188–194. [Google Scholar] [CrossRef] [Green Version]
  72. Cazzolato, M.; Avalhais, L.; Chino, D.; Ramos, J.; Souza, J.; Rodrigues, J., Jr.; Taina, A. FiSmo: A Compilation of Datasets from Emergency Situations for Fire and Smoke Analysis. In Proceedings of the Brazilian Symposium on Databases-SBBD, Minas Gerais, Brazil, 2–5 October 2017; pp. 213–223. [Google Scholar]
  73. IMAGENET. Available online: http://www.image-net.org/ (accessed on 20 November 2020).
  74. Miyato, T.; Kataoka, T.; Koyama, M.; Yoshida, Y. Spectral Normalization for Generative Adversarial Networks. arXiv 2018, arXiv:1802.05957. [Google Scholar]
  75. Veit, A.; Wilber, M.; Belongie, S. Residual Networks Behave Like Ensembles of Relatively Shallow Networks. arXiv 2016, arXiv:1605.06431. [Google Scholar]
  76. Woo, S.; Park, J.; Lee, J.Y.; Kweon, I.S. Cbam: Convolutional block attention module. In Proceedings of the European Conference on Computer Vision (ECCV), Munich, Germany, 8–14 September 2018; Springer: London, UK, 2018; pp. 3–19. [Google Scholar]
  77. Sudre, C.H.; Li, W.; Vercauteren, T.; Ourselin, S.; Jorge Cardoso, M. Generalised Dice Overlap as a Deep Learning Loss Function for Highly Unbalanced Segmentations. In Deep Learning in Medical Image Analysis and Multimodal Learning for Clinical Decision Support; Lecture Notes in Computer Science; Springer: Cham, Switzerland, 2017; pp. 240–248. [Google Scholar] [CrossRef] [Green Version]
  78. Fidon, L.; Li, W.; Garcia-Peraza-Herrera, L.C.; Ekanayake, J.; Kitchen, N.; Ourselin, S.; Vercauteren, T. Generalised Wasserstein Dice Score for Imbalanced Multi-class Segmentation Using Holistic Convolutional Networks. In International MICCAI Brainlesion Workshop; Lecture Notes in Computer Science; Springer: Cham, Switzerland, 2018; pp. 64–76. [Google Scholar] [CrossRef] [Green Version]
  79. Salehi, S.S.M.; Erdogmus, D.; Gholipour, A. Tversky Loss Function for Image Segmentation Using 3D Fully Convolutional Deep Networks. In Machine Learning in Medical Imaging; Wang, Q., Shi, Y., Suk, H.I., Suzuki, K., Eds.; Springer International Publishing: Cham, Switzerland, 2017; pp. 379–387. [Google Scholar]
  80. Li, Z.; Kamnitsas, K.; Glocker, B. Analyzing Overfitting Under Class Imbalance in Neural Networks for Image Segmentation. IEEE Trans. Med. Imaging 2021, 40, 1065–1077. [Google Scholar] [CrossRef] [PubMed]
  81. Lin, T.Y.; Goyal, P.; Girshick, R.; He, K.; Dollar, P. Focal Loss for Dense Object Detection. In Proceedings of the IEEE International Conference on Computer Vision (ICCV), Venice, Italy, 22–29 October 2017; IEEE: Piscataway, NJ, USA, 2017. [Google Scholar]
  82. Chicco, D.; Tötsch, N.; Jurman, G. The Matthews correlation coefficient (MCC) is more reliable than balanced accuracy, bookmaker informedness, and markedness in two-class confusion matrix evaluation. BioData Min. 2021, 14, 13. [Google Scholar] [CrossRef]
  83. Taha, A.A.; Hanbury, A. Metrics for evaluating 3D medical image segmentation: analysis, selection, and tool. BMC Med. Imaging 2015, 15, 29. [Google Scholar] [CrossRef] [Green Version]
  84. Phillips III, W.; Shah, M.; da Vitoria Lobo, N. Flame recognition in video. Pattern Recognit. Lett. 2002, 23, 319–327. [Google Scholar] [CrossRef]
  85. Berman, M.; Triki, A.R.; Blaschko, M.B. The Lovász-Softmax Loss: A Tractable Surrogate for the Optimization of the Intersection-Over-Union Measure in Neural Networks. arXiv 2018, arXiv:1705.08790. [Google Scholar]
  86. Zhao, S.; Wang, Y.; Yang, Z.; Cai, D. Region Mutual Information Loss for Semantic Segmentation. arXiv 2019, arXiv:1910.12037. [Google Scholar]
  87. Ke, T.W.; Hwang, J.J.; Liu, Z.; Yu, S.X. Adaptive Affinity Fields for Semantic Segmentation. arXiv 2018, arXiv:1803.10335. [Google Scholar]
  88. Wang, W.; Zhou, T.; Yu, F.; Dai, J.; Konukoglu, E.; Gool, L.V. Exploring Cross-Image Pixel Contrast for Semantic Segmentation. arXiv 2021, arXiv:2101.11939. [Google Scholar]
Figure 1. Example of wildfire image classification and segmentation.
Applsci 11 07046 g001
Figure 2. Sample basic architecture of a CNN. The last layers can differ depending on the particular application (e.g., classification, segmentation, etc.).
Applsci 11 07046 g002
Figure 3. Sample images of the Corsican Fire Database.
Applsci 11 07046 g003
Figure 4. Framework of the VGG19 proposed by Li et al. [29].
Applsci 11 07046 g004
Figure 5. Structure of the Fire-GAN model proposed by Ciprián-Sánchez et al. [34].
Applsci 11 07046 g005
Figure 6. Sample visible, NIR, fused, and ground truth images employed in the present paper.
Applsci 11 07046 g006
Figure 7. In-detail structure of the model proposed by Akhloufi et al. [38]. The numbers inside the squares represent the number of filters in the corresponding layer.
Applsci 11 07046 g007
Figure 8. In-detail structure of the residual blocks in the model by Choi et al. [5].
Applsci 11 07046 g008
Figure 9. In-detail structure of the nested residual blocks in the model by Choi et al. [5].
Applsci 11 07046 g009
Figure 10. In-detail structure of the full architecture by Choi et al. [5]. The numbers inside some of the blocks represent the number of filters per layer. In the case of the nested residual blocks, the number corresponds to the number of filters in all of the convolution layers inside of its components.
Applsci 11 07046 g010
Figure 11. In-detail structure of the full architecture by Frizzi et al. [36] with the mentioned considerations. The numbers inside some of the blocks represent the number of filters per layer.
Applsci 11 07046 g011
Figure 12. Structure of the AG proposed by Oktay et al. [46].
Applsci 11 07046 g012
Figure 13. Structure of the SA module employed by Guo et al. [47].
Applsci 11 07046 g013
Figure 14. Structure of the MECA module proposed by Guo et al. [48].
Applsci 11 07046 g014
Figure 15. Sample segmentation results for the top three combinations for all metrics. For the segmentation results of the Choi architecture, we binarized the images by assigning a value of 1 to all non-zero pixels in a post-processing step.
Applsci 11 07046 g015
Figure 16. Results grouped by architecture (first row), image type (second row), and loss function (third row) for all metrics.
Applsci 11 07046 g016
Figure 17. Sample segmentation results for all image types and the Akhloufi + Focal Tversky combination.
Applsci 11 07046 g017
Figure 18. Spearman correlation matrix for all parameters.
Applsci 11 07046 g018
Figure 19. In-detail structure of the model proposed by Akhloufi et al. [38] with the inclusion of AG modules. The numbers inside the squares represent the number of filters in the corresponding layer.
Applsci 11 07046 g019
Figure 20. In-detail structure of the model proposed by Akhloufi et al. [38] with the inclusion of SA modules. The numbers inside the squares represent the number of filters in the corresponding layer.
Applsci 11 07046 g020
Figure 21. In-detail structure of the model proposed by Akhloufi et al. [38] with the inclusion of MECA modules. The numbers inside the squares represent the number of filters in the corresponding layer.
Applsci 11 07046 g021
Table 1. Overview of the advantages and disadvantages of the discussed approaches.
ApproachAdvantagesDisadvantages
VGG-basedSimple, straightforward architectures.Large number of parameters; high computational power required.
Residual block-basedAddress the vanishing gradient problem: allows for deeper networks.Large-scale usage of skip connections can lead to memory problems.
DeepLab familyAtrous convolutions to generate high-resolution feature maps.ASPP-based methods display a significant computational cost.
U-Net-based modelsDesigned for good performance on smaller datasets. Relatively low number of parameters.Skip connections tend to use redundant information in low-level encoder features.
Table 2. Top five performing combinations per metric. The best performing combinations per metric are highlighted in bold.
MetricValueArchitectureLossImage Type
MCC0.9252AkhloufiDiceVisible
0.9248ChoiFocal TverskyVisible
0.9231AkhloufiFocal TverskyVisible
0.9151ChoiFocal TverskyFIRe-GAN
0.9140AkhloufiFocal TverskyNIR
F10.9323AkhloufiDiceVisible
0.9274AkhloufiFocal TverskyVisible
0.9265ChoiFocal TverskyVisible
0.9176ChoiFocal TverskyFIRe-GAN
0.9165AkhloufiFocal TverskyNIR
HAF0.9098AkhloufiDiceVisible
0.9068ChoiFocal TverskyVisible
0.8957AkhloufiFocal TverskyVisible
0.8904AkhloufiDiceNIR
0.8892AkhloufiFocal TverskyNIR
Table 3. Comparison between the best combination and the best traditional method per metric. The best performing method per metric is highlighted in bold.
MetricMethodValue
MCCAkhloufi + Focal Tversky + visible0.92
Phillips et al. [84]0.81
F1Akhloufi + Focal Tversky + visible0.92
Phillips et al. [84]0.82
HAFAkhloufi + Focal Tversky + visible0.89
Phillips et al. [84]0.75
Table 4. Comparison the best combination with and without attention modules. The best combination per metric is highlighted in bold.
MetricMethodValue
MCCAkhloufi + Focal Tversky + visible0.9225
AG Akhloufi + Focal Tversky + visible0.9241
SP Akhloufi + Focal Tversky + visible0.9240
MECA Akhloufi + Focal Tversky + visible0.9244
F1Akhloufi + Focal Tversky + visible0.9244
AG Akhloufi + Focal Tversky + visible0.9260
SP Akhloufi + Focal Tversky + visible0.9258
MECA Akhloufi + Focal Tversky + visible0.9263
HAFAkhloufi + Focal Tversky + visible0.9004
AG Akhloufi + Focal Tversky + visible0.9016
SP Akhloufi + Focal Tversky + visible0.9019
MECA Akhloufi + Focal Tversky + visible0.9032
Publisher’s Note: MDPI stays neutral with regard to jurisdictional claims in published maps and institutional affiliations.

