3.1. Results of XRD and DSC Analysis of Synthesized Glasses
All synthesized samples were analyzed using X-ray powder diffraction technique to ensure their glassy state. As one can see from the diffraction patterns presented in
Figure 1a, one should consider all phosphate glass samples as fully amorphous materials. The lack of crystalline peaks is observed for all samples, even for PPG_Tb30 sample, containing relatively high contribution (3.0%,
w/
w) of Tb
2O
3 oxide. The presented XRD patterns show that for all samples only wide scattering peaks (so called “halo”) are observed at ca. 21° and 31° 2theta angles. In the low range of 2theta angle (5° to 16°), one can also observe an increased background intensity due to more efficient X-ray scattering in air. Obtained X-ray patterns are similar to those that can be find in literature [
31,
32,
33]. The results of DSC analysis are presented in
Figure 1b. Thermal analyses were carried out within the temperature range of 40–550 °C and confirmed the glassy nature of the investigated materials by existing of the glass transitions within the temperature range of 407–423 °C. For pure, undoped phosphate glass, the glass transition temperature was determined at 423 °C, whereas for the terbium-doped samples the transition temperatures were shifted towards lower values between 408–410 °C. In terms of DSC, for undoped phosphate glass exhibits there was similar T
g to that reported in literature [
34]. Decreasing of T
g temperature for terbium-doped glasses may be caused by a global weakening of the glass network induced by relatively large Tb
3+ ion incorporation, which can be ascribed to the increase in non-bridging oxygens due to the cleavage of P–O–P bonds to form P-O-Tb
2+ [
35,
36,
37,
38]. However, this issue requires further research using other research methods, for example, NMR.
3.3. Analysis and Structure of TL Emission from Phosphate Glasses
As one can find, from the previous data, changing concentration of terbium oxide in phosphate glasses leading to increase of their thermoluminescence yield and also influencing the shapes of TL curves. Because of this, it was necessary to investigate TL mechanism in synthesized glasses. To follow and analyze the impact of terbium dopant and its concentration on TL signal and traps structure, one can apply verified approach based on the mixed experimental methods and computerized deconvolution of the TL curves. The substantial question was the selection of the proper traps distribution model, which should be selected for glow curves deconvolution procedure. Thus, at first one performed T
max–T
stop measurements for both pure PPG and terbium-doped glass samples irradiated with 10 kGy radiation dose, within the temperature ranges of 50–360 °C and changing temperature in 2–6 °C steps. The results obtained from these experiments are presented in
Figure 8. From the presented data, one can easily determine the number and nature of traps present in the investigated glasses. For pure PPG glass sample (
Figure 8a), the dependence of position of the first maximum present in a glow curve (T
max) obtained during reading the sample after irradiation and preheating to T
stop temperature vs. T
stop revealed the existence of five trapping centers. The first peak represented by a flat line in region of 50–90 °C was characterized as a single first order kinetics (FOK) signal, next three signals were identified as defects with continuous distribution of energy (straight increasing lines in regions 90–140, 140–190, and 190–310 °C), whereas the last peak visible as a flat region followed by an increasing tail gave presumption for existence of a single general order kinetics (GOK) peak in the region of 280–360 °C [
48]. Similar analysis of the terbium-doped glass delivered evidence for existence of one FOK peak in the region of 50–90 °C and five peaks with a continuous trap energy distribution in regions of 90–110, 110–130, 130–160, 160–190, and 190–320 °C.
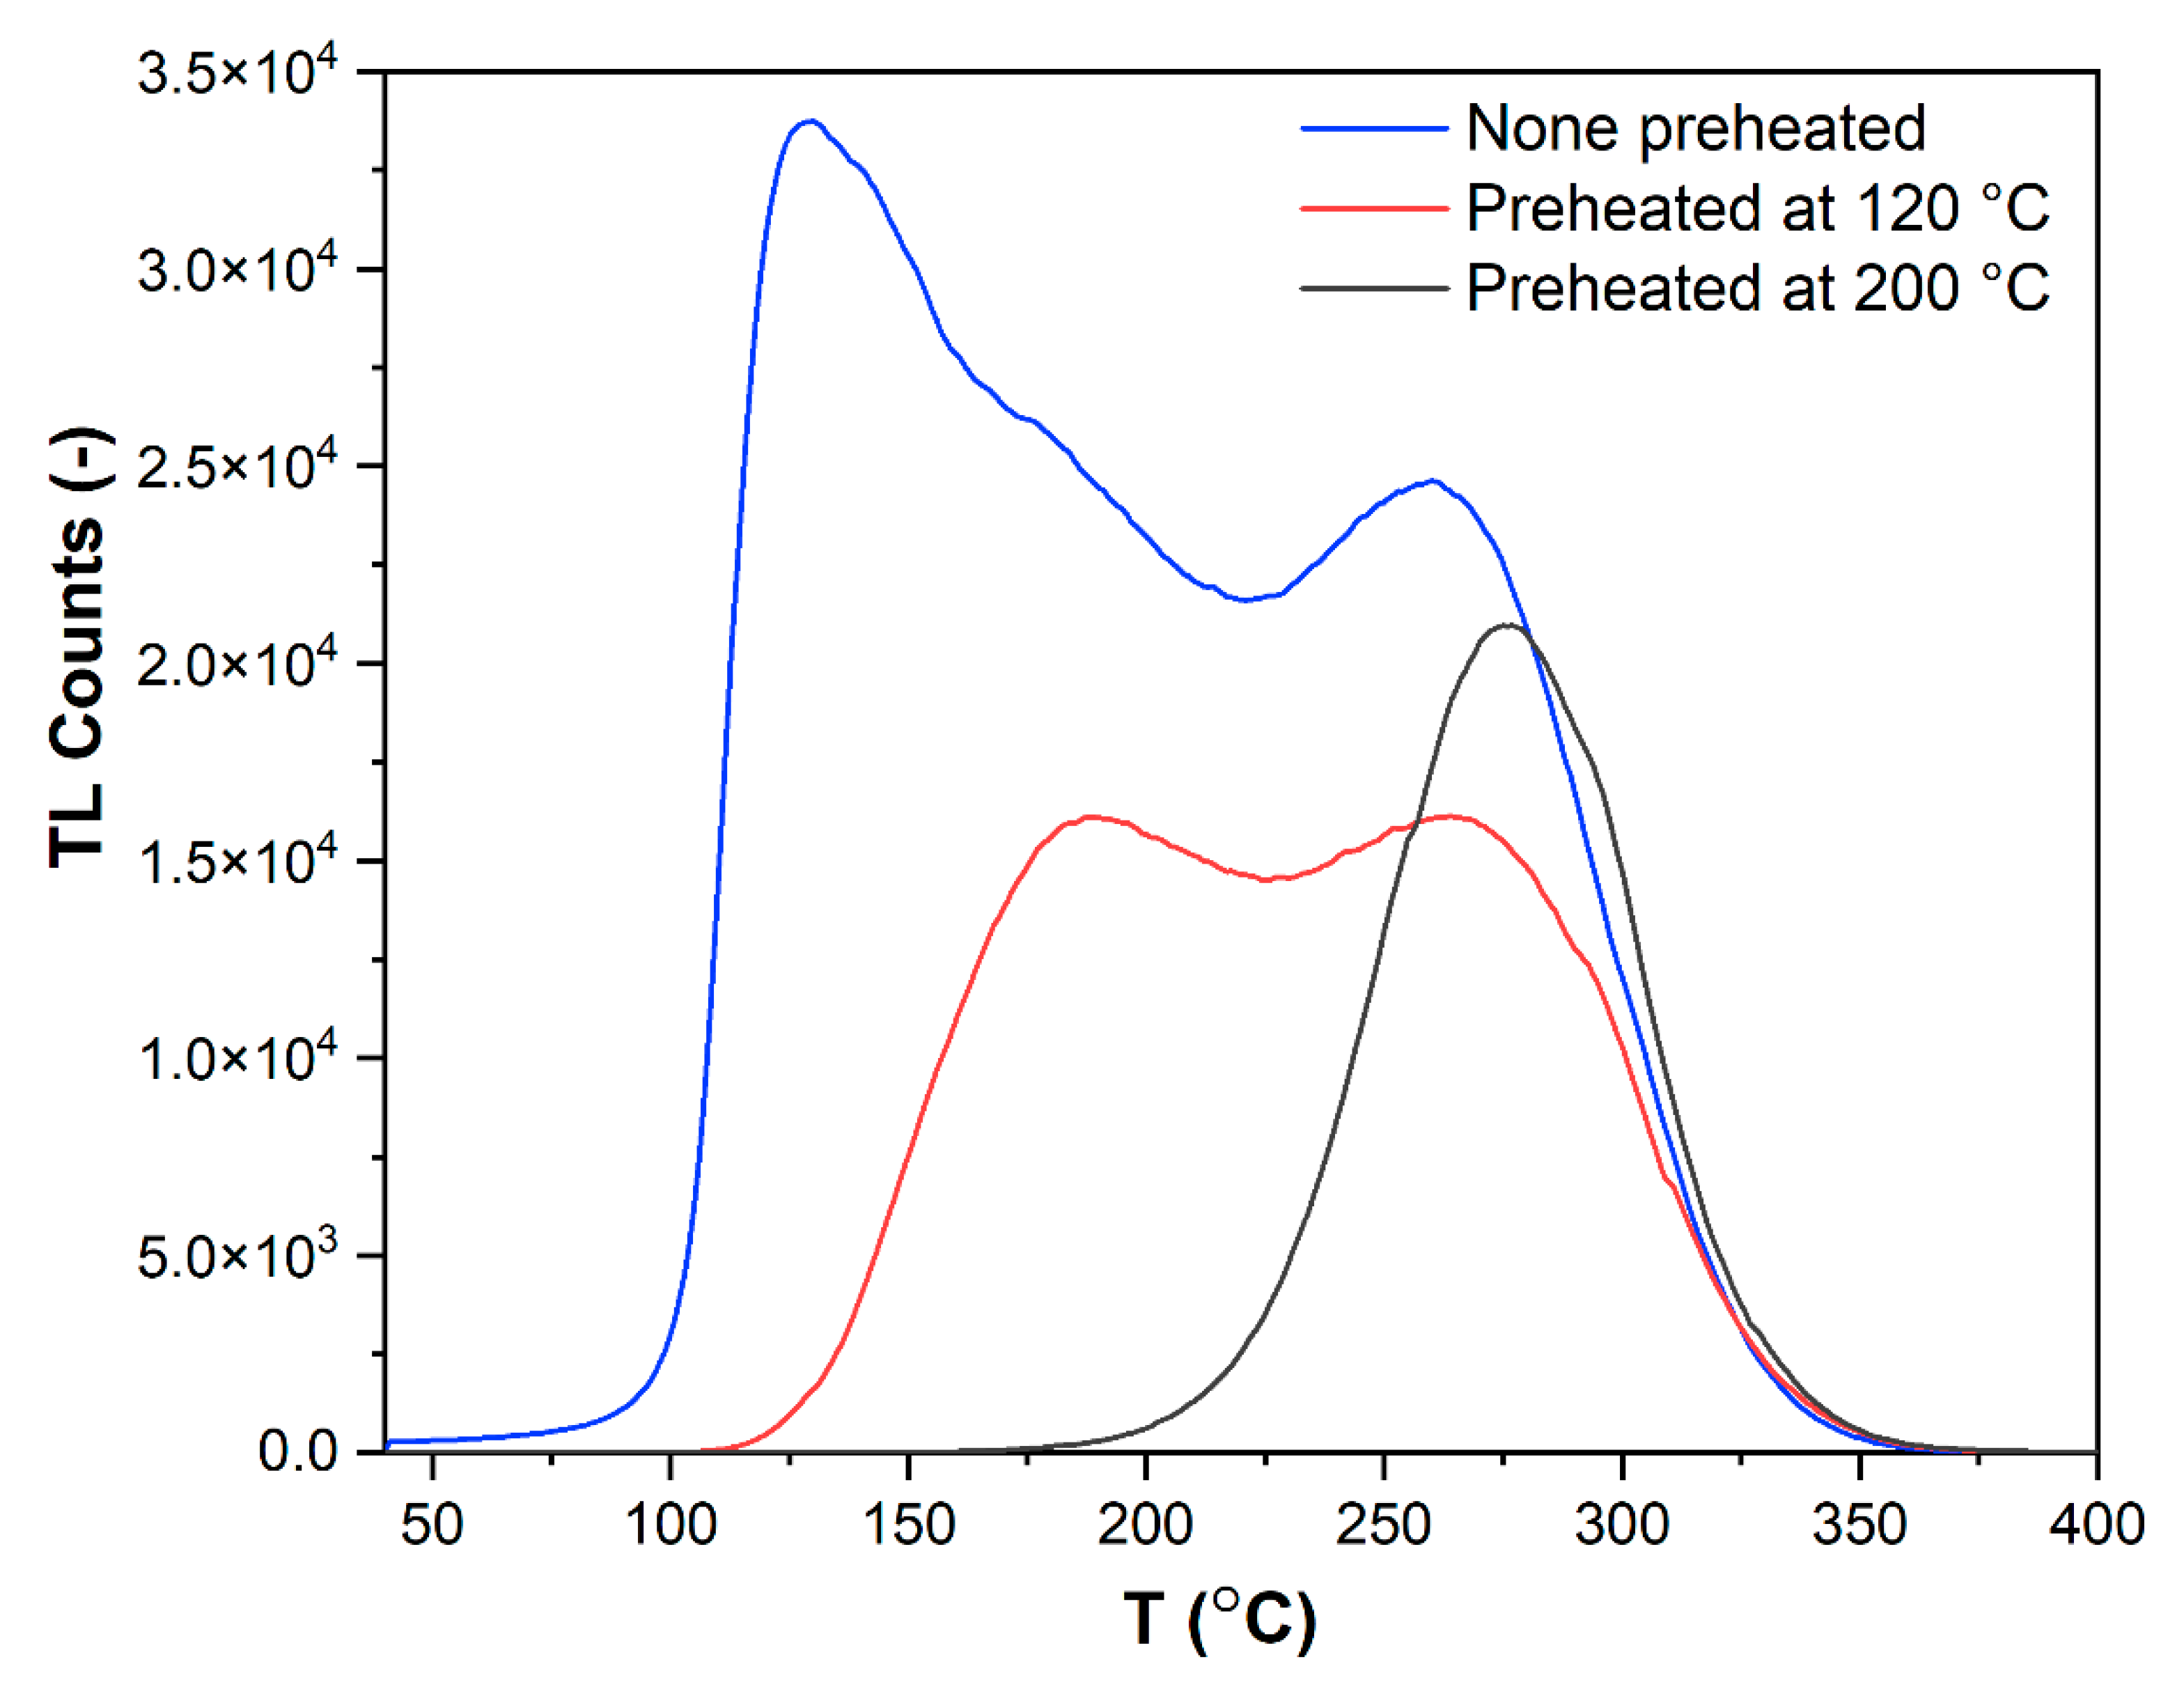
Direct determination of the exact positions of signals contributing to a complex glow curve with strongly overlapping peaks is always a difficult task, so next to the presented above T
max–T
stop measurements, one also performed variable heating rate method to facilitate the resolving of the glow curves structure. The method was applied both for pure phosphate glass (PPG) and for terbium-doped samples within the heating rates between 0.5–10 °C on samples irradiated with 10 kGy radiation dose. Results of these measurements are presented in
Figure 9. In case of terbium-doped samples, shutter-reducing light intensity had to be applied. From the VHR measurements, the shifting of TL emission maxima is evident. For PPG sample (cf.
Figure 9a), the most prominent peak maximum moves from 98 to 145 °C, upon changing heating rate from 0.5 to 10 °C/s. Unfortunately, due to the strong overlapping of peaks, this is the only signal whose position may be unambiguously determined. Nevertheless, the overall shapes of the TL emission curves remain similar, regardless of heating rate applied.
For terbium-doped glass (0.5% Tb
2O
3, PPG_Tb05, cf.
Figure 9b) and the lowest heating rate of 0.5 °C/s, one can easily determine the low temperature peak position at 101 °C/s and roughly the position of the other, higher temperature peak at ca. 175 °C. Moreover, for terbium-doped glass the much stronger dependence of the overall TL emission curves vs. heating rate can be easily found. Increasing the heating rate, the intensity of the first peak decreases progressively; however, it can be still easily found even in case of the highest heating rate of 10 °C/s on the lower temperature shoulder of the most prominent TL emission peak, whose maximum is located at ca. 200 °C/s. Very similar results based on the VHR method were observed also for the 0.1 and 3.0% Tb
2O
3-doped phosphate glasses (PPG_Tb01 and PPG_Tb30).
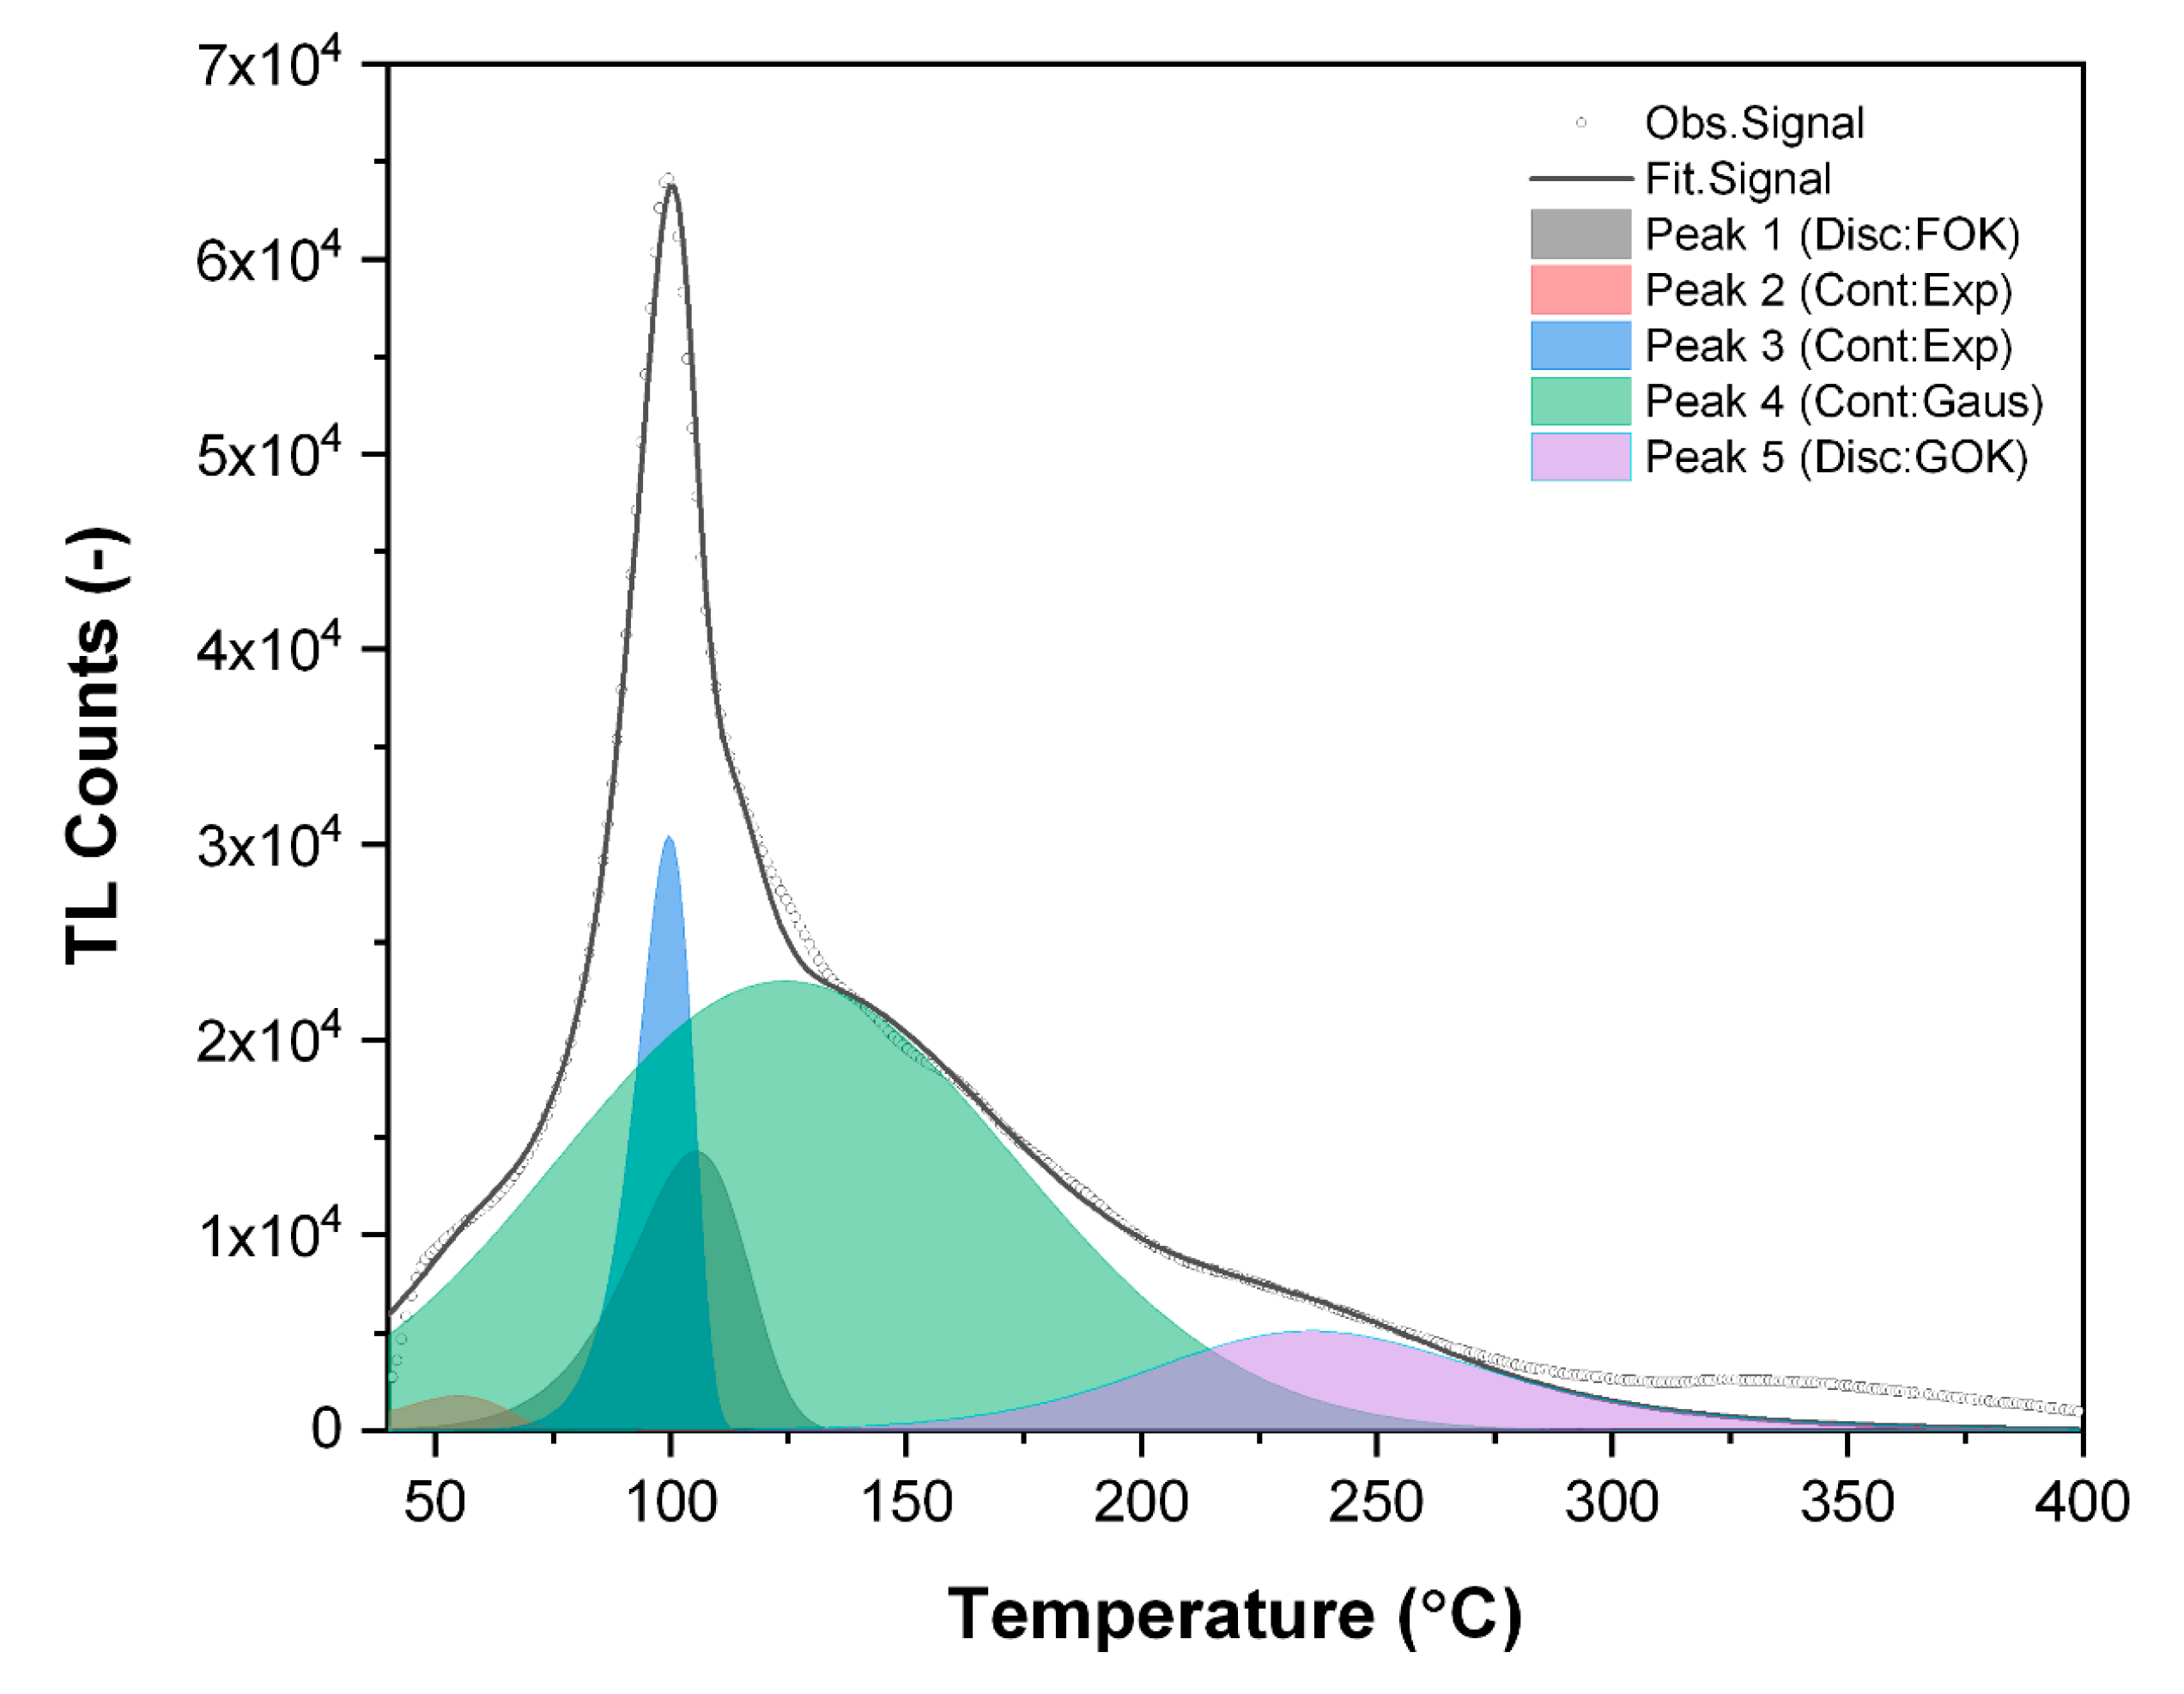
Due to the significant complexity of the presented TL emissions, it is very difficult to completely analyze the structure of the glow curves and contribution of the particular TL peaks taking into account only results obtained from T
max–T
stop and VHR measurements. Nevertheless, they can be a starting point for the deconvolution analysis using specialized software with implemented appropriate TL models. Based on the data presented above, one can propose models suitable for resolving observed TL glow curves. For the PPG glass, the model involves mixed contribution of FOK peak, three continuous energy distribution peaks, and GOK signal, according to Equation (4):
where I
TL and I
Peak (1–5) are total and fractional TL intensities due to the particular peaks contributions. Such a combined approach to TL glow curve analysis has already been applied and reported in literature [
49]. The glow peaks following first (FOK) and general order kinetics (GOK) were fitted using Equations (5) and (6) [
48,
50]:
where I and I
m are TL intensities for a given temperature (T, in K) or at peak maximum (Tm) and temperature linearly increases with time (t) from T
0 to T, T(t) = T
0 + βt, β (°C/s) is the linear heating rate; E (eV) is the trap activation energy; k (eV·K
−1) is the Boltzmann constant; and b is the kinetic order parameter. In case of continuous energy distribution of traps present in material, usually exponential or gaussian functions are used, which can be described by Equations (7) and (8) [
49,
50,
51]:
where n and no are number of trapping centres of a given energy (E) and total density of trapped charges (cm
−3), E
0 is either the shallowest energy in the distribution (exponential model) or the most populated trapping level (gaussian distribution), and σ is the parameter related to the width of the distribution. Based on these distributions, two models are generally in use, describing dependencies of TL emission intensity vs. energy and temperature according to Equations (9) and (10):
where s (s
−1) is the frequency coefficient related to the type of defect and other symbols are as described above. The models described according to Equations (5)–(10) are implemented in a dedicated glow curve deconvolution software and are described in several papers [
49,
50]. The software was used for analysis of glow curves obtained during measurement of PPG sample, and graphical representation of the obtained results are presented in
Figure 10.
The deconvolution procedure was performed in order to recognize the structure of the TL glow curve, structure, and types of defects present in the material and to estimate the energy levels of the trapping centers related to the particular TL emissions from the material. Verification of the proper localization of particular peaks was based on the consecutive analysis of the experimental data and results obtained from deconvolution analysis using the GCA (Glow Curve Analysis) software [
50]. The selection between exponential and gaussian distributions for continuous type defects was made taking as a criterion the possibly lowest value of FOM (Figure of Merit) parameter, which indicates the difference between experimental data and computer-simulated glow curves based on the parameters obtained during deconvolution procedure. The commonly accepted values of FOM are usually below 5%. The results obtained during deconvolution analysis of glow curves obtained from VHR measurements of PPG glass are presented in
Table 5.
In
Table 5, one presented only data obtained during deconvolution of TL emission curves for three lowest heating rates of 0.5, 1.0, and 2.0 °C/s. The general conclusion from these results is that all sets of data correlate quite well each other for particular peaks. For Peak 2, one can find relatively high value of the frequency factor; however, this could be due to the exponential expression used to obtain this value and based on energy of the trapping center, so even small variation in E value may lead to large variation and uncertainty in calculated value of s. It was impossible to correlate all the data obtained from deconvolution procedure with the results from VHR measurements, especially for the higher heating rates above 2 °C/s. It was probably due to a limited thermal conductivity of the samples (ca. 40 mg in weight, 5 mm in diameter, and ca. 1 mm thickness) and in consequence delayed response of the TL emission vs. temperature measured during samples reading. Nevertheless, the careful analysis of the available data allowed for determination of the positions of the peaks in TL emission curves for which temperature shifts were monitored in relation to the applied heating rate. Analysis was performed according to the known VHR based correlation of the TL peak position and heating rate, which can be described by Equation (11) [
49]:
where all symbols are as described previously. Equation (11) can be easily linearized, and the obtained dependencies of
for PPG glass samples are presented in
Figure 11. As mentioned above, due to limited thermal conductivity of the samples, it was very difficult to correlate results obtained from the higher heating rates, for which calculated values of departed significantly from linearity. Such prepared data allowed for experimental verification of the values obtained during deconvolution procedure. For all presented dependencies, one can observe purely linear correlations, whose slopes allowed for experimental determination of the energies of trapping centers, presented in
Table 6 together (for comparison) with those obtained from deconvolution procedure. In most cases, the presented values are fully convergent, with only higher discrepancy observed for Peak 3, in which case the value obtained from VHR method was ca. 15% lower than that from deconvolution analysis.
Taking into account the data from Tmax–Tstop and VHR experiments, it seems that structure of the TL signals in terbium-doped phosphate glasses should exhibit similar behavior as observed in case of pure PPG glass. Because of a vast number of experiments required and calculation works to be performed, one decided that due to the complexity of the thermoluminescence signals from terbium-doped phosphate glasses, this topic deserves wider discussion and analysis in another separate publication, for which the results presented in this work provide a great introduction.


