Article

High Visibility Conditions in a Sunset Environment

1
Graduate School of Medical Sciences, Kitasato University, 1-15-1 Kitazato, Minami-ku, Sagamihara 252-0373, Japan
2
Department of Orthoptics and Visual Science, Kitasato University School of Allied Health Sciences, 1-15-1 Kitazato, Minami-ku, Sagamihara 252-0373, Japan
3
Nissenken Quality Evaluation Center, 2-16-11, Kuramae, Taito-ku, Tokyo 111-0051, Japan
4
Kaken Test Center, 4-1-22 Muromachi, Nihonbashi, Chuo-ku, Tokyo 103-0022, Japan
5
Department of Advanced Textile and Kansei Engineering, Faculty of Textile Science and Technology, Shinshu University, 3-15-1 Tokida, Ueda 390-8621, Japan
6
Azearth Corporation, 4-13-7 Kuramae, Taito-ku, Tokyo 111-8623, Japan
7
Department of Ophthalmology, Kitasato University School of Medicine, 1-15-1 Kitazato, Minami-ku, Sagamihara 252-0374, Japan
*
Authors to whom correspondence should be addressed.
Appl. Sci. 2021, 11(16), 7229; https://doi.org/10.3390/app11167229
Submission received: 7 July 2021 / Revised: 30 July 2021 / Accepted: 3 August 2021 / Published: 5 August 2021

Abstract

:
There is no standard for high-visibility safety clothing for general pedestrians, nor is it widely used. Therefore, this study investigated visibility in order to examine the standards for high-visibility safety clothing for general pedestrians. Methods: Twenty healthy participants (mean age, 22.4 ± 4.4 years) without ocular disease, except for refractive errors, were studied. All participants had healthy visual acuity in corrected vision. This study assumed sunset conditions in Japan. The light source was set up in a dark room, and the illuminance in front of the visual target was set to 300 lx. We investigated the visibility of 142 patterns of black and yellow combination samples with different spatial frequencies, pattern types, angles, and color ratios. Results: The highest visibility was found at 5.0 cycles per degree of the stripe pattern at the spatial frequency, yellow ratio of 75%, and a stripe angle of 165°. Conclusions: Under sunset conditions, the brightness decreased when black was combined with yellow. However, it forms a two-color pattern and becomes more conspicuous. The highest visibility was obtained by arranging black and yellow in a diagonal stripe pattern. We predict that establishing clothing standards based on the results of this study will help design safety clothing with increased visibility.

1. Introduction

The World Health Organization reports that approximately 1.35 million deaths occur due to traffic accidents worldwide [1]. The number of traffic fatalities is increasing worldwide, while it is decreasing in Japan. In 2019, there were 3215 traffic fatalities in Japan (less than 317 or 9.0%, compared with the previous year), which is the lowest statistic in the post-war period. However, the number of traffic accidents remain high at 381,237 cases per year, with 461,775 people injured (decrease of 64,071 or 12.2% from the previous year) [2]. According to the 2019 statistics from Japan’s National Police Agency, many pedestrians were injured in traffic accidents, with the largest number of adults aged 80 years and older (5277) and the largest number of children aged 7–12 years (3426). Details of the number of injured pedestrians, assorted by age group, are observable in Supplementary Figure S1.
When we looked into traffic accidents involving children, we found that the largest number of traffic accidents occurred between 4 and 6 pm, which is the time when elementary and junior high school students leave school [3]. For details on the number of injured elementary and junior high school students, assorted by time of day, please see Supplementary Figure S2.
In this study, we focused on high-visibility safety clothing to prevent traffic accidents in children. This clothing should be designed in such a way that safety through high visibility is ensured. The color and design of the cloth and the retroreflective material used should increase the visibility of the wearer. ISO 20471 high-visibility clothing was established by the International Organization for Standardization in March 2013, and JIS T 8127 high-visibility safety clothing was established by the Japanese Industrial Standards in October 2015 [4,5]. The current JIS T 8127 standard limits the colors that can be used and does not allow for a variety of color schemes. In addition, retroreflective materials make it difficult to design clothing, and safety is the primary concern of this standard. However, these do not cover general users such as general adults and children, but are limited to workers on highways, public roads, construction sites, parking lots, and other high-risk levels. There have been many field-based studies examining the conspicuousness of road workers and pedestrians wearing reflective materials [6,7,8,9], but to our knowledge, no studies have investigated the use of high-visibility clothing in general users. Therefore, it is necessary to create a standard for high-visibility clothing with colors and designs that can be preferred by general users. In this study, we constructed an environment assuming the time of sunset, which corresponds to the time when elementary and junior high school students leave from school, and investigated visibility in terms of spatial frequency, color ratio, and angle of the stripes.

2. Materials and Methods

2.1. Participants

Twenty healthy participants without ocular disease, except for refractive errors, were studied. There were 10 men and 10 women with a mean age (SD) of 22.4 ± 4.4 years, ranging from 20 to 30 years. All participants had a corrected visual acuity of > 20/20. The mean spherical refractive error was −2.45 ± 2.66 diopter (D), and the mean astigmatism was −0.72 ± 0.63 D. Participants with astigmatism greater than −2.00 D were excluded. The refractive errors were fully corrected before the study was carried out. This study was conducted in accordance with the Declaration of Helsinki. The procedures used were approved by the Ethics Committee of the School of Allied Health Sciences of Kitasato University (2018-012), and informed consent was obtained from all participants, and the study was conducted in accordance with guidelines and regulations related to informed consent. In addition, we obtained informed consent from the participants to submit their research scenes for open access publications, which may lead to personal identification.

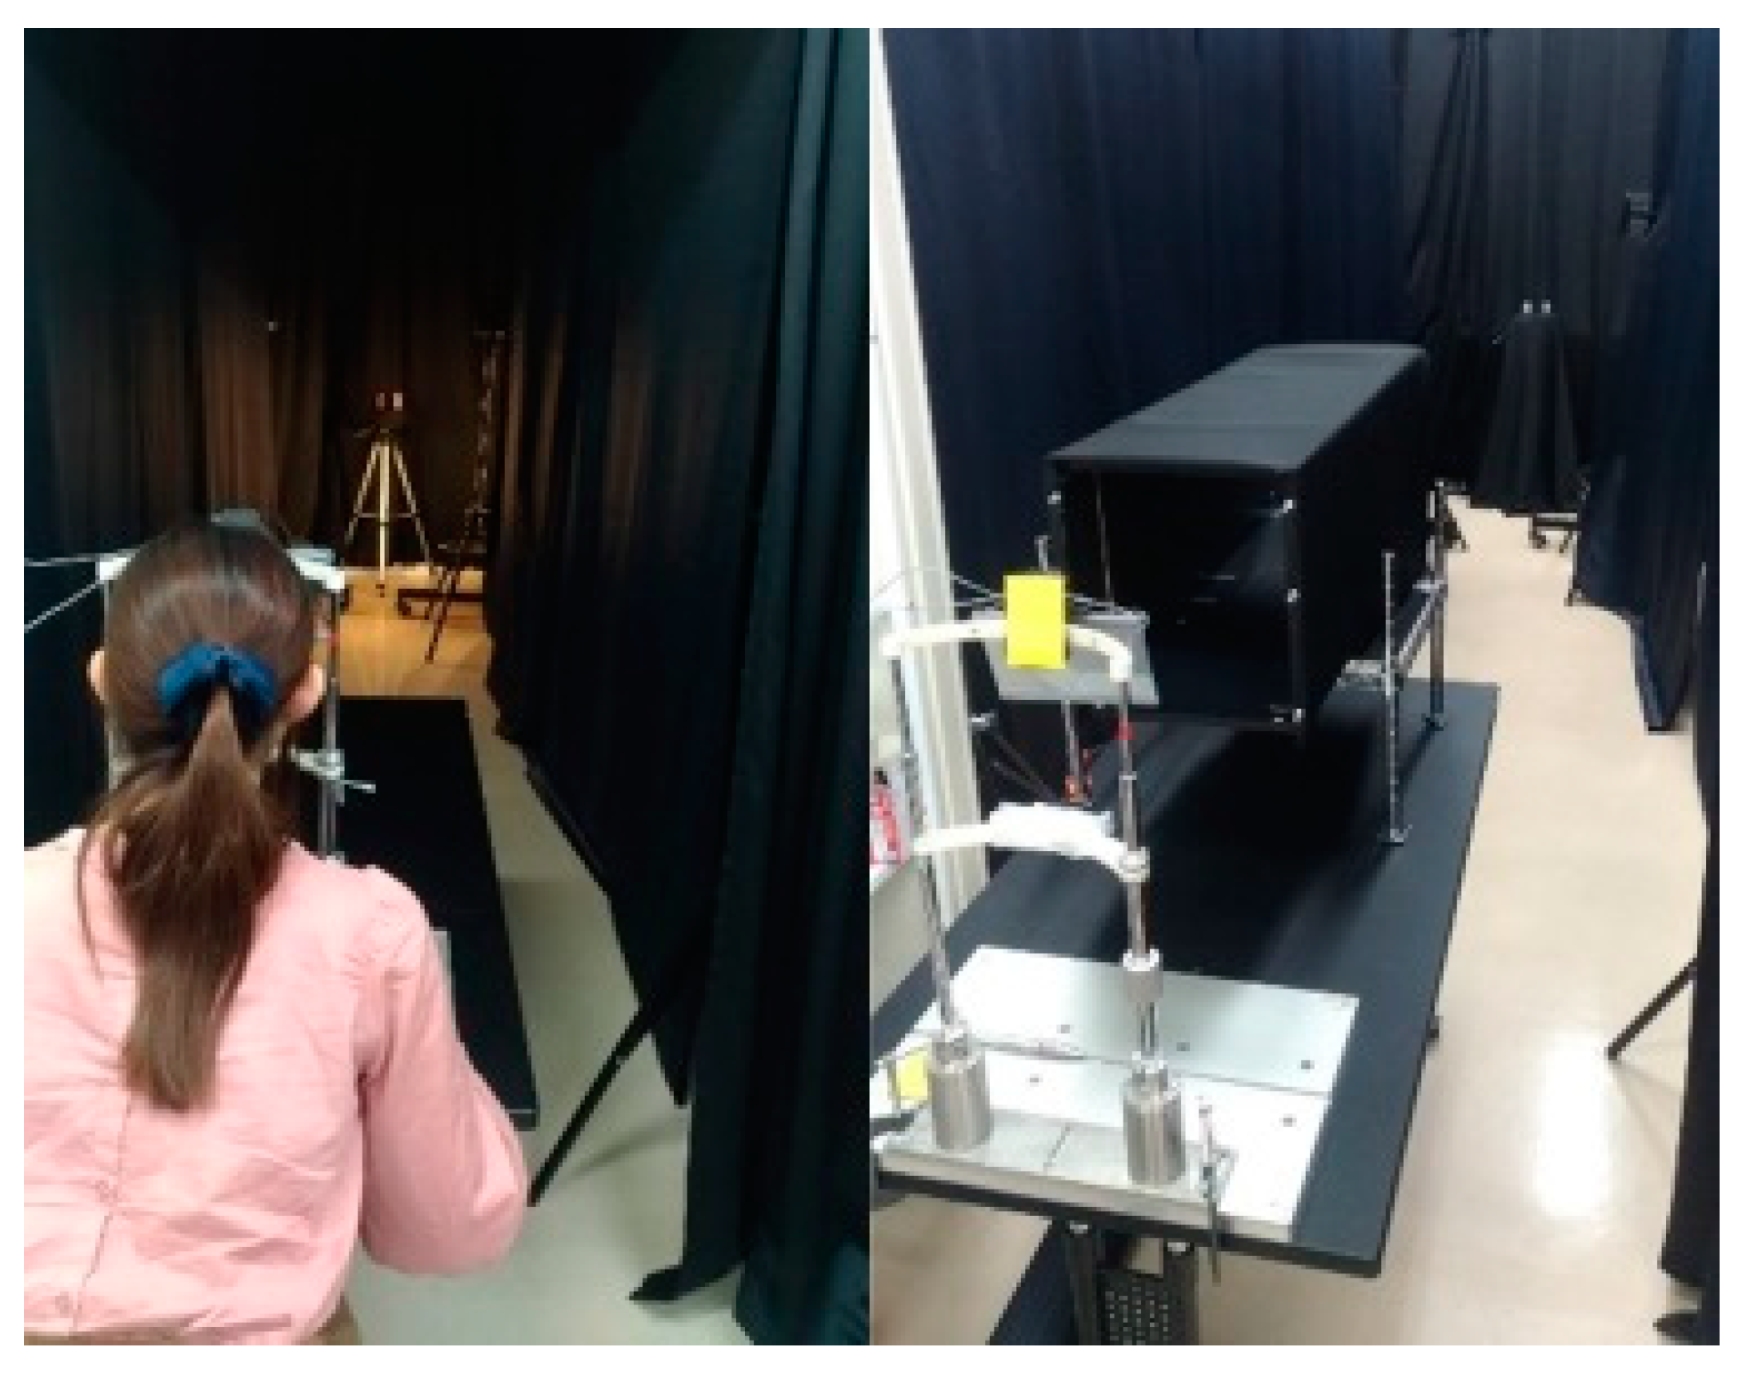
2.2. Experimental System

A black curtain (approximately 2.5 m) was set up around the participants to prevent distraction and uneven distribution of luminance in the visual field. The light source was set up in a dark room, and the illuminance in front of the visual target was set to 300 lx. This study assumed sunset conditions in Japan, and the study environment is shown in Figure 1 and Figure 2 below.
The light source was an SFX-502 (Panasonic, Osaka, Japan), which is a dimmable light emitting diode with a warm white. The color temperature was approximately 2700 K. Two samples were placed 5 m away from the line of sight, and two light sources were placed in front of the samples. The light sources were placed at 45° angles to the left and right of a straight line connecting the line of sight to the sample and set at 5 m distances to standardize the spatial frequency of the samples.

2.3. Experimental Sample
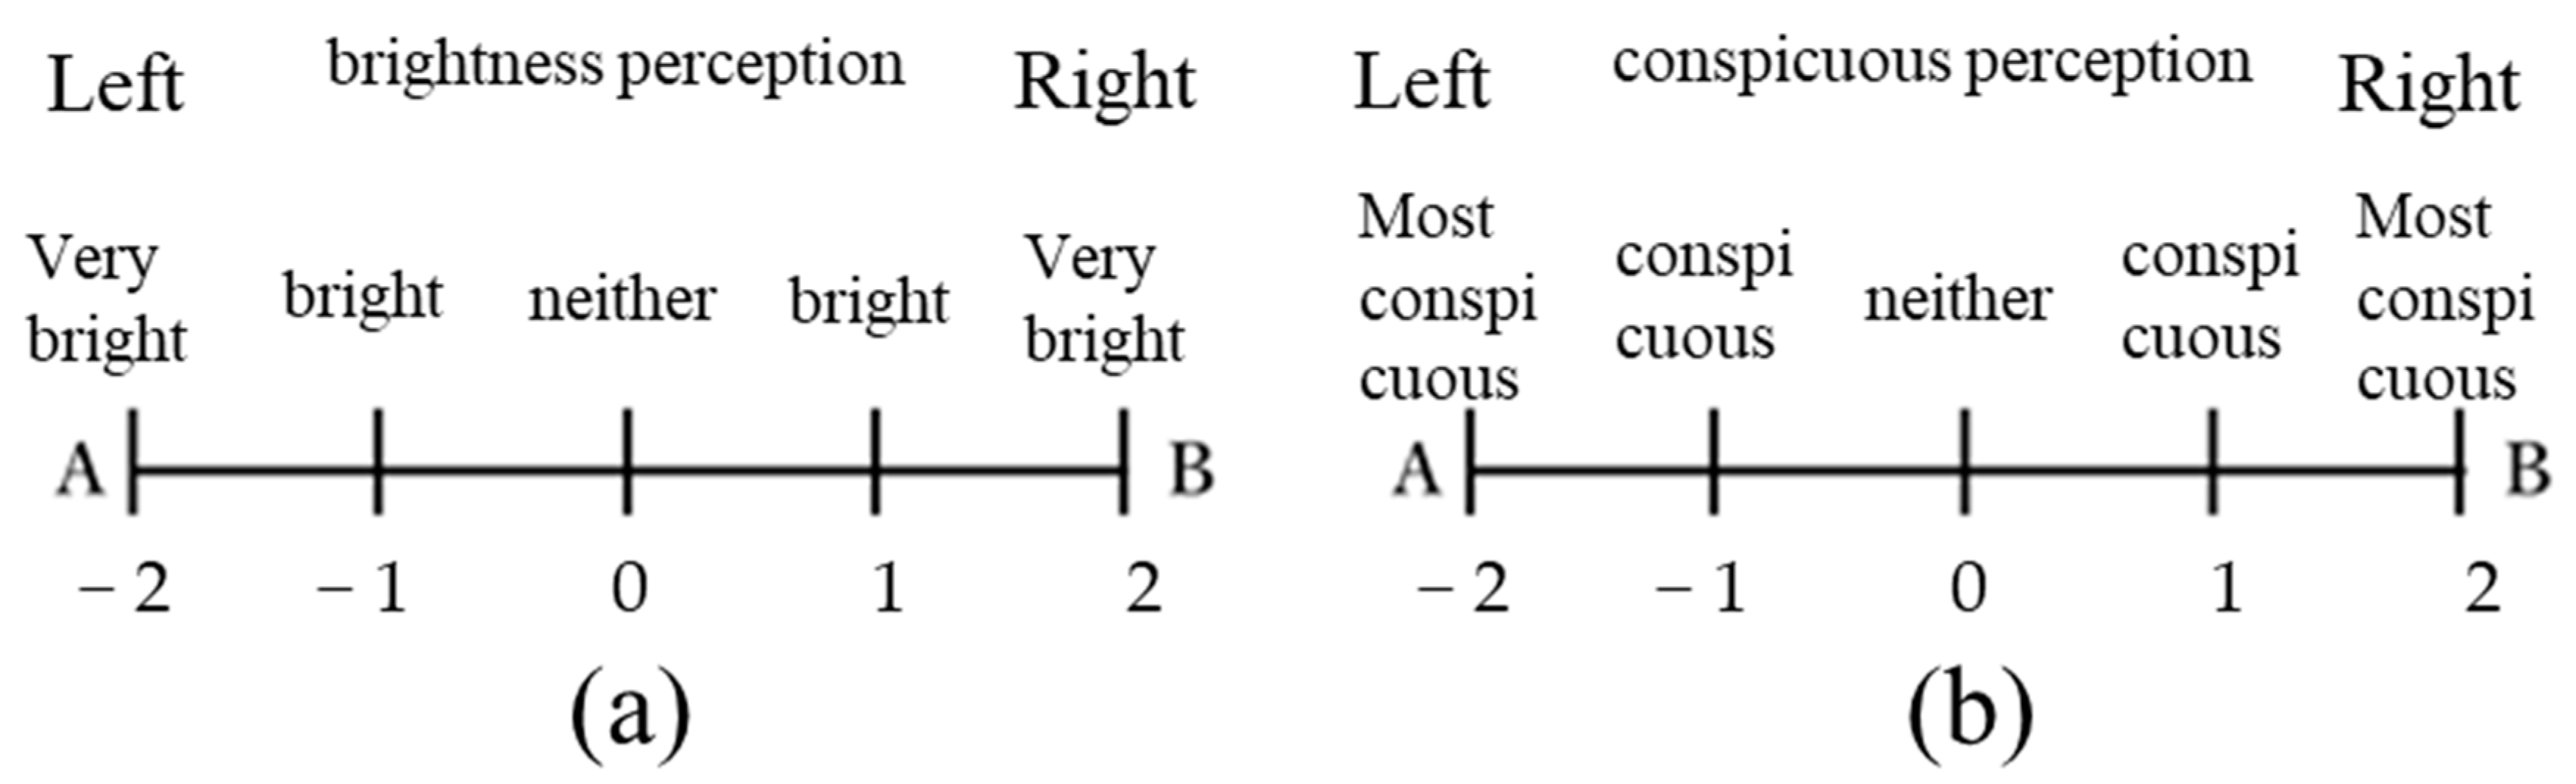
The samples used in this study were made of 100% polyester fabric, manufactured by Sakai Ovex Co., Ltd. (Fukui-City, Japan). These were a combination of yellow (x = 0.445, y = 0.497, β = 0.49) and black (x = 0.314, y = 0.326, β = 0.02) colors, which are used to warn against potential hazards [10].
A polyvinyl chloride pipe 70 mm in height × 25 mm in diameter was covered by the samples. There were 29 samples in total. Spatial frequencies were evaluated in six different checkerboards and stripes of 2.5, 5.0, 7.5, 10.0, 12.5, and 15.0 cycles per degree (cpd), respectively. The color ratio of yellow was evaluated as 0%, 25%, 50%, 75%, and 100%. The angles were evaluated at 180°, 15°, 30°, 45°, 60°, 75°, 90°, 105°, 120°, 135°, 150°, and 165° for a total of 12 types. A total of 142 combinations (5 different color ratio combinations, 12 different spatial frequency combinations, and 12 different stripe angle combinations) of these patterns were compared (Figure 3).

2.4. Procedure

The participant was seated, and the head position was fixed using a chinrest and forehead rest. A shading cylinder was placed in front of the participant with a 4° field of view. Next, a liquid crystal shutter film (Koyo Co., Singapore) was placed in front of the eyes, and a control signal generator AWG10K (Elmos Co., Ltd., Aichi, Japan) and a semiconductor relay AC100SSR (Asakusa Giken Co., Ltd., Tokyo, Japan) were connected to the PC and software. The signal was controlled by using a Ver. 1.1 (Elmos Co., Ltd.). As shown in Figure 4, the parallel transmittance was 74% when the liquid crystal shutter was opened and 5% when it was closed.
This principle can instantly change from an impermeable vision to a transparent vision by applying a voltage. Impermeable to transparent vision is approximately 1/1000 s, and transparent to impermeable vision is approximately 1/100 s. The sample viewing time was set at 0.5 s. This time is based on the amount of time a vehicle driving at 50 km/h can recognize a person 50 m away, brake suddenly, and stop approximately 10 m in front of it. Visual acuity and refraction measurements were performed at approximately 500 lx, basic data were acquired, and visibility was evaluated for brightness under sunset conditions.
To assess brightness, two samples were randomly presented to the front of the research participants, left and right. Then, as shown in Figure 5, the sample on the left or right side was marked with a circle to indicate which sample was brighter.
The respondents were asked to indicate the degree of brightness of the samples as “very bright” or “somewhat bright.” If the left and right samples appeared to be equally bright or it was impossible to determine which was brighter, the participants were asked to choose “neither.” The visibility of the samples was assessed using the same method.
As mentioned above, the time at which the two samples can be viewed is approximately 0.5 s when the light is transmitted, but during the evaluation, there was plenty of time.

2.5. Statistical Analysis
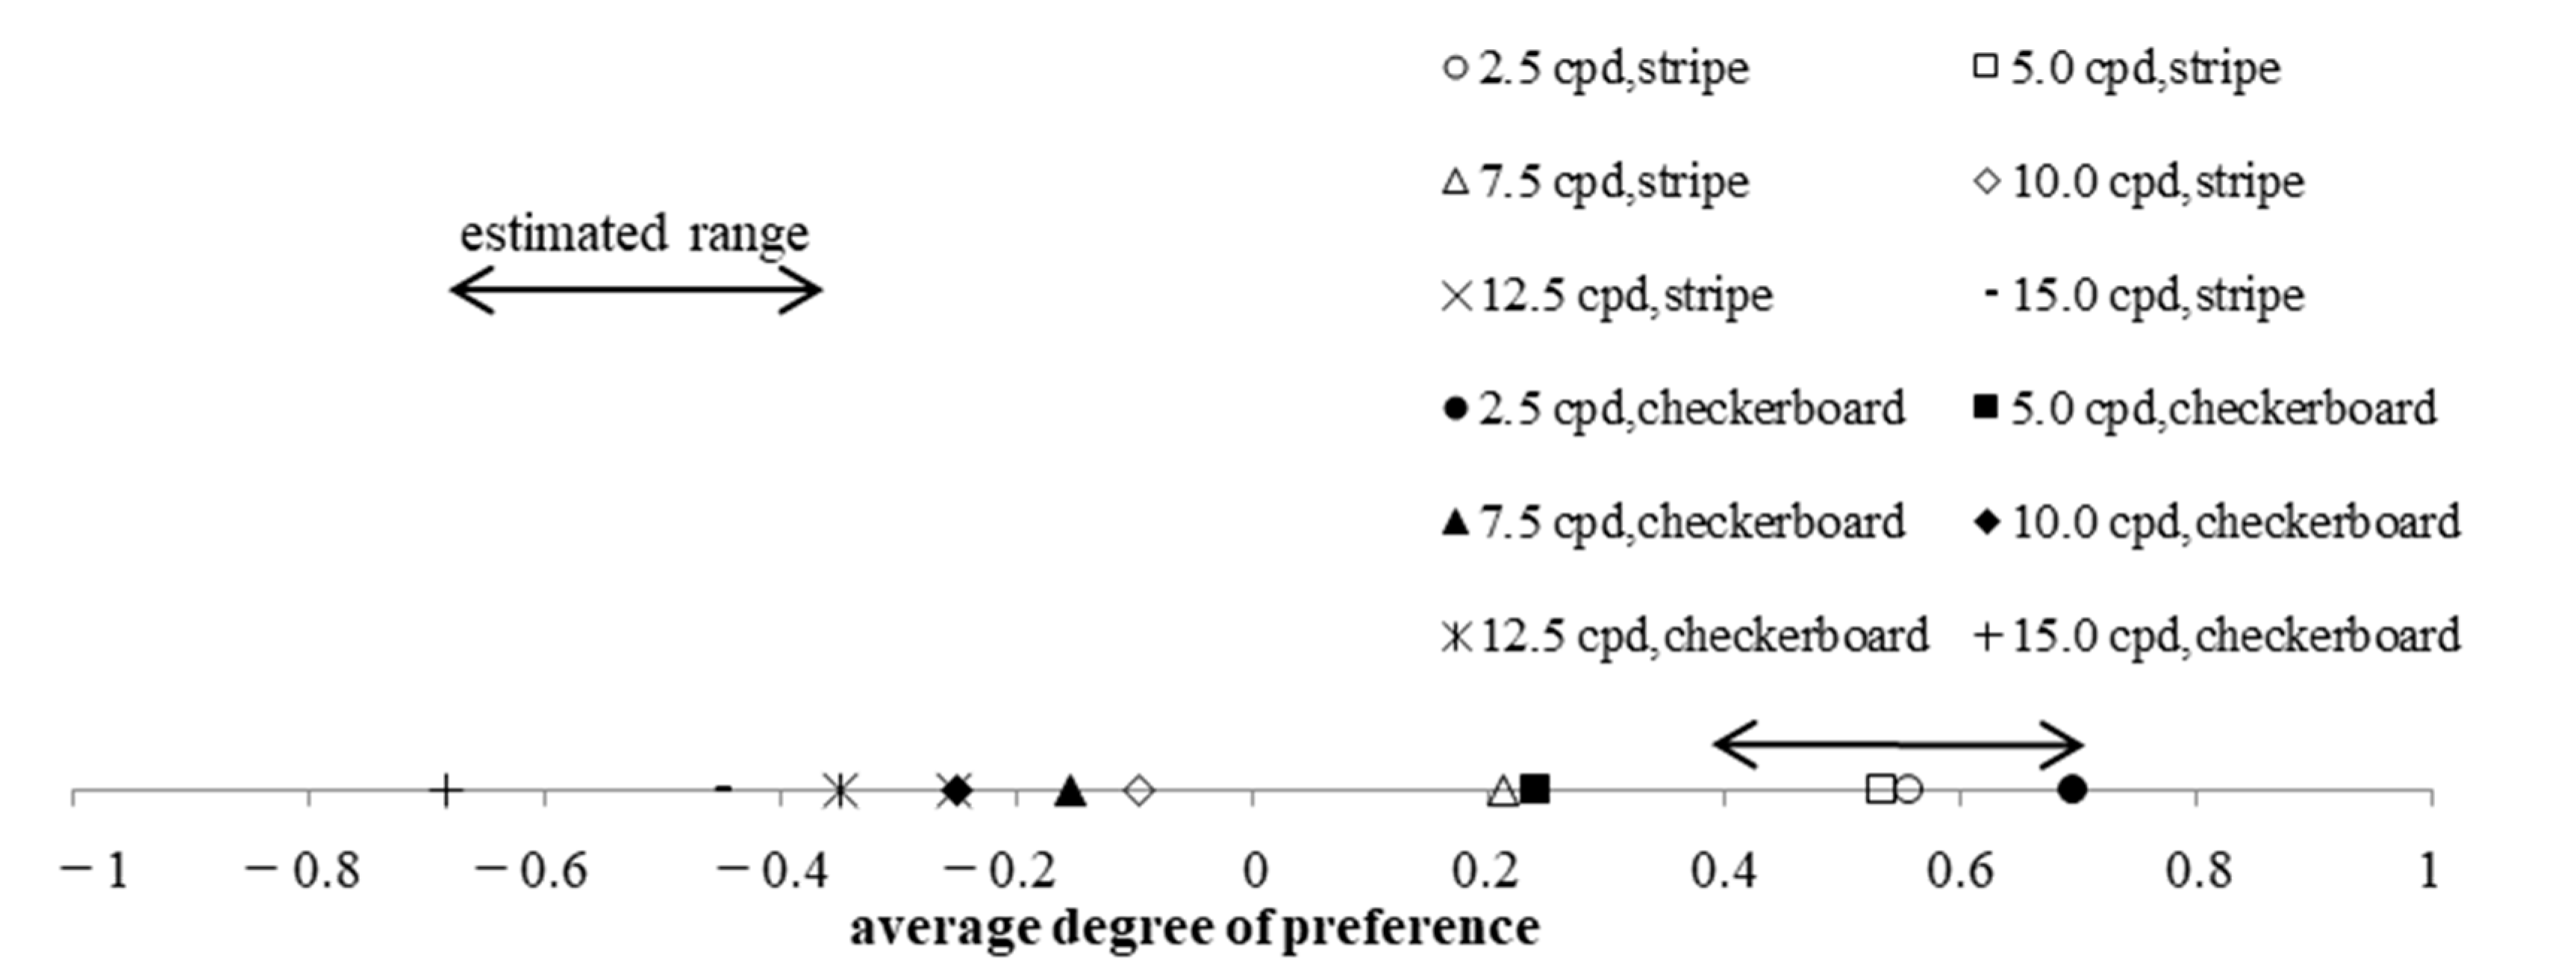
Statistical analysis was performed using the statistical sensory evaluation method, Scheffé’s (Nakaya) paired comparison method. This method is a grading method in which any two objects are taken out and compared one-to-one, and the results of all comparisons are combined for evaluation. Excel 2016 (Microsoft Co., Albuquerque, NM, USA) and BellCurve for Excel (Social Survey Research Information Co., Ltd., Tokyo, Japan) were used to calculate the analysis of variance table, average degree of preference, difference in the average degree of preference, and the analysis of the scale graph and estimated range of the sample’s average degree of preference on a number line. The estimated range in this scale graph was interpreted as significantly different if the samples were further apart from each other. The level of significance was set at p < 0.05.

3. Results

Spatial frequency conspicuity of the stripes and the checkerboard showed that the 5.0 cpd stripes were the most conspicuous. Expressed on the scale graph, a checkerboard of 2.5 cpd and stripes of 2.5 and 5.0 cpd were included within the estimated range, and there was no difference in the conspicuity of the three (Figure 6). Other samples that are outside the estimated range are significantly different. (F(11,20) = 33.85, p < 0.001).
Spatial frequency brightness perception of the stripes and checkerboard showed that the checkerboard at 2.5 cpd was the brightest. Expressed on a scale graph, stripes of 5.0 and 2.5 cpd and a checkerboard of 2.5 cpd were estimated. It was included within the width, and like conspicuousness, there was no difference in the top three brightness sensations (Figure 7). Other samples that are outside the estimated range are significantly different. (F(11,20) = 48.61, p < 0.001).
The yellow color ratio of 50% was the most conspicuous in terms of color ratio, and the yellow color ratio of 0% was the least conspicuous. Expressed on the scale graph, the color ratios of 75% and 50% of the yellow color were included within the estimated range, and there was no difference in the conspicuity of the two colors (Figure 8). Other samples that are outside the estimated range are significantly different. (F(4,20) = 19.28, p < 0.001).
The yellow color ratio of 100% was the brightest in terms of brightness perception, and the yellow color ratio of 0% was the least bright. Expressed on the scale graph, the color ratios of 75% and 100% of the yellow color were included within the estimated range, and there was no difference between the two brightness values (Figure 9). Other samples that are outside the estimated range are significantly different. (F(4,20) = 26.74, p < 0.001).
The conspicuousness in terms of angles was most noticeable at 165° and least noticeable at 90°. Expressed on the scale graph, 165°, 150°, 30°, 135°, 45°, and 60° were within the estimated range, and therefore, no differences were found (Figure 10). Other samples that are outside the estimated range are significantly different. (F(11,20) = 34.08, p < 0.001).
Regarding the brightness in terms of angles, 165° appeared to be the brightest; however, 180°, 120°, 30°, 45°, 105°, 15°, 150°, 90°, 75°, 60°, and 165° were within the estimated range (Figure 11). Although there is a significant difference between several other samples within the estimated range, including 165 degrees, and 135 degrees outside the range, it is unlikely that the change in angle had a significant effect on the perception of brightness (F(11,20) = 33.56, p < 0.001).

4. Discussion

The main purpose of this research was to investigate visibility in terms of spatial frequency characteristics, color ratios, and stripe angles in order to create high-visibility clothing for general users. The final goal was to create a standard for high-visibility clothing and to spread it among the general public, as it is necessary to use colors and designs that are preferred by general users.

4.1. Spatial Frequency

In terms of spatial frequency, the stripe pattern of 5.0 cpd had the highest visibility, considering the average degree of preference for conspicuousness and brightness. These results are consistent with previous reports of spatial frequency characteristics using grating patterns and are almost equivalent to the peak sensitivity of spatial frequency in humans, between 3.0 and 5.0 cpd [11]. Both stripes and checkerboard patterns are common in clothing designs, but we found that stripes were slightly more visible in terms of visibility points of view.

4.2. Color Ratio

In terms of the color ratio, the higher the yellow ratio, the brighter was the result in terms of preference. This is consistent with Ricco’s Law, which states that the sense of brightness is proportional to the product of the color illuminating the retina and the intensity of the light; therefore, it is thought that objects with a higher luminance are brighter and more visible. The sense of brightness of the pattern was the same for stripes and checkerboards. In addition, combining them with black color created a contrast and made them more conspicuous, which may have improved their visibility. Therefore, considering the average degree of preference for conspicuousness and brightness, a color ratio of 75% resulted in the highest visibility.

4.3. Angle of Stripes

In terms of the angle of the stripes, visibility was higher in the oblique direction than in the horizontal and vertical directions, and among the oblique directions, 165° had the highest visibility. The other oblique directions, 150°, 30°, 135°, 45°, 60°, and 15°, had similar visibility, and the difference between 180° and 90° was obvious. In the natural world, most of the things we see are horizontal or vertical, and we may feel uncomfortable with things that are tilted; therefore, we thought that visibility in the oblique direction has increased.
In this study, we investigated the effects of two colors, yellow and black, on clothing visibility. We found that the two colors, yellow and black, had the highest visibility when placed in a diagonal 165-degree stripe pattern, with a spatial frequency of 5.0. This study provides information pertaining to visibility for the study of base standards that may be considered for clothing and provides a first step in the research concerning this study. When creating high visibility clothing, the most important consideration is to ensure that the driver can see enough to know that a human is in his view. For example, even if the striped pattern, which was most visible in this study, is reproduced on a vest or pants as in the sample, to the driver, it may appear as a road sign or a roadway bollard, and it is not certain that the driver will recognize that a human is wearing the clothing. Field-based studies have reported that pedestrians were more easily recognized when made to wear black clothing with retroreflective materials at the wrist, ankle, elbow, and knee joints [12]. This was because the biological motion of the pedestrians became more pronounced, and they were more accurately recognized as humans. It is not enough to randomly put retroreflective materials on people as a brighter emphasis does not always directly translate into recognition as human [13].
Another factor that should probably be considered is the relative speed of the driver to that of the pedestrian. In a real-world scenario, both the driver and pedestrian move at different speeds in the same or different directions. It is difficult to ascertain if this affects the parameters ensuring maximum visibility of the pattern. However, since the relationship between perceived motion and spatial frequency is well reported [14,15], relative motion and velocity should be considered for more solid evidence. Nonetheless, it is difficult to consider every variable; thus, the limitations of this study should be considered and clarified.
To our knowledge, no previous studies have examined high visibility clothing for the general public, but one study has assessed field-based high visibility clothing in fluorescent colors for road-workers [16], reporting that distance drivers observed no difference in visibility between road workers in fluorescent yellow-green and fluorescent red-orange colors. This is because both fluorescent colors are more luminous than general colors, and the brightness effect due to luminance is considered to play a significant role in visibility. Since no study has used general colors that are not fluorescent, the next step would be to study the difference in visibility using general colors that general people prefer, and whether general colors have the same visibility as fluorescent colors, based on the results of this study. Finally, we would like to evaluate the visibility of pedestrians wearing various colored clothes, and to thus devise and disseminate a standard for high visibility clothes.

Supplementary Materials

The following are available online at https://www.mdpi.com/article/10.3390/app11167229/s1, Figure S1: Number of injured pedestrians by age group in 2019 by Japan’s National Police Agency. Figure S2: Number of elementary and junior high school students injured in traffic accidents in 2019 by Japan’s National Police Agency.

Author Contributions

Conceptualization, T.K., C.T., H.T., H.K., T.H. (Toshihiro Hirai) and H.S.; methodology, T.K., C.T., H.T., H.K., T.H. (Toshihiro Hirai) and H.S.; validation, T.I. and T.K.; formal analysis, T.I. and T.K.; investigation, T.I. and T.K.; writing—original draft preparation, T.I.; writing—review and editing, T.I., T.K., T.H. (Tomoya Handa) and H.I.; project administration, T.H. (Toshihiro Hirai). All authors have read and agreed to the published version of the manuscript.

Funding

This research was funded by “FY2018 and FY2019 Budget for promotion of strategic international standardization” supported by the Ministry of Economy, Trade and Industry.

Institutional Review Board Statement

This study was approved by the Kitasato University School of Allied Health Sciences Ethics committee (2018-012) and was conducted in accordance with the Declaration of Helsinki guidelines.

Informed Consent Statement

Informed consent was obtained from all subjects involved in the study.

Data Availability Statement

Not applicable.

Acknowledgments

We thank the senior class of 2019 (M.K., R.T., S.N. and T.W.) at Kitasato University School of Allied Health Sciences for their help with this study.

Conflicts of Interest

H.S. are employees of Azearth Corporation.

References

  1. World Health Organisation. Global Status Report on Road Safety. 2018. Available online: https://www.who.int/violence_injury_prevention/road_safety_status/2018/en/ (accessed on 7 July 2021).
  2. Fatal Accident. 2019. Available online: https://www.e-stat.go.jp/stat-search/file-download?statInfId=000031910507&fileKind=2 (accessed on 13 February 2020).
  3. National Police Agency. The White Paper on Police. 2019. Available online: https://www.npa.go.jp/hakusyo/r02/index.html (accessed on 7 July 2021).
  4. High visibility Clothing—Test Methods and Requirements. International Organization for Standardization 20471:2013. Available online: https://www.iso.org/obp/ui/#iso:std:42816:en (accessed on 7 July 2021).
  5. High Visibility Warning Clothing. Japanese Industrial Standards T 8127:2015. Available online: http://kikakurui.com/t8/T8127-2015-01.html (accessed on 7 July 2021).
  6. Blomberg, R.D.; Hale, A.; Preusser, D.F. Experimental evaluation of alternative conspicuity-enhancement techniques for pedestrians and bicyclists. J. Saf. Res. 1986, 17, 1–12. [Google Scholar] [CrossRef]
  7. Tyrrell, R.A.; Wood, J.M.; Chaparro, A.; Carberry, T.P.; Chu, B.; Marszalek, R.P. Seeing pedestrians at night: Visual clutter does not mask biological motion. Accid. Anal. Prev. 2009, 41, 506–512. [Google Scholar] [CrossRef] [PubMed] [Green Version]
  8. Wood, J.M.; Tyrrell, R.A.; Marszalek, R.; Lacherez, P.; Chaparro, A.; Britt, T.W. Using biological motion to enhance the conspicuity of roadway workers. Accid. Anal. Prev. 2011, 43, 1036–1041. [Google Scholar] [CrossRef] [PubMed] [Green Version]
  9. Wood, J.M.; Marszalek, R.; Lacherez, P.; Tyrrell, R.A. Configuring retroreflective markings to enhance the night-time conspicuity of road workers. Accid. Anal. Prev. 2014, 70, 209–214. [Google Scholar] [CrossRef] [PubMed] [Green Version]
  10. Graphical Symbols-Safety Colours and Safety Signs—Part 1: Design Principles for Safety Signs and Safety Markings. Japanese Industrial Standards Z 9101:2018. Available online: http://www.kikakurui.com/z9/Z9101-2018-01.html (accessed on 7 July 2021).
  11. Robson, J.G. Spatial and temporal contrast-sensitivity functions of the visual system. J. Opt. Soc. Am. 1966, 56, 1141–1142. [Google Scholar] [CrossRef]
  12. Black, A.A.; Bui, V.; Henry, E.; Ho, K.; Pham, D.; Tran, T.; Wood, J.M. Using retro-reflective cloth to enhance drivers’ judgment of pedestrian walking direction at night-time. J. Saf. Res. 2021, 77, 196–201. [Google Scholar] [CrossRef] [PubMed]
  13. Tyrrell, R.A.; Wood, J.M.; Owens, D.A.; Borzendowski, S.W.; Sewall, A.S. The conspicuity of pedestrians at night: A review. Clin. Exp. Optom. 2016, 99, 425–434. [Google Scholar] [CrossRef] [PubMed] [Green Version]
  14. Diener, H.C.; Wist, E.R.; Dichgans, J.; Brandt, T. The spatial frequency effect on perceived velocity. Vis. Res. 1976, 16, 169–176. [Google Scholar] [CrossRef]
  15. Smith, A.T.; Edgar, G.K. The influence of spatial frequency on perceived temporal frequency and perceived speed. Vis. Res. 1990, 30, 1467–1474. [Google Scholar] [CrossRef]
  16. Sayer, J.R.; Buonarosa, M.L. The Roles of Garment Design and Scene Complexity in the Daytime Conspicuity of High-Visibility Safety Apparel. J. Saf. Res. 2008, 39, 281–286. [Google Scholar] [CrossRef] [PubMed] [Green Version]
Figure 1. Research environment. Two evaluation samples are placed 5 m away from the participants.
Applsci 11 07229 g001
Figure 2. Experimental scene. The sunset environment is recreated by covering the participants’ surroundings with a blackout curtain.
Applsci 11 07229 g002
Figure 3. Evaluation samples. A total of 29 different patterns.
Applsci 11 07229 g003
Figure 4. Liquid crystal shutter. Electronically controlled to open (a) and close (b).
Applsci 11 07229 g004
Figure 5. Evaluation items (English version). (a) Brightness evaluation sheet. (b) Conspicuity evaluation sheet. Compare the two samples and circle the item for brightness and conspicuity.
Applsci 11 07229 g005
Figure 6. In terms of spatial frequency conspicuity between the stripes and checkerboard patterns, the 5.0 cpd stripes were the most conspicuous results. There was no significant difference between the 5.0 cpd stripes and the 2.5 cpd stripes, and the 2.5 cpd checkerboard pattern.
Applsci 11 07229 g006
Figure 7. In terms of spatial frequency brightness perception between the stripes and the checkerboard pattern, the 2.5 cpd checkerboard pattern was the brightest result. There was no significant difference between the 5.0 cpd stripes and the 2.5 cpd stripes, and the 2.5 cpd checkerboard pattern.
Applsci 11 07229 g007
Figure 8. In terms of yellow color ratio conspicuity, the 50% color ratio was the most conspicuous result. There was no significant difference between the 50% and 75% yellow color ratios.
Applsci 11 07229 g008
Figure 9. In terms of yellow color ratio brightness perception, the color ratio of 100% was the brightest result. There was no significant difference between the 100% and 75% yellow color ratios.
Applsci 11 07229 g009
Figure 10. In terms of stripe angle conspicuity, angle 165° was the most conspicuous result. There was no significant difference in stripe angles of 165°, 150°, 30°, 135°, 45°, and 60°.
Applsci 11 07229 g010
Figure 11. In terms of stripe angle brightness perception, angle 165° was the brightest result. There was no significant difference in stripe angles of 165°, 60°, 75°, 90°, 150°, 15°, 105°, 45°, 30°, 120°, and 180°.
Applsci 11 07229 g011
Publisher’s Note: MDPI stays neutral with regard to jurisdictional claims in published maps and institutional affiliations.

