1. Introduction
After wheat, maize (
Zea mays L.) is the second-most-produced crop within the European Union [
1]. As for the Republic of Croatia, during the last decade (2010–2019), the average maize yield was 6.7 t ha
−1 [
2], where the lowest yield was achieved in dry years (2011 = 5.7 t ha
−1 and 2012 = 5.3 t ha
−1), while the highest yield was obtained in wet growing seasons in 2010 (7 t ha
−1) and 2014 (8.1 t ha
−1). It is important to emphasize that in the years with the highest maize yield, the amount of rainfall during the growing season was 68.4% (2010) and 42.2% (2014) higher than the long-term average (LTA, 1961–1990 = 368 mm). In the remaining years of the mentioned decade, the rainfall deficit was in the range from −33% (2011) to −13% (2017), whereby the lack of rainfall had to be compensated for using irrigation. Despite the considerable need, in the Republic of Croatia, only 1570 ha of agricultural land sown with maize is irrigated [
3]. This data refers to the 2013–2017 period in Croatia, during which, maize was sown on 260818 ha, which indicates insufficient implementation of this agronomic practice. The analysis of irrigated maize production on a global scale was conducted by Zhang et al. [
4]. An interesting study based on 162 publication results showed that maize grain yield (GY) was increased by 30.35% (7357 kg ha
−1 to 9512 kg ha
−1) on average. In addition, the authors stated that the water productivity in irrigated maize production was increased by 9.91% (19.1 to 20.5 kg ha
−1 mm
−1) and emphasize that these increases in maize yield and water productivity varied depending on the seasonal irrigation amounts, precipitation levels, annual average temperature, nitrogen application, soil organic matter, and bulk density.
Another indicator of changing weather patterns is rising air temperature. Previous studies [
5,
6,
7] have emphasized the negative impact of increasing air temperature on maize yields in different parts of the world. As far as Croatia is concerned, over the past decade, the deviation in air temperature from the LTA has been in the range of 0.7 °C (2014) to 2.57 °C (2018). These data refer to the growing period of summer crops, where the analysis of maize yield concerning drought and high air temperatures showed a greater association between maize yield and rainfall amount (drought) than high air temperatures. This statement is in agreement with Basso and Ritchie [
8], who claimed that the major and consistent cause of rain-fed maize yield reductions in the humid and sub-humid US corn belt is the prolonged absence of significant rainfall and the resulting soil water deficit, i.e., not excessive air temperatures. Thus, a study conducted by Bolaños and Edmeades [
9] emphasized the importance of air temperatures on maize GY and yield formation. The authors stated that heat stress results in a significant reduction in GY, which is associated with a reduction in kernel size. Furthermore, a follow-up study [
10] was conducted on maize adaptation to heat treatment in a greenhouse experiment. The authors claimed that warmer temperatures accelerate the development rate, resulting in shorter vegetative and reproductive phases and that the maize GY is reduced under heat stress, mainly via pollen viability, which in turn, determines the kernel number. Further, the negative impact of waterlogging should not be neglected. Waterlogging comes as a result of heavy rainfall or extreme weather events, which are becoming more pronounced due to climate change. The stress caused by waterlogging inhibits crop growth because the water content in the soil is above the field capacity (FC); therefore, the air is expelled and, consequently, all pores are filled with water, leading to a lack of oxygen (hypoxia). If this condition lasts for a long time, the crop will be destroyed. There have been numerous studies [
11,
12] that investigated the negative impact of waterlogging on the yield of maize, especially during the early seedling stage to the tasselling stage [
13], with yield reductions of 25–30% [
14]. Given the increasing evidence of climate change in terms of the lack of or excessive rainfall, as well as the poor distribution and high air temperatures, substantial increases in maize yields will require developing cultivars with greater water use efficiency, which is a trait that has not been a priority for breeders in the past [
15].
Water (irrigation) and nitrogen (fertilization) have long been recognized as two major limiting factors for maize production. Following that, the results of numerous studies indicate a decrease in maize yield due to a water deficit [
16,
17,
18,
19,
20] and an increase in maize yield with an increase in the N rate [
21,
22,
23]. The yield reduction of maize grain is mostly proportional to the severity of the drought stress, but it should be noted that research on the impact of irrigation on maize yield gives different results and conclusions. For example, some study results indicate that the highest maize GYs are achieved after treatments with the highest net irrigation [
24,
25,
26,
27], while some of the studies [
28,
29,
30] have confirmed that increasing the amount of water does not directly equate to higher yield results. This is supported by the results of a meta-analysis conducted by Lee et al. [
31]. These authors claimed that maize yield increased linearly with increasing water input with 3% of the variation in yield when the total water input was less than 314 mm, while further water input decreased maize yield with 3% of the variation. As for N fertilization, the same authors claimed that maize yield increases linearly with increasing N input with 12% of the variation in GY when the total N input was less than 250 kg ha
−1, while further N input did not affect the maize yield. In addition to GY, the water deficit also has a negative effect on the quality of maize in terms of the grains’ chemical composition. Several studies confirmed that crude oil, starch, and ash yield are considerably decreased due to water deficit [
32,
33,
34,
35,
36]. This, of course, is of great importance when maize is grown for the food industry and animal feed production, where high grain quality is expected. Previous studies emphasized the importance of the interaction between growing systems (irrigation and fertilization), weather conditions, and soil properties for soil water and nutrient availability, as well as crop yield potential [
37,
38,
39,
40,
41]. An interesting observation was made by Qi et al. [
20]. The authors claimed that the increasing N rate from 200 to 300 kg N ha
−1 resulted in increased maize biomass and GY under a 75–80% FC irrigation treatment, while it had no impact on those under the 45–50% and 60–65% FC treatments. Prior research [
42] suggests that there is an optimal nitrogen application amount that maximizes the effectiveness of irrigation water on increasing GY above rainfed yields. The authors claimed that the optimal N level for maximum productivity varied not only between the irrigation levels but also exhibited interannual variability for the same irrigation level, indicating that these variables are impacted by the climatic conditions. McBratney and Field [
43] and Suchy et al. [
44] claimed that excessive application of N fertilizer has negative effects on crops, greatly reduces N use efficiency (NUE), and causes significant nitrate leaching losses and contamination of groundwater. The main source of nitrate contamination that is associated with groundwater is crop production, i.e., N fertilization [
45] due to the low N fertilization efficiency [
46]. In the European Union (UN), the Nitrate Directive (1991, 91/676/EEC) is the main regulation for reducing the environmental impacts of N fertilizer and for increasing nitrogen use efficiency. According to the regulation, the N target in groundwater is 50 mg NO
3- L
−1. Besides the N fertilizer rate [
47,
48,
49], NO
3 leaching depends on the weather conditions [
50,
51,
52], soil type [
53,
54,
55], and irrigation [
56,
57,
58,
59]. Hence, the objectives of this study were to investigate the effects of irrigation and N fertilizer rate on grain yield (GY) and grain composition in terms of the grain starch content (GSC), grain protein content (GPC), and grain oil content (GOC) of maize hybrids with similar maturity groups during three successive and quite different climatic years with pronounced extreme weather events. Furthermore, the study was conducted to evaluate the impact of the mentioned study factors on soil N accumulation and nitrate leaching to groundwater and to evaluate irrigation water and N fertilizer use efficiency in the mentioned agro-ecological conditions.
2. Materials and Methods
The research site was in Osijek, in the eastern Croatian region of Slavonia (45°32′ N and 18°44′ E, altitude 90 m). The climate is a temperate continental climate (Cfwbx climate class), with a mean annual air temperature of 12 °C and a mean annual precipitation of 650 mm [
60]. The soil at the research site is classified as anthropogenic eutric cambisol (WRB) with a silty clay loamy texture; its main physical and chemical properties are presented in
Table 1 [
61].
Three irrigation rates (a1 = rainfed, a2 = 60–100% of FC, and a3 = 80–100% FC), three N fertilizers rates (b1 = 0 kg N ha
−1, b2 = 100 kg N ha
−1, and b3 = 200 kg N ha
−1), and four maize hybrids (c1 = OSSK596, c2 = OSSK617, c3 = OSSK602, and c4 = OSSK552) were arranged as split–split plots in a randomized complete block design with three replications. The sizes of the basic experimental plots were as follows: a = 235 m
2, b = 78.4 m
2, and c = 19.6 m
2, where the total size of the experimental plot was near 1 ha (
Figure 1).
Each experimental plot had four rows of maize plants added on each side of the plot, which served as protective belts to prevent the study treatments from overlapping. The 3 m wide free space between the plots allowed for the passage of the irrigation system.
Maize crop was irrigated with a traveling sprinkler system with a maximum 30 m watering range. Water for the system was pumped from a 37 m deep well that was located near the experimental plot at a 5–7 L s
−1 flow rate using an electric pump (5.5 kW). Water analysis was done according to the Food and Agricultural Organization (FAO) water quality standards for agriculture [
62]. As presented in
Table 2, there were no chemically derived contaminants, while the Mg
2+ content was slightly higher (5.076 me/L) than the maximum contaminant level (MCL). The sodium adsorption ratio (SAR) was 11 me/L, and the ECw was 0.97 dS/L, which means that water could be used with a slight-to-moderate degree of restriction on use.
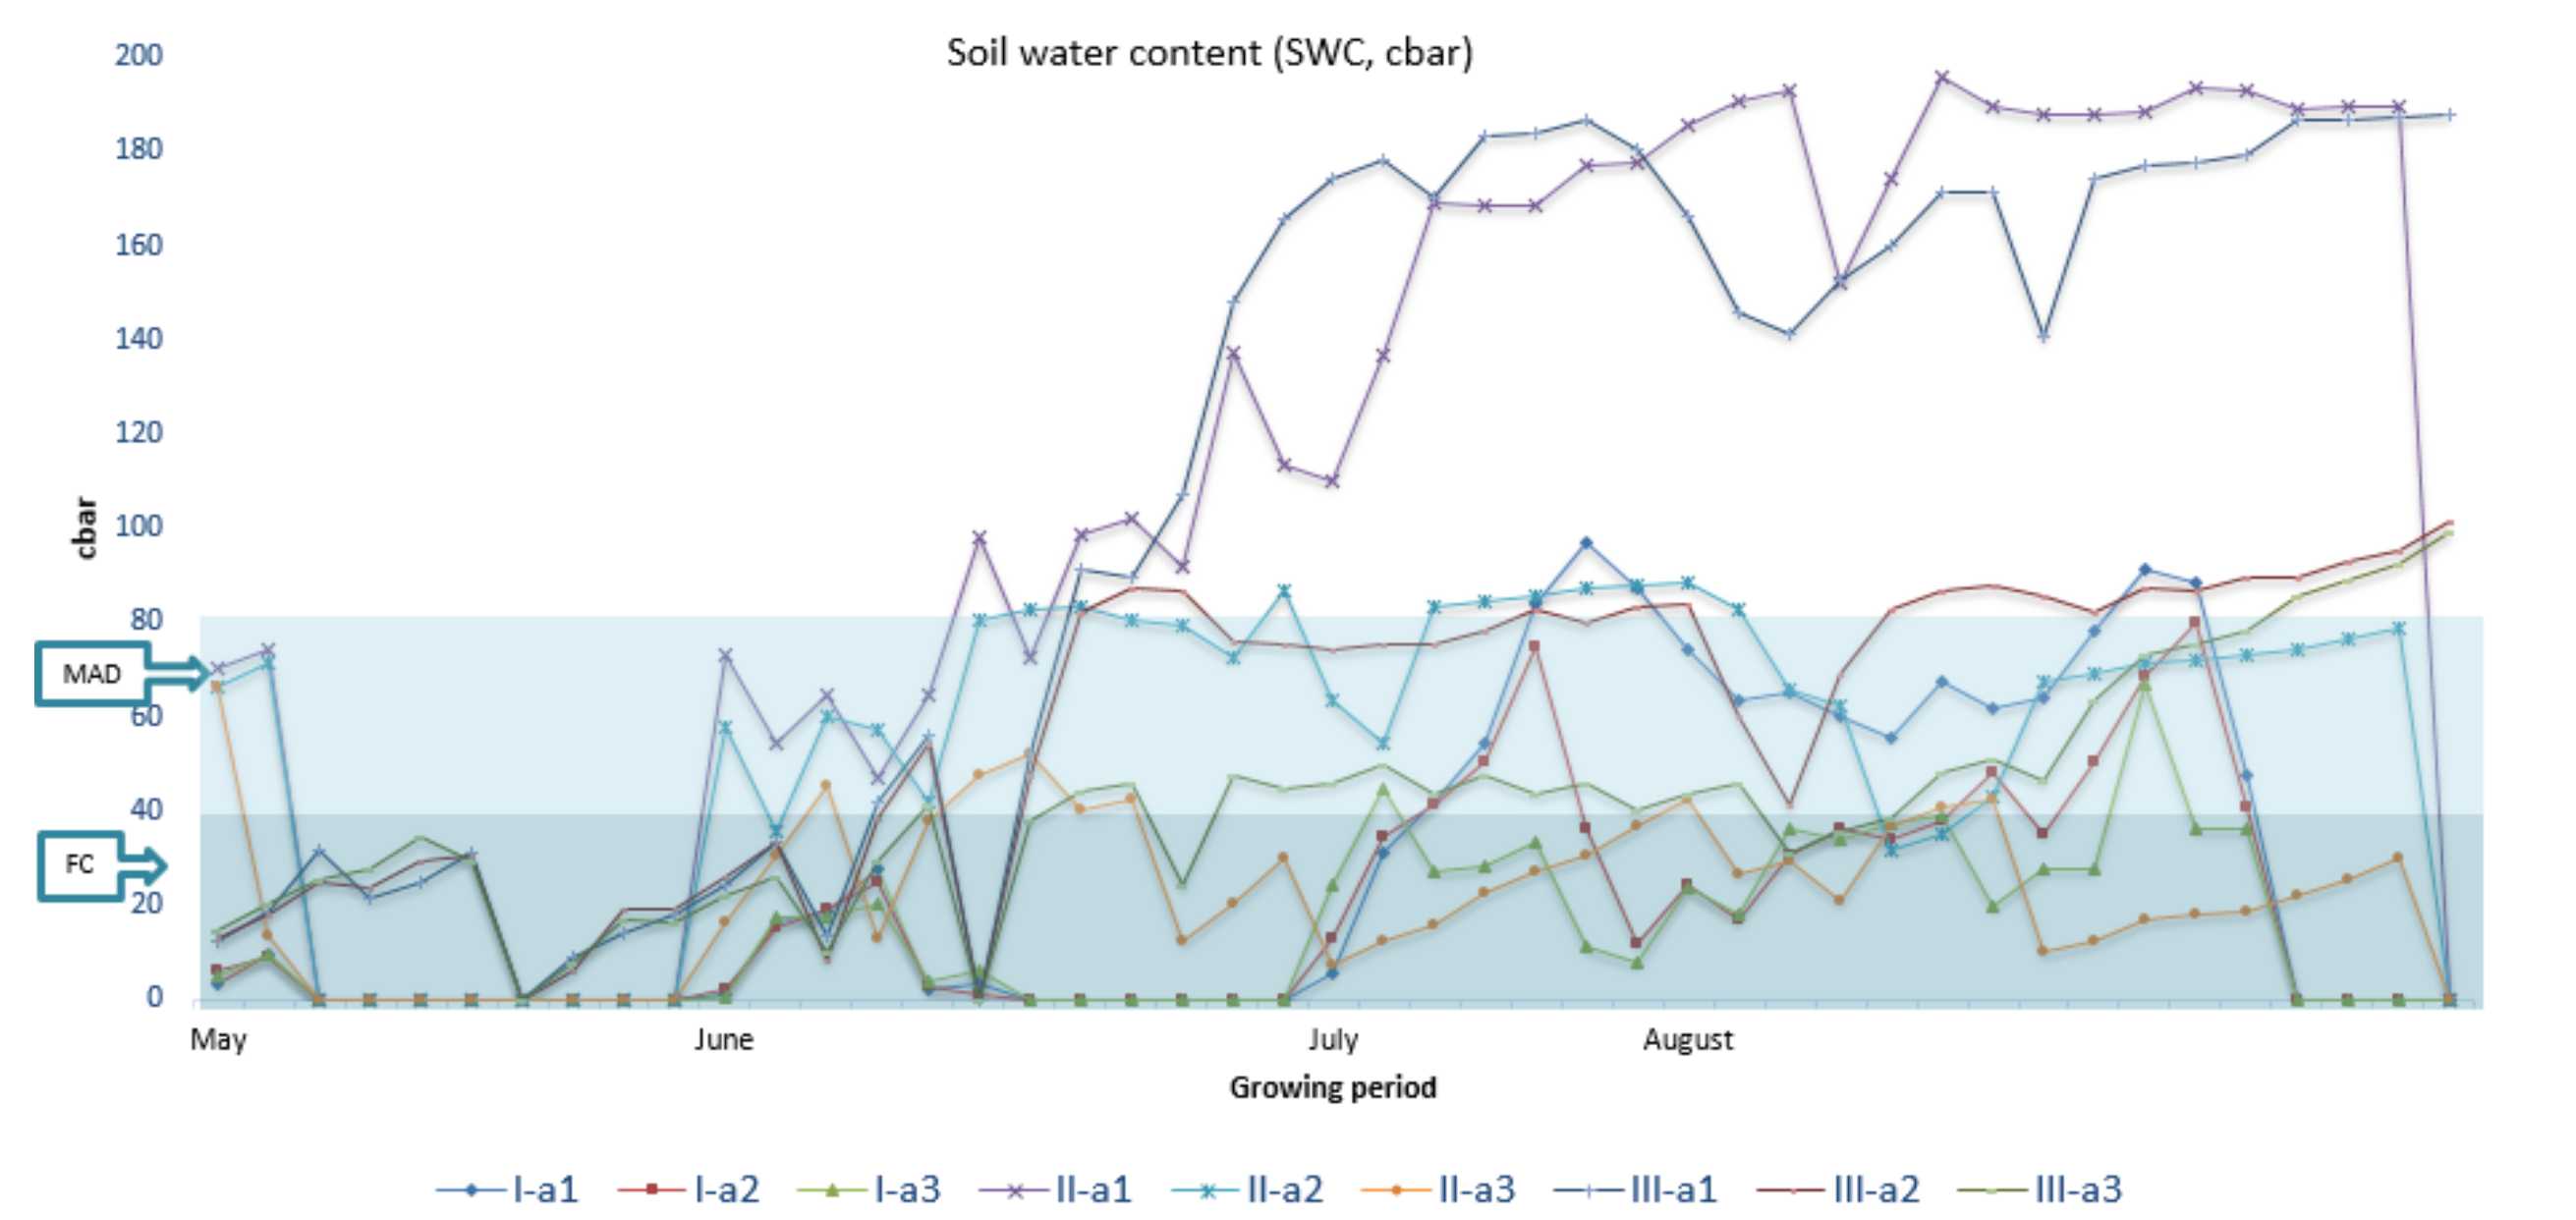
The irrigation time was determined by measuring the soil water content (SWC) with the use of granular matrix sensors (GMSs). Sensors were placed at two depths (15 and 30 cm) in each irrigation treatment and replicate, which means that a total of 18 sensors were placed in the experimental plot. Before the placement in soil, the GMSs were calibrated to the soil in a trial plot by comparing gravimetric measurements and sensor readings. The calibration results are presented in
Table 3. The correlation analysis showed a strong negative relationship between the SWC and GMS readings.
Furthermore, according to the calibration results, the 0–40 cbar GMS range denotes 100% of the FC, while 70–80 cbar denotes the management allowable depletion (MAD). This means that the irrigation time was complete when the GMS readings were 70–80 cbar (60% of FC) for the a2 treatment and 40 cbar (80% of FC) for the a3 treatment. The sensor calibration curve was previously presented by Marković et al. [
29]. The SWC was approximately measured three times per week after irrigation events or a significant amount of rainfall (>5 mm). The irrigation rate on both irrigation treatments was 35 mm, which was calculated using the following model:
where IR is the amount of added water in one irrigation event (mm or L m
2), Bd is the bulk density (g cm
−3), h is the depth of irrigation water penetration (m), FC is the field capacity (%), and RAW denotes the readily available water (as a percentage of FC). The efficiency of irrigation was tested according to Blümling et al. [
63]:
where IWUE stands for the irrigation water use efficiency (kg ha
−1 mm
−1), Yi stands for the GY on irrigated plot (kg), Yr stands for the GY on a rainfed plot (kg), while NIR stands for the net irrigation rate (mm).
The amount and form of N fertilizers applied for each fertilizer treatment during the study period are presented in
Table 4. Basic/autumn and basal application, i.e., pre-sowing (April month) maize fertilization, was done with urea. Two side dressings were performed for the b2 and b3 N fertilizer treatments with the use of calcium ammonium nitrate (CAN) spread by hand around the plants and in between the plant rows. Side dressing fertilizer applications were done during the May/June period.
The efficiency of the N fertilizer rate was tested according to Rehman et al. [
64]:
where FUE stands for the fertilizer use efficiency, Yf stands for the GY (kg) from the fertilized treatment, Yc stands for the GY (kg) from the control (unfertilized) treatment, and FR stands for the N fertilizer rate (kg).
Four maize hybrids with similar maturity groups were used in the study: c1—OSSK596, c2—OSSK617, c3—OSSK602, and c4—OSSK552. Maize crop was sown on 6 May, 3 May, and 27 April with a hand planter. The planting space between the maize rows was 0.70 m, with a 0.25 m inter-row spacing. Maize was planted in two rows, 10 m long per experimental plot, with a total plant density of 58333 plants/ha. The sowing was preceded by soil tillage with a rotary harrow on 19 April in all three years of the study. As for the maize crop protection, weed control was done using Radazin T50 at 2 L ha−1 and Dual Gold 960 EC at 1.4 L ha−1. The maize crop was harvested at a mature stage on 12 (2010), 3 (2011), and 5 November (2012). Grain samples were collected at harvest time from each experimental plot and taken to a laboratory for grain composition analysis. Measurement of the grain moisture was done in the field immediately after the grain samples were collected. The GY was determined for each experimental plot (study treatment) and standardized to a 14% grain moisture content. The GSC (%), GPC (%), and GOC (%) contents were analyzed using a spectrophotometer (Infratec 12141, Foss Tecator).
The climatological characteristics classification for each study year was done according to the analysis of the distribution of the climatic elements, probability percentiles, and estimation of the extremes made by the Croatian Meteorological and Hydrological Service [
65]. Then, climate data were collected from a weather station located near the experimental field—the amount of rainfall (mm), air temperature (°C) and humidity (%), wind speed (km day
−1), and radiation (MJ m
2 d
−1)—and were used for the calculation of crop water requirements (CWR) with the use of the CROPWAT 8.0 computer model. Effective rainfall was determined with the use of the USDA method, which is integrated into the CROPWAT 8.0 model. Monthly values of rainfall and average monthly air temperatures were compared to the long-term averages (LTA, 1981–2010) to highlight deviations. The Penman–Monteith methodology [
66] was applied to calculate the reference evapotranspiration (ETo), while the crop evapotranspiration (ETc) was determined by multiplying the ETo and single crop coefficient (kc), which integrates differences in the soil evaporation rate and crop transpiration rate between the crop and the grass reference surface and was taken from Allen et al. [
66]. An observation well that was located near the experimental field was used for monitoring the groundwater level two times per week on average.
Soil samples were collected in springtime, before pre-sowing fertilization, and in autumn after the maize harvesting (before autumn fertilization). Soil samples were collected from five points of each irrigation and N fertilizers subplot in the 20 cm horizontal direction and 0–30 cm vertically downward. In total, 180 soil samples (5 soil samples from each irrigation (3) and N fertilizers (3) treatment, two times per growing season (pre-sowing and after harvesting)) were collected during the three-year study and analyzed for the total N content. The total N content was determined using the dry combustion method (RM: ISE 910, ISE 882, and ISE 955, Wepal, recovery <5%). The accuracy of the analyses was controlled by repeating the analysis of the samples (3 times) and was satisfactory (RSD < 10%). Soil samples were taken from each irrigation and N fertilization plot to study the impact of the study factors on the soil N dynamics.
Eighteen Ebermayer lysimeters (80 × 80 × 10 cm) were used for collecting drainage water. An Ebermayer lysimeter is an in situ type of lysimeter with no side walls separating a definitive soil block from the adjacent soil. The lysimeters were set up 0.8 m deep in undisturbed soil for each irrigation (3) and N fertilizer (3) treatment and three replicates. Drainage water was pumped out to open ditches, collected with plastic bottles, and taken to the laboratory for the analysis of the NO3− concentration during the first and third (last) year of the study due to the maize–soybean crop rotation. Drainage water was collected three times per growing season as mixed samples of the three replicates per irrigation and fertilizer treatment. Leached nitrate was calculated from the nitrate concentration and the volume of drainage water.
An analysis of variance (ANOVA) was conducted using the general linear model (GLM) procedure in SAS software (version 8.0, SAS Institute, Cary, NC, USA, 2013). The main effects of irrigation, N fertilizer level, maize hybrid, and year rate on maize GY, GPC, GOC, and GSC were analyzed. The results were analyzed using SAS software (SAS Institute, Cary, NC, USA). A protected least significant difference (LSD) procedure was used to separate the differences at probability levels of 0.05 and 0.01. Linear correlations (MS Excel) between the tested parameters were evaluated using t-tests.
4. Discussion
The impact of irrigation on the GY depended on the weather conditions, i.e., in an extremely wet year, the maize GY from the a3 irrigation treatment was significantly (
p < 0.01) lower compared to those from the rainfed (a1) and a2 irrigation treatments (
Figure 6 and
Figure 7), which was the complete opposite of the remaining two years of the study and the results of many previously published studies, which reported an increase in yield with increasing irrigation rate [
67,
68,
69]. Given that the leachate level in the extremely rainy year exceeded the MAC only in the springtime, it can be assumed that the decrease in yield from the a3 irrigation treatment was the result of the excessive amount of SWC due to the irrigation water. The upper soil layer in which the sensors were placed (<30 cm) was dry for a short time (
Figure 2, end of July and beginning of August), because of which, the GMS readings indicated that the SWC in the upper soil layer was below the FC (
Figure 4). As previously presented by Marković et al. [
29], irrigation water decreases the accessibility to oxygen in the maize root zone and induces stress; therefore, the yield of the a3 irrigated treatment was significantly lower. Although the groundwater level and the SWC at the mentioned time were lower compared to the rest of the maize-growing period, the development stage of the maize, i.e., the depth of the root system, should be taken into account. Our results showed that the maize root system could draw water from deeper layers of soil, i.e., a depth greater than 30 cm, than where the sensors were placed, and that the additional irrigation caused water-induced stress due to an excessive SWC. The result of the IWUE analysis confirmed this statement (
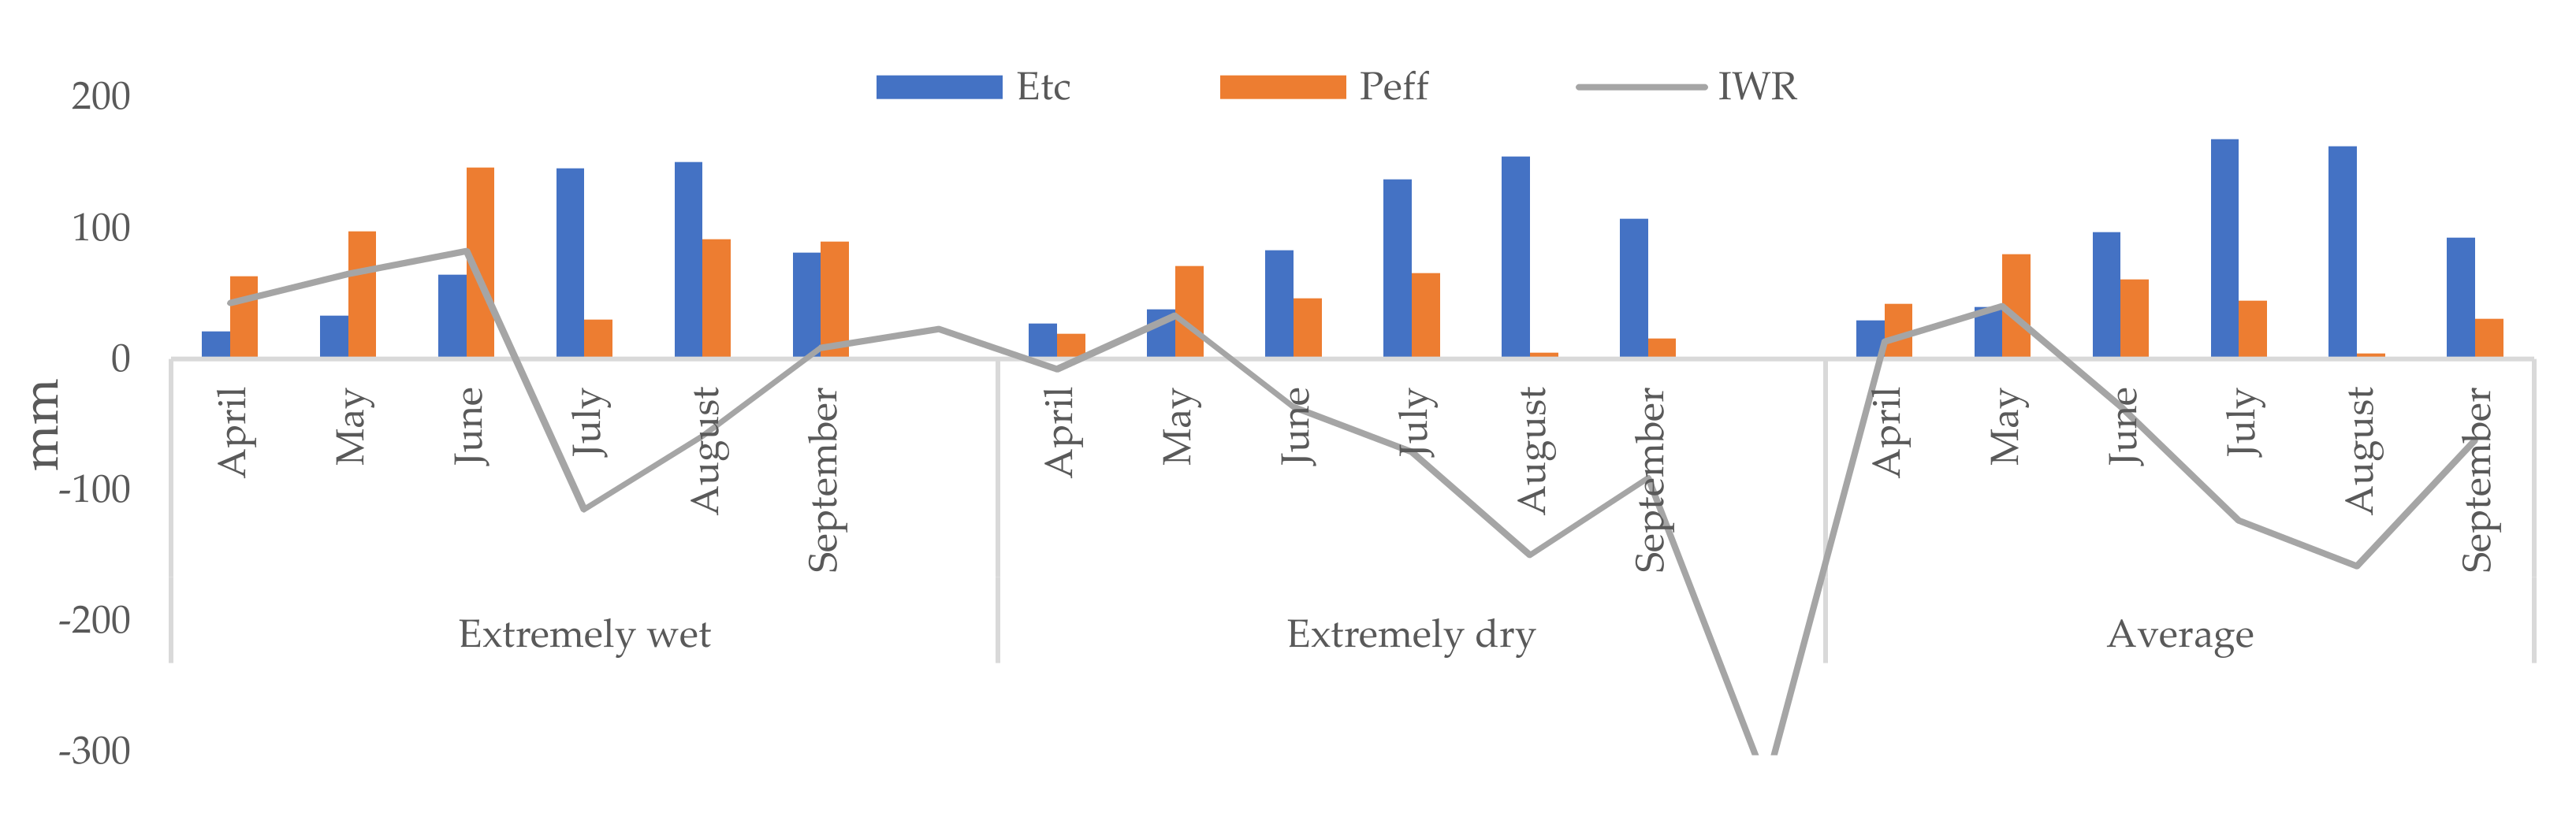
Table 4) since the higher irrigation rate reduced the maize IWUE in the extremely wet growing season for both N fertilizer treatments. One should not ignore the fact that the IWR analysis showed that even during the extremely wet growing season, the lack of water during July and August should be compensated (
Figure 5). Furthermore, an interesting finding was that there was almost the same IWR during the extremely dry and average year, which came as a result of the extremely high air temperatures during the last study year, i.e., the high ETc rate. Additionally, our results demonstrate two things. First, the installation of the GMS should be adjusted to extreme weather conditions, i.e., high amount of rainfall in a short period, potential waterlogging, and the groundwater level. Second, this adjustment should also consider the crop growth stage, i.e., the root depth. Here, it is important to keep in mind that our study design was to schedule irrigation events according to SWC measurements found with the GMS. This may be considered as a potential limitation in environmental or field studies, where one factor cannot be completely separated from others, i.e., where the study factors are closely related to external factors that cannot be influenced. Another limitation that should be addressed is the fact that some observations and data collection were limited by the field conditions, for example, heavy rainfall and waterlogging during extreme weather events.
From the results of Huzsvai and Ványiné [
70], it is clear that the degree of the water supply of maize can only be adequately judged based on the degree of the nutrient supply. The results from our study provide evidence that the amount of leached nitrate increased with increasing irrigation and nitrogen fertilizer rate regardless of the weather conditions (
Figure 11). However, it is important to emphasize that the highest amount of leached nitrates in the extremely wet year was in the springtime (
Figure 12), which occurred as a result of excessive rainfall (
Figure 2) and a high N fertilizer rate. This statement was confirmed using correlation analysis, which showed a stronger positive connection between the leached nitrate and N fertilizer rate compared to the irrigation rate (
Figure 12), regardless of the weather conditions. The result of this analysis was compared with Li et al. [
71], who noted that irrigation has more of an influence than N fertilization on leaching water quality and that the optimal irrigation, combined with optimal fertilization, was efficient at reducing the potential environmental risk caused by excessive fertilization. These differences could be explained by the fact that, in the mentioned research, a considerably higher net irrigation (6525 m
3 ha
−1) was added compared to our research (1050 m
3 ha
−1 in the extremely wet year and 2450 m
3 ha
−1 in the average year). The GY vs. irrigation and N fertilizer rate (
Figure 6) provides evidence for this statement since a strong positive correlation was found between GY and N fertilizer rate, regardless of the weather conditions, while for the irrigation rate, only a strong positive correlation was found during the average year. The importance of N fertilizer was also confirmed during the extremely wet year, where the GYs in the irrigated plots were reduced less with increasing N fertilizer rate. It seems that this is not only valid for growing conditions with excessive amounts of rainfall but also drought, as Wang and Xing [
72] made the important claim that a higher N fertilizer rate can be used to compensate for a shortage of water under limited water resources. Nevertheless, when the GY is considered, then both the IWUE and FUE should be analyzed considering both factors, i.e., the IWUE in relation to N fertilizer rate and vice versa. Here, again, the specificity of extreme weather conditions was noted. The IWUE decreased with an increasing N rate in the extremely wet growing season (
Table 5). During the extremely dry growing season, the IWUE increased with an increasing N rate, whereby the maximum IWUE was found for the a2b3 treatment (18.19 kg ha
−1/mm). Moreover, Di Paolo and Rinaldi [
73] found that N fertilizer positively affected IWUE. In the average year, for both the a2 and a3 irrigation treatments, the highest IWUE was noted on control plots (0 kg N ha
−1). Similar results were obtained for the FUE (
Table 5). In the extremely wet and average growing seasons, the highest FUE of b2 and b3 was obtained for rainfed plots (a1), while in the extremely dry year, the FUE was higher when the irrigation rate was higher. Furthermore, the highest FUE was found for the a2b3 treatment (38.3 kg ha
−1 kg
−1).
The present study confirmed the findings regarding the importance of maize hybrids (genotypes) that are adaptable to different growing conditions, i.e., those that produce high yields under diverse and marginal conditions (weather extremes). From our results, it is clear that hybrid c3 showed the best adaptability to environmental conditions (
Figure 6) since the highest yields were recorded for this hybrid, regardless of the weather conditions. We emphasize that all hybrids used in the study belong to a similar maturity group (sown and harvested at the same time); therefore, the result of the higher yield potential was a response to a genetic trait. This is in line with previous studies from different parts of the world [
74,
75,
76,
77,
78], where authors agreed that future research should involve modifying the maize selection criteria to combine tolerances to both drought and wet condition stresses.
As previously stated, grain quality in maize is a result of the interaction of genetic, environmental, and agronomic management factors [
79], and the effect of these factors on grain quality is more complex than on yield [
80]. In our study, the highest values of GPC, GOC, and GSC were recorded in the average year (
Figure 6). Among the tested factors, a similar pattern was found across the study period, i.e., a higher irrigation rate reduced the GPC and increased the GSC, while a higher N rate increased the GPC and reduced the GSC. This was also explored in a prior study by Ben Mariem et al. [
80]. These authors reported an increased GPC in drought conditions, but in their study, the drought conditions had no effect on the GSC. The results of other studies on this issue are also different. For example, Rahimi Jahangirlou et al. [
81] stated that irrigation and cultivar did not influence the GPC and GOC in either year, which was opposite to our study results. Interesting study results published by Kresović et al. [
32] showed that the highest maize GY and GOC and the lowest GSC were recorded after a fully irrigated treatment. In our study, the impact of irrigation on the GOC was year dependent, whereby in the extremely wet year (a1 = 3.28%, a3 = 3.38%) and in the average year (a1 = 4.6%, a3 = 4.8%), the irrigation rate increased the GOC, while in the extremely dry year, the irrigation rate decreased the GOC (a1 = 3.35%, a2 = 3.55%). As previously stated, in our study, a higher N rate increased the GPC and reduced the GSC, which was partially in line with Jahangirlou et al. [
81]. These authors reported an increased GPC with a higher N rate. From the correlation analysis, it is clear that the GPC and GSC had a significant (
p < 0.01) negative correlation (
Figure 8) in the extremely wet (r = −0.48) and extremely dry years (r = −0.81). Different year-to-year study results, as well as the results of other studies, indicate the complexity of the issue and that additional research is needed.
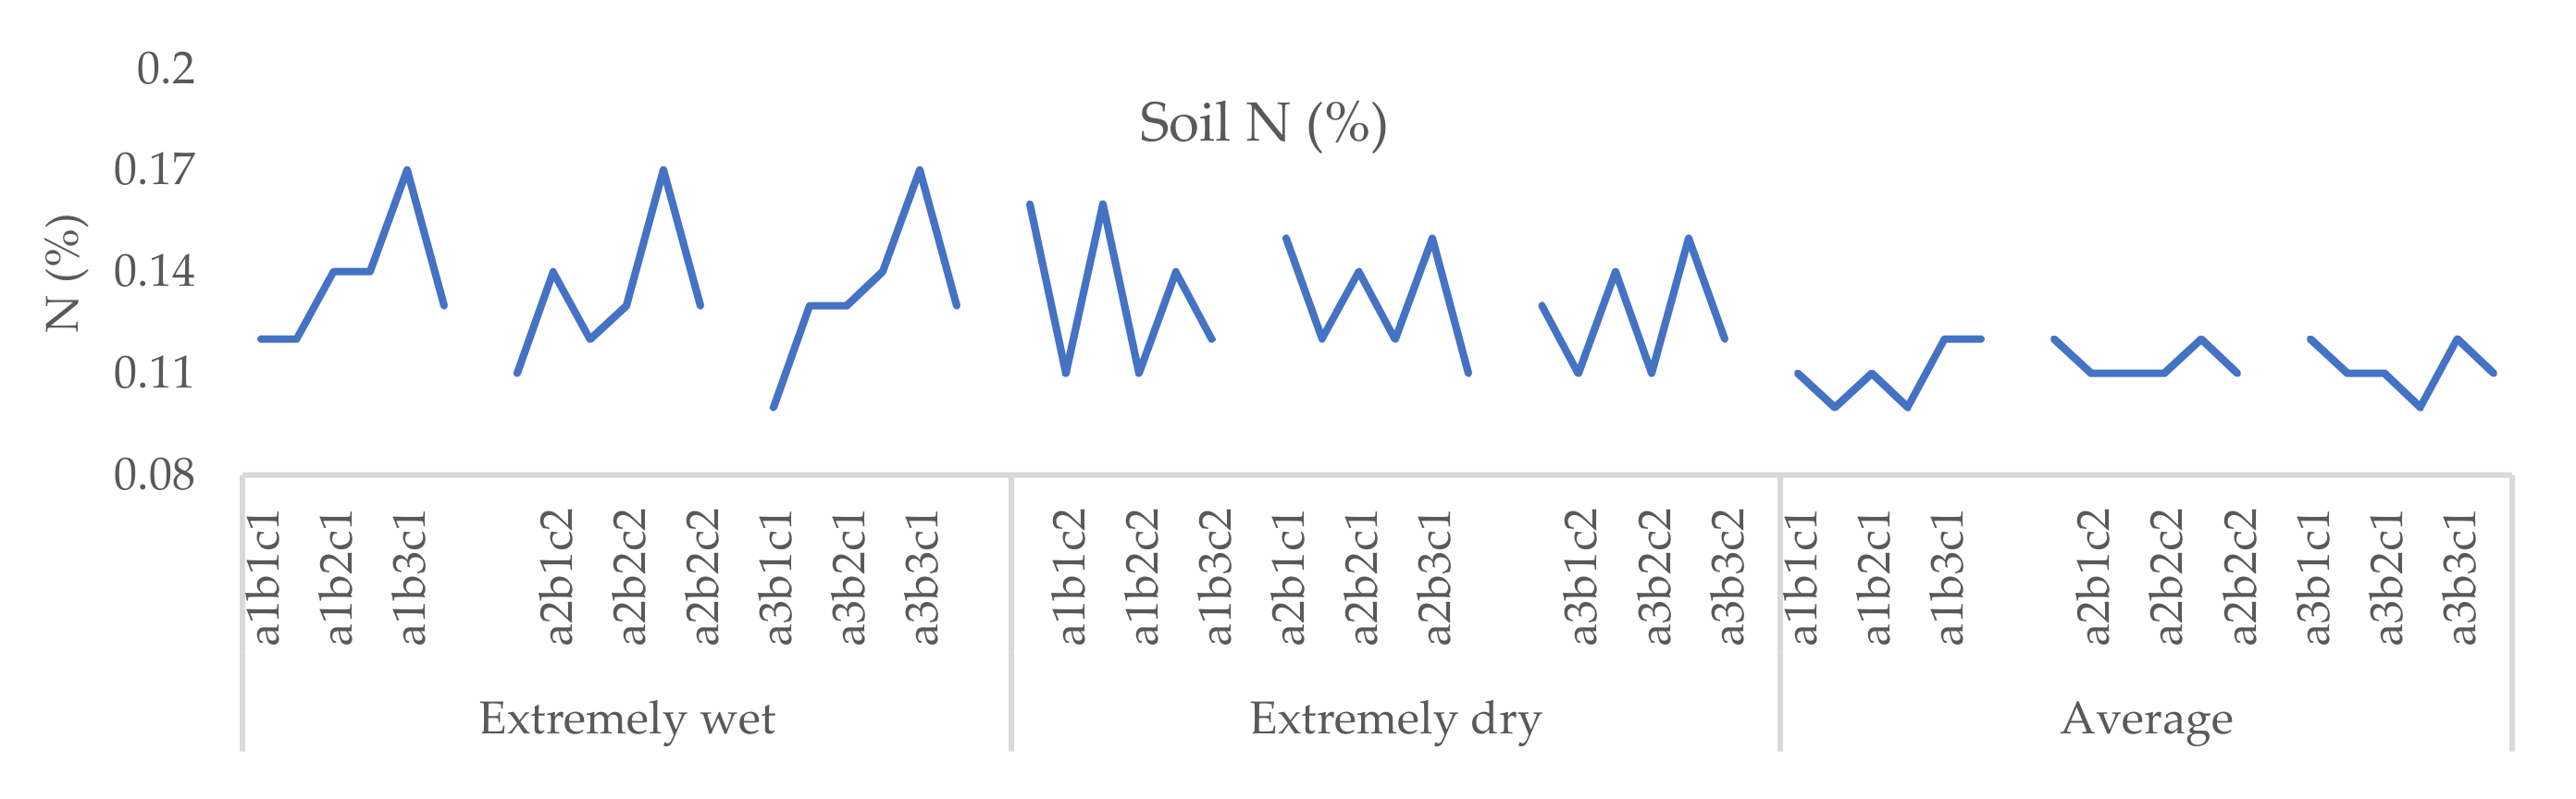
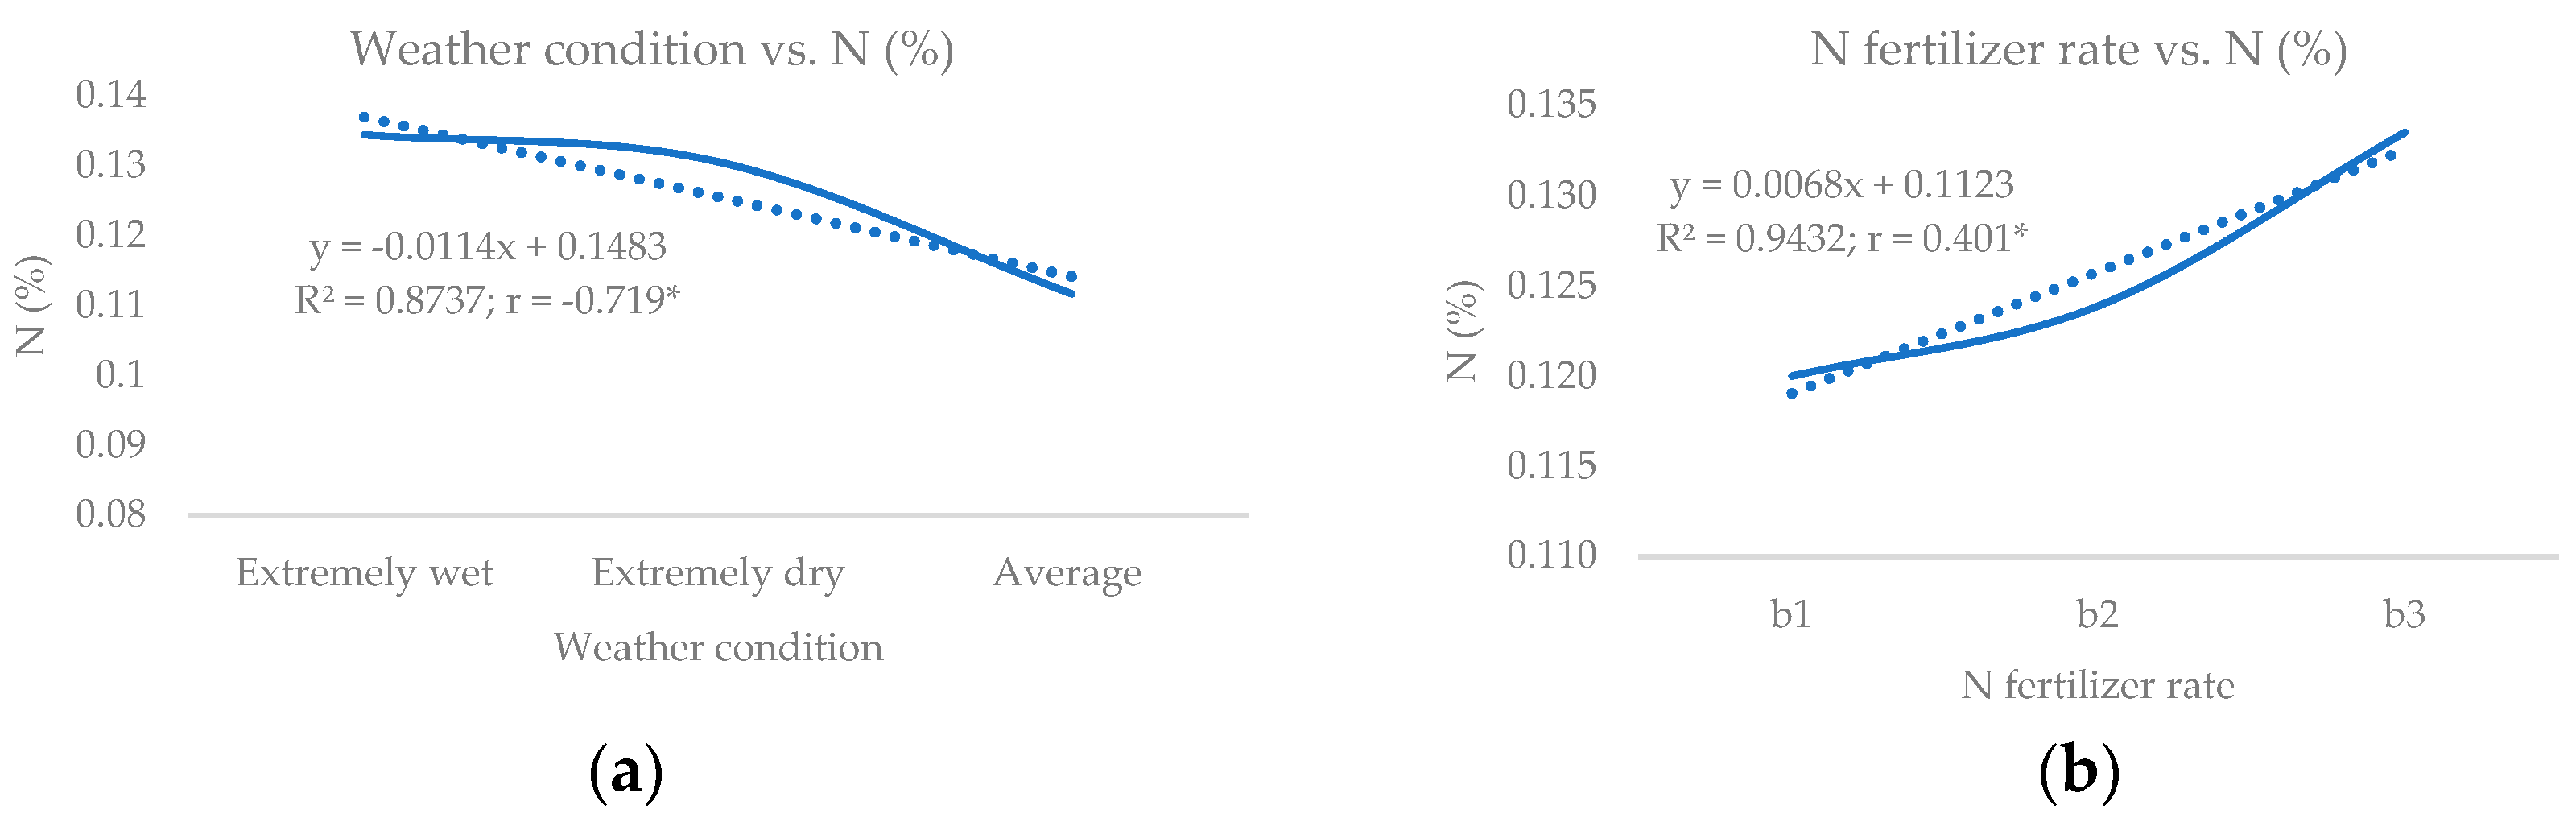
As for the soil N level, although the net irrigation rates were different depending on the weather conditions, no statistical significance was observed (
Table 6). As expected, the soil N level increased with the increase of N fertilizers (r = 0.40) and decreased toward the end of the study period (r = −0.72), which is in line with the previous study of Kühling et al. [
49]. Our result confirmed that nitrate leaching due to a higher N rate occurred, especially in growing conditions with a high rainfall amount and a high irrigation rate. The same general pattern of higher leaching losses was found in many previous studies [
46,
49,
82,
83].


