Article

Neutron-Induced Nuclear Cross-Sections Study for Plasma Facing Materials via Machine Learning: Molybdenum Isotopes

by
Mohamad Amin Bin Hamid
1,2,
Hoe Guan Beh
1,2,*,
Yusuff Afeez Oluwatobi
1,2,
Xiao Yan Chew
3,4 and
Saba Ayub
1,2
1
Department of Fundamental & Applied Sciences, Universiti Teknologi Petronas, Seri Iskandar 32610, Perak, Malaysia
2
Centre of Innovative Nanostructure and Nanodevices, Universiti Teknologi Petronas, Seri Iskandar 32610, Perak, Malaysia
3
Department of Physics Education, Pusan National University, Busan 46241, Korea
4
Research Center for Dielectric and Advanced Matter Physics, Pusan National University, Busan 46241, Korea
*
Author to whom correspondence should be addressed.
Appl. Sci. 2021, 11(16), 7359; https://doi.org/10.3390/app11167359
Submission received: 12 April 2021 / Revised: 8 June 2021 / Accepted: 5 July 2021 / Published: 10 August 2021
(This article belongs to the Section Applied Physics General)

Abstract

:
In this work, we apply a machine learning algorithm to the regression analysis of the nuclear cross-section of neutron-induced nuclear reactions of molybdenum isotopes, 92Mo at incident neutron energy around 14   MeV . The machine learning algorithms used in this work are the Random Forest (RF), Gaussian Process Regression (GPR), and Support Vector Machine (SVM). The performance of each algorithm is determined and compared by evaluating the root mean square error (RMSE) and the correlation coefficient ( R 2 ). We demonstrate that machine learning can produce a better regression curve of the nuclear cross-section for the neutron-induced nuclear reaction of 92Mo isotopes compared to the simulation results using EMPIRE 3.2 and TALYS 1.9 from the previous literature. From our study, GPR is found to be better compared to RF and SVM algorithms, with R 2 = 1 and RMSE = 0.33557 . We also employed the crude estimation of property (CEP) as inputs, which consist of simulation nuclear cross-section from TALYS 1.9 and EMPIRE 3.2 nuclear code alongside the experimental data obtained from EXFOR (1 April 2021). Although the Experimental only (EXP) dataset generates a more accurate cross-section, the use of CEP-only data is found to generate an accurate enough regression curve which indicates a potential use in training machine learning models for the nuclear reaction that is unavailable in EXFOR.

1. Introduction

Nuclear reaction induced by fast neutrons is pivotal in the development of the fusion reactor. Hence, cross-section data for a neutron-induced nuclear reaction are needed in the design of a nuclear reactor. Plasma facing components are one of the main materials that make up parts of a fusion reactor, such as the first wall and divertor. The plasma-facing components are the first to be exposed to plasma generated from the D-T reaction in the reactor, which is heavily bombarded by fast neutrons (around 14   MeV ). Thus, the materials used to fabricate plasma-facing components must be able to withstand the high neutron flux and are usually made from beryllium [1], tungsten [2], and molybdenum [3].
The nuclear cross-section can usually be determined utilizing empirical measurements, which are available in the public database EXFOR [4]. However, there is a low amount of experimental nuclear cross-sections for some nuclear reactions in certain energy ranges due to experiment complexities. There is also a possible discrepancy between nuclear cross-section data obtained through experimental measurement, especially around 14   MeV incident neutron energy. Thus, theoretical models, such as the preequilibrium exciton model [5] and Weisskopf-Ewing theory [6], and systematic analysis of empirical and semi-empirical formulas [7,8,9,10] have been developed to provide measurements for otherwise unavailable nuclear cross-section data.
In recent years, machine learning algorithms have been very popular with applications spanning a wide range of scientific applications. The main idea behind machine learning algorithms is to unearth the patterns and successfully make predictions. This is done by training a machine learning model with a pre-existing dataset. Random forest algorithm has also been employed in benchmarking the quality of Evaluated Nuclear Data Files (ENDF) [11]. The benchmarking is done by tracing the discrepancy between simulated and experimental effective neutron multiplication factors, k e f f . Gaussian process regression has also been applied in generating the nuclear cross-section of proton-induced reactions on the nickel target [12]. The data-driven approach has successfully generated a regression curve along with its corresponding uncertainties which can be used in designing a nuclear experiment with reduced uncertainty.
Here, we present the study on the prediction of nuclear cross-section data of 92Mo ( n , 2 N ) 91Mo nuclear reaction using machine learning algorithms. However, the availability of experimental data over the wide range of incident neutron energy and the discrepancy of datasets, due to the differences in equipment and experimental methodology limits the predictive capability of machine learning algorithms. We proposed to increase the accuracy of the algorithms by introducing crude estimation of property (CEP) as the input [13]. CEP consists of estimations made from the model and the simulation results of a physical system which is based on the physics of the experiments. Hence, the dataset fed into the machine learning algorithms consists of nuclear cross-sections computed from nuclear code EMPIRE 3.2 [14] and TALYS 1.9 [15], experimental nuclear cross-section and the energy of the incident neutron. The outputs are then compared to the experimental data from EXFOR [4] and evaluated data library ENDF/B-VIII.0 [16].

2. Materials and Methods

There are three main components to the input to feed into our algorithms, which are the incident energy of the neutron, E n , experimental cross-section data (EXP) and the computation cross-section, which consists of various output from EMPIRE 3.2 and TALYS 1.9 nuclear code done in the previous study [3,16,17,18,19,20]. The output is the ENDF/B-VIII.0 library nuclear cross-section, and the list of inputs and outputs can be seen in Table 1. Here, we define the computational cross-section datasets from TALYS 1.9 and EMPIRE 3.2 as the crude estimation property (CEP). TALYS 1.9 is one of the most common codes used to simulate the nuclear reaction involving protons, photons, neutrons, deuterons, and alpha particles as projectiles with incident energy up to 200 MeV. EMPIRE 3.2 is another code to simulate nuclear cross-section data for pre-equilibrium, direct nuclear, and compound nuclear reaction.
Each of the datasets is normalized by using min-max normalization. The input being fed into our machine consists of experimental data only, and experimental and CEP data (EXP + CEP) and CEP data only of 92Mo ( n , 2 N ) 91Mo. We plotted the experimental nuclear cross-section of 92Mo ( n , 2 N ) 91Mo from EXP, CEP and ENDF/B-VIII.0 library datasets in Figure 1. To avoid overfitting, the datasets are partitioned using k-fold cross-validation. The dataset is divided into k randomly chosen subset of an equal size set, and one of the subsets will be used for testing. The procedure is then repeated until all k subsets are used as the testing dataset at least once. In this work, 5-fold cross-validation is performed, where (i) the dataset is randomized and split into 5 subsets, (ii) the machine is trained using 4 of the subsets (80%), (iii) testing is done using the remaining subset (20%), (iv) repeat step (i) to (iii) until each subset is used once for testing and (v) the root means square error for each cross-validation is averaged.

3. Results and Discussions

Three algorithms are applied in this study which are the random forest (RF), Gaussian process regression (GPR), and support vector machine (SVM). Random forest is a supervised learning algorithm that utilizes the recursive partitioning of regression trees. For non-linear regression problems, the ensemble method is used to grow trees, where successive trees are independent of previous trees. Instead, each tree is independently determined using a bootstrap sample of datasets. Gaussian process regression is a type of supervised learning algorithm that is based on Bayesian non-linear regression. The GPR algorithm is non-parametric, where probability distributions are surmised over all possible values of x. Theoretically, the data points can be represented as multivariate Gaussian distribution form where GPR is performed to constrain possible form of covariance function and covariance matrix. Support vector machine was first formulated as supervised learning that utilizes hyperplanes for the separation of classes. Essentially, SVM transforms a non-linear regression into linear regression by mapping input space to new feature space by using kernel functions. After classifying data points into clusters using hyperplanes, the algorithms draw a line or hyperplanes that minimize the error or loss function.
The performance for each algorithm is compared by using the root mean square error (RMSE) as a quality criterion. The relationship of RMSE evaluated for each algorithm with different combination of experimental data and computational data used as input is reported. However, the experimental dataset provided by EXFOR for 92Mo(n,2n)91Mo nuclear reaction mostly consists of single data points, which are shown in Figure 1. This leads to a very sparse dataset, especially after the removal of the incomplete data points when being fed into machine learning algorithms. Thus, we find it is important to selectively choose the dataset used as the input. The first step is to remove the experimental nuclear cross-section input data sets that have only single data points. Here, we are left with an experimental nuclear cross-section dataset by Borman et al. (1976), Abboud et al. (1969) and Kanda et al. (1972).
To obtain our results, the feature selection is done by Recursive Feature Elimination (RFE) where RMSE and correlation coefficient served as an estimator to determine the best dataset and number of the dataset used as a predictor. The same step is repeated for the CEP-only dataset and a combination of experimental nuclear cross-section and CEP. The results of the feature selection are tabulated in Table A1, Table A2 and Table A3. By using RFE, we can decrease the number of features used while increasing the performance of our machine learning model which can be seen in Table A1 and Table A2. For the RFE done on the combination of CEP and EXP in Table A3, we will only consider the combination of CEP with a single experimental dataset since the combination of two and three EXP dataset does not give better performance in terms of RMSE and correlation coefficient as shown in Table A1 and Table A2. From Table A1, Table A2 and Table A3, the best selection of features is highlighted in yellow. After performing the RFE step, Bayesian optimization of the hyperparameters is performed, with up to 100 iterations of the hyperparameters, choosing the ones that minimize CV error. For RF, the methods in which trees are constructed using bagged tree where multiple trees are constructed by randomly training independent variable composed of the same size. The range of search for the number of leaves, number of learners, number of a predictor to sample for RF are set in between 1–34, 10–500, 1–3 and 0.001–1.
For GPR, the Bayesian optimization is performed with a search range of three different basis functions which are constant, radial, and linear, four different kernel functions which are rational quadratic, exponential, squared exponential, and the Matérn kernel function with parameters of either 3/2 or 5/2. Kernel scale is set in between 0.4166 to 416.6 and noise standard deviation; σ is set in between 0.0001 to 1248.651. For SVM, the Bayesian optimization is performed with a search range for box constraint and kernel scale in between 0.001 to 1000, ε in between 0.164 to 16,400.0208. Kernel function considered is Gaussian, linear, quadratic, and cubic. From the Bayesian optimization performed, we determined the optimized hyperparameters of each machine learning algorithm with different input in Table 2. The performance of three proposed machine learning algorithms has been investigated using the correlation coefficient and RMSE as reported in Table 3. We can observe from Table 3, for EXP, EXP + CEP and CEP input, the GPR algorithms have the highest correlation coefficient with R 2 = 1 and the lowest RMSE compared to the RF and SVM algorithm. Among those three inputs, the EXP input displayed better prediction capabilities with RMSE = 0.33557   mb followed by CEP input with RMSE = 0.86292   mb and EXP + CEP input with RMSE = 7.4093   mb .
RF and SVM algorithms also exhibit the same trends where the EXP input performs better in terms of RMSE followed by CEP and EXP + CEP. For RF, the differences of RMSE for all three inputs are small with RMSE ranging from 7.4838 to 7.885. This indicates little change in terms of performance regardless of the type of inputs being fed into the model. Figure 2, Figure 3 and Figure 4 depict the predicted vs. actual plot where we can observe the accuracy of the prediction made by GPR, RF and SVM algorithms, respectively. From Figure 2, Figure 3 and Figure 4, we observed the comparisons of the performances of our machine learning models for the three different types of input (EXP, CEP and EXP + CEP), respectively. For GPR, the predicted nuclear cross-section shows a good fit with ENDF/B-VIII.0 library data points when being fed input sets, with R 2 = 1 . The performance of the RF model is similar for all three different inputs, where it shows a good fit with ENDF/B-VIII.0 library data points ( R 2 = 1 ) as it can be seen in Figure 3a–c. This might be attributed to the property of RF algorithms that build multiple decision trees (bagging) and averaged the RMSE of all of the individual decisions tree. SVM algorithms also show good fits using all three inputs with EXP are the best input, followed by CEP and EXP + CEP. The GPR gives generally a much better prediction followed by SVM and RF with EXP, EXP + CEP and CEP inputs. GPR models can give a good fit even with the unavailability of experimental data of EXP input over a wide range of E n as shown in Figure 2a. This is due to the non-parametric nature of GPR algorithms, which are known to work well with a sparse dataset [21]. Hence, we found that the GPR is a much more versatile and robust machine learning algorithm as a prediction tool for our EXP, EXP + CEP, and CEP datasets as compared to the SVM and RF models.
In Figure 5, we plotted the predicted cross-section of GPR algorithms using EXP, EXP+CEP, and CEP inputs together with the experimental nuclear cross-section, simulated cross-section and ENDF/B-VIII.0 library data. From Figure 5, we can observe that the prediction done by the GPR algorithms fit better with ENDF/B-VIII.0 library data compared to the experimental and simulation nuclear cross-section (TALYS 1.9 and EMPIRE 3.2). Similar observation goes to the generated cross-section using RF and SVM algorithms for all inputs. This indicates a potential use of training machine learning models using simulated input instead of the experimental dataset for nuclear reactions that are hard to be experimented with or unavailable in the EXFOR database. This is useful for both interpolation and extrapolation of nuclear cross-section; however, there are limitations of our work. We have not yet tested machine learning on the region beyond what is provided by EXFOR. Error bar of the experimental cross-section from EXFOR is also not included here; however, it is possible to simulate the confidence band using machine learning algorithms. Support Vector Machine (SVM) and Random Forest (RF) is also capable of producing a confidence band by measuring the distance to separating the hyperplanes and by taking every individual response in the leaf to build a distribution from which the range of appropriate percentiles can be taken as confidence band. Artificial neural network (ANN) is also capable to produce predictive distribution which can serve as a confidence interval. The confidence band of the nuclear cross-section has been simulated in previous work using GPR [12]. Thus, these limitations can be used as a basis for future studies.

4. Conclusions

In this paper, we have studied the performance of machine learning algorithms (RF, SVM, and GPR) in predicting the nuclear cross-section of 92Mo ( n , 2 N ) 91Mo nuclear reactions. We also studied the performance of machine learning algorithms using experimental and simulation input. We perform the feature selection step in determining the best number of predictors and a combination of predictors that give the highest correlation coefficient and lowest RMSE for our GPR, RF, and SVM machine learning models. We found that we do not need the whole experimental nuclear cross-section dataset to generate nuclear cross-section data that can fit ENDF/B-VIII.0 library data. It is generally known that training machine learning in the region outside of the explored range, either unknown data points or in between data points with high sparsity tend to fail to generalize, which indicates the dependency of the training on the regime studied. Thus, we introduce crude estimation property (CEP) dataset alongside experimental dataset (EXP) to increase the predictive abilities of the machine learning algorithms where it helps to reduce the sparsity of EXP dataset in between data points. Although not yet explored, it also has potential in extrapolating nuclear cross-section data by providing data points outside the explored range of incident energy in the EXP dataset. We found that EXP input works the best in training machine learning models to generate nuclear cross-section data despite being sparse and not covering the whole range of neutron incident energy (13 MeV–17 MeV). This is then followed by CEP and EXP + CEP input in terms of correlation coefficient and RMSE. The performance of GPR (RMSE = 0.33557) algorithms better follows by SVM (RMSE = 1.6296) and RF (RMSE = 7.4838) algorithms. We also find our machine performs better in generating the nuclear cross-section as compared to the simulation cross-section using TALYS 1.9 and EMPIRE 3.2 code.

Author Contributions

Conceptualization, M.A.B.H. and H.G.B.; methodology, M.A.B.H.; software, M.A.B.H. and Y.A.O.; validation, M.A.B.H. and Y.A.O.; formal analysis, M.A.B.H. and S.A.; investigation, M.A.B.H. and Y.A.O.; resources, H.G.B.; data curation, M.A.B.H.; writing—M.A.B.H. and Y.A.O.; writing—review and editing, H.G.B. and X.Y.C.; visualization, M.A.B.H. and Y.A.O.; supervision, H.G.B. and X.Y.C.; project administration, H.G.B. and X.Y.C.; funding acquisition, H.G.B. and X.Y.C. All authors have read and agreed to the published version of the manuscript.

Funding

This research and the APC was funded by Yayasan Universiti Teknologi PETRONAS, grant number YUTP Cost Centre: 015LC0-063.

Informed Consent Statement

Not applicable.

Data Availability Statement

Not applicable.

Acknowledgments

The authors express their appreciation to Yayasan Universiti Teknologi PETRONAS for the financial support for this study in the form of a research grant (YUTP Cost Centre: 015LC0-063).

Conflicts of Interest

The authors declare no conflict of interest.

Appendix A

Table A1. Feature Selection by Recursive Feature Elimination for CEP cross-section using Gaussian process regression (GPR), random forest (RF) and support vector machine (SVM). Crude estimation property (CEP) is used as input includes EMPIRE 3.2 and TALYS 1.9 data from Luo and Jiang [3] and TALYS1.9 data from Naik et al. [19]. The machine learning model with   R 2 closed to 1 and lowest RMSE is highlighted in yellow.
AlgorithmsInput DataRMSE R 2
GPRTALYS 1.9 [19] 1.77120.99
TALYS 1.9 [3]1.87480.99
EMPIRE 3.2 [3]1.60360.99
TALYS 1.9 [3,19]2.30650.99
TALYS 1.9 + EMPIRE 3.2 [3,19]2.62420.99
TALYS 1.9 + EMPIRE 3.2 [3]1.76490.99
TALYS 1.9 + TALYS 1.9 + EMPIRE 3.2 [3,19]2.49810.99
RFTALYS 1.9 [19] 11.7390.99
TALYS 1.9 [3]11.0720.99
EMPIRE 3.2 [3]12.1130.99
TALYS 1.9 [3,19]10.4230.99
TALYS 1.9 + EMPIRE 3.2 [3,19]6.75750.99
TALYS 1.9 + EMPIRE 3.2 [3]11.2530.99
TALYS 1.9 + TALYS 1.9 + EMPIRE 3.2 [3,19]6.68290.99
SVMTALYS 1.9 [19] 6.44850.99
TALYS 1.9 [3]7.56030.99
EMPIRE 3.2 [3]4.39770.99
TALYS 1.9 [3,19]2.75430.99
TALYS 1.9 + EMPIRE 3.2 [3,19]4.53570.99
TALYS 1.9 + EMPIRE 3.2 [3]1.87630.99
TALYS 1.9 + TALYS 1.9 + EMPIRE 3.2 [3,19]4.29180.99
Table A2. Feature Selection by Recursive Feature Elimination for EXP cross-section using Gaussian process regression (GPR), random forest (RF) and support vector machine (SVM). Experimental dataset (EXP) is used as input includes experimental data from Borman et al. [17], Abboud et al. [18] and Kanda et al. [20]. The machine learning model with   R 2 closed to 1 and lowest RMSE is highlighted in yellow.
AlgorithmsInput DataRMSE R 2
GPRBorman et al. [17] 18.9960.98
Abboud et al. [18] 2.75690.99
Kanda et al. [20] 0.881920.99
RFBorman et al. [17] 7.08760.99
Abboud et al. [18] 10.640.99
Kanda et al. [20] 6.57920.99
Borman et al. + Abboud et al. [17,18] 8.43420.99
Borman et al. + Kanda et al. [17,20] 7.14180.99
Abboud et al. + Kanda et al. [18,20] 10.8720.99
Borman et al. + Abboud et al. + Kanda et al. [17,18,20] 10.5980.99
SVMBorman et al. [17] 38.4940.92
Abboud et al. [18] 126.950.07
Kanda et al. [20] 1.11550.99
Table A3. Feature Selection by Recursive Feature Elimination for EXP + CEP cross-section using Gaussian process regression (GPR), random forest (RF) and support vector machine (SVM). Experimental dataset (EXP) includes experimental data from Borman et al. [17], Abboud et al. [18] and Kanda et al. [20], and crude estimation property (CEP) input includes EMPIRE 3.2 and TALYS 1.9 data from Luo and Jiang [3] and TALYS1.9 data from Naik et al. [19] are used as input. The machine learning model with   R 2 closed to 1 and lowest RMSE is highlighted in yellow.
AlgorithmsInput DataRMSE R 2
GPRTALYS 1.9 + Borman et al. [17,19] 79.0790.61
TALYS 1.9 + Borman et al. [3,17]70.1470.69
EMPIRE 3.2 + Borman et al. [3,17] 24.1140.96
TALYS 1.9 + Borman et al. [3,17,19]82.770.57
TALYS 1.9 + EMPIRE 3.2 + Borman et al. [3,17,19] 60.8950.77
TALYS 1.9 + EMPIRE 3.2 + Borman et al. [3,17] 62.8630.75
TALYS 1.9 + TALYS 1.9 + EMPIRE 3.2 + Borman et al. [3,17,19] 68.4670.71
TALYS 1.9 + Abboud et al. [18,19] 4.91630.99
TALYS 1.9 + Abboud et al. [3,18] 7.11680.99
EMPIRE 3.2 + Abboud et al. [3,18] 2.20940.99
TALYS 1.9 + Abboud et al. [3,18,19] 5.08290.99
TALYS 1.9 + EMPIRE 3.2 + Abboud et al. [3,18,19] 4.9380.99
TALYS 1.9 + EMPIRE 3.2 + Abboud et al. [3,18] 9.12490.99
TALYS 1.9 + TALYS 1.9 + EMPIRE 3.2 + Abboud et al. [3,18,19] 4.23380.99
TALYS 1.9 + Kanda et al. [19,20]88.5810.51
TALYS 1.9 + Kanda et al. [3,20] 86.9020.53
EMPIRE 3.2 + Kanda et al. [3,20] 89.1880.50
TALYS 1.9 + Kanda et al. [3,19,20] 86.4230.53
TALYS 1.9 + EMPIRE 3.2 + Kanda et al. [3,19,20] 88.1120.51
TALYS 1.9 + EMPIRE 3.2 + Kanda et al. [3,20] 86.8350.53
TALYS 1.9 + TALYS 1.9 + EMPIRE 3.2 + Kanda et al. [3,19,20] 86.6970.53
RFTALYS 1.9 + Borman et al. [17,19] 6.68870.99
TALYS 1.9 + Borman et al. [3,17]6.84520.99
EMPIRE 3.2 + Borman et al. [3,17] 7.67750.99
TALYS 1.9 + Borman et al. [3,17,19]12.5980.99
TALYS 1.9 + EMPIRE 3.2 + Borman et al. [3,17,19] 9.97780.99
TALYS 1.9 + EMPIRE 3.2 + Borman et al. [3,17] 7.8860.99
TALYS 1.9 + TALYS 1.9 + EMPIRE 3.2 + Borman et al. [3,17,19] 8.35050.99
TALYS 1.9 + Abboud et al. [18,19] 6.95080.99
TALYS 1.9 + Abboud et al. [3,18] 9.88440.99
EMPIRE 3.2 + Abboud et al. [3,18] 6.85450.99
TALYS 1.9 + Abboud et al. [3,18,19] 12.6260.99
TALYS 1.9 + EMPIRE 3.2 + Abboud et al. [3,18,19] 6.71710.99
TALYS 1.9 + EMPIRE 3.2 + Abboud et al. [3,18] 10.7470.99
TALYS 1.9 + TALYS 1.9 + EMPIRE 3.2 + Abboud et al. [3,18,19]6.750.99
TALYS 1.9 + Kanda et al. [19,20]11.3760.99
TALYS 1.9 + Kanda et al. [3,20] 6.69640.99
EMPIRE 3.2 + Kanda et al. [3,20] 8.29240.99
TALYS 1.9 + Kanda et al. [3,19,20] 7.40090.99
TALYS 1.9 + EMPIRE 3.2 + Kanda et al. [3,19,20] 10.4130.99
TALYS 1.9 + EMPIRE 3.2 + Kanda et al. [3,20] 6.69620.99
TALYS 1.9 + TALYS 1.9 + EMPIRE 3.2 + Kanda et al. [3,19,20] 13.0990.99
SVMTALYS 1.9 + Borman et al. [17,19] 133.6−0.12
TALYS 1.9 + Borman et al. [3,17]133.6−0.12
EMPIRE 3.2 + Borman et al. [3,17] 133.6−0.12
TALYS 1.9 + Borman et al. [3,17,19]133.6−0.12
TALYS 1.9 + EMPIRE 3.2 + Borman et al. [3,17,19] 133.6−0.12
TALYS 1.9 + EMPIRE 3.2 + Borman et al. [3,17] 133.6−0.12
TALYS 1.9 + TALYS 1.9 + EMPIRE 3.2 + Borman et al. [3,17,19] 133.6−0.12
TALYS 1.9 + Abboud et al. [18,19] 7.15750.99
TALYS 1.9 + Abboud et al. [3,18] 8.65070.99
EMPIRE 3.2 + Abboud et al. [3,18] 31.1920.95
TALYS 1.9 + Abboud et al. [3,18,19] 5.89210.99
TALYS 1.9 + EMPIRE 3.2 + Abboud et al. [3,18,19] 27.9980.96
TALYS 1.9 + EMPIRE 3.2 + Abboud et al. [3,18] 5.97240.99
TALYS 1.9 + TALYS 1.9 + EMPIRE 3.2 + Abboud et al. [3,18,19]11.0440.99
TALYS 1.9 + Kanda et al. [19,20]138.43−0.2
TALYS 1.9 + Kanda et al. [3,20] 138.43−0.2
EMPIRE 3.2 + Kanda et al. [3,20] 138.43−0.2
TALYS 1.9 + Kanda et al. [3,19,20] 138.43−0.2
TALYS 1.9 + EMPIRE 3.2 + Kanda et al. [3,19,20] 138.43−0.2
TALYS 1.9 + EMPIRE 3.2 + Kanda et al. [3,20] 138.43−0.2
TALYS 1.9 + TALYS 1.9 + EMPIRE 3.2 + Kanda et al. [3,19,20] 138.43−0.2

References

  1. Rubel, M.J.; Bailescu, V.; Coad, J.P.; Hirai, T.; Likonen, J.; Linke, J.; Lungu, C.P.; Matthews, G.F.; Pedrick, L.; Riccardo, V.; et al. Beryllium plasma-facing components for the ITER-Like wall project at JET. J. Phys. Conf. Ser. 2008, 100, 062028. [Google Scholar] [CrossRef]
  2. Mehta, M.; Singh, N.L.; Makwana, R.; Mukherjee, S.; Vansola, V.; Sheela, Y.S.; Khirwadkar, S.; Abhangi, M.; Vala, S.; Suryanarayana, S.V.; et al. Neutron induced reaction cross-section for the plasma facing fusion reactor material—Tungsten isotopes. In Proceedings of the 2018 19th International Scientific Conference on Electric Power Engineering (EPE), Brno, Czech Republic, 16–18 May 2018; pp. 1–6. [Google Scholar] [CrossRef]
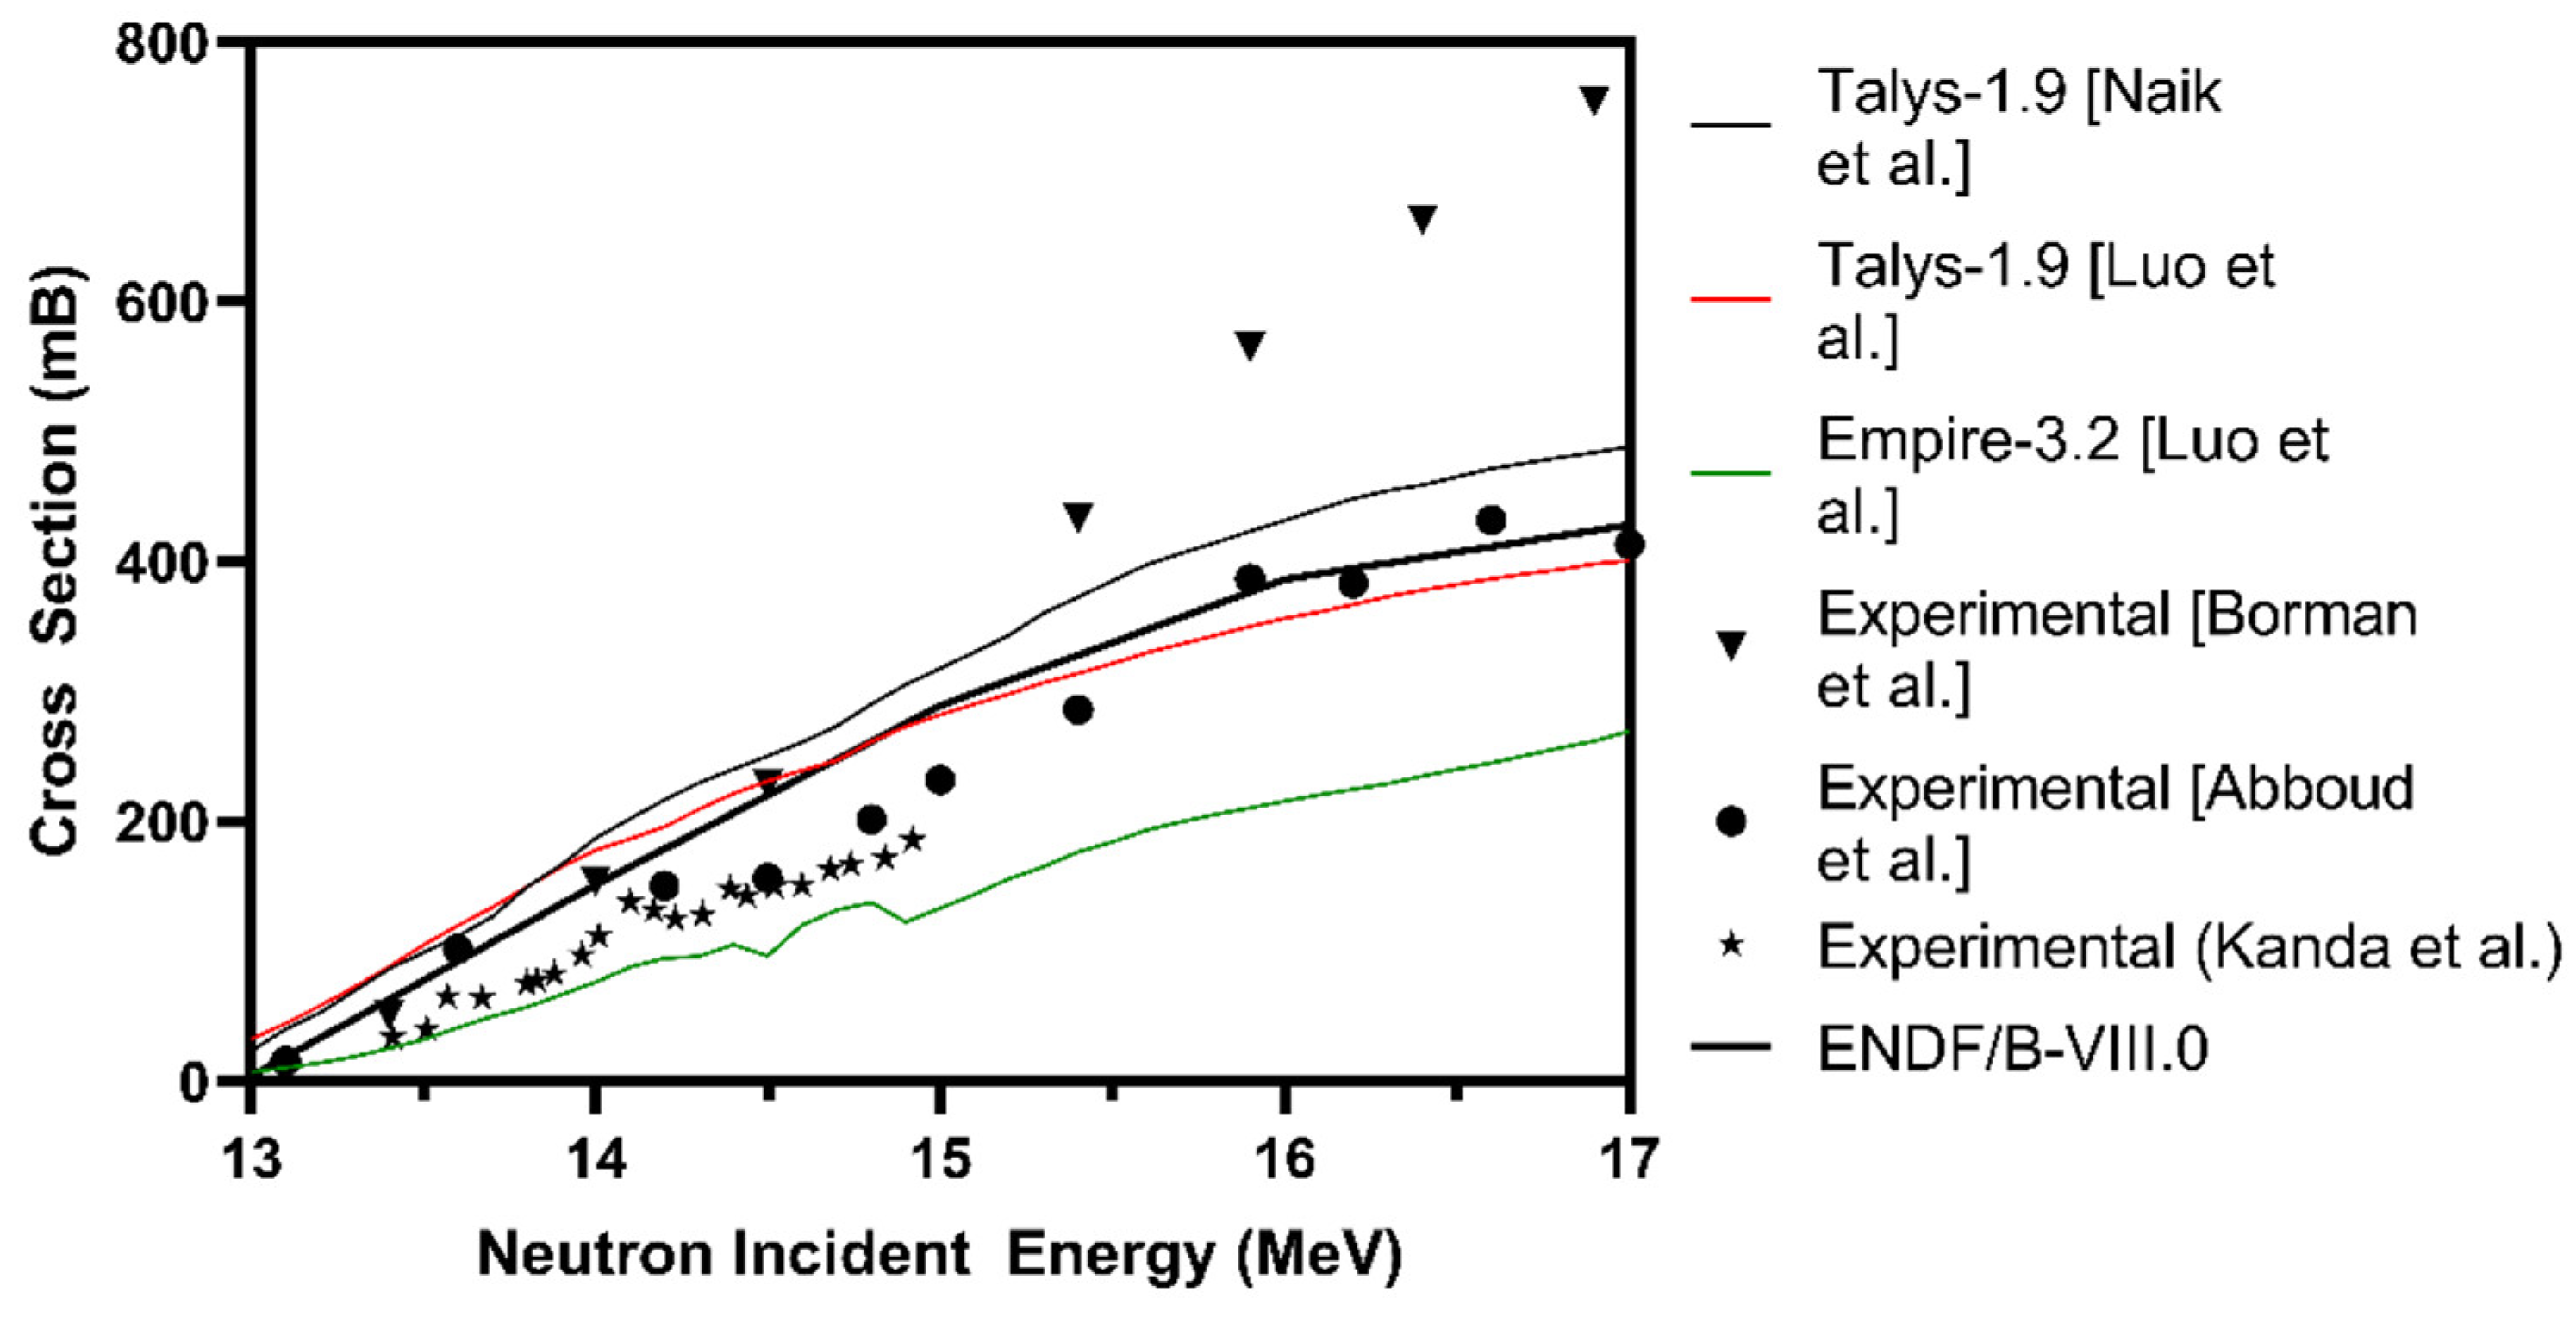
  3. Luo, J.; Jiang, L. Cross-Sections for n,2n, (n,α, (n,p), {(n,d), and (n,t) Reactions on Molybdenum Isotopes in the Neutron Energy Range of 13 to 15 MeV. Chin. Phys. C 2020, 44, 114002. [Google Scholar] [CrossRef]
  4. Otuka, N.; Dupont, E.; Semkova, V.; Pritychenko, B.; Blokhin, A.I.; Aikawa, M.; Babykina, S.; Bossant, M.; Chen, G.; Dunaeva, S.; et al. Towards a more complete and accurate experimental nuclear reaction data library (EXFOR): International collaboration between Nuclear Reaction Data Centres (NRDC). Nucl. Data Sheets 2014. [Google Scholar] [CrossRef] [Green Version]
  5. Betak, E. Recommendations for pre-equilibrium calculations. Meas. Calc. Eval. Phot. Prod. Data 1999, 31, 134–138. [Google Scholar]
  6. Weisskopf, V.F.; Ewing, D.H. On the yield of nuclear reactions with heavy elements. Phys. Rev. 1940, 57, 472–485. [Google Scholar] [CrossRef]
  7. Bitam, T.; Belgaid, M. Newly developed semi-empirical formulas of nuclear excitation functions for (n,α) reactions at the energy range 12 ≤ En ≤ 20 MeV and mass number range 30 ≤ A ≤ 128. Nucl. Phys. A 2019, 991, 121614. [Google Scholar] [CrossRef]
  8. Yiğit, M. A Review of (n,p) and (n,α) nuclear cross sections on palladium nuclei using different level density models and empirical formulas. Appl. Radiat. Isot. 2018, 140, 355–362. [Google Scholar] [CrossRef] [PubMed]
  9. Yiğit, M. Analysis of cross sections of (n,t) nuclear reaction using different empirical formulae and level density models. Appl. Radiat. Isot. 2018, 139, 151–158. [Google Scholar] [CrossRef] [PubMed]
  10. Yiğit, M.; Bostan, S.N. Study on cross section calculations for (n,p) nuclear reactions of cadmium isotopes. Appl. Radiat. Isot. 2019, 154. [Google Scholar] [CrossRef] [PubMed]
  11. Neudecker, D.; Grosskopf, M.; Herman, M.; Haeck, W.; Grechanuk, P.; Vander Wiel, S.; Rising, M.E.; Kahler, A.C.; Sly, N.; Talou, P. Enhancing nuclear data validation analysis by using machine learning. Nucl. Data Sheets 2020, 167, 36–60. [Google Scholar] [CrossRef]
  12. Iwamoto, H. Generation of nuclear data using gaussian process regression. J. Nucl. Sci. Technol. 2020, 57, 932–938. [Google Scholar] [CrossRef]
  13. Zhang, Y.; Ling, C. A strategy to apply machine learning to small datasets in materials science. NPJ Comput. Mater. 2018, 4, 28–33. [Google Scholar] [CrossRef] [Green Version]
  14. Herman, M.; Capote, R.; Carlson, B.V.; Obložinský, P.; Sin, M.; Trkov, A.; Wienke, H.; Zerkin, V. EMPIRE: Nuclear reaction model code system for data evaluation. Nucl. Data Sheets 2007, 108, 2655–2715. [Google Scholar] [CrossRef]
  15. Koning, A.J.; Rochman, D. Modern nuclear data evaluation with the TALYS code system. Nucl. Data Sheets 2012, 113, 2841–2934. [Google Scholar] [CrossRef]
  16. Brown, D.A.; Chadwick, M.B.; Capote, R.; Kahler, A.C.; Trkov, A.; Herman, M.W.; Sonzogni, A.A.; Danon, Y.; Carlson, A.D.; Dunn, M.; et al. ENDF/B-VIII.0: The 8th Major Release of the Nuclear Reaction Data Library with CIELO-Project Cross Sections, New Standards and Thermal Scattering Data. Nucl. Data Sheets 2018, 148, 1–142. [Google Scholar] [CrossRef]
  17. Bormann, M.; Feddersen, H.-K.; Hölscher, H.-H.; Scobel, W.; Wagener, H. (N, 2n) Anregungsfunktionen Für54Fe,70Ge,74Se,85Rb,8688Sr,89Y,92Mo,204Hg Im Neutronenenergiebereich 13–18 MeV. Z. Für Phys. A At. Nucl. 1976, 277, 203–210. [Google Scholar] [CrossRef]
  18. Abboud, A.; Decowski, P.; Grochulski, W.; Marcinkowski, A.; Piotrowski, J.; Siwek, K.; Wilhelmi, Z. Isomeric Cross-Section Ratios and Total Cross Sections for the 74se(n, 2n)73g, Mse, 90zr(n, 2n)89g, Mzr and 92mo(n, 2n)91g, Mmo Reactions. Nucl. Phys. A 1969, 139, 42–56. [Google Scholar] [CrossRef]
  19. Naik, H.; Kim, G.; Kim, K.; Nadeem, M.; Sahid, M. Production Cross-Sections of Mo-Isotopes Induced by Fast Neutrons Based on the 9Be(p, n) Reaction. Eur. Phys. J. Plus 2020, 135. [Google Scholar] [CrossRef]
  20. Kanda, Y. The excitation functions and isomer ratios for neutron-induced reactions on 92Mo and 90Zr. Nucl. Physics Sect. A 1972, 185, 177–195. [Google Scholar] [CrossRef]
  21. Bishnoi, S.; Singh, S.; Ravinder, R.; Bauchy, M.; Gosvami, N.N.; Kodamana, H.; Krishnan, N.M.A. Predicting young’s modulus of oxide glasses with sparse datasets using machine learning. J. Non. Cryst. Solids 2019, 524, 119643. [Google Scholar] [CrossRef] [Green Version]
Figure 1. Graph of nuclear cross-section data of 92Mo ( n , 2 N ) 91Mo nuclear reaction from various literature used in this work [3,17,18,19]. The neutron incident energy, E n is between 13   MeV to 17   MeV .
Applsci 11 07359 g001
Figure 2. Graph of prediction vs. measured nuclear cross-section of 92Mo ( n , 2 N ) 91Mo for GPR machine learning algorithm. The black line is the ENDF/B-VIII.0 library data while the red dot is the predictions done by the GPR algorithms with (a) EXP, (b) CEP and (c) EXP + CEP as input.
Applsci 11 07359 g002
Figure 3. Graph of prediction vs. measured nuclear cross-section of 92Mo ( n , 2 N ) 91Mo for RF machine learning algorithm. The black line is the ENDF/B-VIII.0 library data while the red dot is the predictions done by the RF algorithms with (a) EXP, (b) CEP and (c) EXP + CEP as input.
Applsci 11 07359 g003
Figure 4. Graph of prediction vs. measured nuclear cross-section of 92Mo ( n , 2 N ) 91Mo for SVM machine learning algorithm. The black line is the ENDF/B-VIII.0 library data while the red dot is the predictions done by the SVM algorithms with (a) EXP, (b) CEP and (c) EXP + CEP as input.
Applsci 11 07359 g004
Figure 5. Comparisons between the EXP, EXP + CEP, and CEP using (a) GPR, (b) RF and (c) SVM algorithms.
Applsci 11 07359 g005
Table 1. Variables used as the input and output for prediction of nuclear cross-section data of 92Mo ( n , 2 N ) 91Mo. The experimental dataset (EXP) includes experimental data from Borman et al. [17], Abboud et al. [18] and Kanda et al. [20] while the crude estimation property (CEP) includes EMPIRE 3.2 and TALYS 1.9 data from Luo and Jiang3 and TALYS1.9 data from Naik et al. [19].
VariableVariable NameNo of Data PointsVariable Type
X1Incident Energy ( MeV )41Input
X2EMPIRE 3.2 output ( mB ) [3]41Input
X3TALYS 1.9 output ( mB ) [3,19]82Input
X4Borman et al. [17]7Input
X5Abboud et al. [18]11Input
X6Kanda et al. [20]21Input
Y1ENDF/B-VIII.0 library ( mB ) [16]41Output
Table 2. Hyperparameters optimization using Bayesian Optimization.
AlgorithmsInputHyperparameters
GPREXPLinear basis function, isotropic rational quadratic, 39.2269 kernal scale, σ = 0.00010974
EXP + CEPRadial basis function, non-isotropic matern 3/2, 114.1658 kernal scale, σ = 1246.4488
CEPRadial basis function, non-isotropic matern 3/2, 249.3891 kernal scale, σ = 3.477
RFEXPBagged tree, 3 leaves, 10 learners and 2 predictors
EXP + CEPBagged tree, 2 leaves, 172 learners and 4 predictors
CEPBagged tree, 1 leaf, 13 learners and 4 predictors
SVMEXPQuadratic kernel funcion, 992.923 box constraints, ε = 1.1308
EXP + CEPLinear kernel function, 0.01304 box constraints, ε = 1.5412
CEPCubic kernel function, 150.2836 box constraints, ε = 5.6412
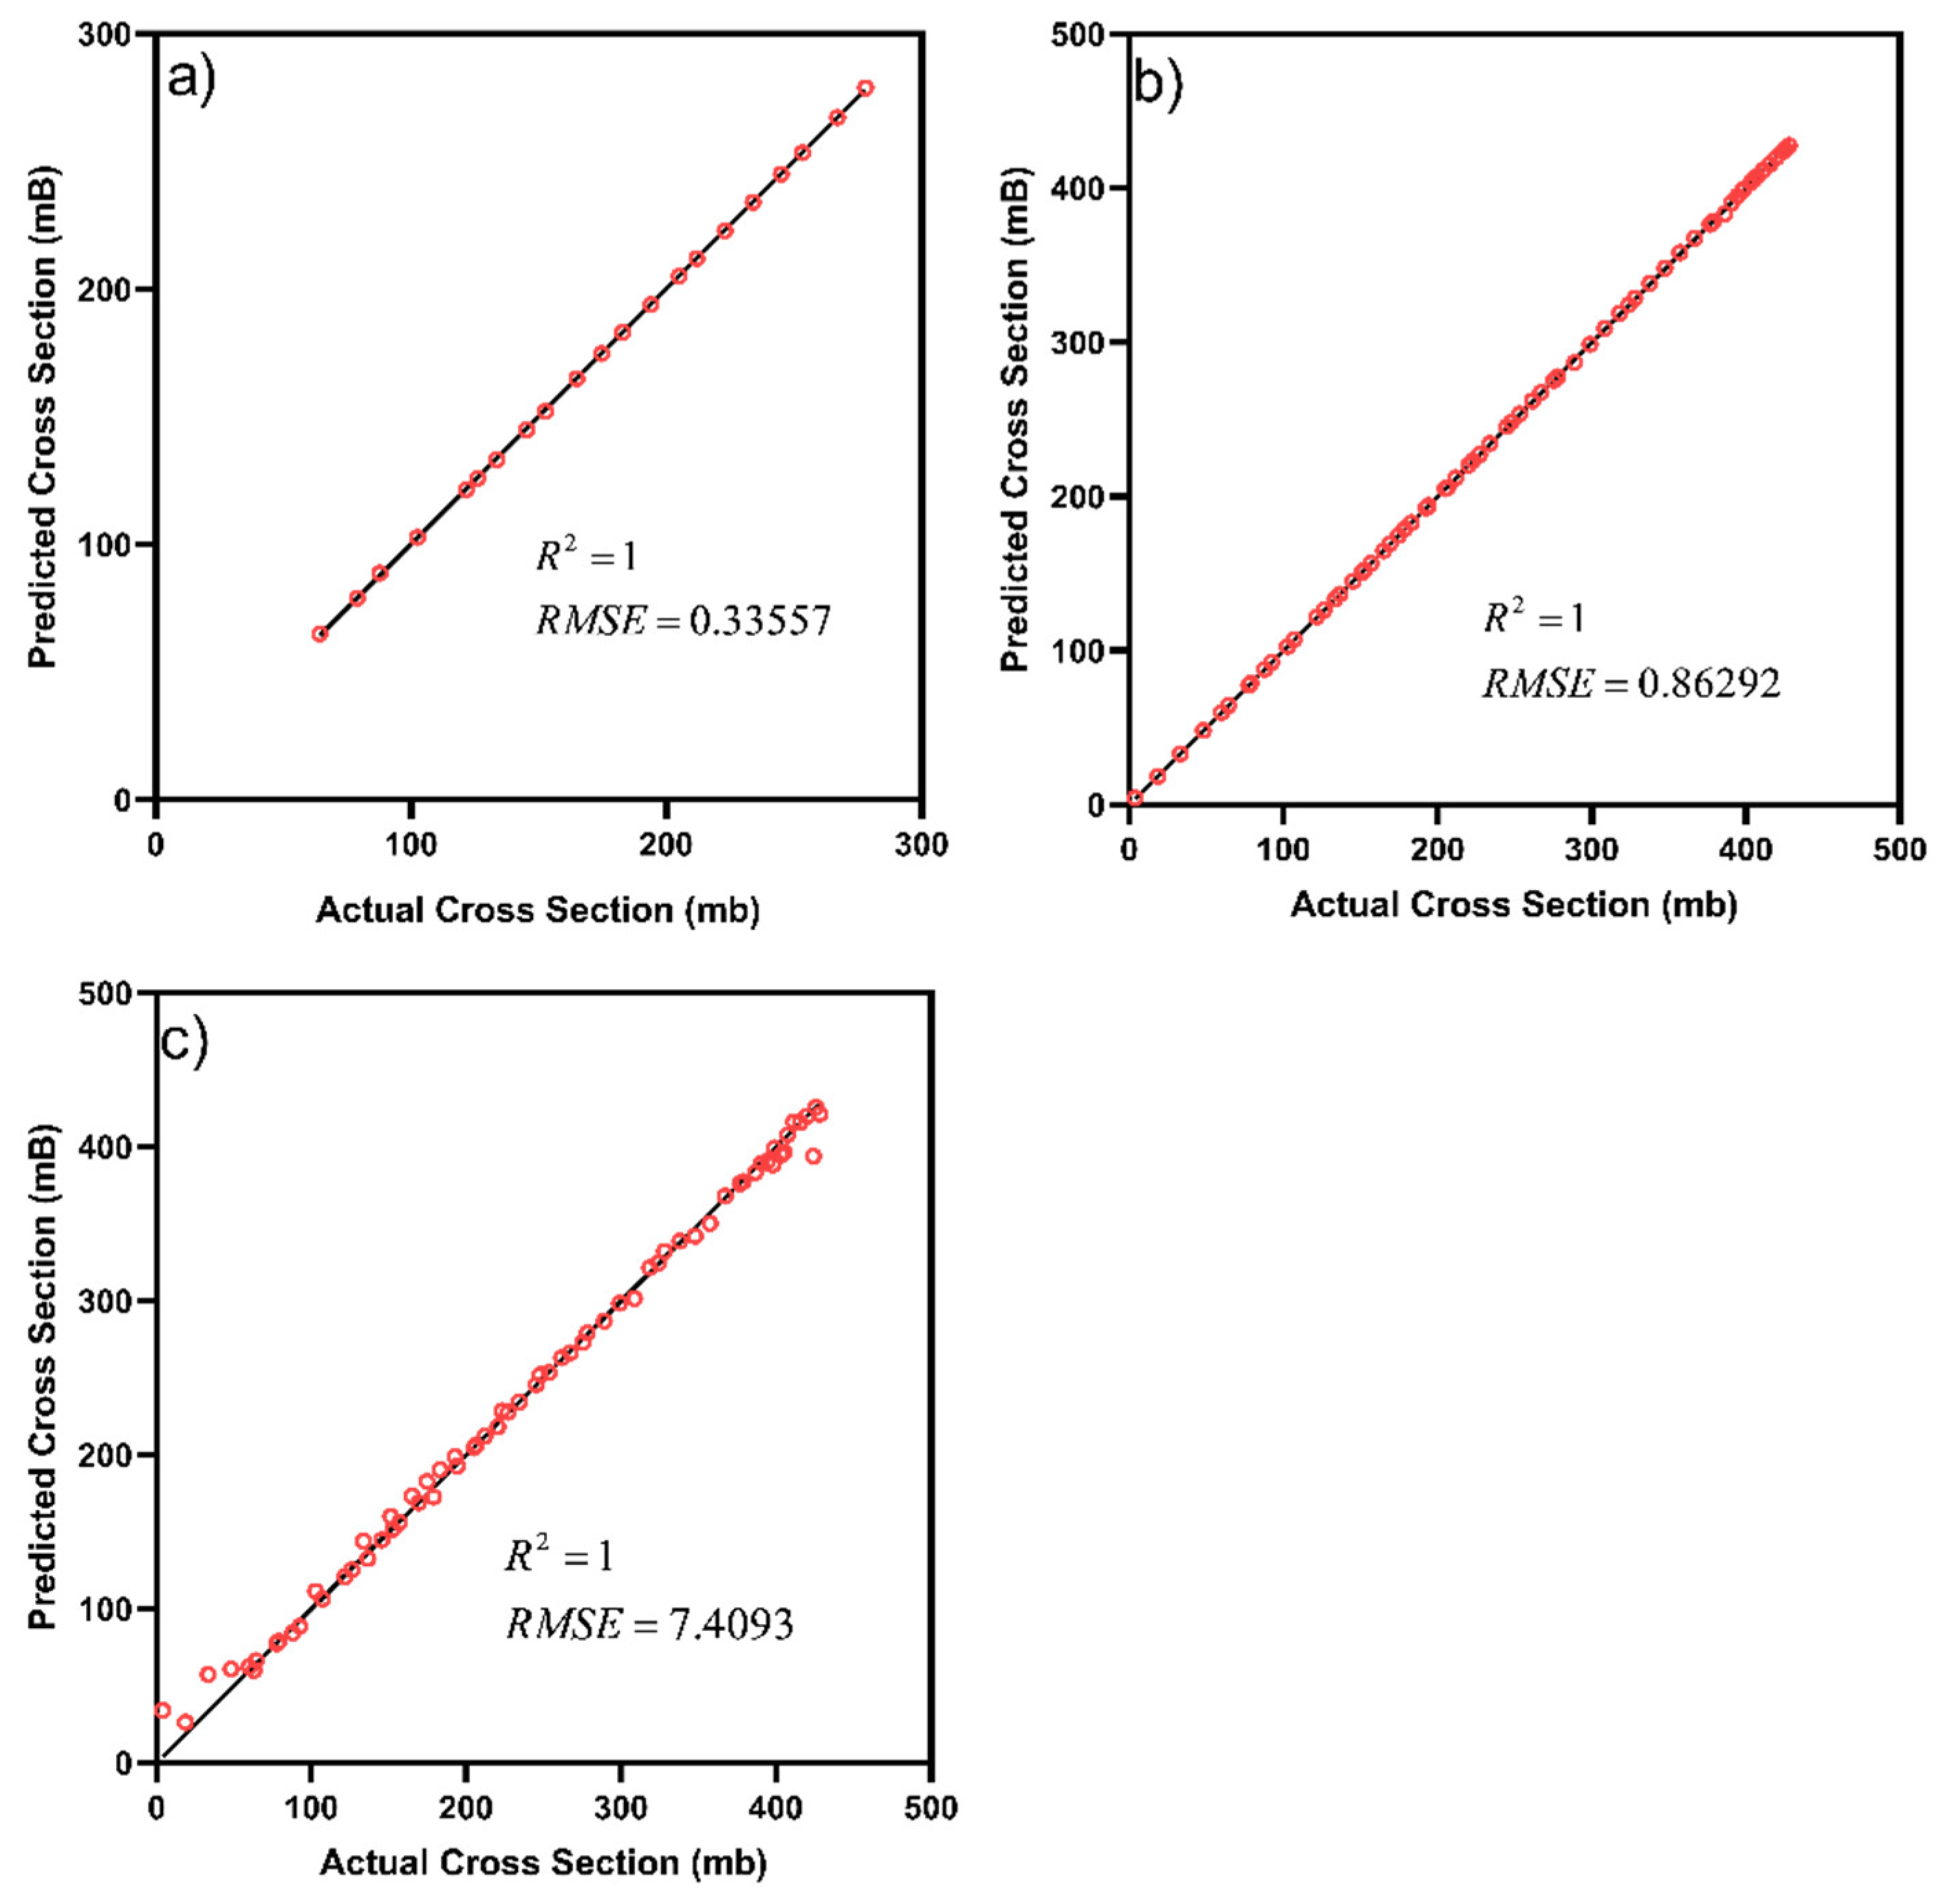
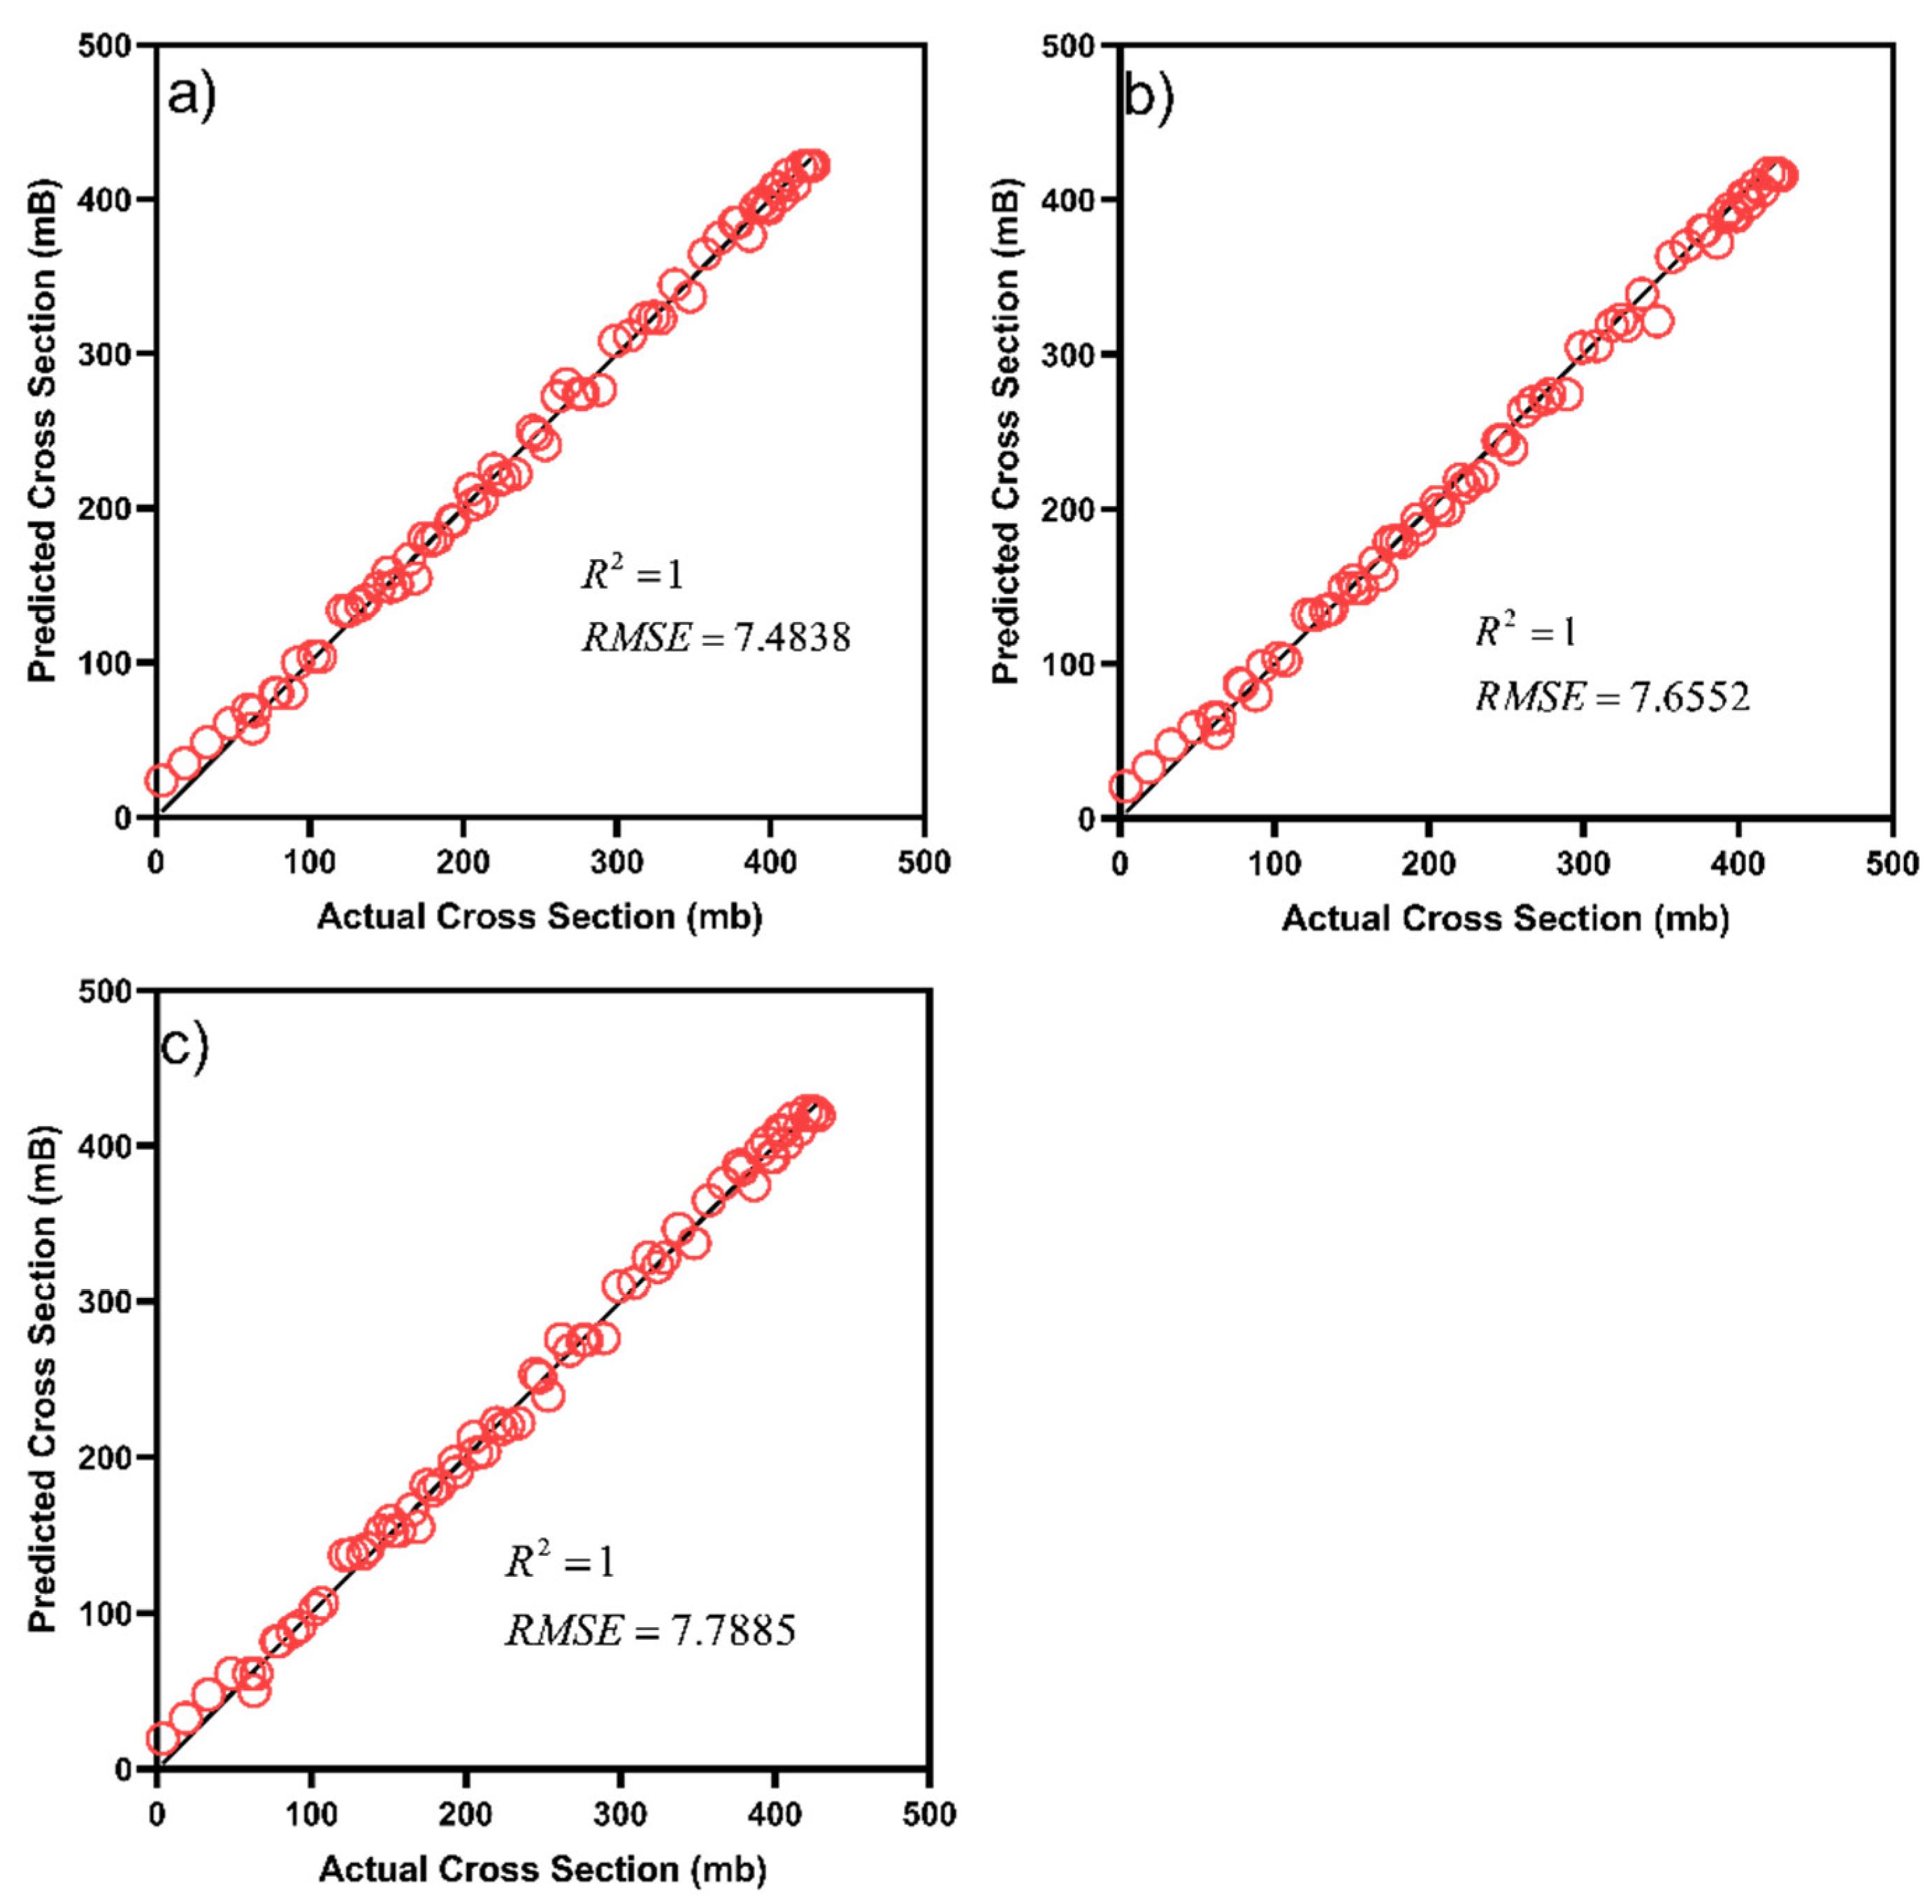
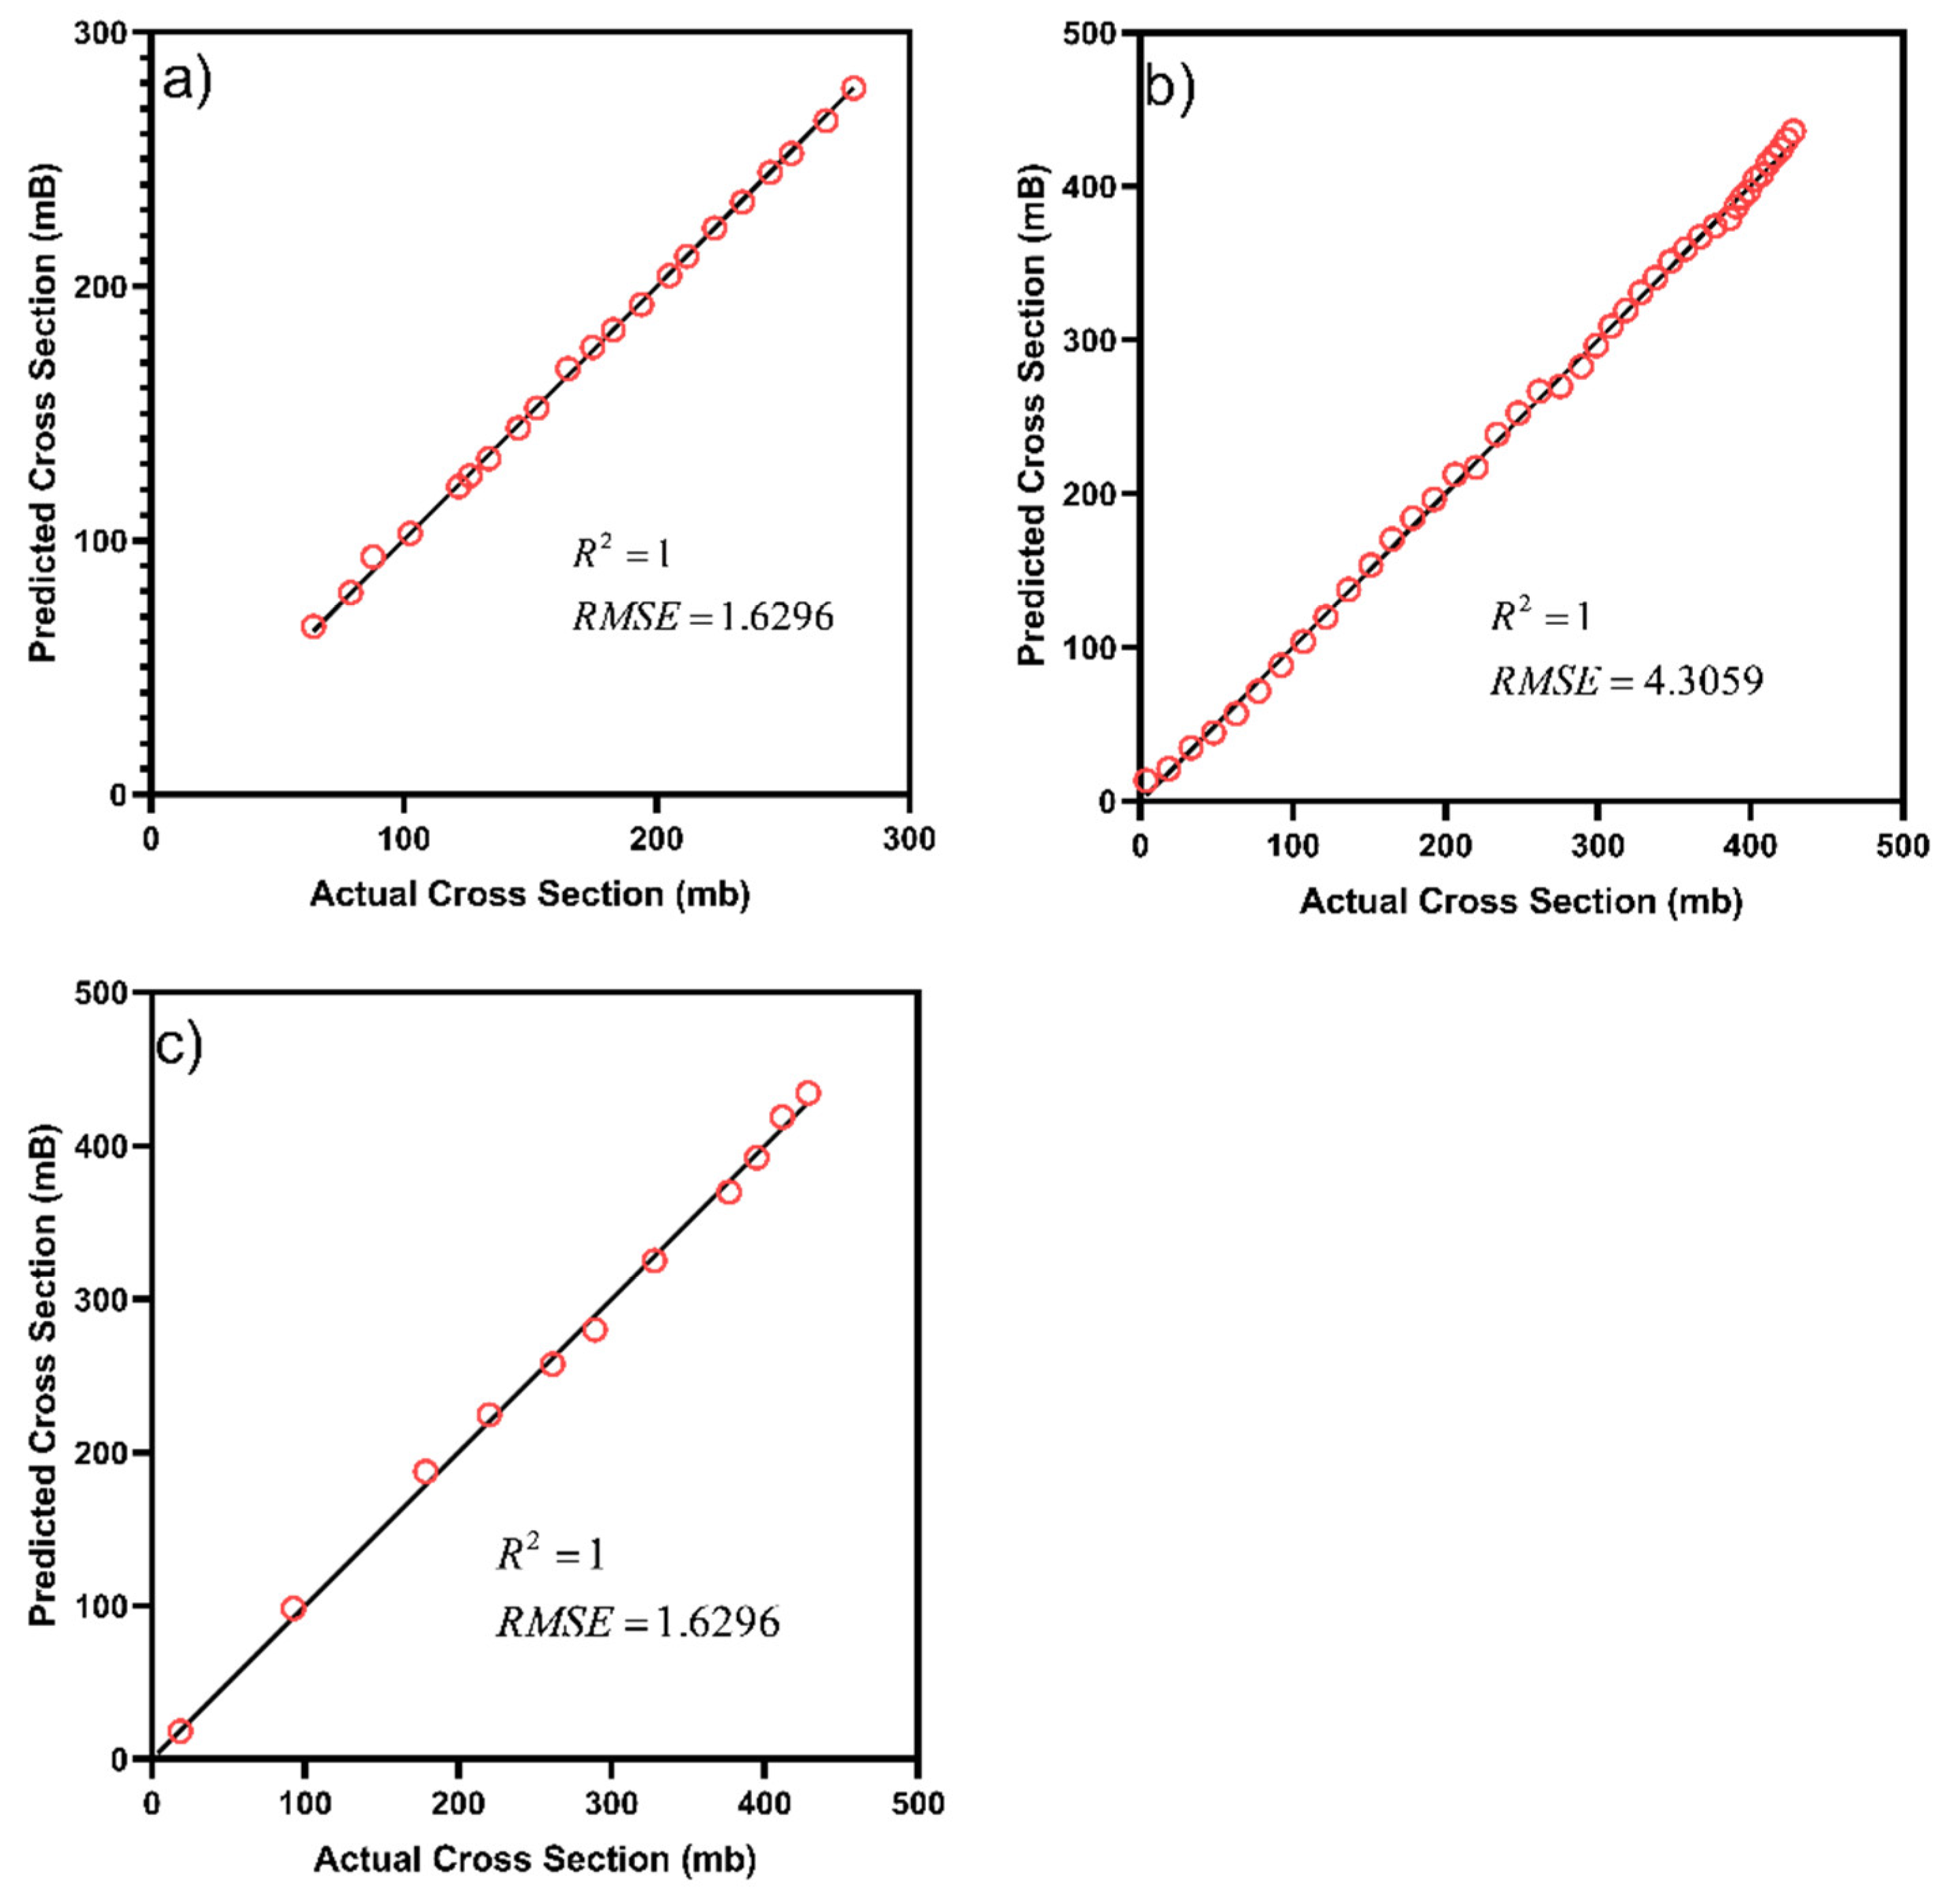
Table 3. The statistical analysis of the performance of GPR, RF, and SVM algorithms using EXP, EXP + CEP and CEP input. The machine learning model with   R 2 closed to 1 and lowest RMSE is highlighted in yellow.
AlgorithmsInput R 2 RMSE (mB)
GPREXP10.33557
EXP + CEP17.4093
CEP10.86292
RFEXP17.4838
EXP + CEP17.7885
CEP17.6552
SVMEXP11.6296
EXP + CEP15.9236
CEP14.3059
Publisher’s Note: MDPI stays neutral with regard to jurisdictional claims in published maps and institutional affiliations.

