Article

Evaluation of Anti-Obesity Activity of an Herbal Formulation (F2) in DIO Mice Model and Validation of UPLC-DAD Method for Quality Control

1
Department of Oriental Pharmacy and Wonkwang-Oriental Medicines Research Institute, Wonkwang University, Iksan 570-749, Korea
2
Department of Biodiversity and Bioresources, Satvik Nepal, Dadakonak-27, Pokhara 33700, Nepal
*
Author to whom correspondence should be addressed.
Appl. Sci. 2021, 11(16), 7404; https://doi.org/10.3390/app11167404
Submission received: 10 June 2021 / Revised: 23 July 2021 / Accepted: 3 August 2021 / Published: 12 August 2021

Abstract

:

Featured Application

This research study explored the potential therapeutic role of a herbal formulation F2 in the DIO mice model. The enthusiastic results in DIO mice indicated that F2 has huge potential to develop as a functional food and/or herbal therapy for the treatment of human obesity. The validated UPLC-DAD method would be applicable for the quality control of formulation F2.

Abstract

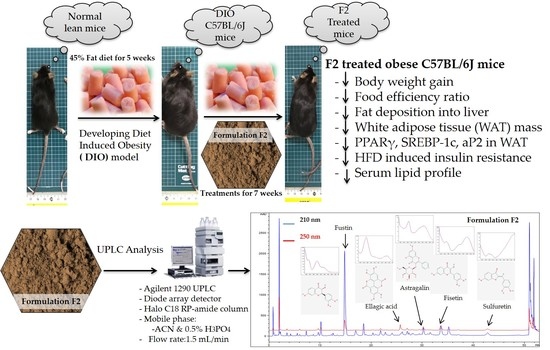
Obesity is considered a chronic metabolic disorder that can be associated with multiple medical complications. Currently, there is no or limited curative therapy for obesity. This study focused on the assessment of anti-obesity activity and UPLC standardization of a polyherbal formulation (F2). An anti-obesity activity was investigated using the diet-induced obese (DIO) mice model, where obesity was developed in C57BL/6J mice by providing a high-fat diet (HFD) for five weeks without treating drugs. After the successful development of obesity, the obese mice were treated with F2 for seven weeks with continuing HFD feeding. The major obesity-related parameters such as body weight gain, food efficiency ratio, serum lipid profile, and white adipose tissue (WAT) mass were found to be significantly reduced in F2 treated obese mice. These results were supported by the down-regulation of specific adipogenic transcription factors (PPARγ, SREBP-1c, and ap2) in epididymal WAT. Histological evaluation of liver and WAT also revealed reduced fat deposition in the tissues by F2 compared to the HFD control group. The overall observations indicated that the F2 exhibited pronounced obesity-controlling activity through the inhibition of adipocyte differentiation and triglyceride accumulation in the tissues, and serum lipid depletion. In addition, F2 ameliorated obesity-induced insulin resistance. Furthermore, the UPLC-DAD method for quality control of F2 was validated and standardized using five reference compounds: astragalin, ellagic acid, fisetin, fustin, and sulfuretin.

Graphical Abstract

1. Introduction

Obesity is considered a chronic metabolic disorder that enables the advent of multiple other metabolic disorders such as cardiovascular diseases, type 2 diabetes, fatty liver disease, and certain cancers [1]. Obesity is further associated with dyslipidemia characterized by elevation of serum total cholesterol, triglyceride (TG), and low-density lipoprotein (LDL)-cholesterol and demotion of high-density lipoprotein (HDL)-cholesterol [2]. Obesity develops as a result of hypertrophy and/or hyperplasia of adipocytes which occurred due to the differentiation of pre-adipocytes through adipogenesis [3]. Adipogenesis is a complex process involving the synergistic action of numerous adipogenic factors. In particular, the essential transcription factors such as peroxisome proliferator-activated receptor-gamma (PPARγ), CAAT/enhancer-binding protein alpha (C/EBPα), adipocyte protein 2 (aP2), and sterol response element-binding protein-1c (SREBP-1c) regulates the whole process of adipogenesis [4,5]. At the maturity stage, C/EBPα and PPARγ combinedly regulate adipogenesis [6]. Therefore, inhibition of these essential adipogenic factors is a potential target to inhibit adipogenesis, and so on obesity [7]. Deletion of PPARγ in adipose tissue ameliorated high fat-diet (HFD) induced obesity and insulin resistance [8]. C/EBPα deficient adipocytes accumulated less lipid in vitro [6].
The complex pathophysiology of obesity requires a multi-dimensional approach to deal with it. While studying anti-obesity activity, a mouse obesity model is a well-characterized and reliable strategy. More than 200 genetic mouse models are practicing obesity-related research. The ob/ob model, lacking leptin production, is an important monogenic model for obesity and diabetes [9]. As most human obesity is developed as a result of high energy consumption, the diet-induced obesity (DIO) model is considered as the most relevant to correlate with human obesity [10]. The pathogenesis of the DIO model mimics that of human obesity in order to increase body weight, dysregulation of serum lipids, dysregulation of glucose metabolism, and insulin resistance. Therefore, DIO is understood as a human-like obesity model [9,10]. The C57BL/6J strain mice are popular for the DIO model as they develop obesity, hyperinsulinemia, hyperglycemia, hepatic steatosis, and insulin resistance on HFD feeding for more than 4 weeks [11].
Obesity can be treated or prevented by assimilating certain interventions such as lifestyle change (diet, exercise, and behavior therapy) and medical or surgical approaches (pharmacotherapy or bariatric surgery). Surgical interventions are utilized to individuals who failed to lose weight based on lifestyle changes [12]. Unfortunately, due to the appearance of numerous mild to life-threatening adverse effects, there are controversies in using pharmaceutical therapies. Though several pharmaceutical anti-obesity drugs have received approval from regulating bodies, many drugs have been withdrawn from the market due to the appearance of psychiatric and cardiac-related adverse effects [13]. Therefore, it is necessary to find a safe, effective, and economic therapy for obesity. Compared to synthetic medicines, therapies based on natural resources are considered safe and more acceptable for obesity [14]. A variety of herbal medicines or natural products including crude extracts, isolated compounds, or herbal formulations have been widely used for weight loss therapy [15]. Due to the presence of a variety of phytoconstituents in polyherbal formulations, they showed multidimensional action in a vast number of ailments. Most of the herbal formulations exhibit a wide therapeutic range showing activity even in low concentrations and are safe at high doses [16]. In addition, herbal formulations have low-cost, are eco-friendly, and are easily available. Therefore, the demands for polyherbal formulations are increasing globally [16,17].
According to the World Health Organization (WHO), more than 80% of the global population still uses traditional and complementary medicines (TCM) for healing. Most TCMs consists of herbal medicine [18]. However, various factors such as geographical location, climate condition, environmental hazards, harvesting methods, and collecting protocols affects the phytochemical variation in plants, and so the quality of herbal medicines [16]. The chemical profile reflects the quality of any herbal medicine, which determines the safety and efficacy of the medicine [19]. Chromatography is the most used analytical technique for exploring the chemical profiles of herbal medicines. Thin-layer chromatography (TLC) is a cheap and rapid technique but high-performance liquid chromatography (HPLC) and ultra-performance liquid chromatography (UPLC) are even more reliable tools to analyze a complex mixture of plant constituents accurately [20,21].
Recently, we have reported the anti-adipogenic activity of herbal formulation F2 in 3T3-L1 adipocytes in vitro and preliminary anti-obesity activity in HFD-fed C57BL/6J mice in vivo [22]. F2 was prepared by mixing specific proportions of a trace amount of royal jelly and lemon juice with ethanol extracts of Orostachys japonica (OJ), Rhus verniciflua (RV), and Geranium thunbergii (GT). Our observations suggested that the ingredients of F2 worked synergistically as in the formulation and inhibited adipocyte differentiation, restricted dietary fat absorption, and reduced fat accumulation in tissues. In addition, F2 showed potential anti-oxidant and blood-glucose-lowering action [22]. The interesting anti-obesity observations encouraged us to evaluate the therapeutic efficacy of F2 for obesity in the DIO mice model. The objectives of this study are to confirm the anti-obesity activity of F2 in the DIO mice model and validate the previously developed analytical method for the standardization of F2. Furthermore, the effect of F2 on HFD-induced insulin resistance was also determined.

2. Materials and Methods

2.1. Preparation of F2

The formulation F2 consists of an ethanol extract from O. japonica, R. verniciflua, G. thunbergii, royal jelly, and lemon juice in a specific proportion. The extraction and preparation procedure of F2 was described in the previous report [22].

2.2. UPLC-DAD Analysis of F2 and Method Validation

The UPLC-DAD method for phytochemical analysis of F2 was described in the previous report [22]. Briefly, a chromatographic solvent system consisting of (A) Acetonitrile and (B) 0.5% Phosphoric acid performed in a gradient flow as (A)/(B) = 1/99 (0 min) → (A)/(B) = 16/84 (30 min; held for 20 min); flow rate was 2 mL/min; and the sample injection volume was 5 μL. The detection wavelength for astragalin, fisetin, sulfuretin, and fustin, was 210 nm and that for ellagic acid was 250 nm. A stock concentration of 20 mg/mL of F2 and 1 mg/mL of each of the standard compounds were prepared in methanol. A dilution of the standard stock solutions was performed for the establishment of a calibration curve.
The described analytical method was validated by linearity, limit of detection (LOD), limit of quantification (LOQ), specificity, and precision, as parameters. Each parameter for the method validation was determined as described in our previous publications [21,23].

2.2.1. Linearity, LOD and LOQ

The stock solutions of the standards were serially diluted into five concentrations; astragalin (15.625–250 µg/mL), fustin (62.5–1000 µg/mL), fisetin (15.625–250 µg/mL), sulfuretin (31.25–500 µg/mL), and ellagic acid (31.25–500 µg/mL). The calibration curves were constructed by plotting peak areas (y-axis) versus concentrations (x-axis, μg/mL) for each analyte in a given range. These solutions were analyzed individually in triplicate for the establishment of the calibration curve. Linearity was appraised by the correlation coefficient (R2) values [21]. The LOD and LOQ were calculated based on the standard deviation (SD) of y-intercepts of regression lines and slope (S) of the calibration curve.
LOD = 3.3 × SDY-intercept/S and LOQ = 10 × SDY-intercept/S

2.2.2. Specificity

The specificity of the analytical method was studied by the assessment of the peak purity of marker compounds in F2. The peak purity was confirmed by comparison of the UV-spectra of marker compounds of F2 to that of the standards obtained from the DAD detector.

2.2.3. Precision

The precision of the analytical method was determined by assessing intra-day and inter-day variability. The intra-day variability was analyzed in four different concentrations of each standard under the optimized conditions on a triplicate run within the same day. Inter-day variability was carried out by using the same concentrations on three consecutive days (interval of 1 day) in the same analytical system. All the investigated data were presented in terms of the relative standard deviation (RSD).

2.3. Quantification of Marker Compounds in F2

The validated UPLC-DAD analytical method was used for the quality evaluation and simultaneous determination of the five marker compounds in F2. F2 was injected at a concentration of 20 mg/mL and the peak area for each marker compound was recorded. The quantity of marker compounds was determined by linear regression using standard curves.

2.4. Experimental Animals

The male C57BL/6J mice (purchased from Central Lab. Animal Inc., Seoul, Korea) were housed and maintained under a pathogen-free environment in controlled conditions (12 h light cycle, room temperature: 24 ± 1 °C, and relative humidity: 50–60%). Mice had free access to a standard chow diet and water for 1 week for adaptation. The Wonkwang University Animal Ethics Committee approved the animal experiment protocols (Approval No.: WKU19-78).
After 1-week of adaptation, mice (age 4 weeks) were randomly divided into four groups (n = 6). A normal diet group was fed with the standard chow diet (normal diet: 5L79 Orient Bio Inc., Seongnam, Korea) consisting of 65.30% carbohydrate, 20.1% protein, and 13.67% fat for 13 weeks. The remaining three groups were fed with a high-fat diet (HFD: Rodent Diet D12451, Research Diets, New Brunswick, NJ, USA) consisting of 35% carbohydrate, 20% protein, and 45% fat. To induce obesity in mice, only HFD was fed for 5 weeks without drug treatment. In 5 weeks, the mice fed with the HFD were considered to induce obesity (as the average body weights of HFD-fed mice was more than 19% higher than the standard diet-fed mice). Thereafter, the DIO mice were treated with the respective drugs or vehicle for another 7 weeks with continued feeding of an HFD. Among three HFD-fed groups, one group was treated with vehicle (0.2% CMC/PBS) orally, considering as an HFD control. The standard diet-fed group was also treated with vehicle. The second HFD-fed group was treated with formulation F2 in a dose of 46 mg/kg, p.o. two times a day (F2-46). By analysing the effectiveness of two used doses in the previous study [22], a single higher dose of F2 (46 mg/kg) was used in this study. The third HFD-fed group was used as a positive control and treated with Garcinia cambogia (GC) in a dose of 200 mg/kg [24], twice daily. Weekly recordings of the body weight and food intake were conducted. Food efficiency ratios (FER) were calculated. At the end of the treatment period, the mice had fasted for 14 to 15 h and blood samples were collected from the eyes, and mice were sacrificed by cervical dislocation. After sacrifice, epididymal white adipose tissue (WAT), liver, kidney, and spleen were isolated and weighed. Liver and WAT were immediately fixed into 10% formalin for histological analysis. Some portions of the adipose tissue were stored at −70 °C for real-time PCR analysis. Fasting blood glucose was measured from the tail blood before sacrifice by using a one-touch glucometer (CareSens ®N, i-sens, Seoul, Korea).
The serum samples were prepared by centrifugation of the collected blood samples (14,000 rpm for 20 min at 4 °C) and then stored at −70 °C for biochemical analysis. The serum levels of triglyceride and total cholesterol were determined using respective assay kits (BioVision, Milpitas, CA, USA) according to the manufacturer’s procedure. The serum insulin was determined by using the Mouse Insulin ELISA Kit (Cat#638-01489, Shibayagi Co. Ltd., Gunma, Japan) according to the manufacturer’s procedure. The homeostasis model assessment of insulin resistance (HOMA-IR) was calculated as follows [25].
HOMA-IR = [Fasting insulin (μU/mL) × fasting glucose (mmol/L)]/22.5.
The histological analyses of tissues (liver and WAT) were conducted by haematoxylin and eosin (H&E) staining using the same method described in the previous report [22].

2.5. Real-Time PCR Analysis

The RNA extraction, cDNA synthesis, and real-time (RT) PCR analysis were performed on epididymal WAT as the same procedure described in the previous report [22]. Briefly, the total RNA from the WAT samples was extracted separately with the QIAzol lysis reagent. The gene expression levels were analyzed by quantitative RT-PCR following the cDNA synthesis process. The primer sequences used in the experiment were shown in the previous report [22]. The mβ-actin was used as a reference gene. The Livak method was used to calculate the relative mRNA expression levels [26].

2.6. Statistical Analysis

Statistically significant differences among multiple groups were determined using a one-way analysis of variance (ANOVA) followed by Dunnett’s multiple range tests, and differences within two groups were determined using unpaired two-tailed Student’s t-test using the GraphPad Prism 4 software. All data are presented as the mean ± standard deviation (SD) or the mean ± standard error means (SEM). A p-value of <0.05 was considered to represent statistically significant differences.

3. Results

3.1. Optimization of Chromatographic Condition

The UPLC chromatographic condition for the analysis of F2 was optimized on the basis of certain conditions such as column type, column temperature, mobile phase, elution system, flow rate, injection volume, running time, and detection wavelength. Various conditions were examined to obtain a suitable method. The best condition was found to be as follows: column type: Halo C18 RP-amide column (150 mm × 2.1 mm, 2 µm particle sizes); column temperature: 40 °C; mobile phase: Acetonitrile (A) and 0.5% Phosphate buffer (B); elution system: gradient flow (A)/(B) = 1/99 (0 min) → (A)/(B) = 16/84 (30 min; held for 20 min); injection volume: 5 μL; flow rate: 2 mL/min; running time: 53 min; detection wavelength: 210 nm and 250 nm. As presented in the previous report [22], the typical UPLC chromatograms of F2, along with standard compounds and individual plant ingredients obtained from the optimized condition, are also shown in Figure 1. The retention times of five marker compounds, fustin, ellagic acid, astragalin, fisetin, and sulfuretin were 14.792, 25.718, 29.445, 33.657, and 42.800 min, respectively.

3.2. Method Validation for Quantitative Analysis

Calibration curves for astragalin, ellagic acid, fisetin, fustin, and sulfuretin were plotted using standard concentrations in the x-axis and respective peak areas in the y-axis. The correlation coefficients (R2) of the standard calibration curves were ≥0.9995, showing good linearity in injected ranges. The LOD and LOQ were determined based on the SD of y-intercepts of regression lines and slope (S). The LOD and LOQ were shown to have values of 3.24 to 8.64 and 9.81 to 26.17, respectively for the standard compounds. The regression equation, correlation coefficients (R2), SD of Y-intercepts, LOD, and LOQ values for each standard compound are listed in Table 1.
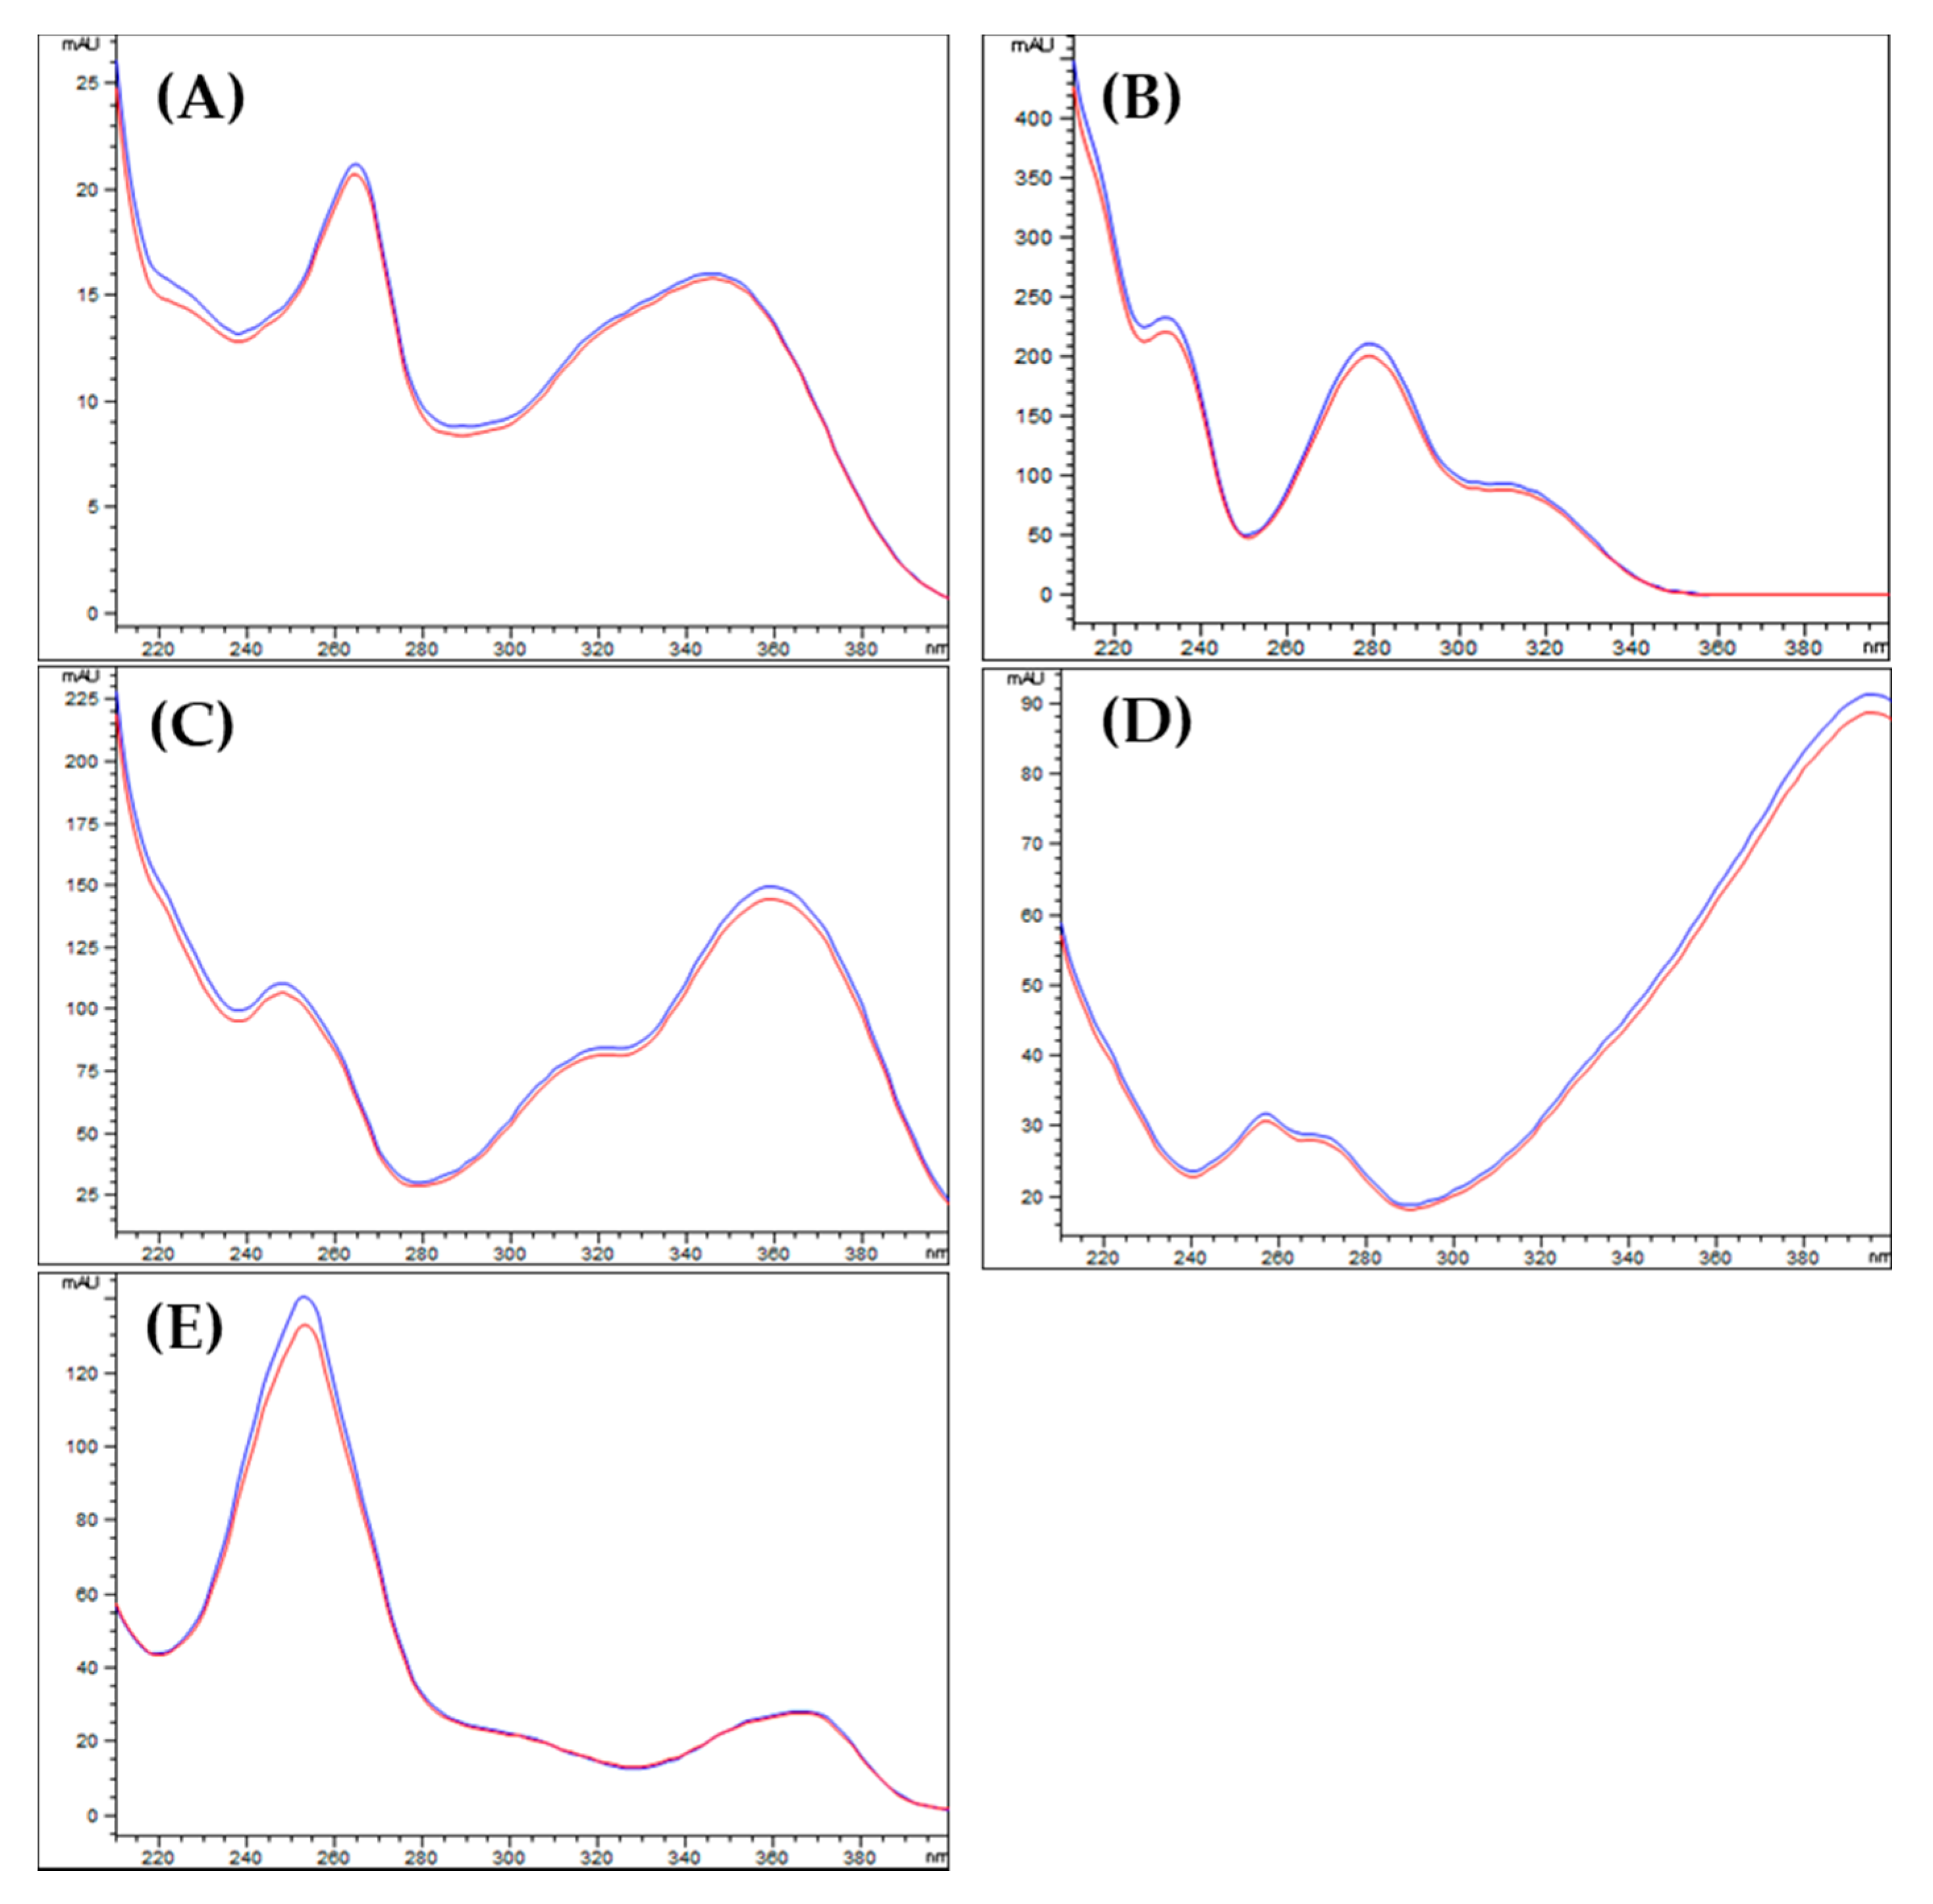
The specificity was evaluated by comparing the peak purity of five marker compounds of the formulation F2 with that of standard compounds. Figure 2 showed that peaks of the marker compounds in F2 were pure and there was no interference by impurities.
The precision of the developed method was determined by intra- and inter-day variability assessment. The analyzed data showed that the RSD of intra-day and inter-day were in the range of 0.64 to 3.95 and 0.94 to 4.34%, respectively (Table 2). None of the precision data exceeded 5%. These data revealed that the described method maintained an acceptable degree of precision.

3.3. Quality Assurance of F2

The quality of F2 is expressed in terms of the content of the marker compound present in it. The content of the marker compounds in F2 is presented in Table 3. Fustin (35.83 mg/g) was found to be abundant whereas ellagic acid (1.82 mg/g) was in the least quantity in F2.

3.4. Induction of Diet-Induced Obesity (DIO) on C57BL/6J Mice

In this study, the DIO mice model was used to assess the anti-obesity activity of F2. The DIO model was used to mimic human obesity. In the DIO model, mice were first induced obesity by feeding with a 45% HFD without treatment of drugs. The level of diet-induced obesity was analysed by comparing mice body weight and weight gain between the standard chow diet and HFD fed groups. The obese state in mice was considered when there was a significant difference in body weight and weight gain. It was observed that the obesity was successfully induced in HFD-fed mice in 5 weeks (stated as ‘obesity induction period’). As presented in Table 4, the body weights of HFD-feeding mice were more than 19% higher, and the weight gains were more than 2.4 times higher than the normal mice during the 5 weeks of the obesity induction period. Once obesity was developed in mice, they were treated with the respective drugs or the vehicle. Mice were treated with the drug samples for 7 weeks thereafter (stated as ‘drug treatment period’). The HFD feeding was continued throughout the drug treatment period.

3.5. Regulation of Body Weight Gain by F2 on Obese Mice

In 5 weeks of the obesity induction period, body weight and weight gain of the high-fat diet-fed groups were found to be significantly increased compared to the standard diet-fed normal group (Figure 3A), confirming the successful development of obesity. After induction of obesity in three HFD fed groups, one group was treated with the blank (0.2% CMC/PBS) as a control (HFD control), and the other two groups were treated with the F2 (46 mg/kg) and GC (200 mg/kg), separately. Normal group was also treated with the blank. The weight gain during the obesity induction period in the F2 and GC groups were 6.25 ± 1.16 g and 6.17 ± 1.70 g, respectively. However, the weight gain for F2 and GC reduced to 3.71 ± 1.29 g and 3.29 ± 0.28 g, respectively, during the 7 weeks of drug treatment period (Table 4). The body weight gain of the HFD control group remained significantly higher compared to the normal group at the end of the experiment. F2 and GC-treated groups showed significant reduction in body weight gain in comparison to the HFD (Figure 3B). Furthermore, the FER, an indication of the amount of food utilized to gain body weight, was significantly reduced in the F2 and GC treated groups compared with the HFD control group (Table 4).

3.6. Effect of F2 on Serum Lipid Profile

The serum total cholesterol and triglycerides were analyzed to determine the effect of F2 on the serum lipid profile. As shown in Figure 4, the levels of both serum lipids were found to be significantly elevated in the HFD control group compared to the normal group. However, the F2 significantly declined the levels of both the serum lipids in comparison to the HFD control group. However, only the triglyceride levels were decreased in the GC-treated group.

3.7. Effect of F2 on Fasting Blood Glucose, Serum Insulin, and HOMA-IR

Mice were subjected to fasting overnight and the blood glucose was measured. There was no observed significant difference in blood glucose among the groups (Table 5). Serum was separated from blood and the insulin concentration was measured. The serum insulin was found to be dramatically increased in the HFD control group in comparison to the normal group. However, the insulin level was significantly reduced by F2 and GC treatment. HOMA-IR is a model of connections between serum insulin and blood glucose which can be then used to predict insulin resistance and pancreatic β-cell function [25]. HOMA-IR index was found to be significantly lower in the normal, F2, and GC groups compared to the HFD control (Table 5). This result suggests that the formulation F2 and GC plays an important role in preventing obesity-induced insulin resistance in mice.

3.8. Effect of F2 on mRNA Expression of Adipogenic Transcription Factors on White Adipose Tissue

The epididymal WAT from mice of the HFD control group and F2-treated group were isolated and immediately stored at −80 °C before performing RT-PCR. RT-PCR was performed to determine the gene expression levels of major adipogenic markers such as PPARγ, C/EBPα, SREBP-1c, aP2, lipoprotein lipase (LPL), adiponectin, leptin, and an inflammatory marker, interleukin-6 (IL-6), on WAT. As shown in Figure 5, the mRNA expression level of some of the key adipogenic transcription factors such as PPARγ, SREBP-1c, aP2, and the inflammatory marker, IL-6, were found to be significantly down-regulated in the WAT of mice treated with F2.

3.9. Effect of F2 on Visceral Organ Weights and Histological Observation

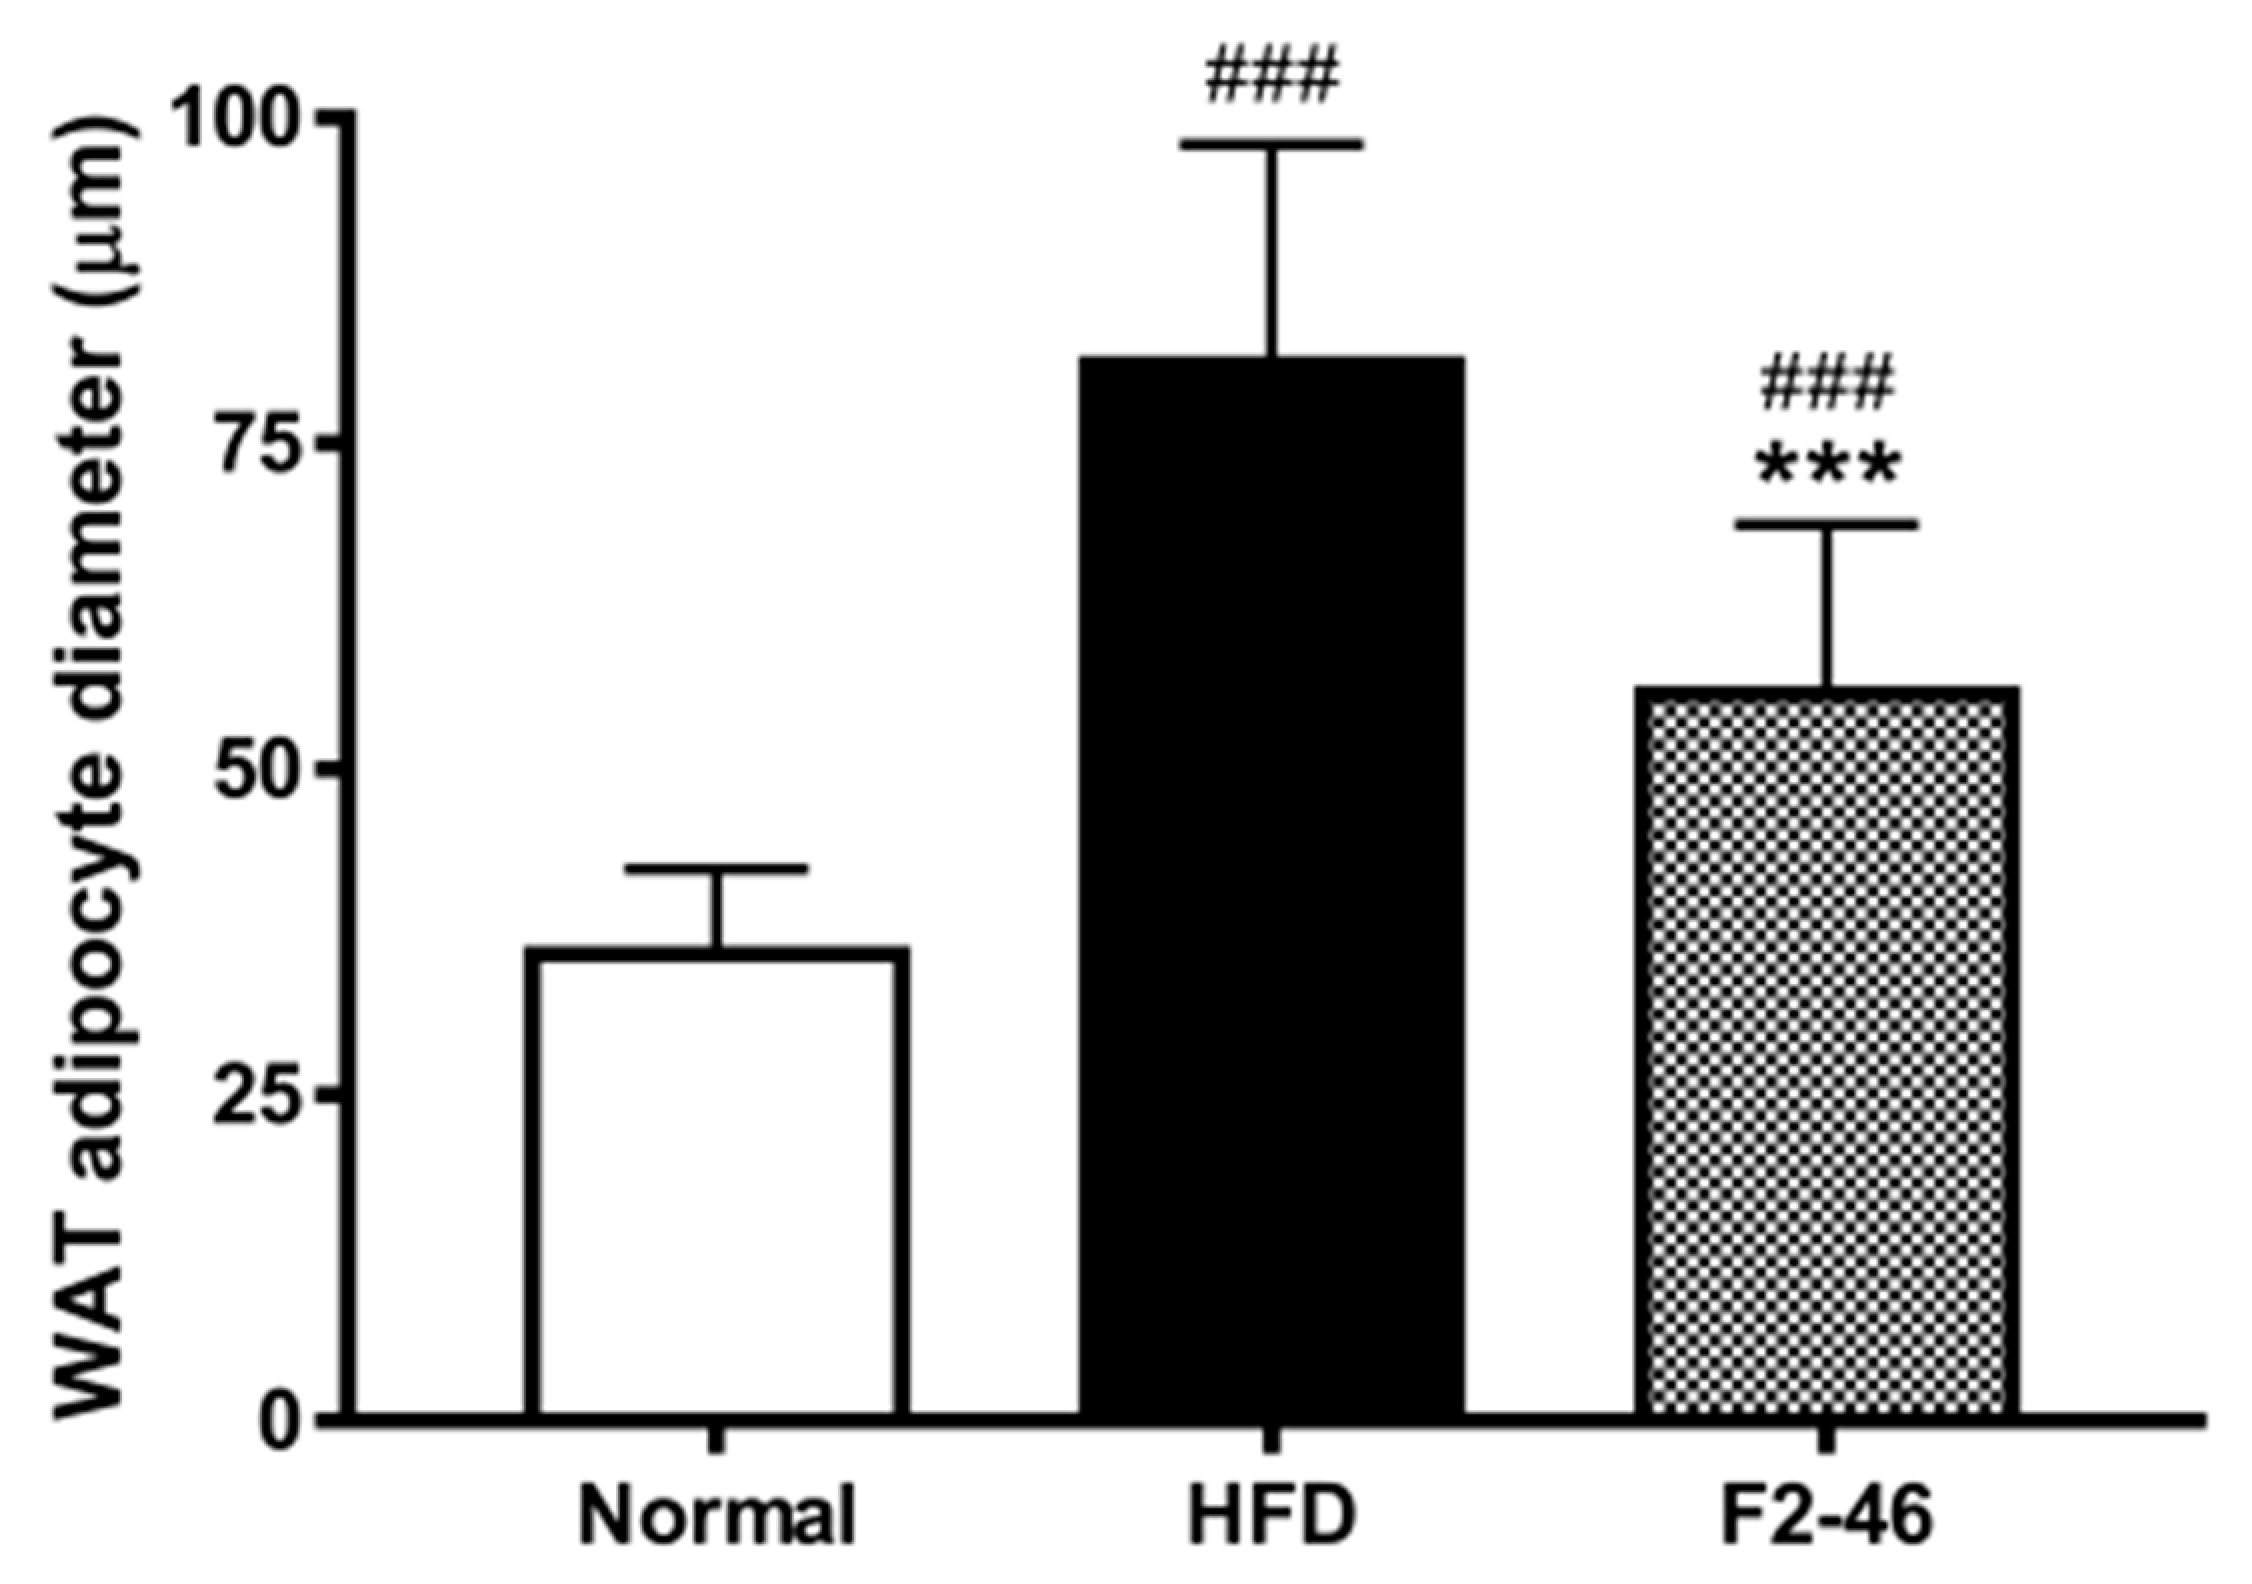
The epididymal WAT, liver, kidney, and spleen were isolated and weights were measured. Moreover, the histological analysis of WAT and liver were performed by H&E staining. The weights of the WAT and liver were increased significantly in the HFD control group compared with that in the normal group. However, the weights of these organs were markedly decreased by F2 and GC (Table 6). Analyzing histological observation of the liver tissue, consumption of an HFD for 12 weeks induced the accumulation of lipid droplets in the liver, indicating the development of liver steatosis (Figure 6). However, F2 significantly ameliorated the lipid accumulation in the liver. Also, the sizes of the adipocytes in the WAT were observed to be enlarged in the HFD control group. While the adipocyte size was significantly reduced by F2 in comparison to the HFD control (Figure 6 and Figure 7).

4. Discussion

Management of overweight and obesity with pharmaceutical medicine comes with many unavoidable adverse effects, high costs, and the physical dependency associated with it. Because of these cons, the use of herbal medicine is increasing globally for the treatment of obesity and related metabolic disorders [27]. In order to prepare an effective anti-obesity herbal formulation, we have developed a novel formulation (F2) by homogenizing specific proportions of a trace amount of lemon juice and royal jelly with ethanol extracts of OJ, RV, and GT [22]. A complete investigation of anti-obesity activity and the standardization of F2 was performed in two consecutive studies. In the first study, the F2 was treated to 3T3-L1 adipocytes to measure its anti-adipogenic efficacy. It was found to exhibit pronounced synergistic anti-adipogenic activity by F2. Furthermore, F2 was co-administered to the HFD fed C57BL/6J mice to investigate the obesity-preventing activity. HFD was used to induce obesity. In the previous animal study, F2 treatment began from the same day of switching mice to an HFD feed. Interestingly, F2 showed a significant effect in controlling body weight, blood glucose, and protection from HFD-induced liver damage [22]. In the present study, we have further examined the anti-obesity activity of this herbal formulation (F2) in DIO mice model, where male C57BL/6J mice were first fed with only HFD for five weeks to develop the DIO model, and only after the successful development of obesity, co-administration of F2 were done. This experimental mouse model may closely resemble obesity in humans and may hypothesize if the formulation F2 is effective for obese humans. F2 was further analyzed using the UPLC-DAD method for its major marker compounds (astragalin, ellagic acid, fisetin, fustin, and sulfuretin). A UPLC-DAD method was optimized and validated for the quality control of the formulation.
It is well-accepted in many studies that the long-term feeding of an HFD induces obesity in rodents [28,29,30,31]. HFD-induced obesity may be characterized by an increase in body weight gain, body fat content, and FER [28,32]. Five weeks of the HFD feeding significantly increased body weight and FER in C57BL/6J mice indicating the development of obesity. The previous studies have also demonstrated that the C57BL/6J mouse strains were more susceptible to HFD-induced obesity [11,29,30,33]. The obese mice were then treated with vehicle, F2, and GC for 7 weeks, along with continuing the HFD. The fruit extract of G. cambogia is a well-accepted anti-obesity agent and is used as a positive control in anti-obesity studies [34,35]. Obesity can be categorized as an incurable chronic disease. The restriction in body weight gain without adverse effects is considered an effective therapy in the management of obesity [13,15]. The body weight gains were found to be significantly reduced in F2 and GC-treated groups during the 7-weeks of drug treatment, with a significant decrement in FER (Table 4). Dietary fat is absorbed only after emulsifying with pancreatic lipase [36]. We have already shown in the previous report that F2 enhanced lipid excretion in feces [22]. Therefore, lower FER in the F2-treated group might be due to an interfering with the pancreatic lipase causing reduced dietary fat absorption. The extent of weight gain in 7-weeks of drug treatment was significantly lower than that in 5-weeks of the obesity induction period (Figure 5). These findings reinforced the FER and weight gain reducing effect of F2 observed in the previous study [22].
Obesity is associated with hyperlipidemia characterized by the elevation of serum total cholesterol and triglyceride (TG) levels [37]. Hyperlipidemia contributes a major pathophysiological role in cardiovascular diseases, stroke, and diabetes [38]. Formulation F2 was found to be effective in reducing serum TG and total cholesterol compared to the HFD control group (Figure 4), indicating that F2 may have a potential in the management of dyslipidemia and associated comorbidities. Previous studies have revealed that an 80% ethanol extract and ethyl acetate fraction of OJ and 70% ethanol extract of GT showed the greatest activity in lowering serum lipids and abdominal fat in rodents [39,40,41]. Long-term consumption of a high-fat diet promotes a high level of circulating lipid species and free fatty acids in rodents [42]. Excess accumulation of such lipids results in adipocyte hypertrophy and, therefore, obesity. The accumulation of lipids into adipocytes during adipogenesis requires a sequential role of various adipogenic factors such as PPARγ, C/EBPα, SREBP-1c, aP2, Leptin, LPL, STATs, FAS, etc. [5,43,44]. The evaluation of WAT for the expression of such adipogenic transcription factors may offer a general idea that the drug samples affect the regulation of adipogenesis. The current study revealed that the gene expression level of PPARγ, SREBP-1c, aP2 were significantly down-regulated in the WAT of F2-treated mice. Whereas C/EBPα, LPL, and leptin expression were perceived as slightly reduced but were not significantly different with the HFD control group (Figure 5). The results indicate that the formulation F2 inhibited adipogenesis in WAT. In addition, an inflammatory cytokine, IL-6, was found to be under-expressed in WAT, indicating the formulation F2 has a positive response in ameliorating obesity-associated inflammatory responses. The secretion of IL-6 and TNFα by adipose tissue in obesity leads to chronic inflammation, and so promotes insulin resistance [28,44]. In the previous report, we showed that the gene expression level of the aforementioned adipogenic transcription factors is down-regulated in F2 treated 3T3-L1 adipocytes [22]. From all the observations, it may be suggested that the anti-obesity action of F2 might be due to the restriction of adipogenesis in adipose tissue.
It is well known that the β cells of pancreatic islets secret insulin to maintain the basal level of blood glucose. In normal conditions, the β cell function and population dynamics are influenced by the blood glucose concentration [45]. Insulin travels through the body and induces muscles and fat cells to absorb glucose. In addition, insulin selectively induces glycogenesis when postprandial blood glucose levels become elevated. Once the blood glucose level returns to its basal level, insulin secretion is also adapted [46]. When the body systems are exposed to high fat for a long time, it may cause an impairment on insulin binding to its receptors and/or glucose transporter in muscle and fat cells, resulting in decreased insulin sensitivity [47]. As a result, pancreatic β cells secret more insulin to cope with peripheral insulin resistance in muscle and adipose tissue to maintain the normal level of blood glucose. This condition has been termed as compensatory hyperinsulinemia [45]. The previous literature has also revealed that dietary high-fat leads to promote insulin resistance and hyperinsulinemia before the development of type 2 diabetes in rodents [48,49,50]. High-fat diet-induced hyperinsulinemia or insulin resistance may occur due to a decrease in the glucose transporter, insulin receptors, and glucose metabolism [10,28]. The systemic insulin resistance was quantified in the term of the HOMA-IR index [25]. In the current study, the serum insulin level was found to be drastically increased in the HFD control group. However, in F2 and GC-treated groups, the insulin level was significantly diminished (Table 5). However, the blood glucose level was not altered among the groups. These observations indicated that the mice were developing compensatory hyperinsulinemia in the HFD control group as a result of partial insulin resistance. F2 and GC were found to ameliorate HFD-induced insulin resistance. In contrast with the observations of the current experiment, the blood glucose level was significantly reduced by F2 compared to the HFD control in the previous study [22]. These findings indicated that the formulation F2 could have preventive effect in controlling the blood glucose level. In other words, seven weeks treatment of F2 in obese mice was effective enough for protection against insulin resistance. Therefore, it may be suggested that the F2 might be effective in reducing the blood glucose level in obese mice if the treatment period would be longer.
The effect of F2 on the weight of visceral organs of obese mice and their histological evaluations were analyzed in the current study following a similar procedure as in the previous study [22]. Similar results were found in both studies that the weights of the WAT in the HFD control group were significantly increased due to the over deposition of lipids into them. Whereas F2 WAT mass was found to be significantly reduced. The fat deposition into WAT was observed by histological analysis and the results showed that the size of adipocytes of the F2-treated mice was reduced compared to the HFD control mice (Figure 6 and Figure 7). In addition, supporting the results of the previous study [22], F2 was found to be effective in reducing the fat deposition into the liver in this study (Figure 6). The massive fat globules into the liver of the HFD control mice in the current study indicated that the long-term consumption of HFD induced severe liver steatosis in obese mice [51]. Though, F2 was found to be rationally effective in the management of liver steatosis. There are some limitations to this study. A complete molecular mechanism of the anti-obesity activity of F2 remains to be investigated. A further study on genetically challenged obesity models (in vitro and/or in vivo) can be used for this approach. The effect of F2 on the protein expression level of adipogenic markers is yet to be investigated.

5. Conclusions

From the overall observations, it can be concluded that the HFD-induced obesity was prevented enough by the administration of F2 in obese mice. In most of the experiments of the present study, F2 (46 mg/kg) exhibited similar results to those of the GC (200 mg/kg), including a reduction in body weight, reduction in food efficiency ratio, and reduction in serum insulin, blood glucose, serum cholesterols, and triglycerides. Furthermore, F2 had inhibited adipogenesis in adipose tissues. The possible mechanisms of F2 in preventing obesity are already explained in the previous report [22]. In addition, the current study explored the insulin resistance ameliorating efficacy of F2. Moreover, F2 alleviated liver steatosis in obese mice. Conclusively, the formulation F2 exhibited a potential therapeutic role in the DIO mice model, which mimics the pathophysiology of human obesity. Therefore, consumption of F2 might be effective for the management of human obesity and obesity-induced insulin resistance. The current study has also provided a validated analytical method for quality control and standardization of the formulation F2.

Author Contributions

H.-J.J. conceptualized, designed, fund acquisition, and supervised the experiments; P.R.P. designed and performed the experiments, analyzed the data, and wrote the initial draft; R.L. and G.L. supported in vivo experimental analysis; A.P. and K.-H.L. supported in performing the UPLC validation; P.R.P., R.L., G.L., A.P. and H.-J.J. revised the final manuscript. All authors have read and agreed to the published version of the manuscript.

Funding

Funding for this research work was received from Wonkwang University, Iksan, Jeonbuk, South Korea in 2019.

Institutional Review Board Statement

Wonkwang University Animal Ethics Committee approved the animal experiment protocols (Approval No.: WKU19-78).

Informed Consent Statement

Not applicable.

Data Availability Statement

The data will be made available upon reasonable request.

Acknowledgments

We give our sincere thanks to the Wonkwang University, Iksan for funding and providing facilities to conduct our study.

Conflicts of Interest

The authors declare no conflict of interest. The funding body had no role in the design of the study; in the collection, analyses, or interpretation of data; in the writing of the manuscript, or in the decision to publish the results.

References

  1. Ananthakumar, T.; Jones, N.R.; Hinton, L.; Aveyard, P. Clinical encounters about obesity: Systematic review of patients’ perspectives. Clin. Obes. 2020, 10, e12347. [Google Scholar] [CrossRef]
  2. Klop, B.; Elte, J.W.F.; Cabezas, M.C. Dyslipidemia in obesity: Mechanisms and potential targets. Nutrients 2013, 5, 1218–1240. [Google Scholar] [CrossRef] [PubMed] [Green Version]
  3. Bae, K.-H.; Kim, W.K.; Lee, S.C. Involvement of protein tyrosine phosphatases in adipogenesis: New anti-obesity targets? BMB Rep. 2012, 45, 700. [Google Scholar] [CrossRef] [PubMed] [Green Version]
  4. Gregoire, F.M. Adipocyte differentiation: From fibroblast to endocrine cell. Exp. Biol. Med. 2001, 226, 997–1002. [Google Scholar] [CrossRef] [PubMed]
  5. Sarjeant, K.; Stephens, J.M. Adipogenesis. Cold Spring Harb. Perspect. Biol. 2012, 4, a008417. [Google Scholar] [CrossRef] [Green Version]
  6. Wu, Z.; Rosen, E.D.; Brun, R.; Hauser, S.; Adelmant, G.; Troy, A.E.; McKeon, C.; Darlington, G.J.; Spiegelman, B.M. Cross-regulation of C/EBPα and PPARγ controls the transcriptional pathway of adipogenesis and insulin sensitivity. Mol. Cell 1999, 3, 151–158. [Google Scholar] [CrossRef]
  7. Jakab, J.; Miškić, B.; Mikšić, Š.; Juranić, B.; Ćosić, V.; Schwarz, D.; Včev, A. Adipogenesis as a potential anti-obesity target: A review of pharmacological treatment and natural products. Diabet. Metab. Synd. Obes. Targets Ther. 2021, 14, 67. [Google Scholar] [CrossRef]
  8. Jones, J.R.; Barrick, C.; Kim, K.-A.; Lindner, J.; Blondeau, B.; Fujimoto, Y.; Shiota, M.; Kesterson, R.A.; Kahn, B.B.; Magnuson, M.A. Deletion of PPARγ in adipose tissues of mice protects against high fat diet-induced obesity and insulin resistance. Proc. Natl. Acad. Sci. USA 2005, 102, 6207–6212. [Google Scholar] [CrossRef] [Green Version]
  9. Barrett, P.; Mercer, J.G.; Morgan, P.J. Preclinical models for obesity research. Dis. Model. Mech. 2016, 9, 1245–1255. [Google Scholar] [CrossRef] [Green Version]
  10. Nilsson, C.; Raun, K.; Yan, F.-F.; Larsen, M.O.; Tang-Christensen, M. Laboratory animals as surrogate models of human obesity. Acta Pharmacol. Sin. 2012, 33, 173–181. [Google Scholar] [CrossRef] [Green Version]
  11. Wang, C.-Y.; Liao, J.K. A mouse model of diet-induced obesity and insulin resistance. Method Mol. Biol. 2012, 821, 421–433. [Google Scholar]
  12. Mallare, J.T.; Karabell, A.H.; Velasquez-Mieyer, P.; Stender, S.R.; Christensen, M.L. Current and future treatment of metabolic syndrome and type 2 diabetes in children and adolescents. Diabet. Spectr. 2005, 18, 220–228. [Google Scholar] [CrossRef] [Green Version]
  13. Kang, J.G.; Park, C.-Y. Anti-obesity drugs: A review about their effects and safety. Diabet. Metab. J. 2012, 36, 13–25. [Google Scholar] [CrossRef] [Green Version]
  14. Torres-Fuentes, C.; Schellekens, H.; Dinan, T.G.; Cryan, J.F. A natural solution for obesity: Bioactives for the prevention and treatment of weight gain. A review. Nutr. Neurosci. 2015, 18, 49–65. [Google Scholar] [CrossRef] [PubMed]
  15. Yun, J.W. Possible anti-obesity therapeutics from nature-review. Phytochemistry 2010, 71, 1625–1641. [Google Scholar] [CrossRef]
  16. Parasuraman, S.; Thing, G.S.; Dhanaraj, S.A. Polyherbal formulation: Concept of ayurveda. Pharmacog. Rev. 2014, 8, 73. [Google Scholar] [CrossRef] [Green Version]
  17. Barik, C.S.; Kanungo, S.K.; Tripathy, N.K.; Panda, J.R.; Padhi, M. A review on therapeutic potential of polyherbal formulations. Int. J. Pharm. Sci. Drug Res. 2015, 7, 211–228. [Google Scholar]
  18. WHO. WHO Global Report on Traditional and Complementary Medicine 2019; World Health Organization: Geneva, Switzerland, 2019. [Google Scholar]
  19. Gao, Q.; Li, J.; Cheung, J.K.H.; Duan, J.; Ding, A.; Cheung, A.W.H.; Zhao, K.; Li, W.Z.; Dong, T.T.; Tsim, K.W.K. Verification of the formulation and efficacy of Danggui Buxue Tang (a decoction of Radix Astragali and Radix Angelicae Sinensis): An exemplifying systematic approach to revealing the complexity of Chinese herbal medicine formulae. Chin. Med. 2007, 2, 12. [Google Scholar] [CrossRef] [Green Version]
  20. Wills, R.B.H.; Bone, K.; Morgan, M. Herbal products: Active constituents, modes of action and quality control. Nutr. Res. Rev. 2000, 13, 47–77. [Google Scholar] [CrossRef]
  21. Poudel, A.; Kim, S.-G.; Lamichhane, R.; Kim, Y.-K.; Jo, H.-K.; Jung, H.-J. Quantitative assessment of traditional oriental herbal formulation Samhwangsasim-tang using UPLC technique. J. Chromatogr. Sci. 2014, 52, 176–185. [Google Scholar] [CrossRef] [Green Version]
  22. Pandeya, P.R.; Lamichhane, R.; Lee, K.-H.; Lamichhane, G.; Kim, S.-G.; Jung, H.-J. Efficacy of a Novel Herbal Formulation (F2) on the Management of Obesity: In Vitro and In Vivo Study. Evid. Based Complemen. Altern. Med. 2021, 2021, 8854915. [Google Scholar] [CrossRef]
  23. Sharma, D.K.; Kim, S.-G.; Lamichhane, R.; Lee, K.-H.; Poudel, A.; Jung, H.-J. Development of UPLC fingerprint with multi-component quantitative analysis for quality consistency evaluation of herbal medicine “Hyangsapyeongwisan”. J. Chromatogr. Sci. 2016, 54, 536–546. [Google Scholar] [CrossRef] [PubMed] [Green Version]
  24. Kim, D.H.; Park, Y.H.; Lee, J.S.; Jeong, H.I.; Lee, K.W.; Kang, T.H. Anti-Obesity Effect of DKB-117 through the Inhibition of Pancreatic Lipase and α-Amylase Activity. Nutrients 2020, 12, 3053. [Google Scholar] [CrossRef] [PubMed]
  25. Muniyappa, R.; Lee, S.; Chen, H.; Quon, M.J. Current approaches for assessing insulin sensitivity and resistance in vivo: Advantages, limitations, and appropriate usage. Am. J. Physiol. Endocrinol. Metab. 2008, 294, E15–E26. [Google Scholar] [CrossRef] [PubMed] [Green Version]
  26. Livak, K.J.; Schmittgen, T.D. Analysis of relative gene expression data using real-time quantitative PCR and the 2−∆∆CT method. Methods 2001, 25, 402–408. [Google Scholar] [CrossRef] [PubMed]
  27. Sengupta, K.; Mishra, A.T.; Rao, M.K.; Sarma, K.V.S.; Krishnaraju, A.V.; Trimurtulu, G. Efficacy and tolerability of a novel herbal formulation for weight management in obese subjects: A randomized double blind placebo controlled clinical study. Lipid Health Dis. 2012, 11, 122. [Google Scholar] [CrossRef] [Green Version]
  28. Hariri, N.; Thibault, L. High-fat diet-induced obesity in animal models. Nutr. Res. Rev. 2010, 23, 270–299. [Google Scholar] [CrossRef] [Green Version]
  29. Rossmeisl, M.; Rim, J.S.; Koza, R.A.; Kozak, L.P. Variation in type 2 diabetes-related traits in mouse strains susceptible to diet-induced obesity. Diabetes 2003, 52, 1958–1966. [Google Scholar] [CrossRef] [Green Version]
  30. Surwit, R.S.; Kuhn, C.M.; Cochrane, C.; McCubbin, J.A.; Feinglos, M.N. Diet-induced type II diabetes in C57BL/6J mice. Diabetes 1988, 37, 1163–1167. [Google Scholar] [CrossRef]
  31. Sclafani, A. Animal models-etiologic classifcation. Int. J. Obes. 1984, 8, 491–508. [Google Scholar]
  32. Yang, Q.-Q.; Suen, P.K.; Zhang, C.-Q.; Mak, W.S.; Gu, M.-H.; Liu, Q.-Q.; Sun, S.S.-M. Improved growth performance, food efficiency, and lysine availability in growing rats fed with lysine-biofortified rice. Sci. Rep. 2017, 7, 1–11. [Google Scholar] [CrossRef] [PubMed] [Green Version]
  33. West, D.B.; Boozer, C.N.; Moody, D.L.; Atkinson, R.L. Dietary obesity in nine inbred mouse strains. Am. J. Physiol. Regul. Integr. Comp. Physiol. 1992, 262, R1025–R1032. [Google Scholar] [CrossRef] [PubMed]
  34. Koh, Y.-M.; Jang, S.-W.; Ahn, T.-W. Anti-obesity effect of Yangkyuksanwha-tang in high-fat diet-induced obese mice. BMC Complement. Altrn. Med. 2019, 19, 1–12. [Google Scholar] [CrossRef] [Green Version]
  35. Lee, Y.-S.; Kim, S.-H.; Yuk, H.J.; Lee, G.-J.; Kim, D.-S. Tetragonia tetragonoides (Pall.) Kuntze (New Zealand Spinach) prevents obesity and hyperuricemia in high-fat diet-induced obese mice. Nutrients 2018, 10, 1087. [Google Scholar] [CrossRef] [Green Version]
  36. Senior, J.R. Intestinal absorption of fats. J. Lipid Res. 1964, 5, 495–521. [Google Scholar] [CrossRef]
  37. Paccaud, F.; Schlter-Fasmeyer, V.; Wietlisbach, V.; Bovet, P. Dyslipidemia and abdominal obesity: An assessment in three general populations. J. Clin. Epidemiol. 2000, 53, 393–400. [Google Scholar] [CrossRef]
  38. Qi, L.; Ding, X.; Tang, W.; Li, Q.; Mao, D.; Wang, Y. Prevalence and risk factors associated with dyslipidemia in Chongqing, China. Int. J. Environ. Res. Public Health 2015, 12, 13455–13465. [Google Scholar] [CrossRef] [Green Version]
  39. Sung, Y.-Y.; Yoon, T.; Yang, W.-K.; Kim, S.J.; Kim, H.K. Anti-obesity effects of Geranium thunbergii extract via improvement of lipid metabolism in high-fat diet-induced obese mice. Mol. Med. Rep. 2011, 4, 1107–1113. [Google Scholar] [CrossRef]
  40. Lee, S.J.; Zhang, G.F.; Sung, N.J. Hypolipidemic and hypoglycemic effects of Orostachys japonicus A. Berger extracts in streptozotocin-induced diabetic rats. Nutr. Res. Pract. 2011, 5, 301–307. [Google Scholar] [CrossRef]
  41. Kim, S.G.; Poudel, A.; Choi, J.W.; Park, H.J.; Lee, Y.S.; Lee, H.S.; Min, B.S.; Jung, H.J. Anti-obesitic effect of Orostachys japonicus in rats model fed a hyperlipidemic diet. Nat. Prod. Sci. 2011, 17, 117–122. [Google Scholar]
  42. Liu, J.; Han, L.; Zhu, L.; Yu, Y. Free fatty acids, not triglycerides, are associated with non-alcoholic liver injury progression in high fat diet induced obese rats. Lipid Health Dis. 2016, 15, 27. [Google Scholar] [CrossRef] [Green Version]
  43. Pandeya, P.R.; Lamichhane, R.; Lee, K.-H.; Kim, S.-G.; Lee, D.-H.; Lee, H.-K.; Jung, H.-J. Bioassay-guided isolation of active anti-adipogenic compound from royal jelly and the study of possible mechanisms. BMC Complement. Altern. Med. 2019, 19, 33. [Google Scholar] [CrossRef] [Green Version]
  44. Vazquez-Vela, M.E.F.; Torres, N.; Tovar, A.R. White adipose tissue as endocrine organ and its role in obesity. Arch. Med. Res. 2008, 39, 715–728. [Google Scholar] [CrossRef] [PubMed]
  45. Wilcox, G. Insulin and insulin resistance. Clin. Biochem. Rev. 2005, 26, 19. [Google Scholar] [PubMed]
  46. Noguchi, R.; Kubota, H.; Yugi, K.; Toyoshima, Y.; Komori, Y.; Soga, T.; Kuroda, S. The selective control of glycolysis, gluconeogenesis and glycogenesis by temporal insulin patterns. Mol. Syst. Biol. 2013, 9, 664. [Google Scholar] [CrossRef] [PubMed]
  47. Lichtenstein, A.H.; Schwab, U.S. Relationship of dietary fat to glucose metabolism. Atherosclerosis 2000, 150, 227–243. [Google Scholar] [CrossRef]
  48. Sinitskaya, N.; Gourmelen, S.; Schuster-Klein, C.; Guardiola-Lemaitre, B.; Pevet, P.; Challet, E. Increasing the fat-to-carbohydrate ratio in a high-fat diet prevents the development of obesity but not a prediabetic state in rats. Clin. Sci. 2007, 113, 417–425. [Google Scholar] [CrossRef] [Green Version]
  49. Barbosa-da-Silva, S.; Bringhenti Sarmento, I.; Lonzetti Bargut, T.C.; Souza-Mello, V.; Barbosa Aguila, M.; Mandarim-de-Lacerda, C.A. Animal Models of Nutritional Induction of Type 2 Diabetes Mellitus. Int. J. Morphol. 2014, 32, 279–293. [Google Scholar] [CrossRef] [Green Version]
  50. Liu, Z.; Patil, I.Y.; Jiang, T.; Sancheti, H.; Walsh, J.P.; Stiles, B.L.; Yin, F.; Cadenas, E. High-fat diet induces hepatic insulin resistance and impairment of synaptic plasticity. PLoS ONE 2015, 10, e0128274. [Google Scholar] [CrossRef]
  51. Eccleston, H.B.; Andringa, K.K.; Betancourt, A.M.; King, A.L.; Mantena, S.K.; Swain, T.M.; Tinsley, H.N.; Nolte, R.N.; Nagy, T.R.; Abrams, G.A. Chronic exposure to a high-fat diet induces hepatic steatosis, impairs nitric oxide bioavailability, and modifies the mitochondrial proteome in mice. Antioxid. Redox Signal. 2011, 15, 447–459. [Google Scholar] [CrossRef] [Green Version]
Figure 1. UPLC chromatograms of Formulation F2 along with standard compounds (ellagic acid, fustin, astragalin, fisetin, sulfuretin) and plant ingredients (O. japonica, R. verniciflua, and G. thunbergii) [22].
Applsci 11 07404 g001
Figure 2. UV spectra of five marker compounds: astragalin (A); fustin (B); fisetin (C); sulfuretin (D); and ellagic acid (E). The blue curves represent the UV spectra of marker compounds assigned as standards, while the red curves represent the UV spectrum of the marker compound in F2.
Applsci 11 07404 g002
Figure 3. Effects of F2 on body weight gain. Mouse body weight was measured every week. Mice were fed with only HFD or standard diet for 5 weeks of the obesity induction period. Obesity was successfully developed in the HFD fed groups in 5-weeks. The obese mice were then treated with F2, GC, or vehicles (0.2% CMC/PBS) for another 7 weeks. The body weight gains (A) during the 5 weeks of the obesity induction period and (B) during the 7 weeks of drug treatment period are presented separately. Values are expressed as the mean ± SD (n = 5 to 6). A one-way ANOVA was applied to calculate statistical significance. @@@ p < 0.001 vs. Normal; ** p < 0.01; and *** p < 0.001 vs. HFD control. Normal = standard diet; HFD = high-fat diet control; F2-46 = F2 (46 mg/kg); GC = G. cambogia (200 mg/kg).
Applsci 11 07404 g003
Figure 4. Effect of F2 on the mice serum lipid profile. The (A) total cholesterol and (B) triglyceride levels were measured in Figure 4. A one-way ANOVA was applied to calculate statistical significance. * p < 0.05; and ** p < 0.01 vs. HFD control. Normal = standard diet; HFD = high-fat diet control; F2-46 = F2 (46 mg/kg); GC = G. cambogia (200 mg/kg).
Applsci 11 07404 g004
Figure 5. Effect of F2 on the mRNA expression levels of PPARγ, C/EBPα, SREBP-1c, aP2, LPL, adiponectin, leptin, and IL-6 in white adipose tissue. β-actin was used as a reference gene. Values are expressed as the mean ± SEM (n = 4). A one-way ANOVA was applied to calculate statistical significance. * p < 0.05 vs. HFD control. HFD = high-fat diet control; F2-46 = F2 (46 mg/kg).
Applsci 11 07404 g005
Figure 6. The effect of formulation F2 on the liver and WAT of obese mice. H&E staining was performed for the histological analysis (magnification ×20). The size of adipocytes in the WAT and deposition of lipid (yellow droplet) in the liver were evaluated. Normal = standard diet; HFD control = high-fat diet control; F2-46 = F2 (46 mg/kg).
Applsci 11 07404 g006
Figure 7. The effect of formulation F2 on the size of adipocytes in the epididymal WAT. The diameter of the adipocytes was evaluated through ImageJ software. Values are expressed as the mean ± SD. A one-way ANOVA was applied to calculate statistical significance. ### p < 0.001 vs. Normal; *** p < 0.001 vs. HFD group. Normal = standard diet; HFD = high-fat diet control; F2-46 = F2 (46 mg/kg).
Applsci 11 07404 g007
Table 1. The UPLC analyzed regression data, LODs, and LOQs for the marker compounds (n = 3).
Standard CompoundsRegression Equation *R2SDY-interceptLOD (µg/mL)LOQ (µg/mL)
Astragaliny = 41.092x + 8.96670.999672.575.8317.66
Fustiny = 43.41x − 27.0170.9999113.618.6426.17
Fisetiny = 46.419x − 204.050.999551.753.6811.15
Sulfuretiny = 37.027x − 28.9630.999753.764.7914.52
Ellagic acidy = 59.779x − 484.890.999558.653.249.81
* y: peak area, x: sample concentration (μg/mL).
Table 2. Analytical results of intra-day and inter-day variability.
Standard CompoundsConcentrations (µg/mL)Intra-Day Variability (n = 3)Inter-Day Variability (n = 3)
Mean ± SDRSDMean ± SDRSD
(µg/mL)(%)(µg/mL)(%)
Astragalin250249.09 ± 2.160.87248.60 ± 8.703.50
125126.19 ± 1.030.82127.86 ± 3.482.72
62.565.04 ± 0.420.6463.34 ± 1.842.90
31.2529.06 ± 0.351.2129.68 ± 1.294.34
Fustin10001001.69 ± 23.820.871000.31 ± 24.692.47
500497.52 ± 6.800.82503.36 ± 13.412.66
250246.18 ± 2.000.64236.88 ± 2.971.26
125128.48 ± 2.731.21135.98 ± 3.582.63
Fisetin250248.50 ± 3.031.22251.73 ± 4.951.97
125128.18 ± 1.521.18122.69 ± 4.193.41
62.563.32 ± 0.651.0359.16 ± 1.151.95
31.2529.05 ± 0.993.4231.61 ± 0.782.47
Sulfuretin500502.49 ± 9.771.95501.72 ± 4.690.94
250244.11 ± 2.240.92249.96 ± 5.102.04
125125.61 ± 1.731.38115.68 ± 2.221.92
62.564.50 ± 2.553.9564.85 ± 1.852.86
Ellagic acid 500503.36 ± 3.370.67499.81 ± 12.872.57
250243.48 ± 9.543.92247.05 ± 9.303.76
125122.53 ± 1.060.87133.33 ± 5.764.32
62.565.07 ± 0.871.3460.95 ± 2.233.65
Table 3. Content of marker compounds in F2.
Marker CompoundsAmount in F2 (mg/g)
Astragalin3.64
Fustin35.83
Fisetin5.90
Sulfuretin3.22
Ellagic acid1.82
Table 4. Diet-induced obesity and controlling of weight gain by F2 in obese mice.
NormalHFDF2-46GC
Initial body weight (g)19.35 ± 1.0220.02 ± 1.2920.23 ± 1.0319.67 ± 0.63
Body weight after 5-weeks of obesity induction period (g)21.85 ± 1.22 **26.06 ± 1.1026.49 ± 1.8425.84 ± 2.01
Body weight gain in 5-weeks of obesity induction period (g)2.51 ± 0.51 ***6.04 ± 1.546.25 ± 1.166.17 ± 1.70
Final weight after 7-weeks of drug treatment period (g)23.97 ± 1.36 ***31.70 ± 1.1430.20 ± 2.5329.14 ± 2.00
Weight gain during 7-weeks of drug treatment period (g)2.11 ± 0.50 ***5.63 ± 1.003.71 ± 1.29 **3.29 ± 0.28 ***
Food intake during 7-weeks of the drug treatment period (g /mice)139.94101.92100.52101.38
Food efficiency ratio (%)1.51 ± 0.35 ***5.53 ± 0.993.69 ± 1.28 **3.25 ± 0.28 ***
The body weight and food intake were measured every week. FER was calculated as follows: FER (%) = body weight gain (g) × 100/ food intake (g). Values are expressed as the mean ± SD (n = 5 to 6). A one-way ANOVA was applied to calculate statistical significance. ** p < 0.01; and *** p < 0.001 vs. HFD control. Normal = standard diet; HFD = high-fat diet control; F2-46 = F2 (46 mg/kg); GC = G. cambogia (200 mg/kg).
Table 5. Effect of F2 on fasting blood glucose, serum insulin, and HOMA-IR.
GroupsSerum Insulin (µIU/mL)Blood Glucose (mmol/L)HOMA-IR
Normal4.12 ± 0.89 **7.78 ± 0.861.44 ± 0.42 **
HFD20.87 ± 12.668.57 ± 1.178.09 ± 5.18
F2-4610.18 ± 2.01 *8.28 ± 1.053.68 ± 0.45 *
GC4.69 ± 2.10 **8.63 ± 1.431.86 ± 1.12 **
HOMA-IR was calculated as follows: fasting glucose (mmol/L) xfasting insulin (μIU/mL)/22.5. Values are expressed as the mean ± SD (n = 5 to 6). A one-way ANOVA was applied to calculate statistical significance. * p < 0.05; and ** p < 0.01 vs. HFD control. Normal = standard diet; HFD = high-fat diet control; F2-46 = F2 (46 mg/kg); GC = G. cambogia (200 mg/kg).
Table 6. Effect of formulation F2 on organ weights.
GroupsWAT (g)Liver (g)Kidney (g)Spleen (mg)
Normal0.39 ± 0.07 ***0.93 ± 0.05 ***0.29 ± 0.0260.42 ± 6.50
HFD2.07 ± 0.121.06 ± 0.040.31 ± 0.0262.64 ± 6.84
F2-461.63 ± 0.29 **0.92 ± 0.04 ***0.31 ± 0.0261.70 ± 6.78
GC1.32 ± 0.26 ***0.82 ± 0.08 ***0.29 ± 0.01 *58.03 ± 9.34
Values are expressed as the mean ± SD (n = 5 to 6). A one-way ANOVA was applied to calculate statistical significance. * p < 0.05; ** p < 0.01; and *** p < 0.001 vs. HFD control. Normal = standard diet; HFD = high-fat diet control; F2-46 = F2 (46 mg/kg); GC = G. cambogia (200 mg/kg).
Publisher’s Note: MDPI stays neutral with regard to jurisdictional claims in published maps and institutional affiliations.