Abstract
Problems in fracture mechanics are difficult when the appropriate analysis is unspecified, which is very common in most real-life situations. Finite element modeling is thus demonstrated to be an essential technique to overcome these problems. There are currently various software tools available for modeling fracture mechanics problems, but they are usually difficult to use, and obtaining accurate results is not an obvious task. This paper illustrates some procedures in two finite element programs to solve problems in two- and three-dimensional linear-elastic fracture mechanics, and an educational proposal is made to use this software for a better understanding of fracture mechanics. Crack modeling was done in a variety of ways depending on the software. The first is the well-known ANSYS, which is usually utilized in industry, and the second was a freely distributed code, called FRANC2D/L, from Cornell University. These software applications were used to predict the fatigue crack growth path as well as the associated stress intensity factors. The predicted results demonstrate that the fatigue crack is turned towards the hole. The fatigue crack growth paths are influenced by the varying positions and sizes of single holes, while two symmetrically distributed holes have no effect on the fatigue crack growth direction. The findings of the study agree with other experimental crack propagation studies presented in the literature that reveal similar crack propagation trajectory observations.
1. Introduction
The main objective of fracture mechanics is to determine whether or not a structure will fail based on the presence of a crack. Crack analysis should start from field stresses in the crack tip, which are evaluated by the equivalent stress intensity factor (Keq). By comparing the Keq value to a material fracture toughness or threshold stress intensity factor, it is possible to determine whether or not a crack member would fail when subjected to static or fatigue loading, respectively. The prediction of curvilinear fatigue and fractures remains a topic of ongoing research. Few curved crack path propagation solutions have been obtained by mathematical analysis, but computational approaches can accurately reproduce experimental results [1,2,3]. Numerical simulations typically calculate the energy derivatives in the first order with respect to crack length or the equivalent stress intensity factors. A number of computational methods can be used to simulate a growing crack, including the mesh-free method and the bounding element method. However, as a versatile method to simulate crack propagation, the finite element method is still popular. For the safety and reliability of engineering structures, it is important to predict the crack propagation path. Therefore, in many industries, the accurate estimation of the crack path and fatigue life estimation are of primary importance in terms of the need for reliability. In various applications, such as aerospace manufacturing, experimental studies are necessary for fatigue analysis. However, due to high costs, a precise computational method is required for crack propagation analysis to predict the direction of crack growth and fatigue lifetime under static and dynamic loading conditions [4,5,6]. Failure is related to (a) the presence of flaws such as interfaces, cracks, and (b) the nature of loads that fluctuate. Cracks tend to initiate and propagate when subjected to fluctuating loads until a point when the structure does not bear the load, which contributes to complete failure. These cracks are considered fatigue cracks, and the expected life is one of the major parameters to determine the safety of the structure. This is computed by adding the number of loading cycles needed to nucleate the fatigue crack and lead to failure. The calculation of the growth rate of the crack is usually based on the relation between the range of stress intensity factors (SIFs) and the crack geometry. One way to predict SIFs is by using computational methods such as the extended finite element method. In general, the initiation and propagation of cracks must be associated with SIFs in a complicated way [7,8,9,10]. The extended finite element method (XFEM) proposed by Belytschko and Black in 1999 [11] has been widely used in recent studies. It is based on the standard finite element framework and uses a special displacement feature to allow discontinuities to occur, overcoming the need to re-mesh continuously throughout the crack tip expansion process. To evaluate SIF, XFEM [12,13,14] was used to perform crack growth analysis without updating the mesh [15]. Extensive work was undertaken to develop efficient models to evaluate the FCG and fatigue life in order to overcome fatigue failures. There are several experimental models proposed, but performing the experimental procedures is usually time-consuming and costly. An effective way to reduce the laboratory work, time, and costs is to incorporate a simulation methodology that involves numerical analysis and uses ANSYS APDL.19.2. Many fatigue crack problems identified to date by the literature use different computational approaches in terms of simulation for simple and complex geometries in two and three dimensions [3,4,16,17,18,19,20,21,22,23,24]. The present work, therefore, uses the ANSYS APDL 19.2 to accurately predict the mixed-mode stress intensity factors as well as the associated fatigue life for seven specimens of the modified compact tension specimen (MCTS). In particular, three methods have been widely used to illustrate the fatigue assessment of materials, the method of fracture mechanics developed by Paris and Erdogan [25], the method of strain-life independently proposed by Coffin [26], and the method of stress-life proposed by Wöhler [27]. The first approach was employed in this study for predicting fatigue life, by which the crack tip can be described separately by the SIFs. The main motivation for the present work was to make a comprehensive comparison between the predicted results for crack propagation parameters using the 2D FRANC2D/L software and the 3D ANSYS software as an alternative tool for simulating fatigue crack propagation problems under mixed-mode loading. In aircraft manufacturing, an open hole is a conventional structural component that is used to fasten individual parts into the integrated structure. Metal sheets, for example, are fastened together to form the aircraft skin through fastener holes. Due to discontinuous geometries such as holes, voids, and inclusions, components that have been subjected to fatigue loadings during service are easily cracked in places where stress is concentrated. Accurate accounting of crack growth is key technology for avoiding catastrophic accidents.
2. Mixed Mode Fatigue Life Evaluation Procedure Using ANSYS
ANSYS can model three kinds of cracks: arbitrary, semi-elliptical, and pre-meshed. The pre-meshed crack method requires the crack front used by the Smart Crack growth analysis tool (SMART), whereby the stress intensity factor is the criterion of failure. The node sets that have been rendered will be distributed to the front of the crack and to the top and bottom of the crack. The latest feature presented in ANSYS is the “Smart Crack Growth,” mesh-based tetrahedron, which adds the “pre-meshed crack” requirement after completion in which the user can choose the type of crack growth option. To accommodate the crack growth changes, SMART uses a combination of automatic morphing, adaptive, and remeshing methods. SMART automatically updates the mesh from crack-geometry changes caused by crack growth at each solution step. Mesh updates occur exclusively around the crack-front region and are integrated into the Mechanical APDL solver without exiting and reentering the solver, leading in a computationally efficient crack-growth solution. The mesh around the crack tip can be refined using the process of the sphere of influence around the geometric edge that passes through the thickness. The geometric regions to be described are the crack tip, the top surface of the crack, and the bottom surface of the crack. Instead, each of these regions is associated with a node set to be used for analysis. The ANSYS software considers mixed-mode loading, where the maximum circumferential stress criterion is implemented. The following are the formulas for the direction of crack propagation in ANSYS [28,29]:
where KI = Max KI during cyclic loading and KII = Max KII during cyclic loading.
In ANSYS Mechanical APDL 19.2, by using XFEM, the simulation of crack growth is restricted to region II of the typical fatigue crack growth graph, which can be represented as:
From Equation (2), for a crack increment, the number of life cycles of fatigue may be predicted as:
The equivalent range for the stress intensity factor formula can be found as follows [28]:
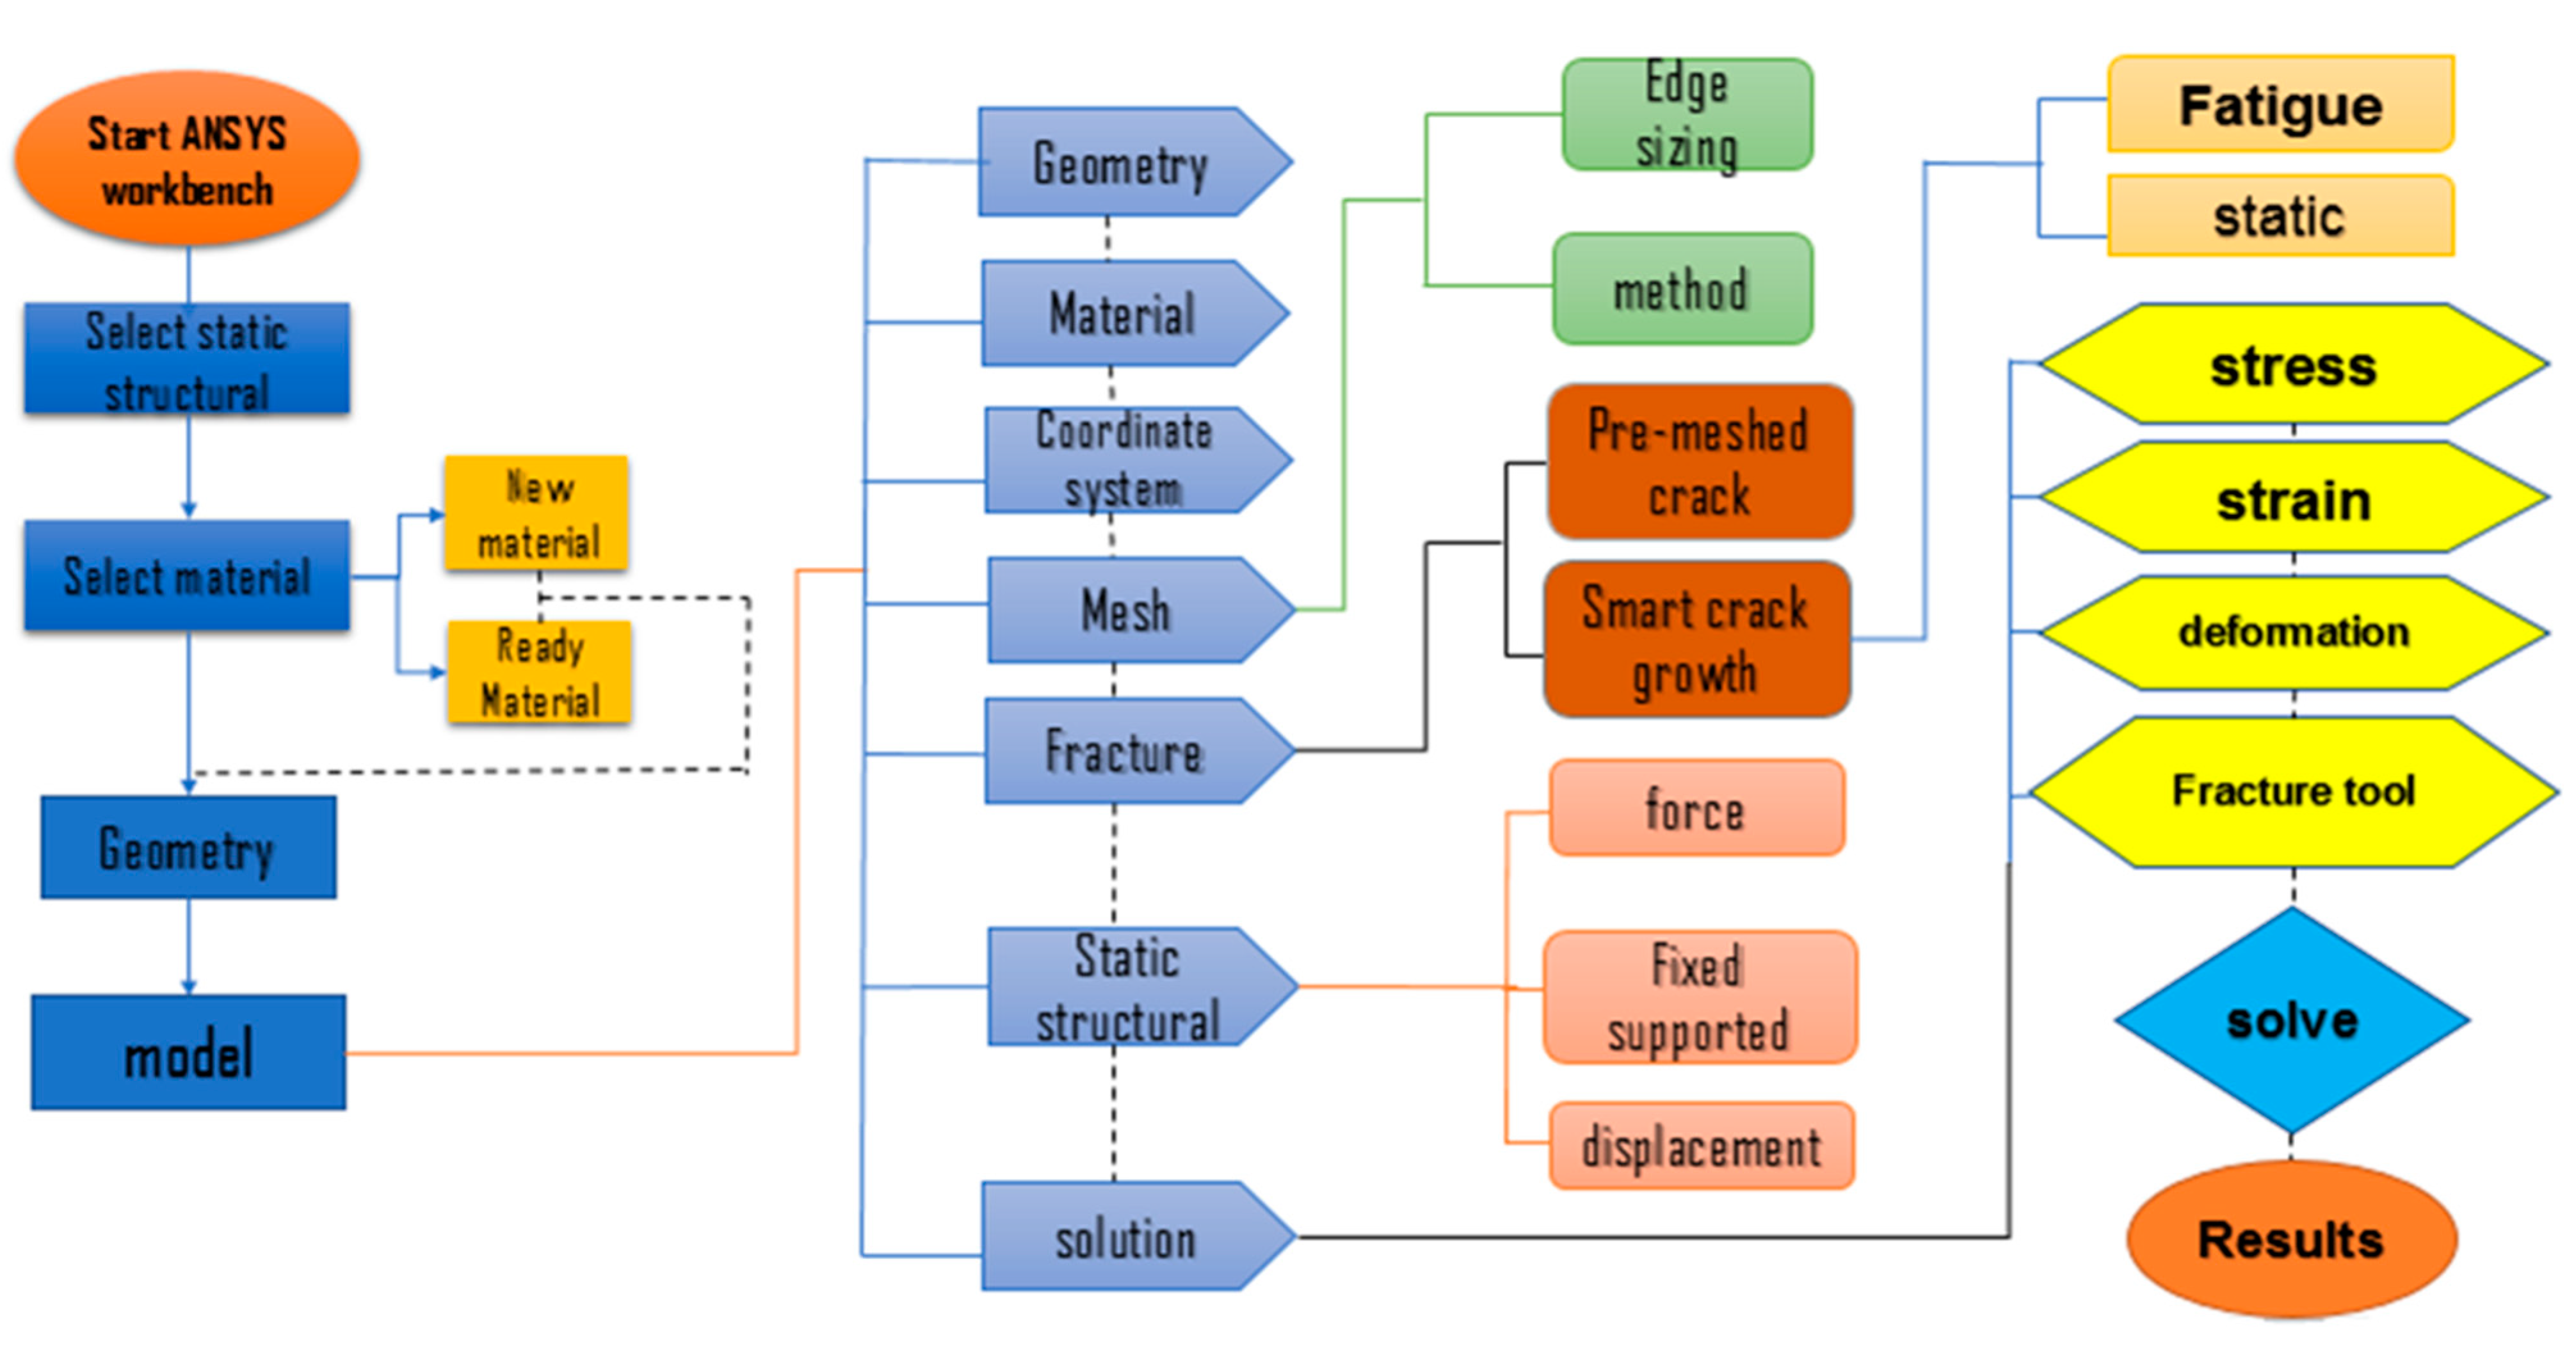
where = the stress intensity factor range in mode I loading and = the stress intensity factor range in mode II loading. The ANSYS flow chart is shown in Figure 1.

Figure 1.
ANSYS flow chart for SMART crack growth simulations.
3. FRANC2D/L Procedure
The Cornell Fracture Mechanics Group at Cornell University developed the free two-dimensional fracture analysis software FRANC2D/L, which was funded by the US National Science Foundation, NASA, the US Navy, and other agencies [19]. The FRANC2D/L analysis was carried out in two stages with CASCA, which is a mesh generator with the capability to produce different types of mesh. In the second part, the boundary conditions, problem characteristics, stress analysis, input crack singularities, crack propagation, and the problem conclusion were determined [30,31]. In FRANC2D, the stress intensity factor was determined using the J-Integral method, which was calculated using the equivalent domain integral method, and the Energy Release Rate method, which was calculated using the crack-closing method. The crack growth direction was predicted using the maximum circumferential stress criterion, the fatigue crack growth rate was calculated based on Paris law equation, and stress intensity factors were calculated using the J-integral method with the same procedure used in ANSYS. In FRANC2D/L, the automated remeshing approach is to delete the elements around the crack tip, move the crack tip, and then insert a trial mesh to connect the new crack to the old mesh. The step-by-step procedure of the FRANCD2D/L software is illustrated in Figure 2.
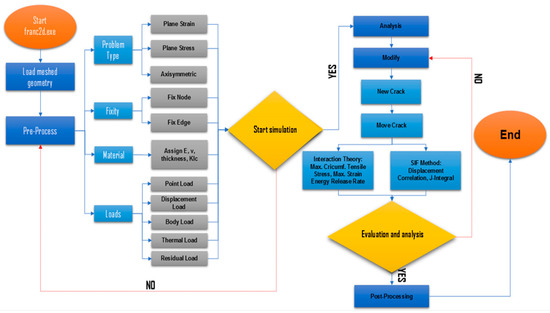
Figure 2.
FRANC2D/L procedure for crack propagation.
4. Results and Discussion
4.1. Modified Compact Tension Specimen (MCTS)
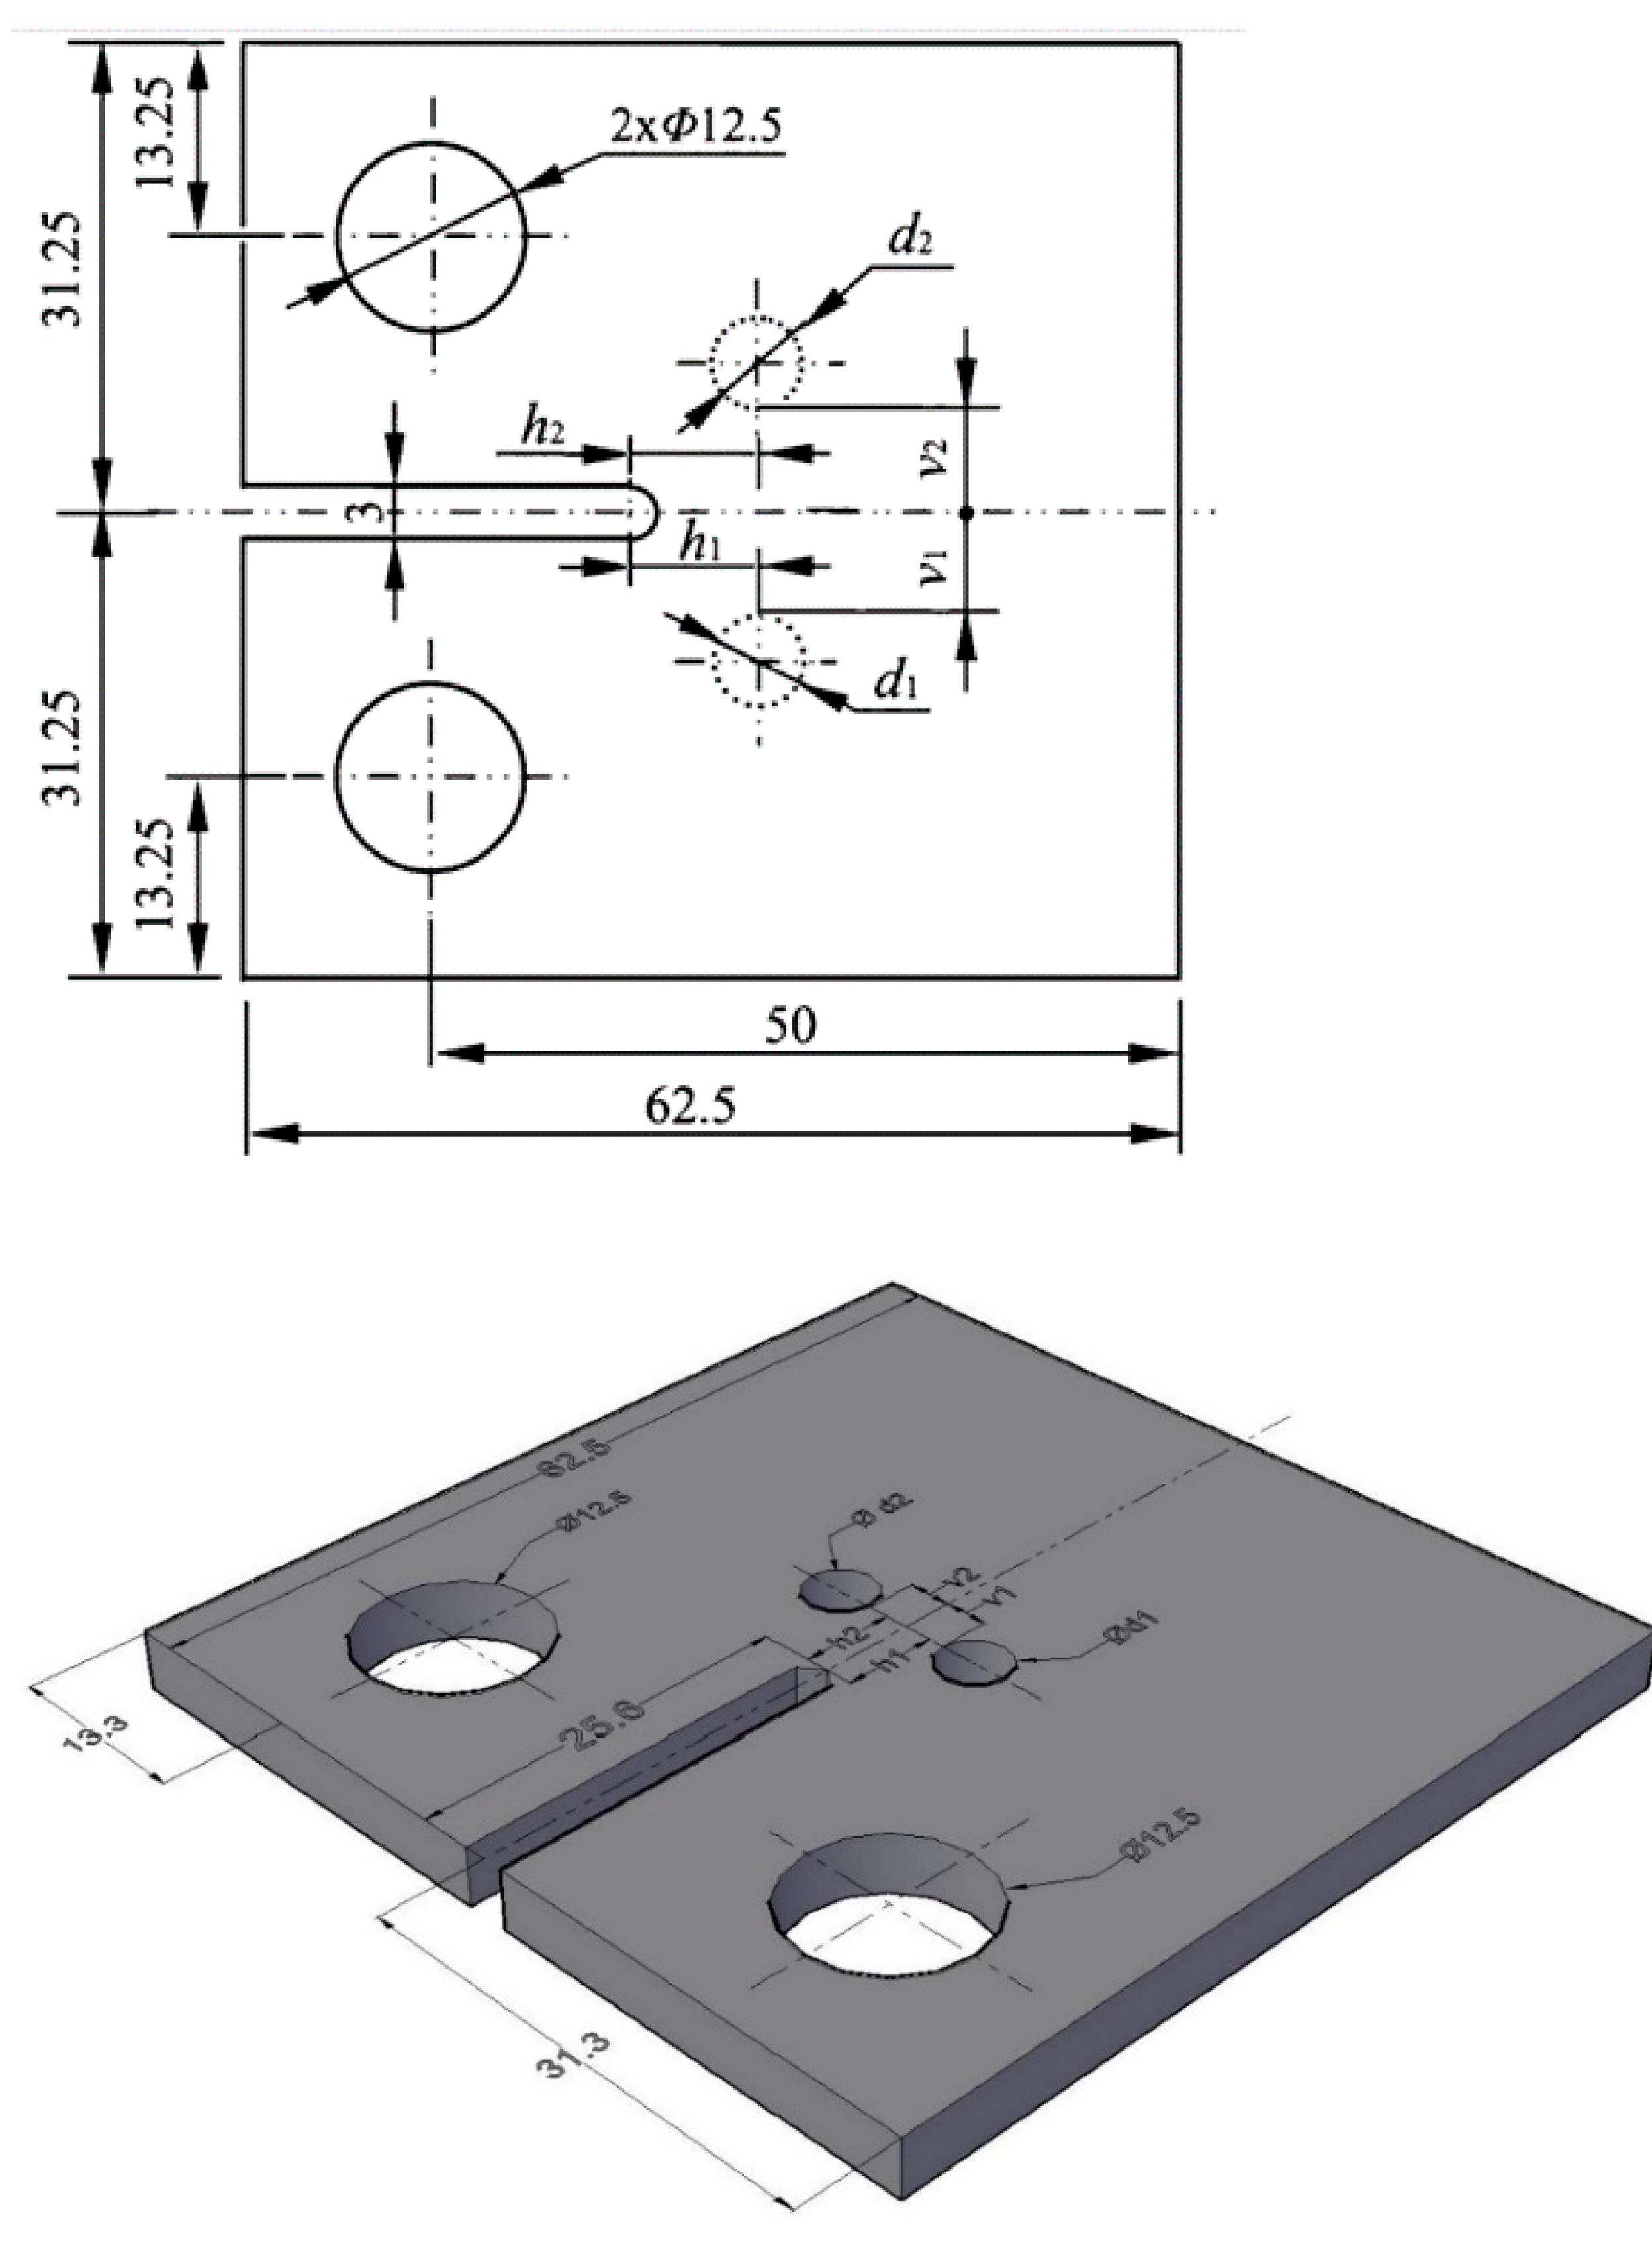
The crack path and other fracture parameters for seven modified compact tension specimens with different geometrical parameters depending on the hole location as shown in Table 1 are computed in this section. To investigate the influence of a hole on the fatigue crack growth path, a series of specimens with various holes were provided by varying their sizes and positions, as seen in Table 1. Both FRANC2D/L and ANSYS Mechanical were used to simulate each geometry. The studied material in this study is 7075-T6 aluminum alloy, which is commonly used in the aerospace industry for structural parts. The material has Young’s modulus of 72 GPa, a Poisson’s ratio of 0.3, and fracture toughness of 29.66 Mpa m0.5. Figure 3 shows a schematic representation of the specimen, which has a thickness of 4 mm with a plane stress state. The horizontal distance from the hole’s origin to the center of the semi-circle is h1, and the shortest distance from its edge to the symmetrical axis of the specimen is v1. The corresponding values for a hole with a diameter of d2 are h2 and v2, respectively, which were adopted from the experimental data reported by [32].

Table 1.
Geometrical parameters for MCTS.

Figure 3.
2D and 3D Schematic representation of specimen.
Table 2 shows the variation in the mesh density in both software FRANC2D/L and ANSYS Workbench.
Table 2.
Number of nodes and elements of the specimens in Franc2D/L and ANSYS.
4.1.1. G1 and G2 Specimens
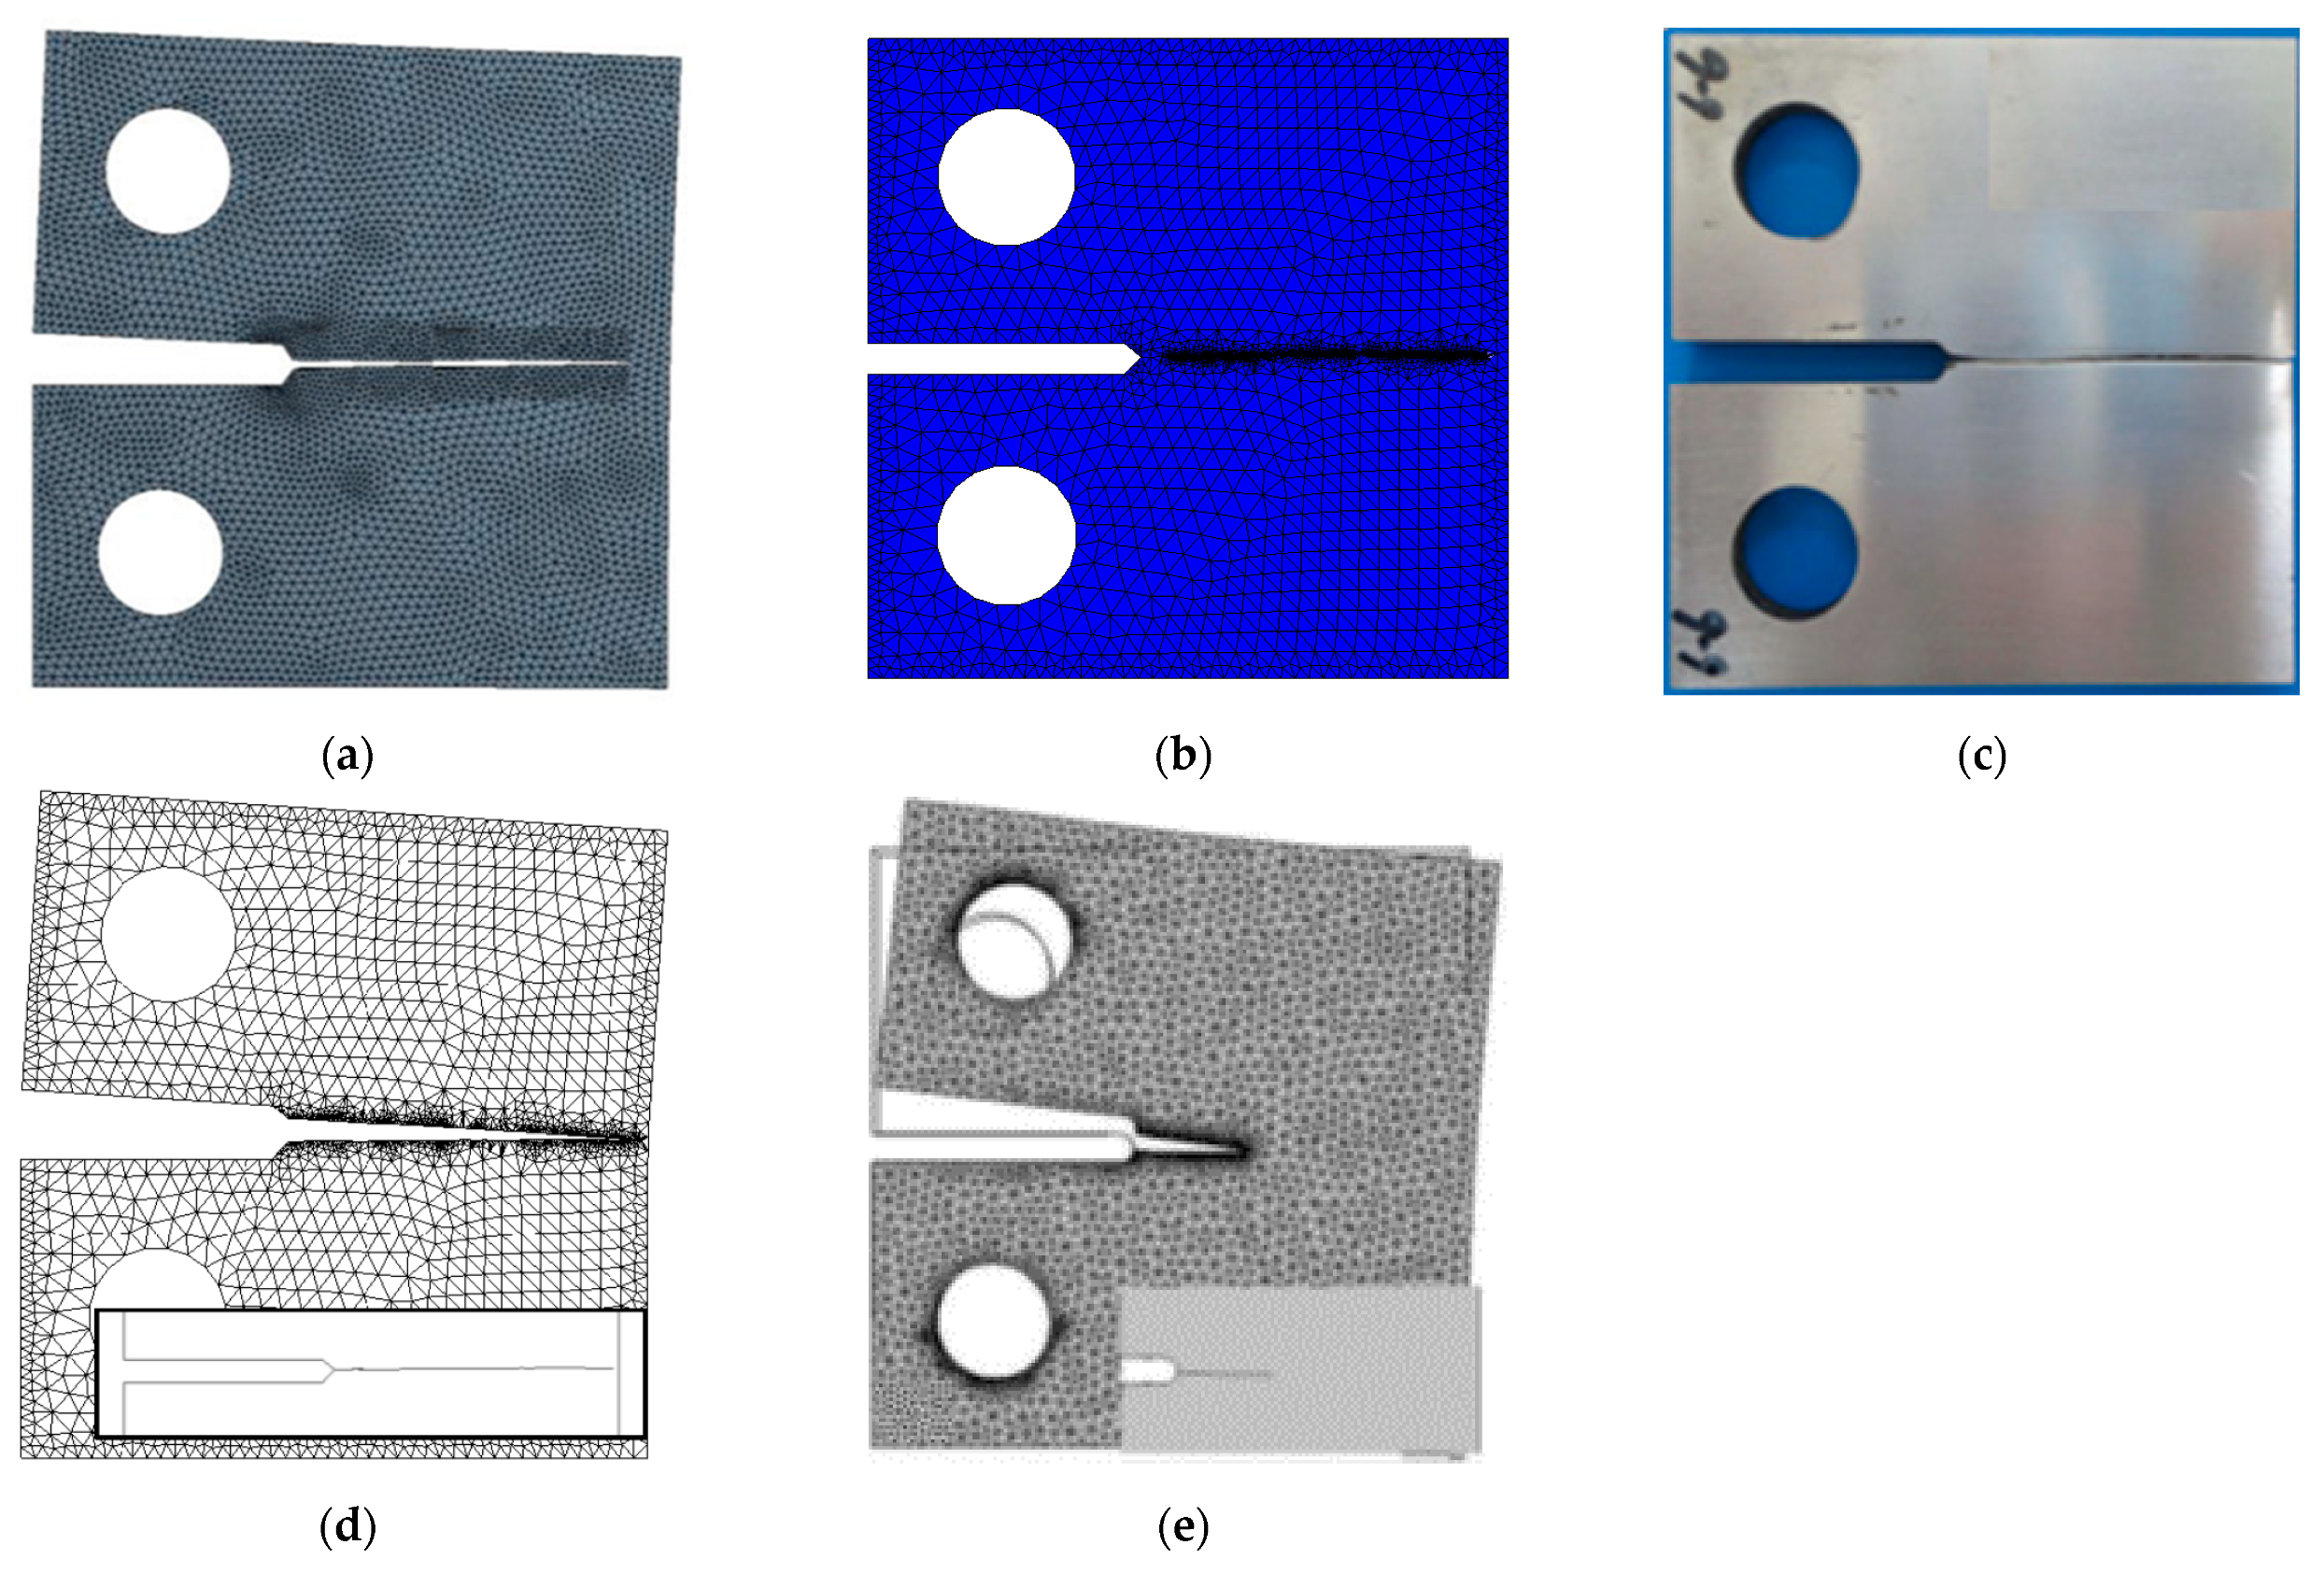
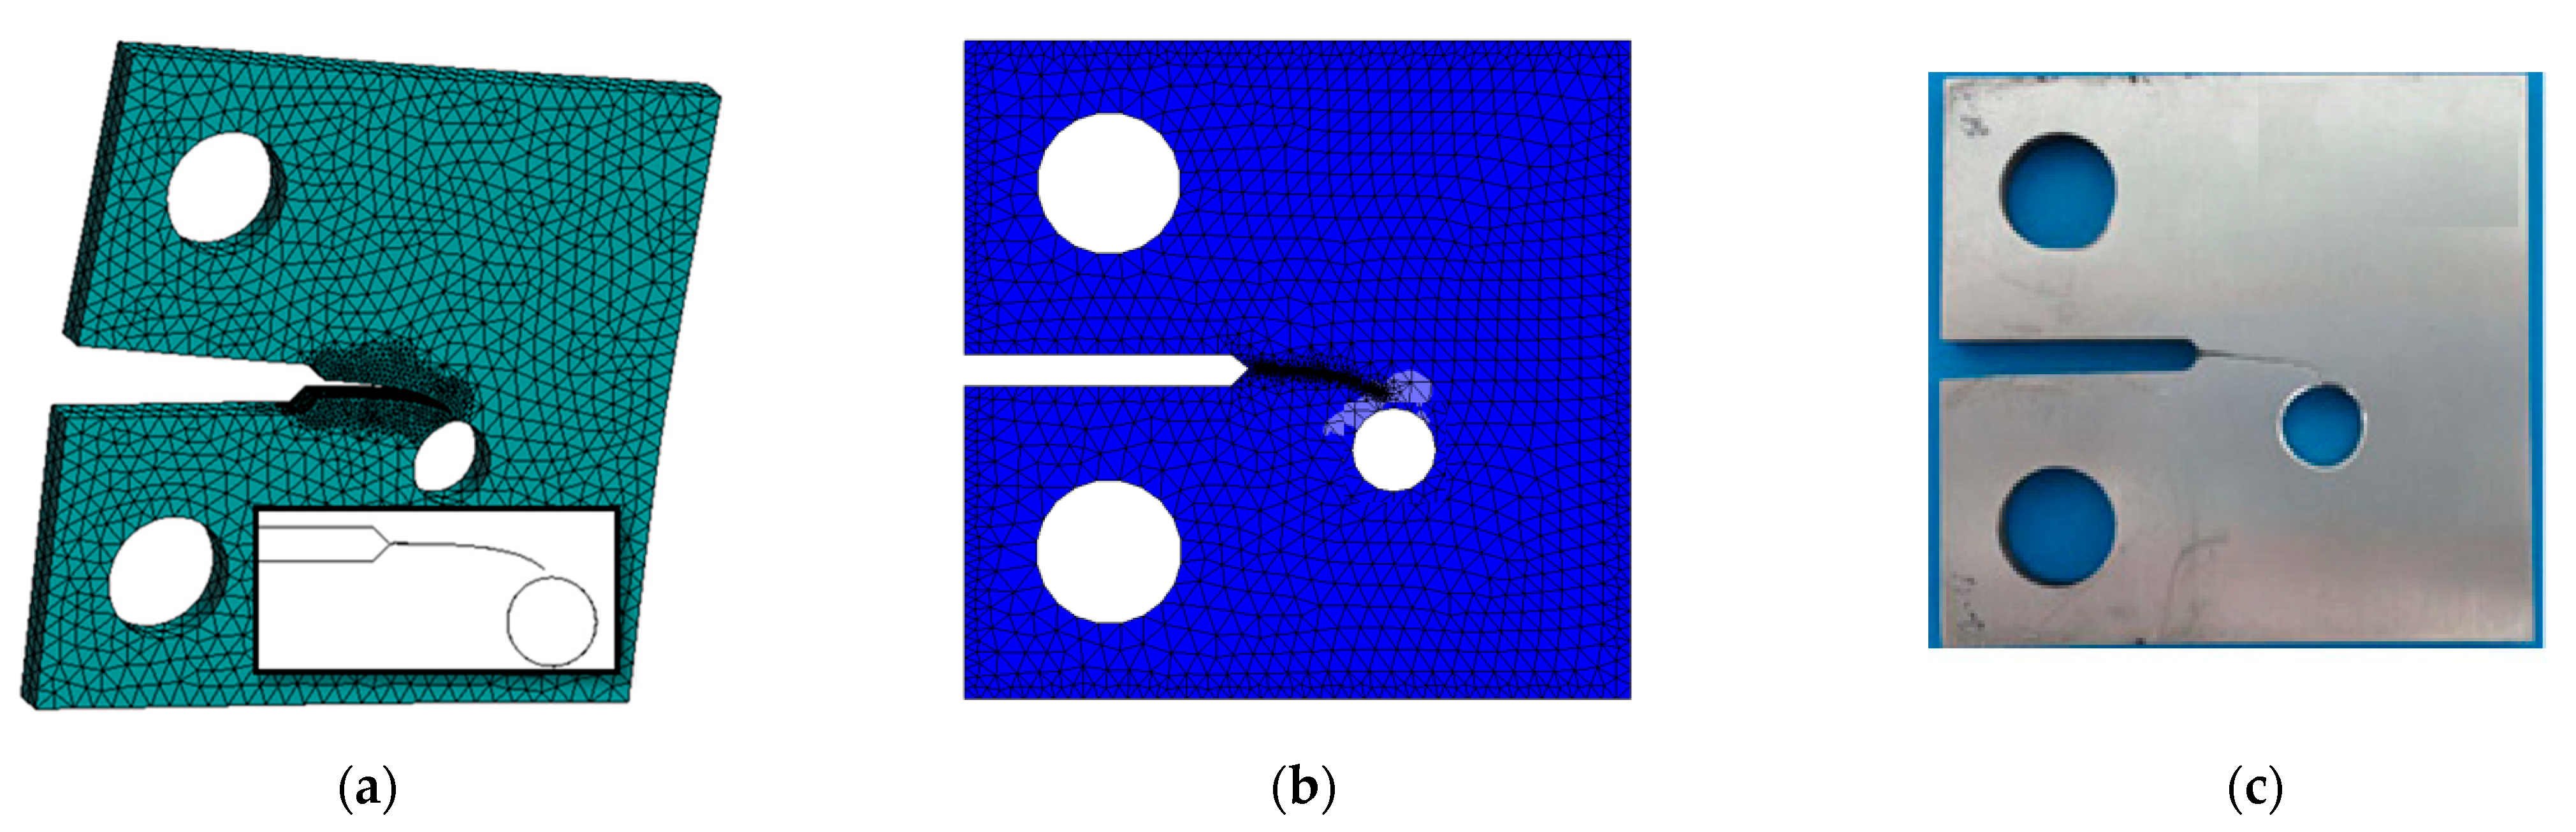
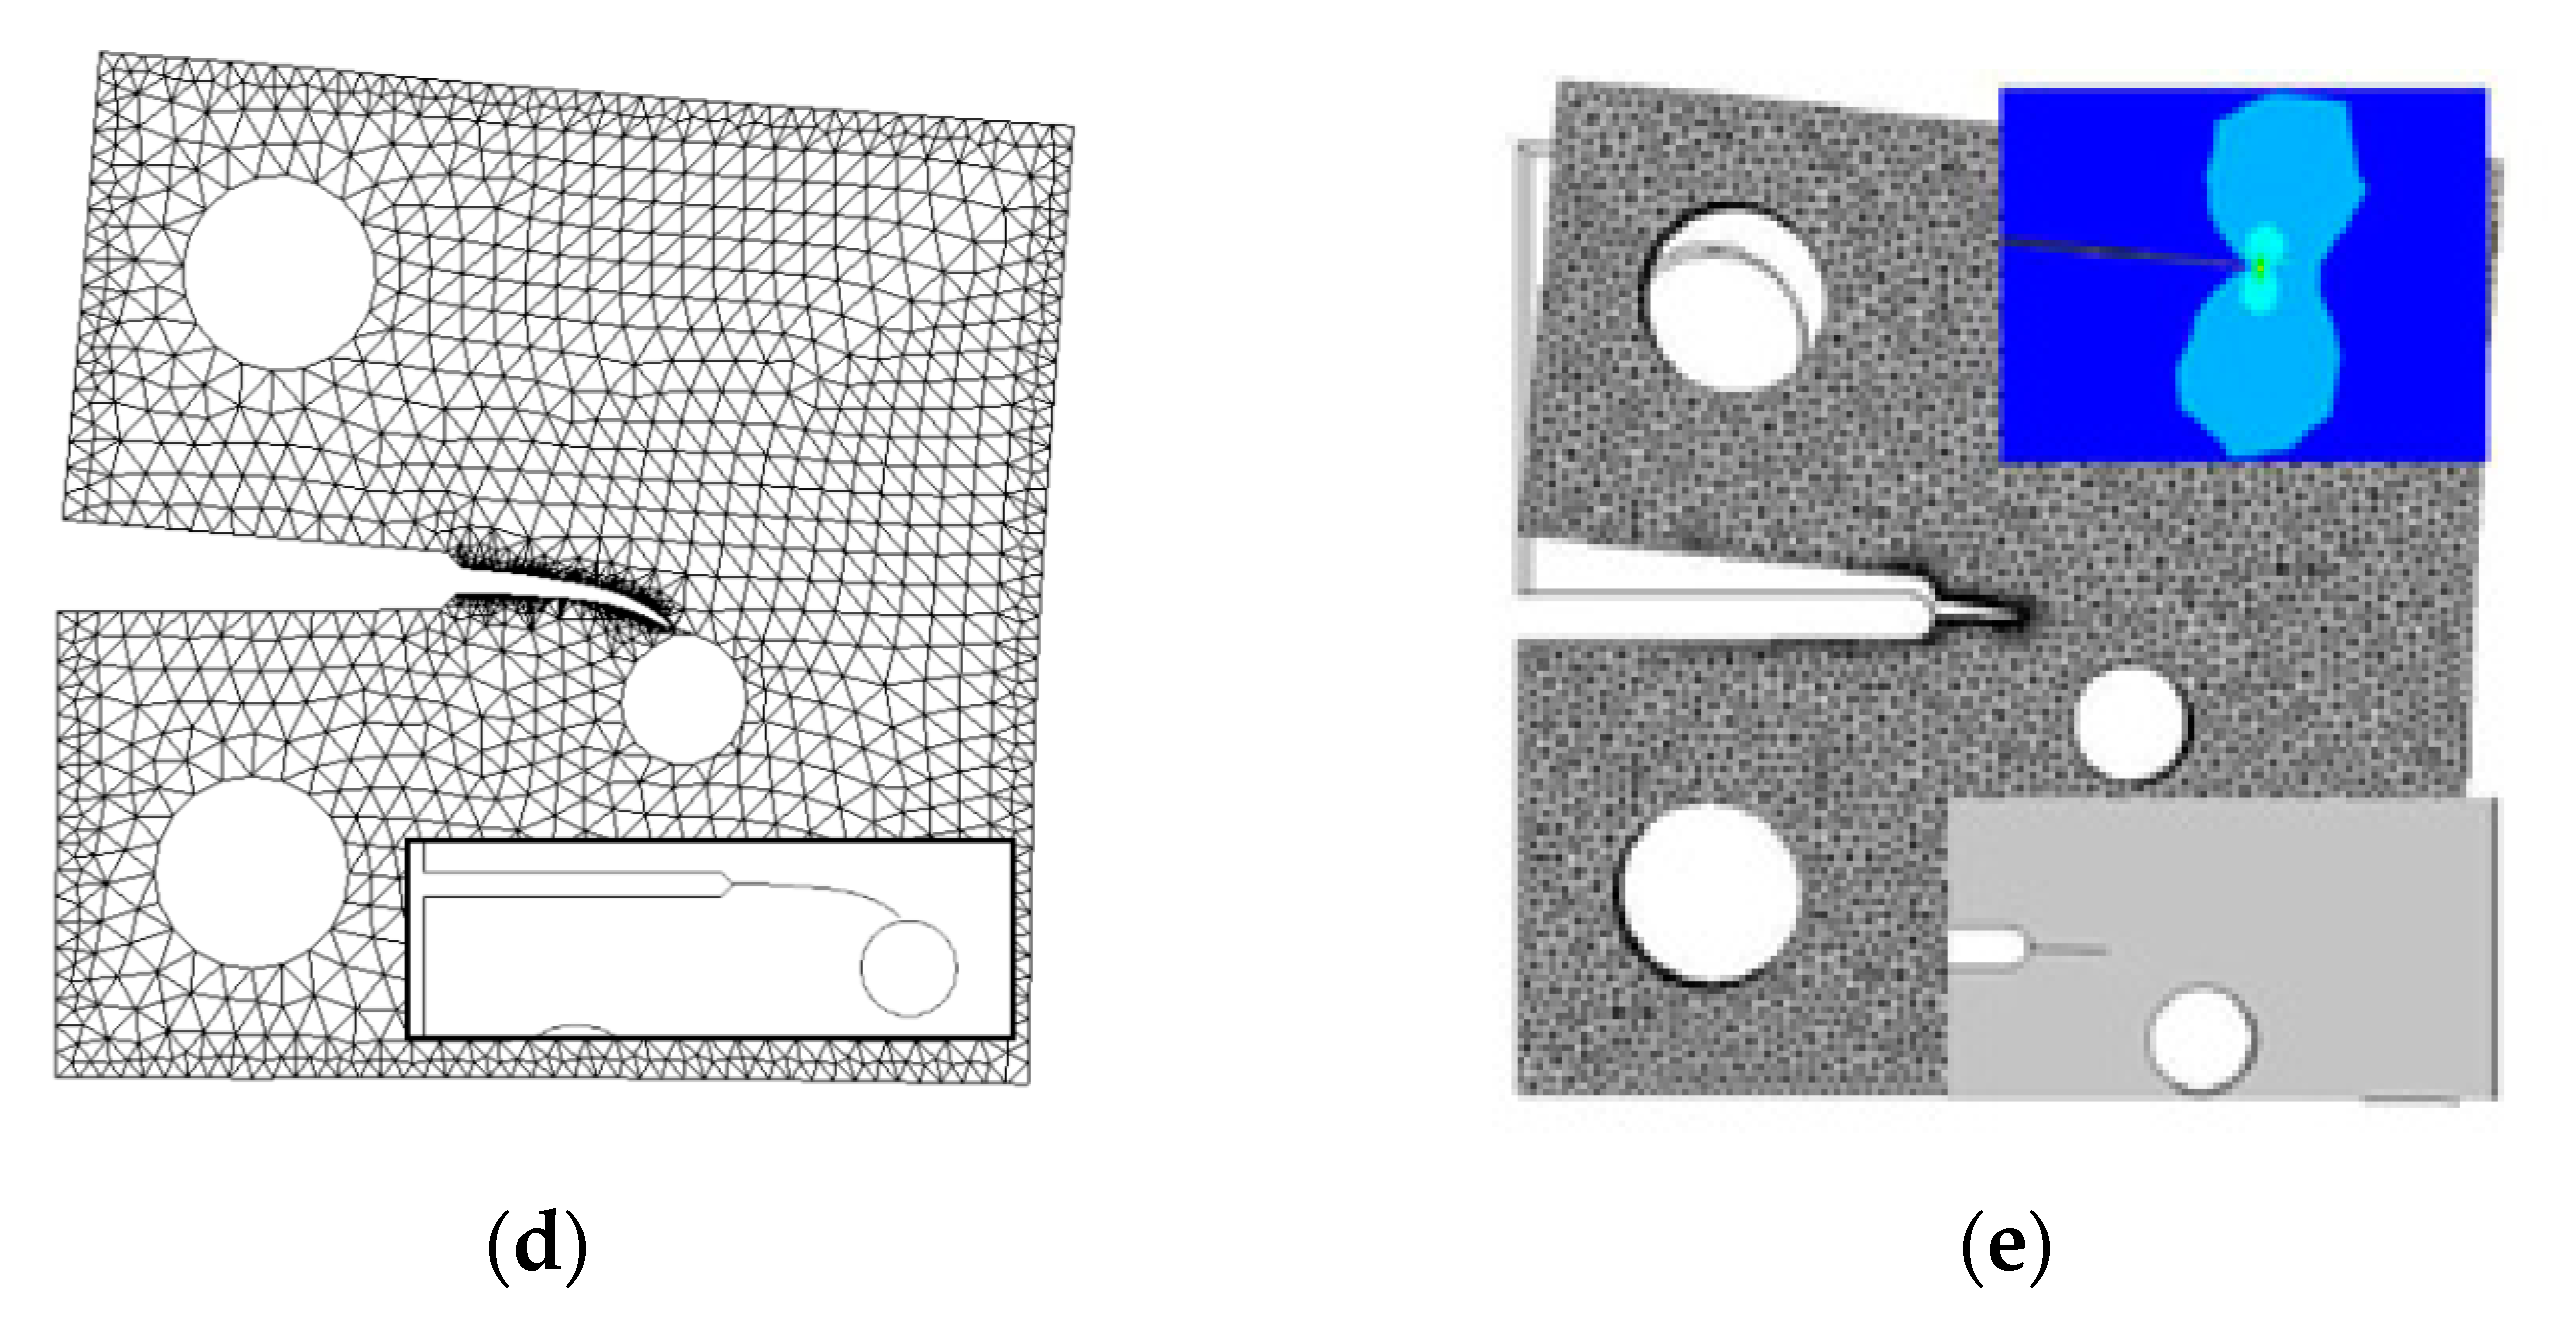
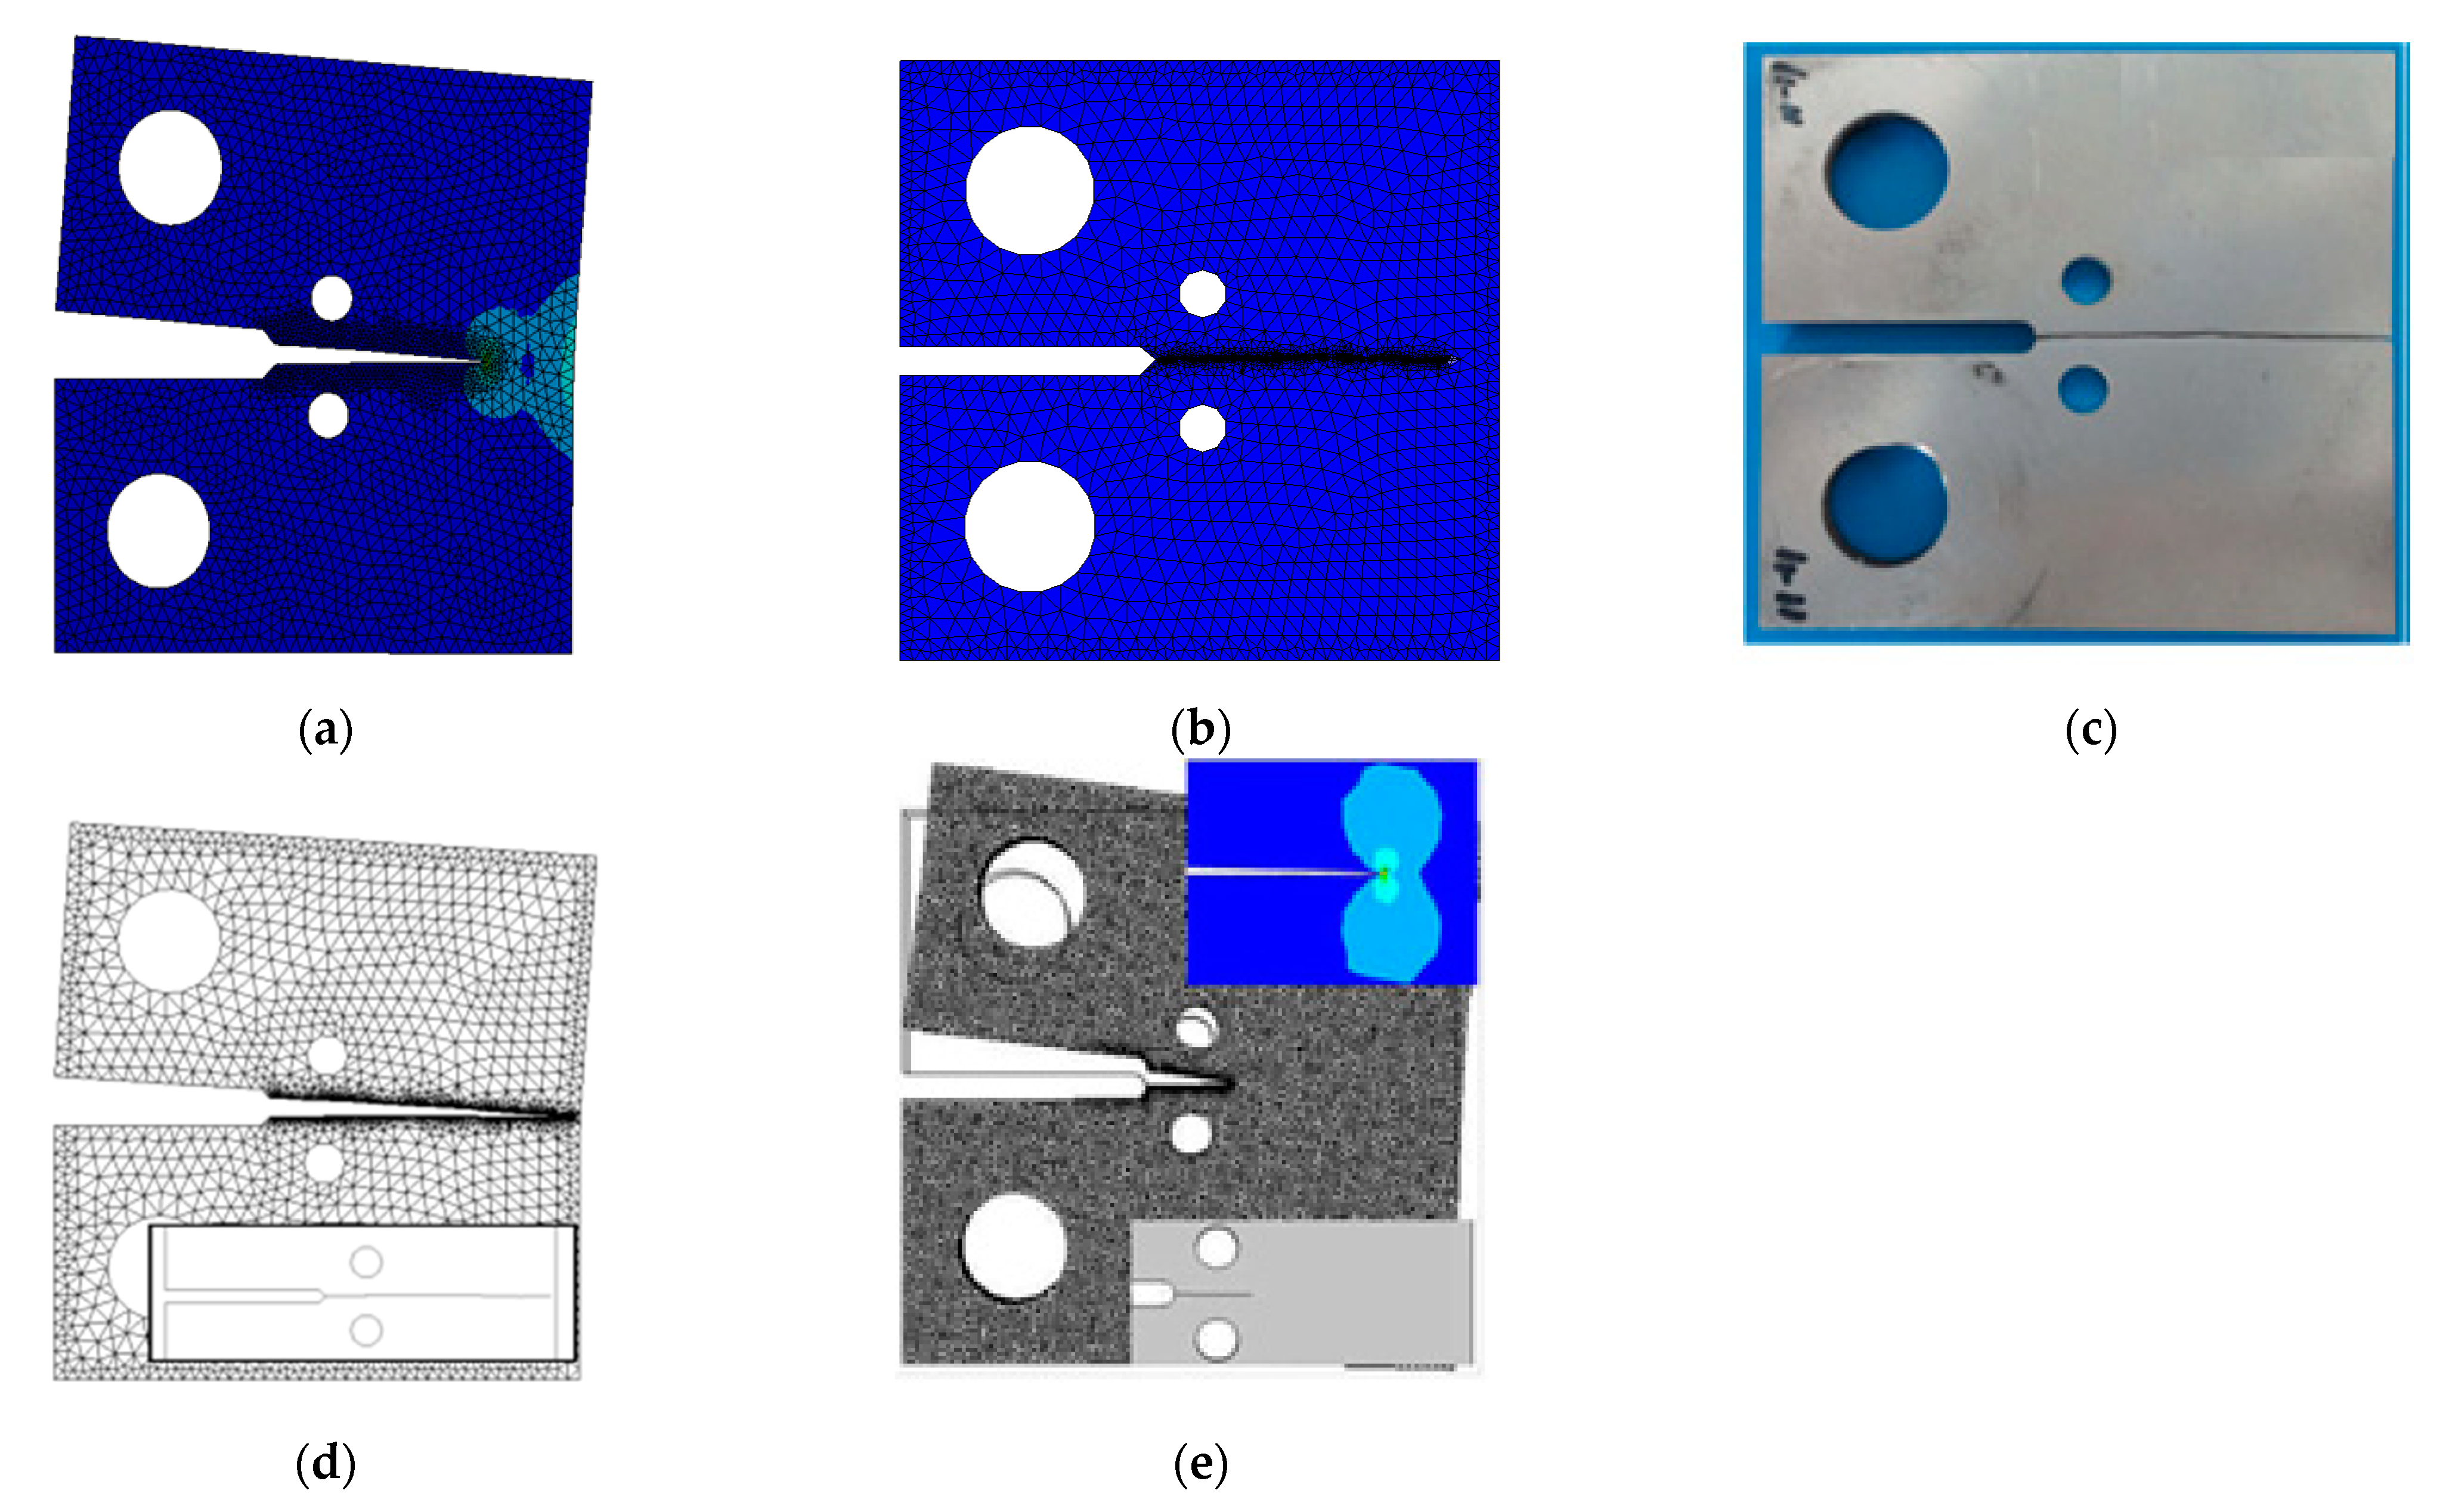
Two specimens are included in the first group of Table 1. G1 is a specimen without a hole, while G2 is a specimen with a hole. The hole diameter d1 for specimen G2 is 8 mm. It has a horizontal distance of 6.5 mm and a vertical distance of 3 mm. A constant amplitude loading of 3 kN with cyclic load ratio R = 0 is applied to the top 12.3 mm hole of each geometry, while the structure is clamped at the bottom 12.3 mm hole and the displacements and rotations of all nodes along its boundaries are completely constrained. Figure 4 shows the fatigue crack growth path predicted by ANSYS Workbench and the FRANC2D/L program for G1, which is almost similar to the experimental finding obtained by [32] and numerical findings obtained by [33] and more accurate than the incomplete crack growth path using Franc3D software by [32].
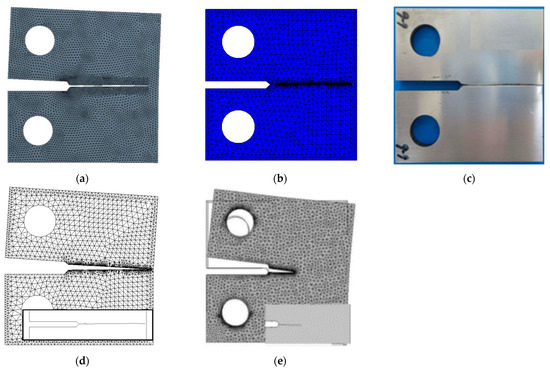
Figure 4.
Predicted crack growth path for G1 specimen (a) ANSYS Workbench, (b) FRANC2D/L and (c) Experimental [32], (d) numerical [33], (e) FRANC3D [32].
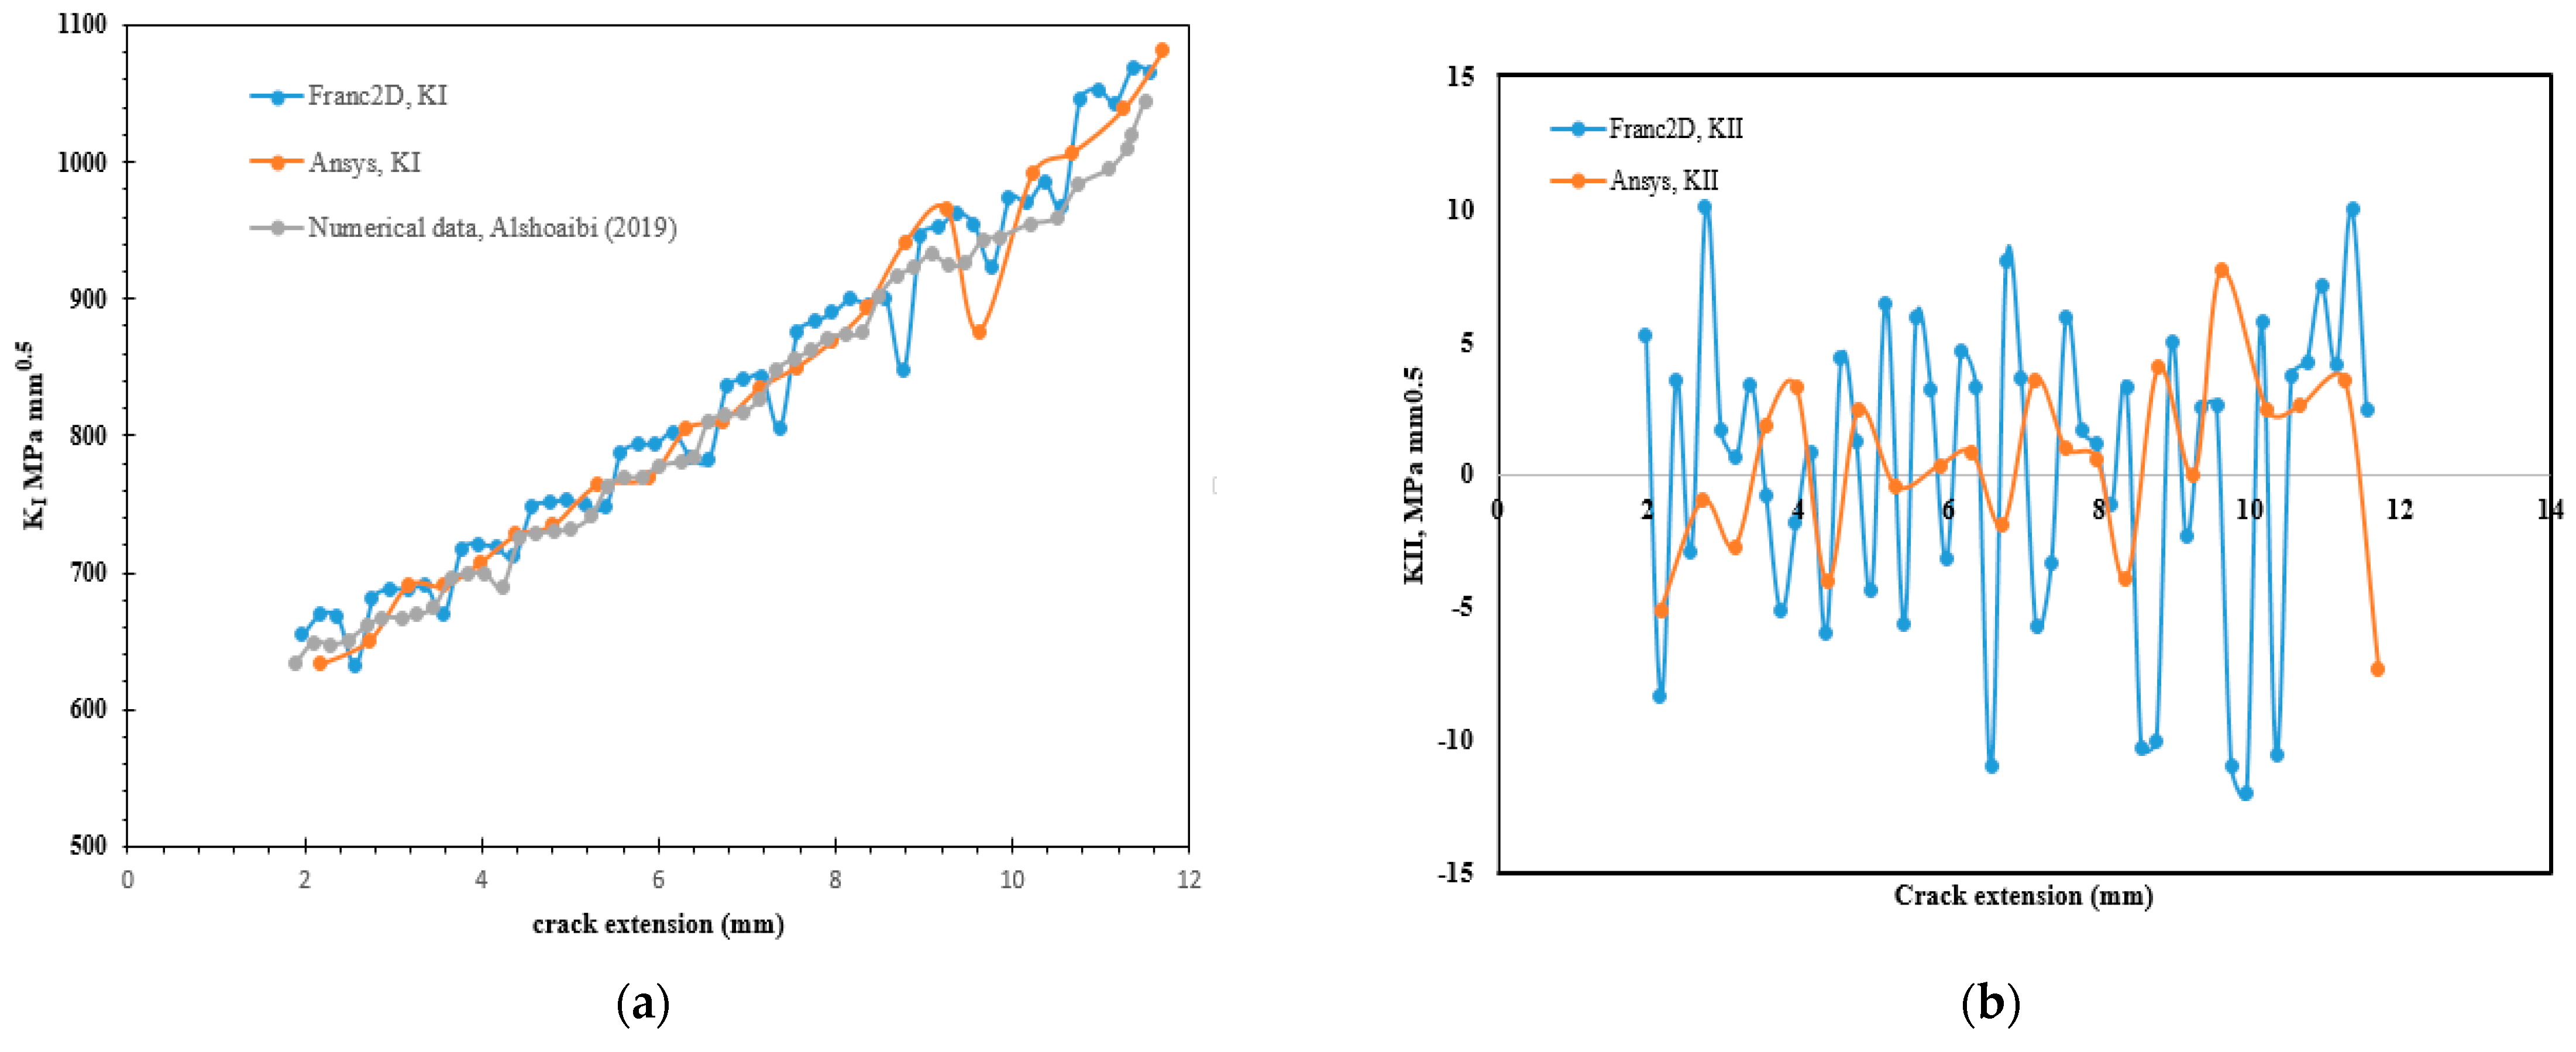
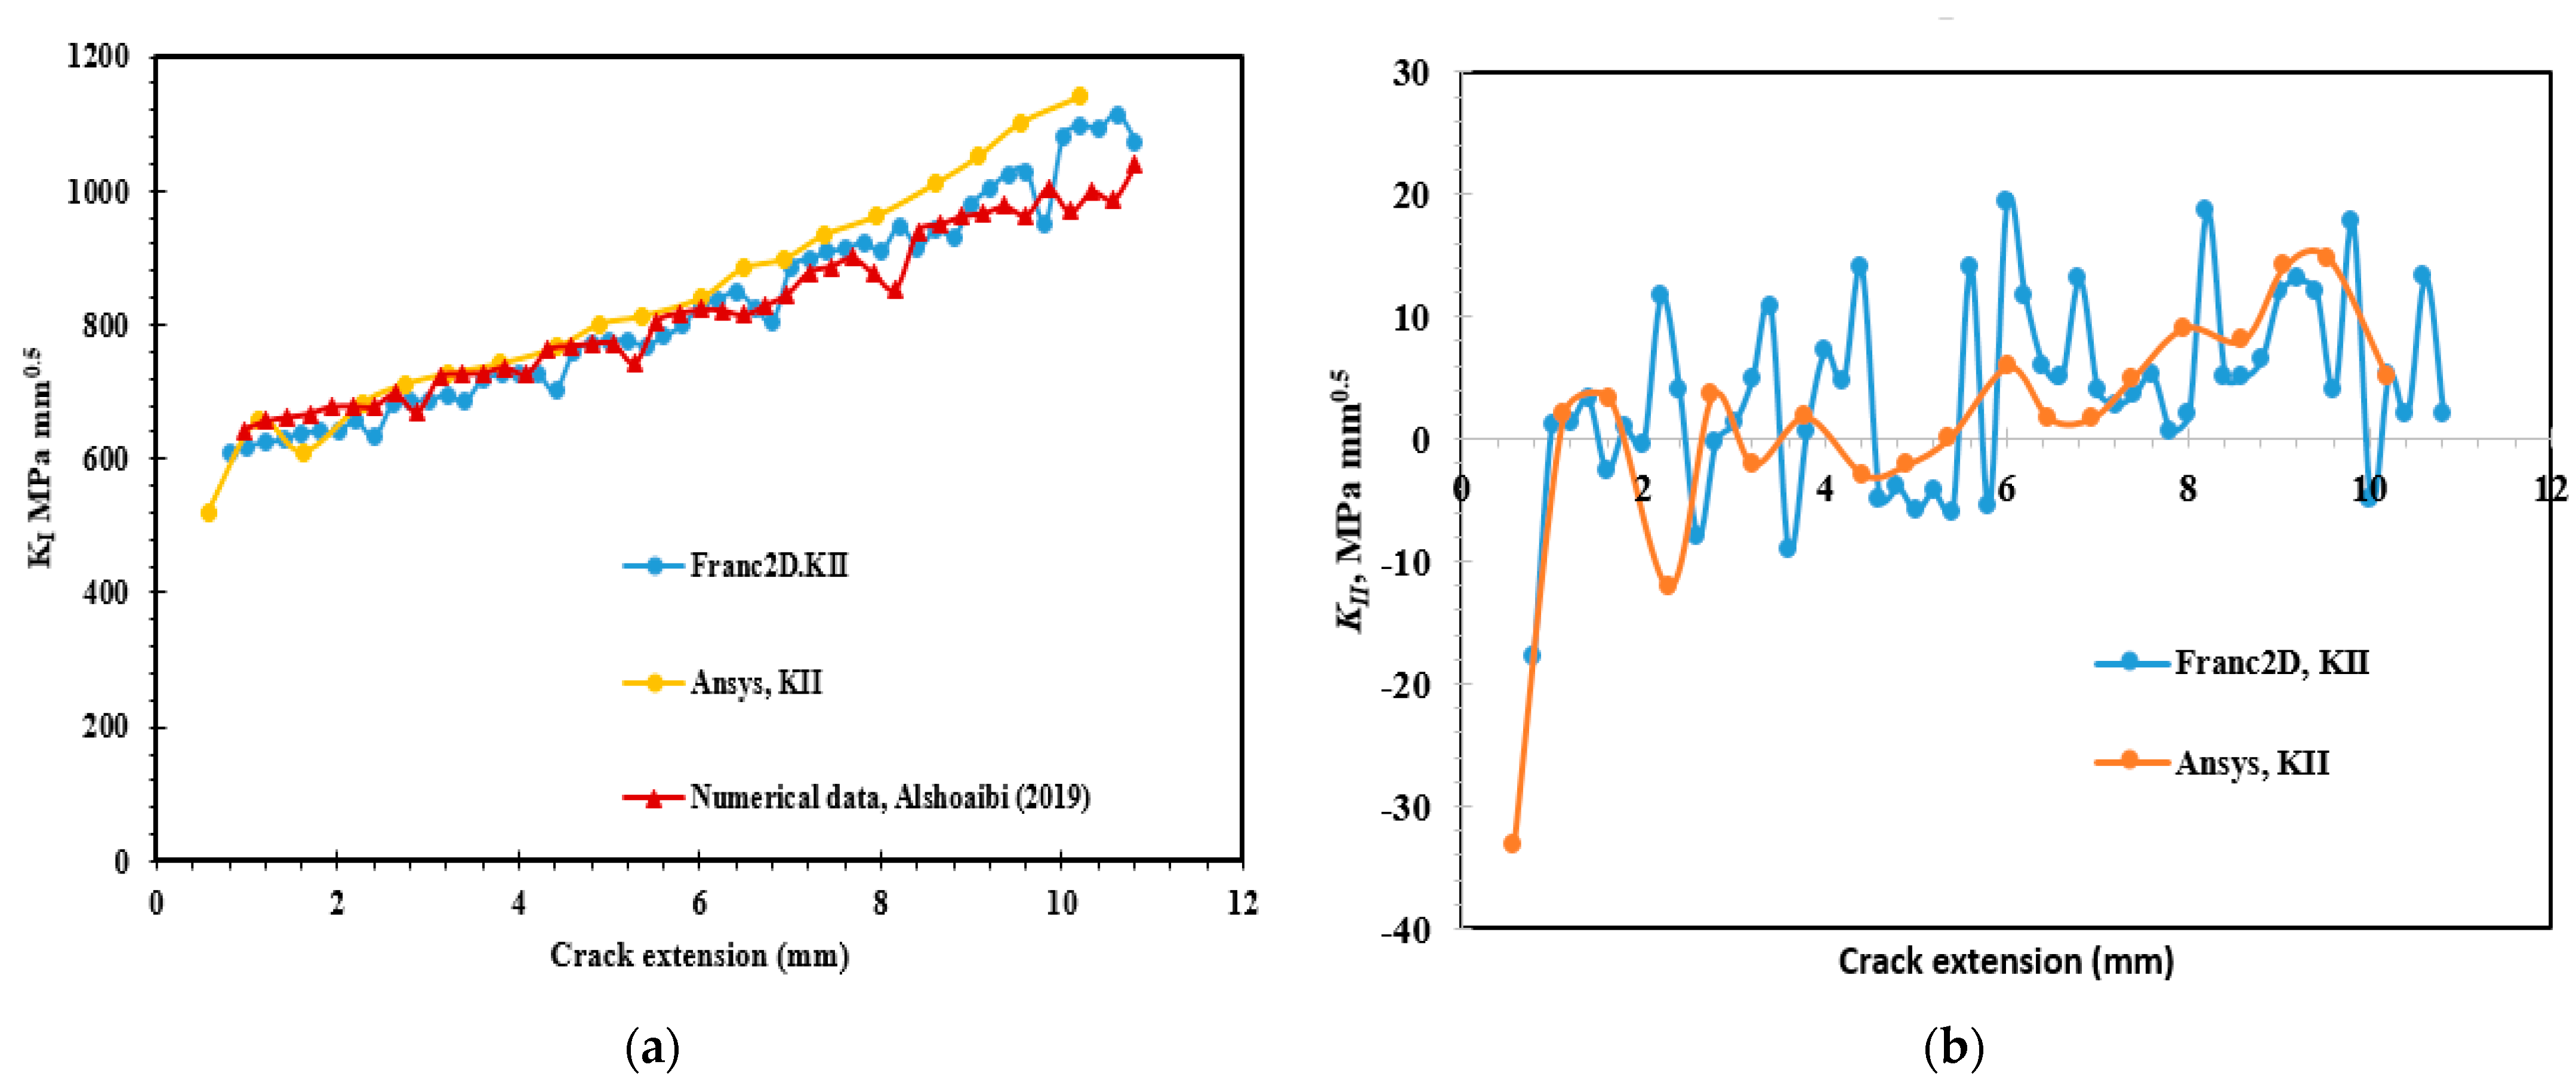
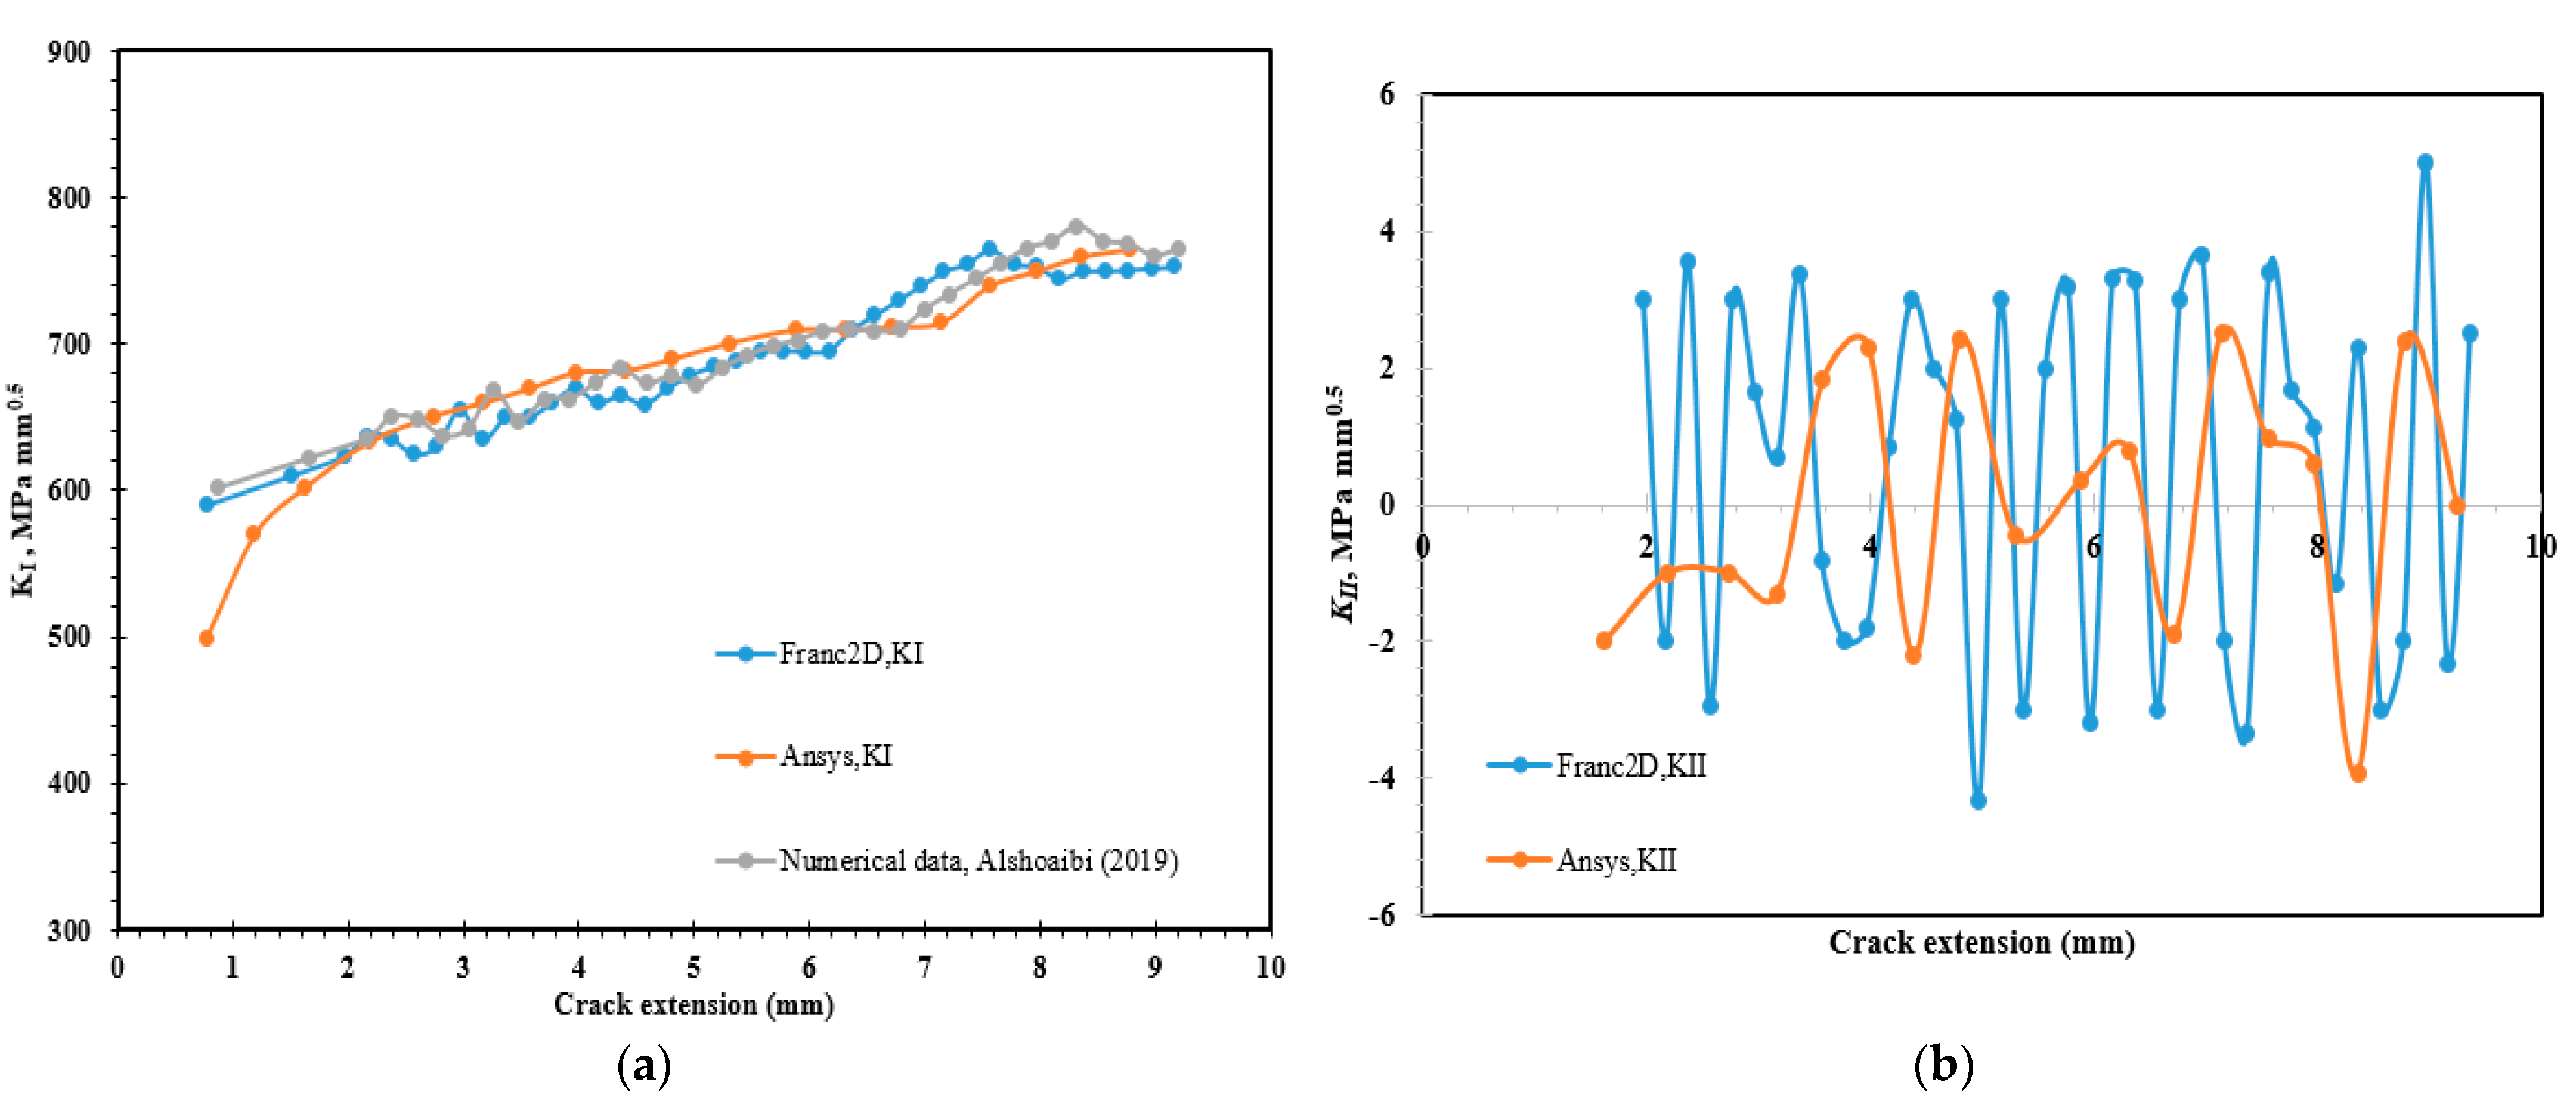
The predicted values of stress intensity factors for mode I and mode II (KI and KII) with respect to crack length are shown in Figure 5. The range of KI in FRANC2D/L program is 635 to 1081 MPa.mm0.5, while in ANSYS, it ranges between 590 to 1065 MPa.mm0.5. The predicted values for both programs vary by approximately 2.8%. There were also comparable results for KI to the numerical data obtained by [33], whereas for the KII, there were ambiguous data obtained by [33] to make a comparison with it.

Figure 5.
Stress intensity factors with corresponding crack length for specimen G1, (a) KI, and (b) KII.
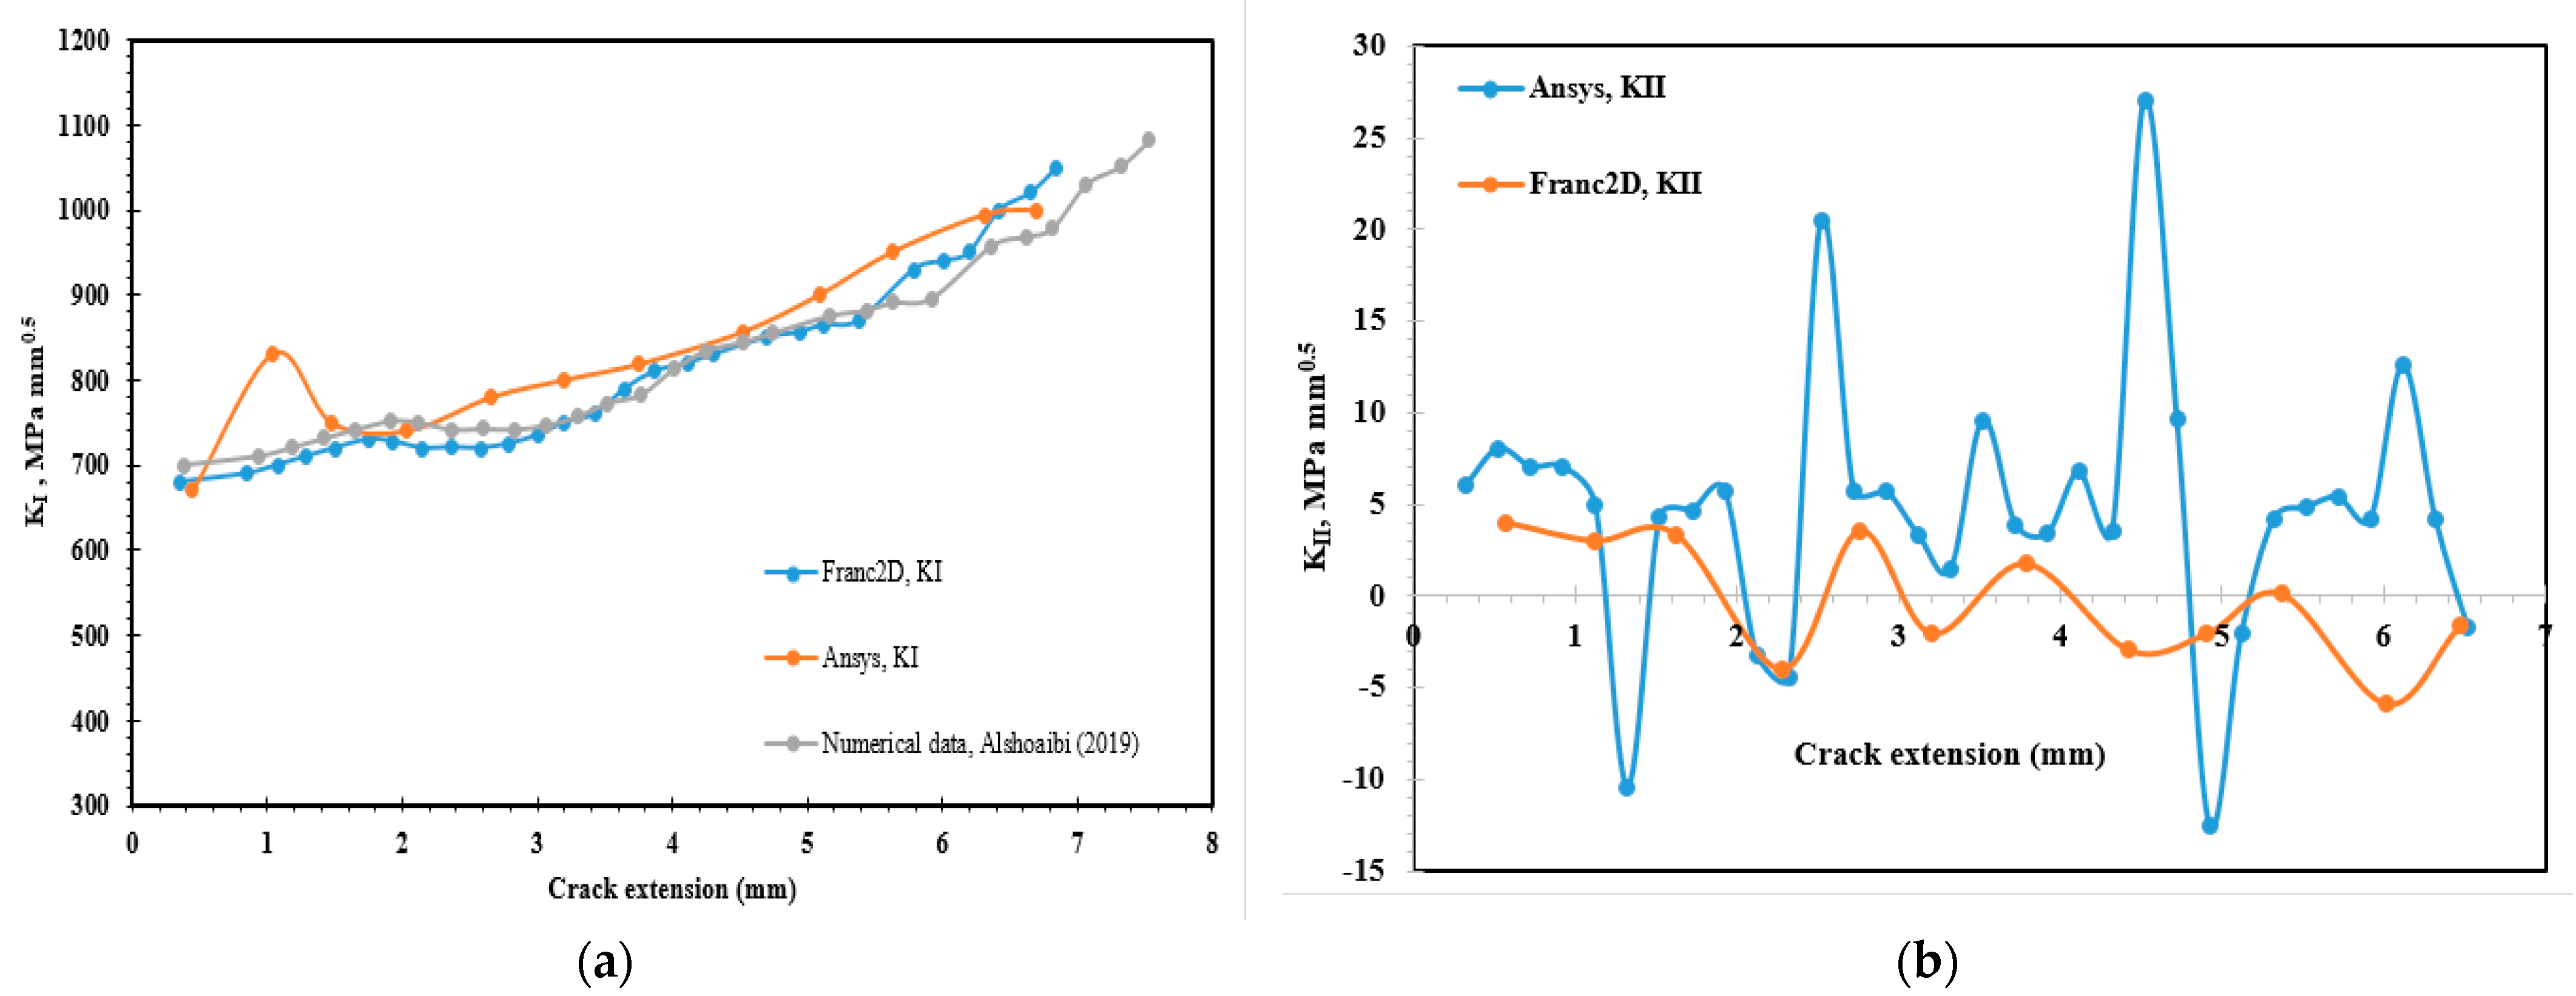
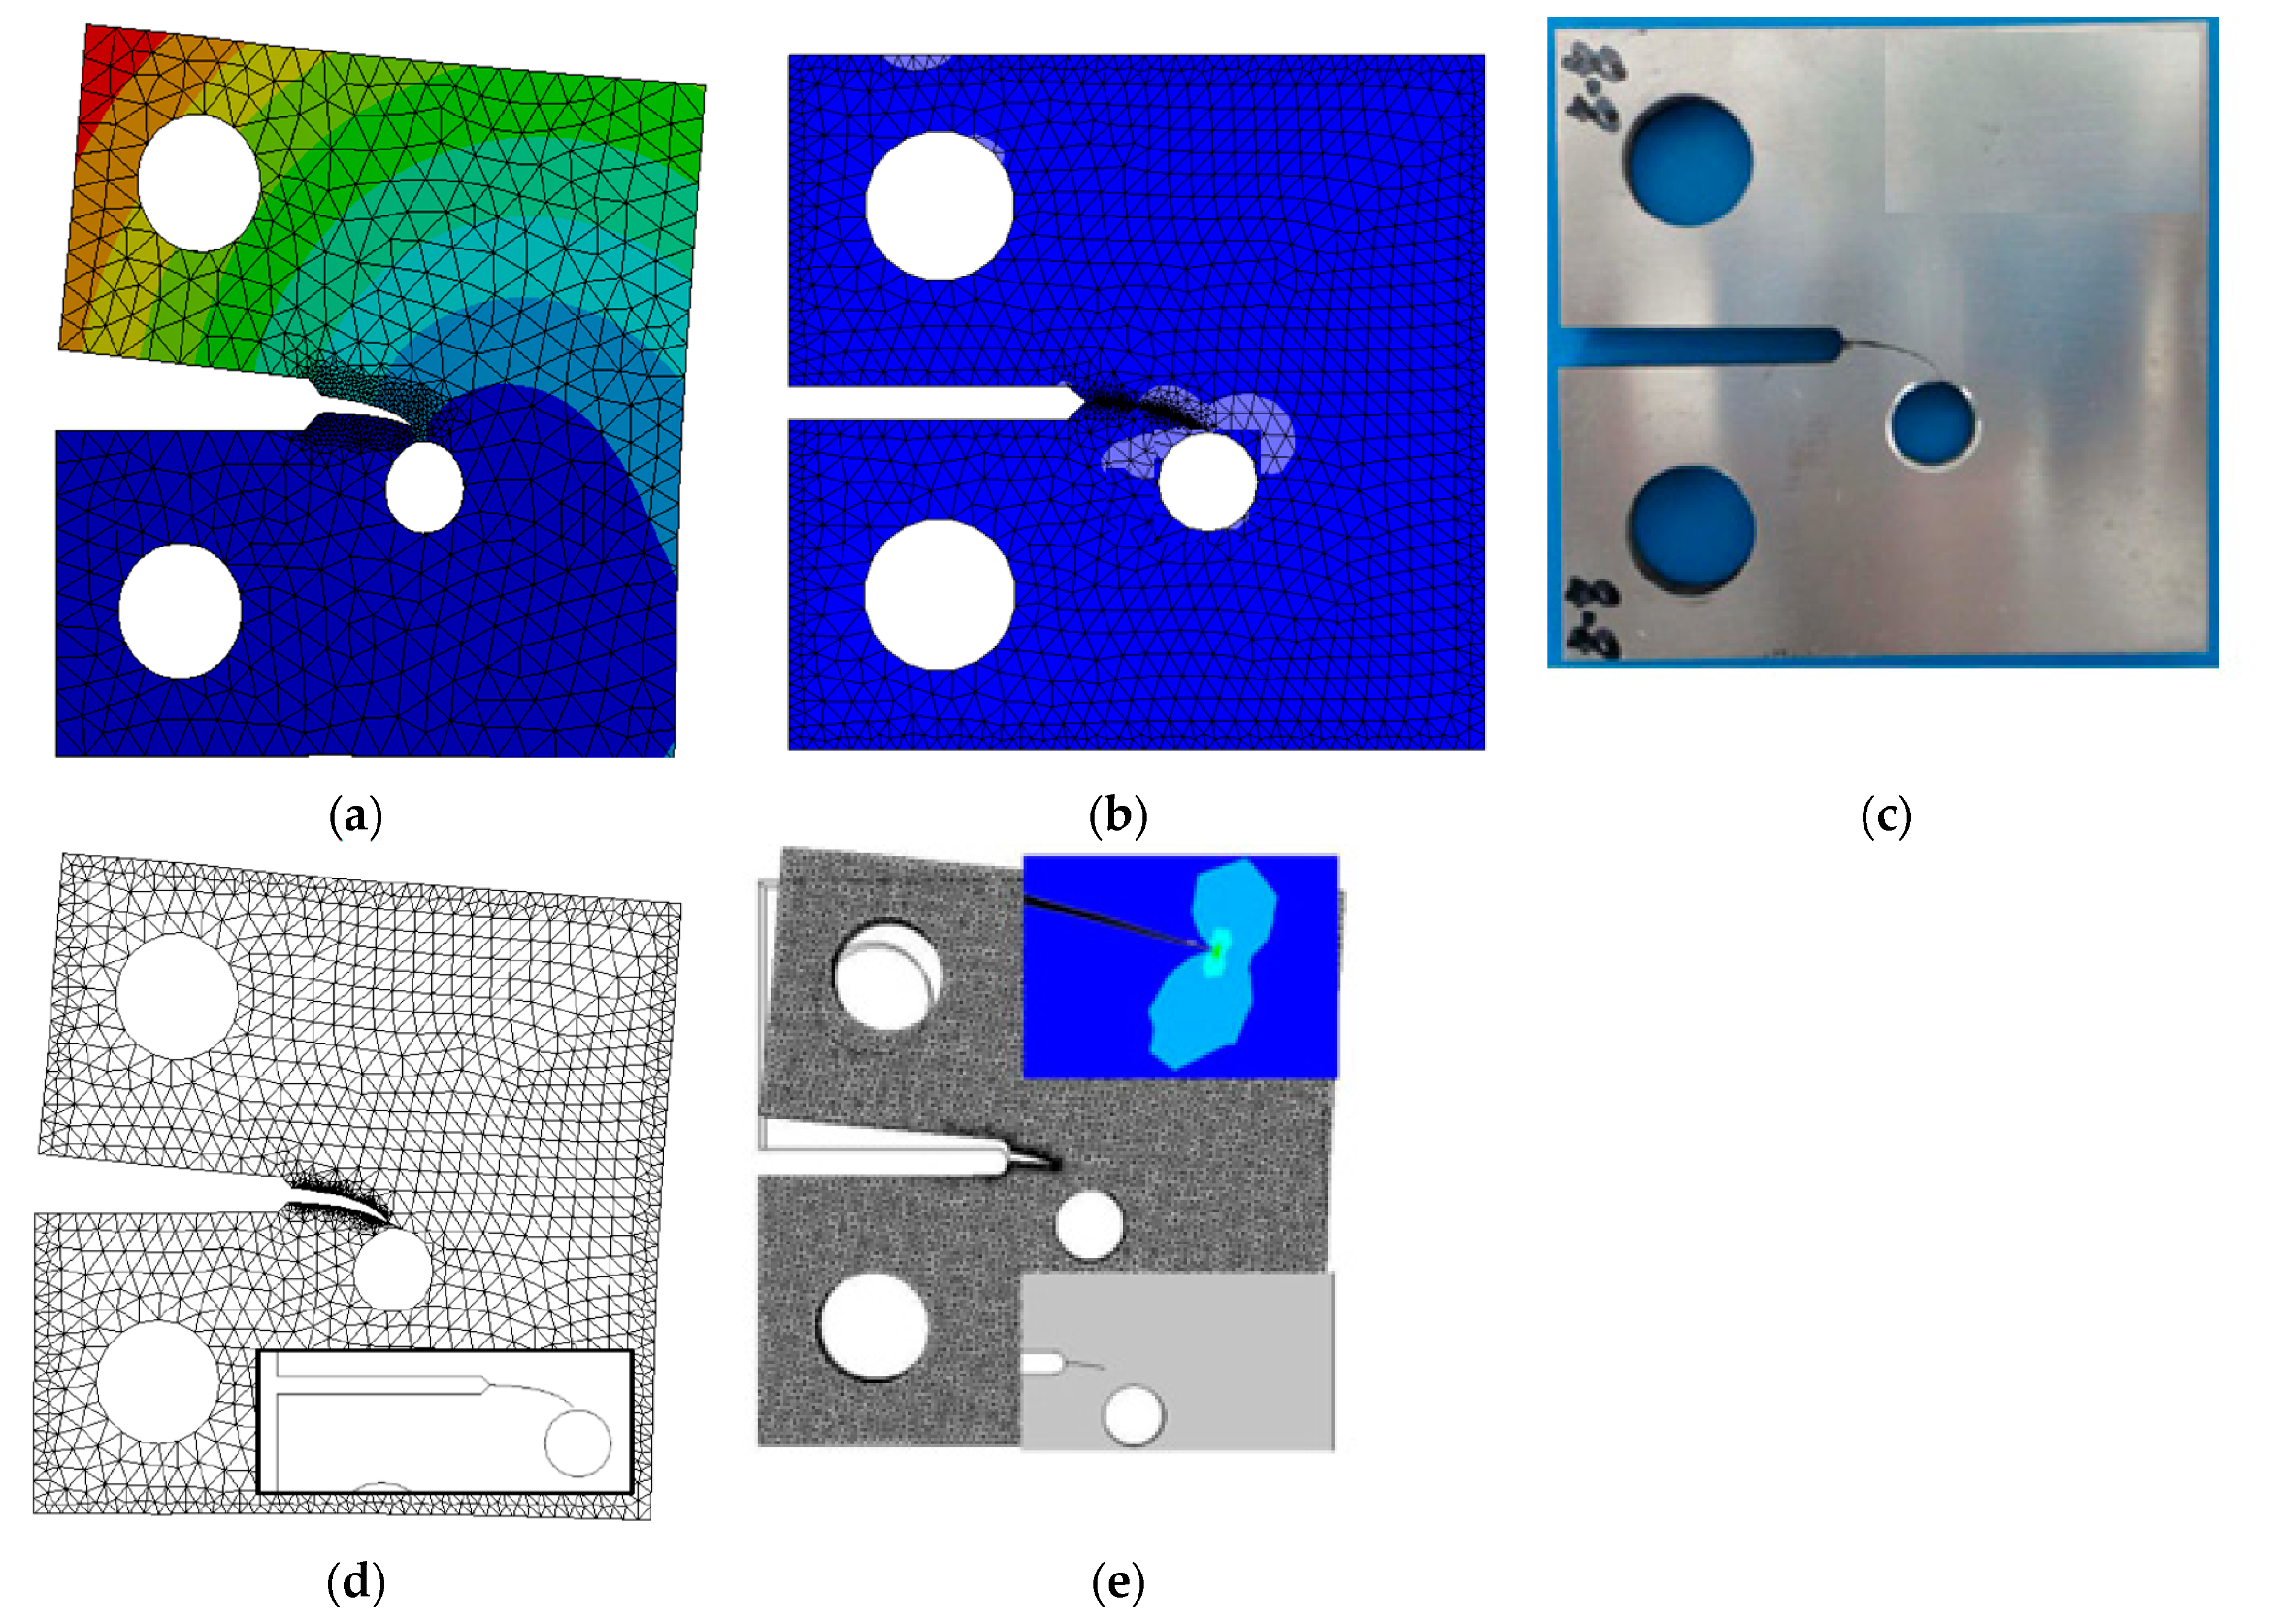
The predicted crack growth path in both software for the G2 specimen is shown in Figure 6 compared to the experimental crack growth path predicted by [32] with an identical crack path. There were another two comparisons with the numerical data obtained by [29] and FRANC3D results, which have incomplete crack growth path compared to the present study results. Due to the presence of the small hole near the crack growth direction, the crack changes its direction toward the hole, which illustrates the influence of the hole position on the direction of the crack growth. The stress intensity factors computed by the ANSYS program and the FRANC2D/L program vary by 0.57 percent in the simulation of specimen G2. There were also comparable results for KI with the numerical results obtained by [29] as seen in Figure 7. Furthermore, for the second mode of stress intensity factors KII, which affected the crack growth path to grow toward the hole, there are higher values for this specimen compared to the previous one, as shown in Figure 7b.
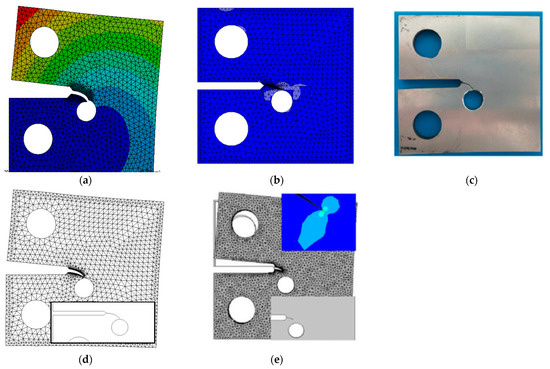
Figure 6.
Predicted crack growth path for G2 specimen (a) ANSYS Workbench, (b) FRANC2D/L and (c) Experimental [32], (d) numerical [33], (e) FRANC3D [32].

Figure 7.
Stress intensity factors with corresponding crack length for specimen G2, (a) KI and (b) KII.
Due to the large scale of the curves as a consequence of combining KI and KII in the same curve, these values of KII were also found ambiguously by [29].
4.1.2. G3 Specimen
In order to allow the influence of small holes on crack growth path to be investigated, the G3 specimen has an 8 mm diameter hole at a horizontal location h1 = 10.5 mm and a vertical location, v1 = 3 mm. The predicted fatigue crack growth path in both softwares is identical to the experimental path obtained by [32], as shown in Figure 8. The predicted values of the first and second mode of stress intensity factor are shown in Figure 9 with a difference of 0.75%. Another two comparisons were made with the numerical data provided by [29] and the FRANC3D results [28], which exhibit an incomplete crack growth path when compared to the results of this study as depicted in Figure 8d,e. As shown in Figure 9a, there were also similar results for KI with the numerical results obtained by [29]. Moreover, as shown in Figure 9b, for the second mode of stress intensity factors, KII has remarkable values, which influence the crack growth path to propagate in a curved direction toward the hole. These values of KII were also obtained ambiguously by [29] which may be due to the large scale of the curves as a result of merging KI and KII in the same curve.
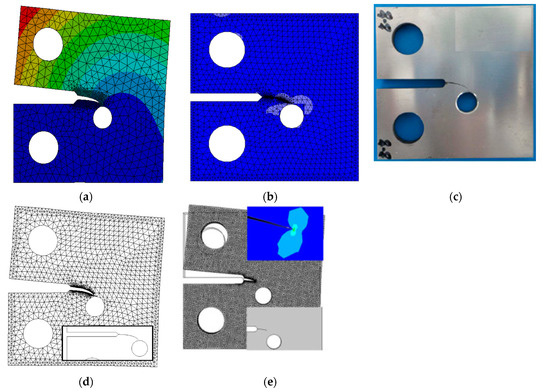
Figure 8.
Predicted crack growth path for G3 specimen (a) ANSYS Workbench, (b) FRANC2D/L and (c) Experimental [32], (d) numerical [33], (e) FRANC3D [32].
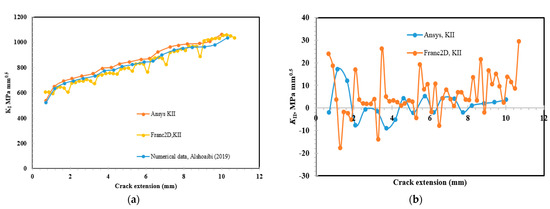
Figure 9.
Stress intensity factors with corresponding crack length for specimen G3, (a) KI, and (b) KII.
In particular, the larger hole not only reduces the distance between its edge and the original crack location in the horizontal direction, but also reduces the distance between its edge and the specimen’s axis in the vertical direction, making it more effective of transforming the crack path.
4.1.3. G4 Specimen
The effect of the crack path as the hole shifts away from the crack front is seen in Figure 9. The 8 mm diameter hole of specimen G4 is located at a distance of h1 = 14.5 mm. The crack path for the G4 specimen began straight, but since the hole was in the path of the crack, the path deviated towards the hole. The predicted paths in both FRANC2D/L and ANSYS were almost identical to the experimental and Franc3D work performed by [32] as shown in Figure 10. The KI range in the FRANC2D/L software for specimen G4 is 615 to 1085 MPa.mm0.5, while it was 485 to 1190 MPa.mm0.5 for ANSYS as shown in Figure 11. At the same crack length, there is a 1.2% discrepancy in the first mode of SIF values. Two further comparisons were performed as shown in Figure 10d,e using the numerical data provided by [29] and the FRANC3D findings [28], which revealed a relatively short crack growth path when compared to the experimental and numerical results in this study. There were also comparable results for KI with the numerical results obtained by [29], as shown in Figure 11a. Furthermore, as shown in Figure 11b, for the second mode of stress intensity factors KII, there are significant values that affect the crack growth path to propagate in a curving direction toward the hole, which were also found ambiguously by [29].
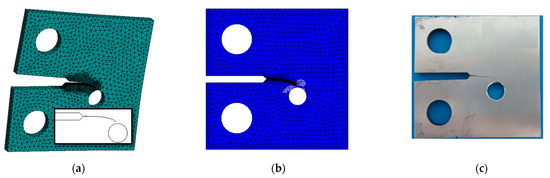

Figure 10.
Predicted crack growth path for G4 specimen (a) ANSYS Workbench, (b) FRANC2D/L and (c) Experimental [32], (d) numerical [33], (e) FRANC3D [32].
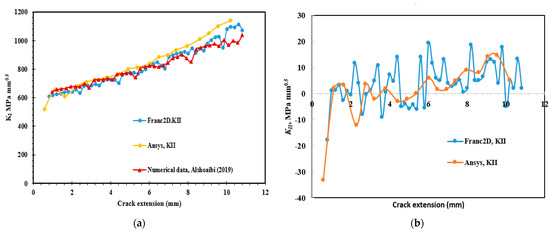
Figure 11.
Stress intensity factors with corresponding crack length for specimen G4, (a) KI, and (b) KII.
4.1.4. G5 Specimen
This specimen clarifies the influence of the hole size on the crack growth direction, the diameter of the hole, d1, was reduced to 2 mm in the G5 specimen. The h1 and v1 are identical to those of G2. The presence of a hole causes the crack to turn its growth path toward the hole to some extent. The crack in specimen G5 slightly turns the growth direction as shown in Figure 12, exhibiting good agreement with the experimental path reported by [32]. Figure 12d,e illustrate two further comparisons using the numerical data provided by [29] and the FRANC3D [28] findings, which showed a very short crack growth path as compared to the experimental and numerical results in the present study. As illustrated in Figure 13a, there were also similar results for KI with the numerical results obtained by [29]. In addition, Figure 13b shows the predicted values of KII, which have a small amount and indicate that there were a slightly influence of KII on the crack growth direction.

Figure 12.
Predicted crack growth path for G5 specimen (a) ANSYS Workbench, (b) FRANC2D/L and (c) Experimental [32], (d) numerical [33], (e) FRANC3D [32].
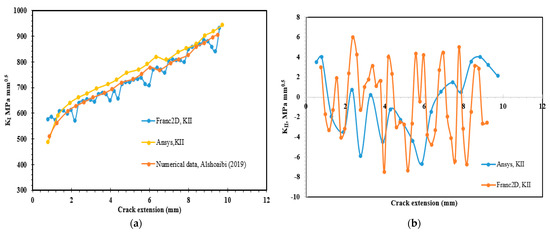
Figure 13.
Stress intensity factors with the corresponding crack length for specimen G5, (a) KI, and (b) KII.
The predicted values in both software for the first and second modes of SIF are shown in Figure 13. The range of KI calculated by FRANC2D/L was between 580 and 890 MPa.mm0.5, whereas the ANSYS results were in a range from 550 to 860 MPa.mm0.5. The difference in the SIF values is approximately 3.4%.
4.1.5. G6 Specimen
For the specimen G6, the hole diameter is two times the diameter of G5, which is d1 = 4 mm and has a horizontal distance from the crack tip, h1 = 6.5 mm. Figure 14 shows that the fatigue crack direction using ANSYS and Franc2d/L compared to the experimental path predicted by [28], numerical crack growth path obtained by [29], and numerical path predicted by FRANC3D [28], which has an incomplete direction. Similar to G5, it is affected somewhat by the hole but returns to grow in an almost straight line.
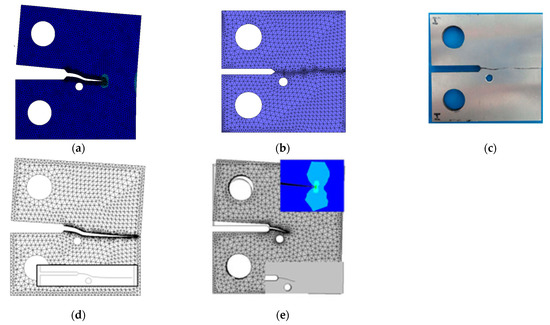
Figure 14.
Predicted crack growth path for G6 specimen (a) ANSYS Workbench, (b) FRANC2D/L and (c) Experimental [32], (d) numerical [33], (e) FRANC3D [32].
The predicted values of the first modes of SIF in both kinds of software were compared with a good agreement with the numerical results predicted by [29] shown in Figure 15a. The range of KI in FRANC2D/l was from 580 to 780 MPa.mm0.5, while for ANSYS it was from 475 to 810 MPa.mm0.5. The predicted values of the second mode of SIF are shown in Figure 15b as there were unclear data predicted by [29] for comparison.
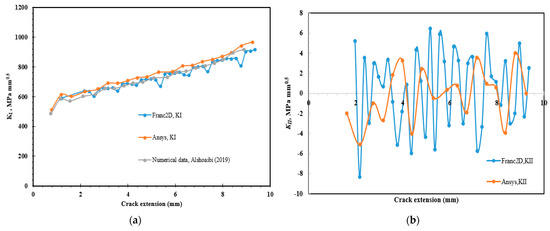
Figure 15.
Stress intensity factors with corresponding crack length for specimen G6, (a) KI, and (b) KII.
4.1.6. G7 Specimen
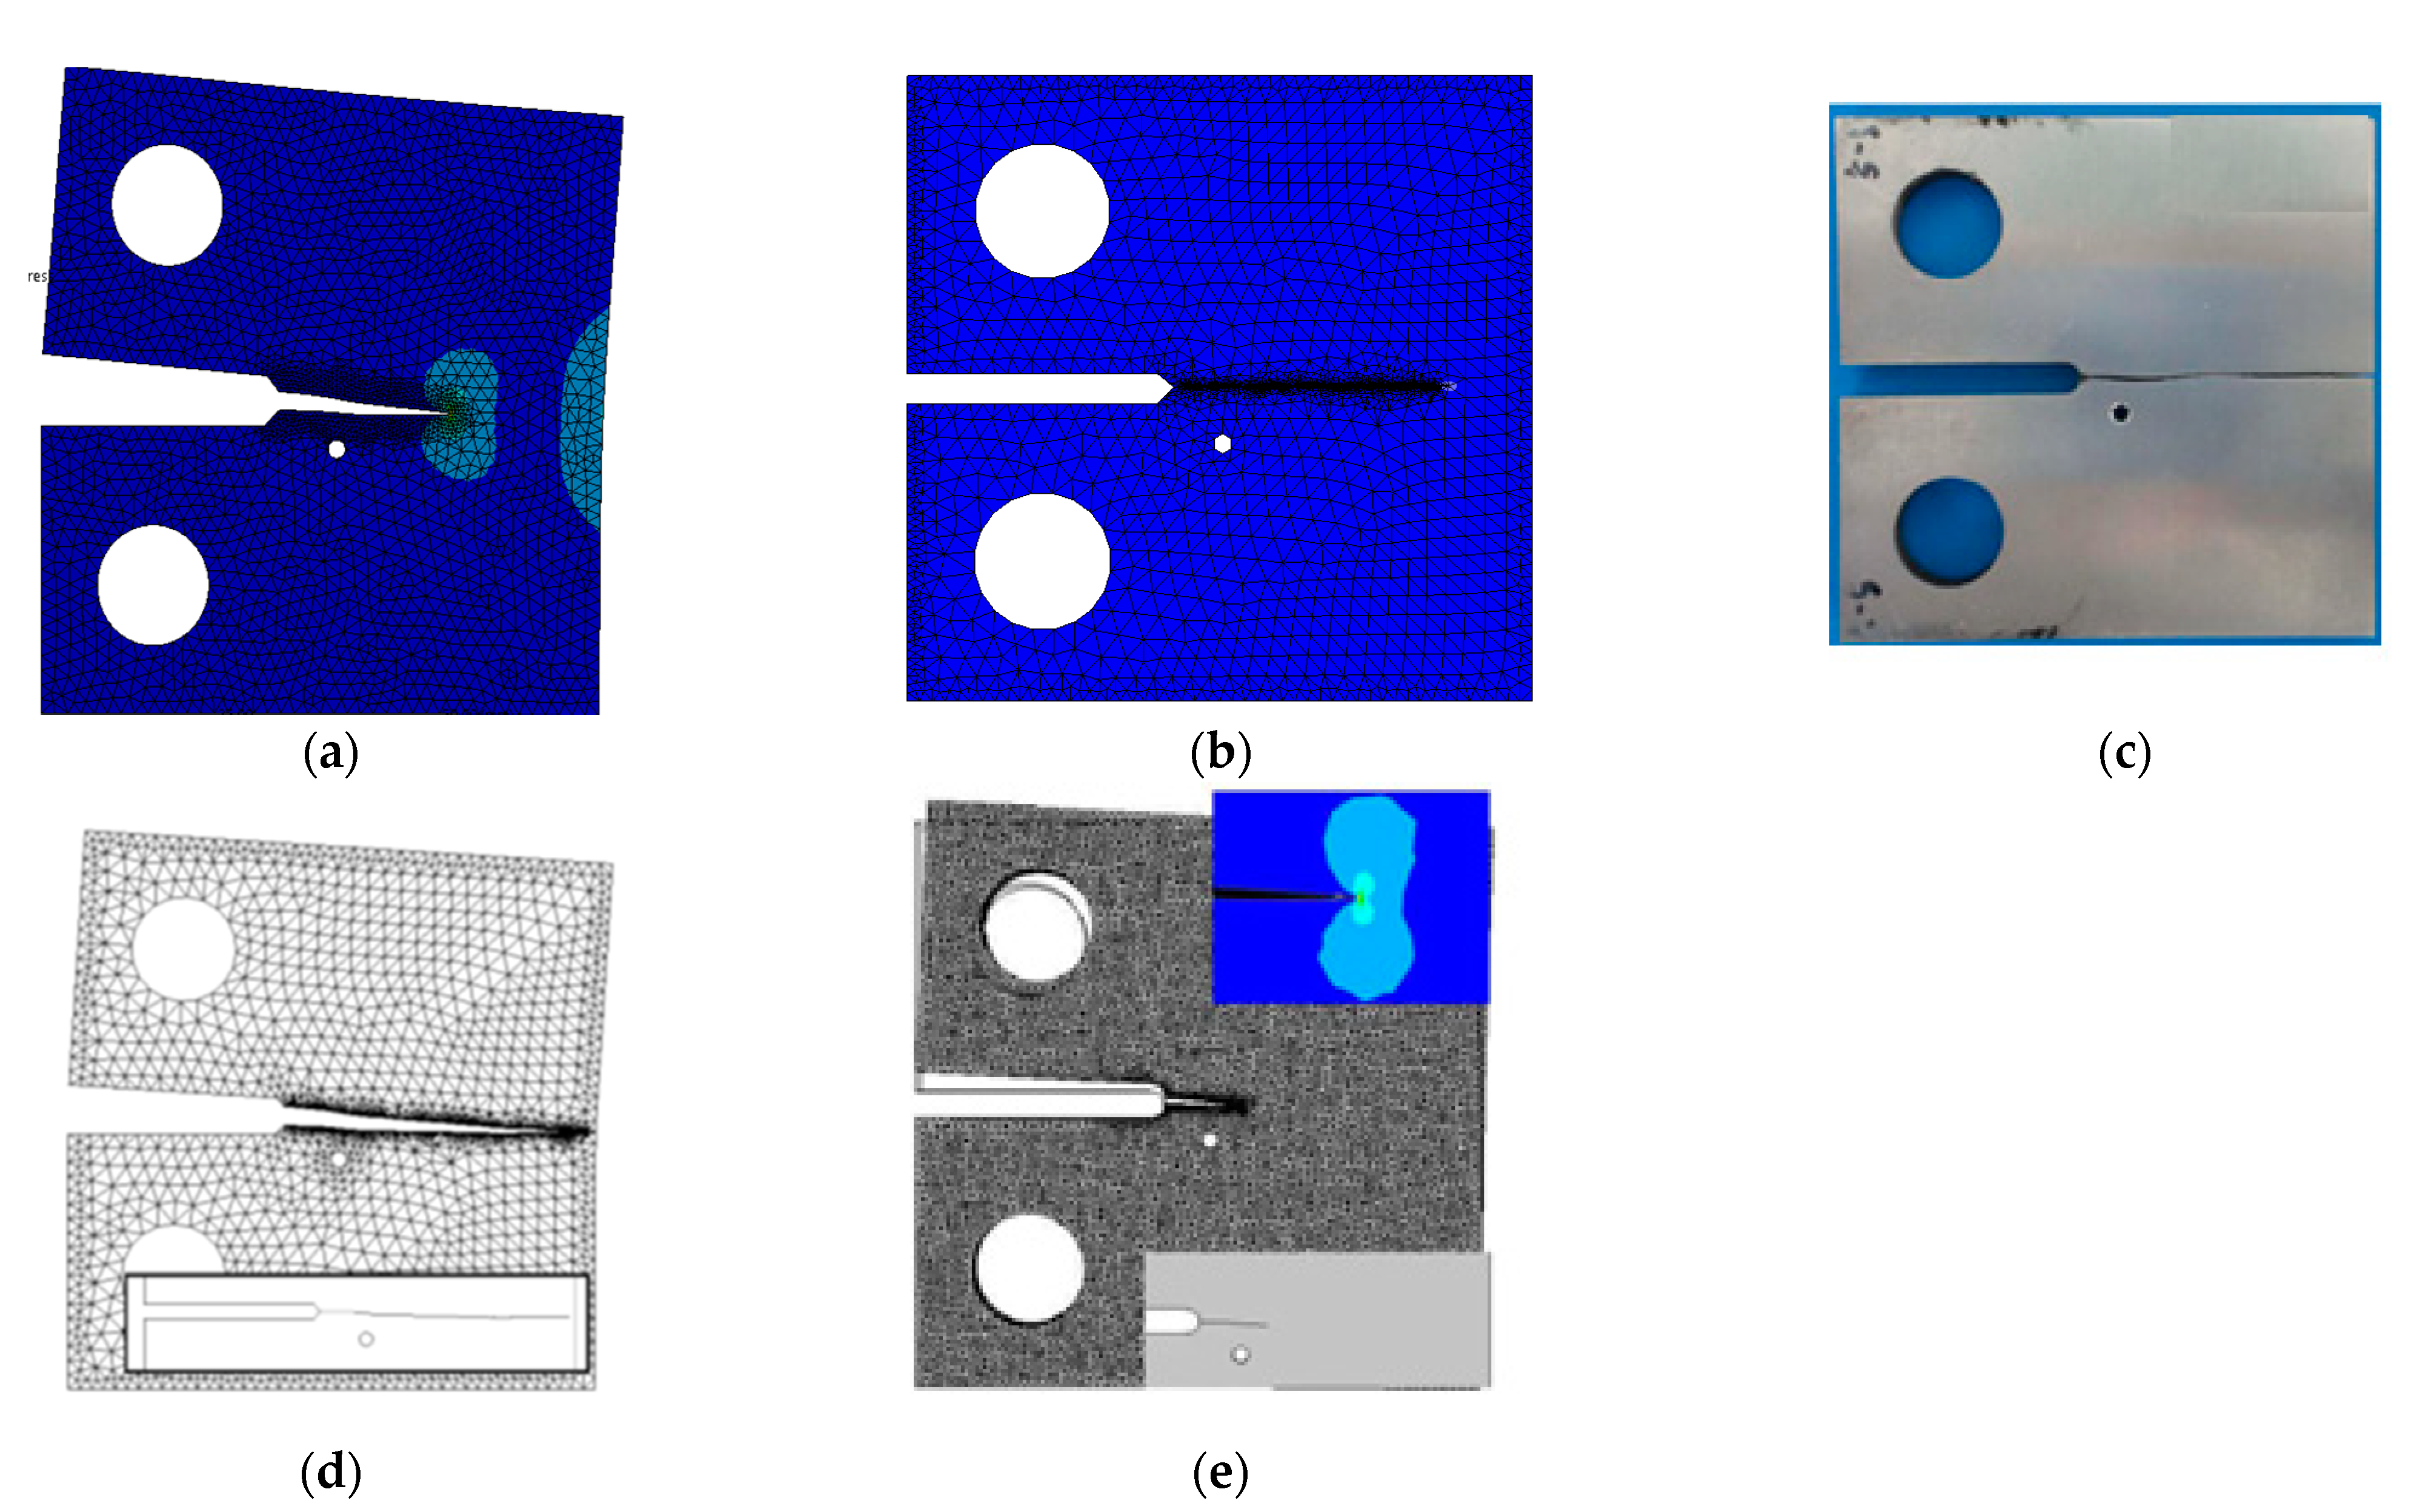
The previous five specimens have only one hole, whereas the G7 specimen has two identical 5 mm diameter holes symmetrically distributed along the axis of the specimen. The predicted crack growth path in both software compared to the experimental path obtained by [32], the numerical path predicted by [29], and incomplete crack growth path predicted by [28] using FRANC3D [28] are shown in Figure 16. The fatigue crack growth path in this specimen is almost straight, just like that for the G1 specimen due to the effect of the symmetrical holes.

Figure 16.
Predicted crack growth path for G7 specimen (a) ANSYS Workbench, (b) FRANC2D/L and (c) Experimental [32], (d) numerical [33], (e) FRANC3D [32].
The predicted values of K1 from FRANC2D/L program were in the range from 650 to 900 MPa.mm0.5 compared to the range from 530 to 897 MPa.mm0.5 calculated by ANSYS, as shown in Figure 17, in which comparable results with the numerical values predicted by [29] are also shown in Figure 17a. Furthermore, Figure 17b shows the predicted values of KII, which have lower values, indicating that this factor had no impact on the crack growth direction and that the crack will propagate in a straight line.

Figure 17.
Stress intensity factors with corresponding crack length for specimen G7, (a) KI, and (b) KII.
The predicted fatigue life cycles for all specimens resulting from ANSYS and FRANCD2D/L were compared to those values obtained numerically by [32] using FRANC3D software with good agreement, whereas the predicted values obtained by [29] did not have any comparable results with other data as shown in Table 3. As seen in this table, because there are no holes in the G1 specimen, it has the highest value of fatigue life cycles.
Table 3.
Comparison for the fatigue life cycles for all specimens.
Similar studies were carried out for these geometries by [33], who used ANSYS software and his own source code, which is not available to use by any researchers, unlike Franc2D/l, which is free distributed software. According to the following points, there were many differences between the findings of this investigation and the numerical study performed by [33]:
- 1
- For several geometries such as G1, G5, G6, and G7, the author of [29] did shown the completed crack growth path to be comparable to the experimental path in his computational results.
- 2
- The values of the second mode of stress intensity component, KII, which have a significant influence on the crack growth path according to Equation (1), have not been represented accurately by the author [29]. If the KII values were close to zero, the crack would propagate in a straight line, but as the values are increased, the crack began to grow in a curvature trajectory as many crack growth paths were achieved for the studied geometries.
- 3
- The author [29] used the J-integral method to evaluate the stress intensity factors, which were also used in the present study in both software, resulting in a comparable result for SIFs, whereas there were no comparable results for the fatigue life cycles number for the ANSYS results computed by [29] compared to the FRANC3D results [32], which were achieved in the present study with comparable results as shown in Table 3.
5. Conclusions
According to the predicted results, a fatigue crack grows toward a hole, which is due to the unbalanced stresses at the crack tip caused by the hole. Furthermore, the different positions and sizes of a single hole have a significant influence on the fatigue crack growth path. The size and position of the hole influence the curvature of the crack curve line. The crack direction bends more severely as the central distance of the hole approaches the initial crack. The curvature of the crack direction increases as the diameter of the hole increases, such that there were considerable increases in the values of KII. The fatigue crack does not change its growth direction when two holes are distributed symmetrically. The predicted fatigue crack growth paths were validated by the experimental finding performed by other researchers. Due to available computing resources, two-dimensional analysis offers a faster computational time than three-dimensional analysis while also allowing for a finer mesh to be generated on the geometry. In 3D models, the time increases dramatically as the mesh density increases. The simulated specimens were thin CTS that were subjected to plane stress conditions. Accordingly, the 2D analysis results were almost the same as the 3D analysis results.
Funding
This research received no external funding.
Institutional Review Board Statement
Not applicable.
Informed Consent Statement
Not applicable.
Data Availability Statement
Not applicable.
Conflicts of Interest
The author declare no conflict of interest.
References
- Kumar, S.; Singh, I.; Mishra, B.; Singh, A. New Enrichments in XFEM to Model Dynamic Crack Response of 2-D Elastic Solids. Int. J. Impact Eng. 2016, 87, 198–211. [Google Scholar] [CrossRef]
- Pandey, V.; Singh, I.; Mishra, B.; Ahmad, S.; Rao, A.V.; Kumar, V. A New Framework Based on Continuum Damage Mechanics and XFEM for High Cycle Fatigue Crack Growth Simulations. Eng. Fract. Mech. 2019, 206, 172–200. [Google Scholar] [CrossRef]
- Alshoaibi, A.M.; Fageehi, Y.A. 2D Finite Element Simulation of Mixed Mode Fatigue Crack Propagation for CTS Specimen. J. Mater. Res. Technol. 2020, 9, 7850–7861. [Google Scholar] [CrossRef]
- Dirik, H.; Yalçinkaya, T. Crack Path and Life Prediction under Mixed Mode Cyclic Variable Amplitude Loading through XFEM. Int. J. Fatigue 2018, 114, 34–50. [Google Scholar] [CrossRef]
- Demir, O.; Ayhan, A.O.; Iriç, S. A New Specimen for Mixed Mode-I/II Fracture Tests: Modeling, Experiments and Criteria Development. Eng. Fract. Mech. 2017, 178, 457–476. [Google Scholar] [CrossRef]
- Zhang, R.; Guo, R. Determination of Crack Tip Stress Intensity Factors by Singular Voronoi Cell Finite Element Model. Eng. Fract. Mech. 2018, 197, 206–216. [Google Scholar] [CrossRef]
- Sih, G.; Liebowitz, H. Mathematical Fundamentals. In Fracture; Academic Press: New York, NY, USA, 1968; Volume 2, pp. 67–190. [Google Scholar]
- Hellan, K. Introduction to Fracture Mechanics; McGraw-Hill: New York, NY, USA, 1985. [Google Scholar]
- Barsom, J.; Rolfe, S. Fracture and Fatigue in Structure: Application of Fracture Mechanics; American Society for Testing and Materials: Philadelphia, PA, USA, 1999. [Google Scholar]
- Broek, D. Elementary Engineering Fracture Mechanics; Springer Science & Business Media: Berlin, Germany, 2012. [Google Scholar]
- Belytschko, T.; Black, T. Elastic Crack Growth in Finite Elements with Minimal Remeshing. Int. J. Numer. Method Eng. 1999, 45, 601–620. [Google Scholar] [CrossRef]
- Huynh, H.D.; Nguyen, M.N.; Cusatis, G.; Tanaka, S.; Bui, T.Q. A Polygonal XFEM with New Numerical Integration for Linear Elastic Fracture Mechanics. Eng. Fract. Mech. 2019, 213, 241–263. [Google Scholar] [CrossRef]
- Surendran, M.; Natarajan, S.; Palani, G.; Bordas, S.P. Linear Smoothed Extended Finite Element Method for Fatigue Crack Growth Simulations. Eng. Fract. Mech. 2019, 206, 551–564. [Google Scholar] [CrossRef]
- Rozumek, D.; Marciniak, Z.; Lesiuk, G.; Correia, J. Mixed Mode I/II/III Fatigue Crack Growth in S355 Steel. Procedia Struct. Integr. 2017, 5, 896–903. [Google Scholar] [CrossRef]
- Bergara, A.; Dorado, J.; Martin-Meizoso, A.; Martinez-Esnaola, J.M. Fatigue Crack Propagation in Complex Stress Fields: Experiments and Numerical Simulations Using the Extended Finite Element Method (XFEM). Int. J. Fatigue 2017, 103, 112–121. [Google Scholar] [CrossRef]
- Alshoaibi, A.M. Finite Element Procedures for the Numerical Simulation of Fatigue Crack Propagation Under Mixed Mode Loading. Struct. Eng. Mech. 2010, 35, 283–299. [Google Scholar] [CrossRef]
- Fageehi, Y.A.; Alshoaibi, A.M. Numerical Simulation of Mixed-Mode Fatigue Crack Growth for Compact Tension Shear Specimen. Adv. Mater. Sci. Eng. 2020, 2020, 5426831. [Google Scholar] [CrossRef] [Green Version]
- Chen, H.; Wang, Q.; Zeng, W.; Liu, G.; Sun, J.; He, L.; Bui, T.Q. Dynamic Brittle Crack Propagation Modeling Using Singular Edge-Based Smoothed Finite Element Method with Local Mesh Rezoning. Eur. J. Mech. A Solids 2019, 76, 208–223. [Google Scholar] [CrossRef]
- Gomes, G.; Miranda, A.C. Analysis of Crack Growth Problems Using the Object-Oriented Program Bemcracker2D. Fratt. Ed Integr. Strutt. 2018, 12, 67–85. [Google Scholar] [CrossRef] [Green Version]
- Fageehi, Y.; Alshoaibi, A.M. Nonplanar Crack Growth Simulation of Multiple Cracks Using Finite Element Method. Adv. Mater. Sci. Eng. 2020, 2020, 1–12. [Google Scholar] [CrossRef] [Green Version]
- Alshoaibi, A.M. Numerical Modeling of Crack Growth under Mixed-Mode Loading. Appl. Sci. 2021, 11, 2975. [Google Scholar] [CrossRef]
- Alshoaibi, A.M. Computational Simulation of 3D Fatigue Crack Growth under Mixed-Mode Loading. Appl. Sci. 2021, 11, 5953. [Google Scholar] [CrossRef]
- Alshoaibi, A.M.; Fageehi, Y.A. Numerical Analysis of Fatigue Crack Growth Path and Life Predictions for Linear Elastic Material. Materials 2020, 13, 3380. [Google Scholar] [CrossRef] [PubMed]
- Alshoaibi, A.M.; Fageehi, Y.A. Simulation of Quasi-Static Crack Propagation by Adaptive Finite Element Method. Metals 2021, 11, 98. [Google Scholar] [CrossRef]
- Paris, P.; Erdogan, F. A Critical Analysis of Crack Propagation Laws. J. Basic Eng. 1963, 85, 528–533. [Google Scholar] [CrossRef]
- Coffin, L. Cyclic Deformation and Fatigue of Metals. Fatigue and Endurance of Metals [Russian Translation]; USSR: Moscow, Russia, 1963; pp. 257–272. [Google Scholar]
- Wöhler, A. Versuche Zur Ermittlung Der Auf Die Eisenbahnwagenachsen Einwirkenden Kräfte Und Die Widerstandsfähigkeit der Wagen-Achsen. Z. Für Bauwes. 1860, 10, 583–614. [Google Scholar]
- Bjørheim, F. Practical Comparison of Crack Meshing in ANSYS Mechanical APDL 19.2; University of Stavanger: Stavanger, Norway, 2019. [Google Scholar]
- ANSYS. Academic Research Mechanical, Release 19.2, Help System. Coupled Field Analysis Guide 2020, ANSYS, Inc., (ONLINE). Available online: https://www.mdpi.com/2075-4701/11/3/397/htm (accessed on 26 May 2021).
- Kumar, P.; Makhatha, M.E.; Sengupta, S.; Dutt, A.K. Prediction of the Propagation of Fatigue Cracks in Part-Through Cracked Pipes with CASCA and FRANC2D. Trans. Indian Inst. Met. 2020, 73, 1417–1420. [Google Scholar] [CrossRef]
- Ahola, A.; Björk, T.; Barsoum, Z. Fatigue Strength Capacity of Load-Carrying Fillet Welds on Ultra-High-Strength Steel Plates Subjected To Out-Of-Plane Bending. Eng. Struct. 2019, 196, 109282. [Google Scholar] [CrossRef]
- Zhang, X.-Q.; Zhang, X.; Li, L.; Duan, S.-W.; Li, S.-Z.; Huang, Z.-L.; Zhang, Y.-W.; Feng, J.-Y. Investigation of the Influence of Small Hole on the Fatigue Crack Growth Path. J. Fail. Anal. Prev. 2016, 16, 391–399. [Google Scholar] [CrossRef]
- Alshoaibi, A.M. Comprehensive Comparisons of Two-and Three-Dimensional Numerical Estimation of Stress Intensity Factors and Crack Propagation in Linear Elastic Analysis. Int. J. Integr. Eng. 2019, 11, 45–52. [Google Scholar] [CrossRef] [Green Version]


Publisher’s Note: MDPI stays neutral with regard to jurisdictional claims in published maps and institutional affiliations. |
© 2021 by the author. Licensee MDPI, Basel, Switzerland. This article is an open access article distributed under the terms and conditions of the Creative Commons Attribution (CC BY) license (https://creativecommons.org/licenses/by/4.0/).