Article

Impact Sound Generation for Audiovisual Interaction with Real-World Movable Objects in Building-Scale Virtual Reality

Graduate School of Informatics, Nagoya University, Nagoya 464-8603, Japan
*
Author to whom correspondence should be addressed.
Appl. Sci. 2021, 11(16), 7546; https://doi.org/10.3390/app11167546
Submission received: 24 June 2021 / Revised: 11 August 2021 / Accepted: 13 August 2021 / Published: 17 August 2021
(This article belongs to the Special Issue Innovative Solutions for Augmented and Virtual Reality Applications)

Abstract

:

Featured Application

Building-Scale Virtual Reality Simulation and Training.

Abstract

In building-scale VR, where the entire interior of a large-scale building is a virtual space that users can walk around in, it is very important to handle movable objects that actually exist in the real world and not in the virtual space. We propose a mechanism to dynamically detect such objects (that are not embedded in the virtual space) in advance, and then generate a sound when one is hit with a virtual stick. Moreover, in a large indoor virtual environment, there may be multiple users at the same time, and their presence may be perceived by hearing, as well as by sight, e.g., by hearing sounds such as footsteps. We, therefore, use a GAN deep learning generation system to generate the impact sound from any object. First, in order to visually display a real-world object in virtual space, its 3D data is generated using an RGB-D camera and saved, along with its position information. At the same time, we take the image of the object and break it down into parts, estimate its material, generate the sound, and associate the sound with that part. When a VR user hits the object virtually (e.g., hits it with a virtual stick), a sound is generated. We demonstrate that users can judge the material from the sound, thus confirming the effectiveness of the proposed method.

1. Introduction

Various attempts have been made to extend our experience of the real world by combining virtual space/objects with real-world ones, by means of 3D graphic technology. augmented reality (AR) is used for exactly this purpose. Although there are two distinct types of AR, namely, the optical see-through type (e.g., Microsoft’s HoloLens https://www.microsoft.com/en-us/hololens, accessed on 24 June 2021) and the video see-through type (e.g., Apple’s iPhone with ARKit https://developer.apple.com/augmented-reality/, accessed on 24 June 2021); both need to recognize all the objects in the real world that fall into human sight in real time. This makes the overhead very large.
In contrast, virtual reality (VR) can create a completely new world, so it tends to be unrelated to the real world. This can be problematic for types of VR, such as room-scale VR, where users roam about in a room, because it does not work well unless situations in the real world can be recognized.
Our proposed method is essentially a way to capture the real world as it is and transform it into a virtual world, with processing, as necessary. By doing so, while recognizing the situation of the real world, we can build a new world, after removing things unrelated to the current task from view.
Further, in order to enable multiple users to act naturally and change the environment according to the desired purpose (e.g., moving from room to room), the entire inside of the building can be made into a virtual space. This method is called building-scale VR.
Building-scale VR virtualizes the entire indoor area of a building in the real world to make it possible to accurately track the positions and movements of users throughout the area. Various applications are conceivable. For example, it could be used to help simulate a situation in which reality is difficult to reproduce. One such situation is the occurrence of a disaster, for which building-scale VR could be used to give many people the simulated experience of a disaster, in a realistic manner.
Several technologies are used for creating building-scale VR, as listed below. Due to space limitations, we do not discuss the following technologies in great depth, but please see [1] for details.
(1)
Automatic generation of indoor 3D maps—technology for creating a 3D map that faithfully reproduces the actual 3D shapes in a building.
(2)
Enlargement of human tracking area by deep learning—technology for tracking the pose (position and orientation) of users moving around the indoor area of a building.
(3)
Tracking of user’s hands by visual-inertial odometry—technology for manipulating objects with both hands in virtual space.
(4)
Modification of building-scale indoor scene—technology for modifying VR space in accordance with its intended usage by segmenting or replacing 3D point clouds.
(5)
Representation of people in the area—technology in which people are displayed in a virtual space and all of them share the same information as in real life.
(6)
Simulation of behaviors and phenomena—technology to simulate human behaviors and physical phenomena in virtual space.
We have previously developed an application for building-scale VR, in which we conduct virtual training in disaster situations [1]. This training is not only for evacuation scenarios, in cases of fire, but also for firefighting activities using a fire extinguisher. We have also conducted behavioral simulations during floods.
Other applications include support for presentations and discussions in virtual meeting rooms. Specifically, we developed an application that creates a 3D map of a meeting room in the real world with presentation slides and other materials that are displayed on a virtual screen to enable a meeting to be held, in the same way as in reality. A key feature here is that we can display a 3D object and have a meeting while referring to the object. This is a meeting that can only be performed in a space that extends the real world.
In building-scale VR, it is necessary to reconstruct the real world, in both visual and auditory terms. Since it is impossible to reproduce, in real time, the dynamic environment of the real world in virtual space, we create a virtual environment that has almost no change, in advance. Then, the changing environment (mainly a movable object) is reconstructed in the virtual space in real time. As for the auditory environment, a sound is presented when an object collides with the reconstructed environment, which enables the real-world environment to be reproduced in more detail. As a result, the VR play area can be extended to the entire building, and a larger, more realistic experiment can be performed in the virtual space.
In this paper, we propose a dynamic generation system of impact sounds, related to dynamically reconstructed objects, as an implementation of an auditory environment in building-scale VR. In the proposed method, the material of the target object is first estimated based on a component image of the object. The estimation model is trained using an existing dataset, in which the image of the object and the impact sound are associated with each other, and then the estimation model is transferred to the model, according to the actual usage environment of the system. In this way, we can estimate the material of the object that matches the environment assumed by the user. We generate multiple component images for the object image, acquired from the real space, by performing component segmentation with processing, based on pixel information and clustering.
Next, a generative model, that outputs a spectrogram image of the impact sound with the material label output by the material estimation model, is constructed using generative adversarial networks (GANs) [2]. With the architecture we propose, we can obtain better results than the existing methods by comparing the generated images. The generated spectrogram image is converted into sound data by the Griffin-Lim algorithm [3]. By constructing a series of systems, from the acquisition of the component image of such an object to the generation of the impact sound, it is possible to present the user with the impact sound for the real-world object reflected in the virtual environment. In addition, by using GANs, we can present various impact sounds that are not limited to the sound data in the dataset.
Our main contributions are three-fold: (1) a dataset of spectrogram images, based on the existing “Greatest Hits” dataset, whose creation method can be applied in the future, when a new dataset of sounds is constructed, (2) a method for generating impact sounds from object images in real time using GANs, and (3) the results of our evaluation experiment of the proposed method, conducted with subjects.

2. Related Work

2.1. Augmented Reality and Real Walking with VR

Augmented reality (AR) enhances the sense of reality by superimposing virtual objects on the real world in real time [4]. With AR, walking is easy because reality is mainly displayed as it is. However, it gets more difficult when part of the information in the real environment is replaced with virtual information [1]. In addition, there are many technical problems, due to device restrictions [4,5,6].
Mechanisms for avoiding collisions with real objects during the VR experience include displaying a bounding box around a real object, displaying a real object as a 3D model, and overlaying an image of a real object on the virtual world using a camera. According to Scavarelli et al., displaying a 3D model is the best of these three methods, in terms of adjusting the movement speed around obstacles and ensuring the desired impression of the user. In addition, the display of a bounding box is excellent, in terms of safety, such as for collision avoidance [7]. In our proposed system, real objects are displayed as point clouds, which is similar to the mechanism of displaying a 3D model.
Generally, for avoiding collisions with real objects in VR, VR spaces that reflect a real environment are created in advance. For example, Oasis [8] utilizes a mechanism for creating a VR space and enabling real walking that uses a pre-scanned real environment. As a mechanism for expanding the play area, Keller et al. proposed a system that enables real walking by dynamically acquiring the environment around the user and integrating it with the virtual space [9]. In these examples, a VR space is created in advance, in order to enable real walking. When creating a VR space in advance, it is necessary to recreate the space as the environment changes, such as when an object moves.
An additional example that enables real walking is DreamWalker [10], where object collision, when walking outdoors, is prevented by using a technique called “redirected walking”.
In our system, real walking is made possible by displaying a real environment, in VR space, in real time. With real-time reflection of changes, it is not necessary to recreate the VR space every time there is a change to the environment. Further, by not displaying real objects as they are and not using techniques such as redirected walking, it is possible to not only avoid real objects but also to move them in VR.

2.2. Sound Manipulation in VR

Considering how the user perceives sound in the VR space, and what kind of effect it has, is an indispensable element for enhancing the user’s immersive feeling. Sound not only conveys the depth of space to the user but also makes the virtual space more immersive by enabling interaction with objects, to help with recognition of the space. In addition, setting a sound source that synchronizes the movement of sound with the movement of the image in the VR space can reduce VR sickness, compared to when sound is asynchronous with the image.
Several studies have discussed the feasibility of auditory stimuli in VR and their impact on the VR experience. Fujioka et al. [11] conducted research on multisensory integration in the category of perception of materials. They conducted audiovisual experiments that combined the visual appearance of six materials with the impact sound of eight materials and found that the visual stimulus and the auditory stimulus were strongly correlated in perception, and the user could perceive different materials when the visual stimulus of a certain material and a different sound were combined.
Especially when the visual information is ambiguous, the auditory information becomes the dominant factor in determining the material of the object. Kern et al. [12] conducted an experiment on how the presence or absence of footsteps, synchronized with the user’s movement, affected the user’s VR experience and found that the presence of footsteps improved the sense of immersion and reality. In this way, in a virtual environment, where visual information occupies most of the spatial recognition, the user can correctly recognize the virtual environment by using auditory information as an aid.
An example of VR aimed at grasping the environment and avoiding obstacles, by utilizing such sounds, is a VR experience aimed at training a white cane for the visually impaired. Lahav et al. [13] conducted experiments aimed at acquiring spatial cognitive mapping and orientation skills for the visually impaired by using a virtual environment and obtained promising results. Inman et al. [14] also conducted spatial recognition training in a virtual environment for the visually impaired and found that sound provides a certain spatial orientation that can be used to detect and avoid obstacles. They also demonstrated that listening to footsteps helps users to judge the texture of various terrains and understand the speed of movement.
Siu et al. [15] developed a system, in which visually impaired people navigate by sound and vibration, in order to walk in a complicated virtual environment. They selected five materials for navigating the virtual environment (tile, concrete, metal, wood, and carpet) and had users hit the virtual environment itself or the virtual object with a white cane-shaped controller, through which they received the sound and vibration.
Since sound has a temporal property, the presence of sound leads to the feeling that “something is happening”; as such, it is a useful supplement to visual information.

2.3. Sound Generation in VR

The studies above have focused on ways to supplement information, other than visual information, in virtual environments. Here, we describe research on generating synthetic sounds suitable for objects in real time and methods for generating signals with time-series information at a lower cost.
Rausch [16] proposed a sound synthesis method for real-time applications and evaluated it by a virtual excavation task that combined the synthesized vibration sound and tactile vibration. The mesh information of the objects in the virtual environment was acquired, and sound synthesis was made possible in real time by implementing the modal synthesis method with the material parameters of the objects as inputs. However, such physical-based calculations are costly and cannot be applied to objects displayed as point clouds (such as [1]).
Cirio et al. [17] performed sound synthesis, corresponding to the refraction phenomenon of virtual objects, by a physics-based algorithm that synthesizes sounds suitable for animation from the shape and deformation of the surface mesh of the object. Objects that exist in the virtual environment are formed on the surface by a collection of polygons called meshes. They conducted an experiment to synthesize sound, according to the animation of a mesh that deforms at the same time as a virtual object deforms.
For sound synthesis in our method, we use linear modal analysis, by modal synthesis, to divide the dynamically deforming mesh and further reduce the calculation cost. Linear modal analysis examines the dynamic characteristics of a linear structure, based on a simulation performed, using finite element analysis. In this analysis, the sound presented by the material class is distinguished by using parameters, based on the viscosity damping ratio, with respect to the material. This technique is similar to our system, in that it does not require pre-recorded data of generated sounds for virtual objects, because it synthesizes them dynamically. The generation of synthetic sound, by a physics-based approach like this, may be superior to spectrogram image conversion, in terms of sound quality and accuracy, but at the same time, there are some problems.
First, in order to generate synthetic sounds for each material, based on physics, a stiffness matrix, that shows each material property as one parameter, is required. There is a physics-based linear modal analysis approach that addressed this issue [16]. However, since all of these parameters are responsible for the difference in sound, depending on the material of the object, it is difficult to apply this method to cases where the parameters are not available or where unknown materials are used.

2.4. Content Generation by Deep Learning Techniques

There have been attempts to generate time-series data using GAN, instead of physical-based generation. Ban et al. proposed TactGAN [18], a GAN-based system that expresses the texture of each object by vibration. As with sound, vibration can be used for expressing a texture, such as surface roughness or hardness, when it touches an object. In recent years, many vibration devices have appeared, but vibration is currently limited to use as symbolic feedback for touch responses and input operations.
TactGAN features a tactile feedback that generates a tactile sensation, by vibration, that matches the surface image of the texture and the attributes of the material as inputs to improve the productivity of the texture design. What should be noted here is that the vibration tactile signal is indirectly generated through the time-frequency domain representation, in which vibration information can be calculated as an image from the acceleration signal by utilizing GAN. It has been shown that effective data can be generated by using GAN from time-series data. In fact, speech synthesis, using GAN, has already been tackled in the field of spoken language, and Donahue et al. have demonstrated the generation of speech data that is comparable to human speech by WaveGAN [19].

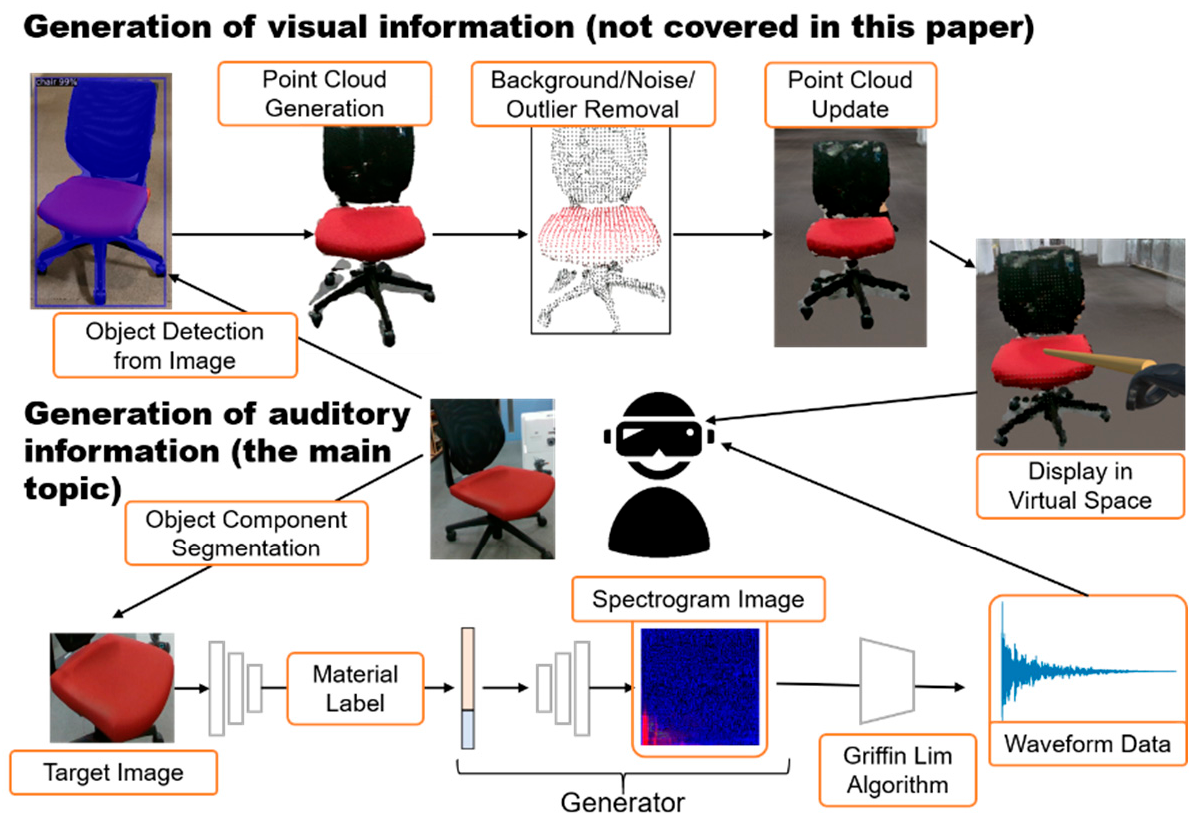
3. Audiovisual Interaction with Real-World Movable Objects

In the proposed system, a physical object is recognized by object detection, the recognized object is divided into its components, and impact sounds are generated, according to those materials.

3.1. Devices

We used the VIVE Pro from HTC as the HMD for VR in our system. An Intel RealSense D435i (hereafter, “RealSense”) was mounted on the front of the HMD as a RGB-D camera for 3D object data generation (Figure 1). The location of a real-world object was calculated from the position and orientation of the HMD, and the depth information was acquired from the RGB-D camera. Then, it was displayed in VR space. The position and orientation of the HMD were determined by using SteamVR Tracking 2.0, which was an outside-in tracking method, and by installing sensors called “base stations” in the outside environment. This system was implemented using the game engine Unity and the Python programming language.
Our experiments were conducted with the equipment shown in Figure 2.
When generating sound from a reconstructed real-world object, a rod-shaped object (as shown in Figure 3) appeared and was used to hit the object.

3.2. System Configuration

Here, we describe the process of the entire system, from object recognition to impact sound presentation, in VR that reproduces the real world. The configuration of the system is shown in Figure 4.
In generating the visual information of the object, the position and shape of the movable object were reproduced in the VR space, based on the information from the RGB-D camera attached to the VR headset. At the same time, image processing divided the components into images and generated impact sounds for each component. Next, the impact sounds were associated with the generated 3D object data. The details of the generation of visual information will be presented in a future report, due to space limitations. Here, we describe the division into component images in Section 4, and the generation of impact sounds in Section 5.
As stated earlier, the objective of this research is to dynamically generate VR content that reflects the real world, and the impact sound, in the VR system that needs to acquire movable objects in real time. For this purpose, it is first necessary to acquire object images. Our object image acquisition is premised on acquisition from the RealSense, attached on the front of the HMD. First, the surface image of the material is acquired by performing object component segmentation using color information. There are also methods of decomposing an object into its components, based on the point cloud [20,21], but in this research, we emphasize real-time characteristics and, thus, adopt a more efficient image-based method.
The system recognizes a real-world object by image recognition using the deep learning model YOLO v3 [22], acquires a point cloud of the recognized object with the RGB-D camera, and displays it in real time in VR space.
Next, material estimation was performed using CNN as intermediate information for associating the material with sound, and the material class was estimated from the texture image of the object component. Using the estimated results, a spectrogram image was generated, based on the material class by the trained generative model. The input to the generative model was a concatenation of the categorical variable c (one-hot vector), which represented the attributes of the estimated material, and the random noise z. The generator generated a spectrogram image, based on this input label; the image is converted into waveform data, and the sound is presented to the user. By using the above system, the user can acquire the dynamic impact sound in the virtual environment with the object image as the input.

4. Object Segmentation into Components and Their Material Estimation

4.1. Dataset

In the proposed method, spectrogram images are generated, based on the label of the material. We explain here the learning of the material estimation model and the dataset used as training data for spectrogram image generation. For the dataset, we use the Greatest Hits dataset, published in [23]. It consists of 46,577 actions, derived by detecting the scene from 997 videos of hitting various objects with a drumstick. Actions, materials, reactions, and hit times are annotated in each video. Table 1 lists the number of acquired data.
As training data for material estimation, material images with labels from these data were used. In order to obtain the material image of the object from the annotated video, the movement of the drumstick was detected using dense optical flow [24]. This was done by calculating the dense optical flow in the frame, based on the algorithm proposed in [3], every –0.5 to 0.5 s from the annotated striking time. The material surface image of the striking object was acquired by trimming an image to 150 pixels wide × 150 pixels high from the acquired points.

4.2. Material Estimation

To create the label of the material used for spectrogram image generation, we used the result of material estimation from the surface image of the object. This section first describes the learning model used for material estimation, and then goes over the problems when applying the trained model to an actual usage environment, and the component division performed for improvement. Finally, we describe transfer learning, using the trained model.
Learning for material estimation was performed using the images in the dataset. For material estimation, we use the Deep Encoding Pooling Network (DEP-Net) for ground terrain recognition tasks, proposed by Xue et al. [25]. DEP-Net is a network, based on 18 layers of ResNet [26], for the purpose of terrain recognition tasks, and the output from the convolution layer is divided into an average pooling layer and a texture encoding layer, with learning performed in different networks. It classifies various object images by processing with a bilinear model [27].
In this study, we performed material estimation using DEP-Net, in consideration of the case where it was difficult to obtain only the surface image of the material of the object.
Figure 5 shows the confusion matrix of the learning results. We can see that the accuracy was 80% or more, in all material classes, and that sufficient accuracy was obtained in the Greatest Hits dataset.
Since the Greatest Hits dataset contains data in a general environment, it is possible that sufficient accuracy cannot be obtained for individual data in an environment that actually uses the proposed method. Therefore, we verified the accuracy of the material estimation in the data, acquired from the execution environment, using the trained model.

4.3. Object Component Segmentation

In the actual usage environment, an object was recognized by YOLO v3 [22] from the color image of RealSense worn on the VR headset, and the material was discriminated from the image area of the acquired object, as a result. Therefore, we investigated the accuracy of the material discrimination model, in such a situation. Figure 6 shows an example of the data acquired in the usage environment, and Table 2 lists the accuracy, when the data was recognized, using the trained model. Each item in Table 2 shows the ratio classified into each material, as a result of verifying each object with multiple images.
The results in Table 2 include the classified materials in the images from Figure 6, but as we can see, the recognition accuracy deteriorated, because multiple materials were included in the image. Another factor is that the image area, recognized by the object recognition of YOLO v3, included the periphery of the object and was wider than the image of the dataset used in the training.
The image identified, by the object recognition above, was displayed in a bounding box that surrounded the entire object, as shown in Figure 7. We found that the recognition accuracy of the material estimation decreases, in the case of an object consisting of multiple components, which indicates that further subdivision of each component from the recognized object is needed. Processing was, thus, performed in the following three steps, for object component segmentation.
(1)
Reduce color information by grouping pixels that differ in distance and color.
(2)
Obtain the HSV value using a superpixel technique [28] and perform clustering using the k-means method.
(3)
After determining the range from the hue (H) value, based on the segmentation results, perform trimming.
Figure 8 shows an example of the component segmentation for an object.
In Figure 8a, the color information of the object image, acquired from the bounding box detected by object recognition, was reduced, based on [28]. In Figure 8b, we can see that the color information of the detailed part was reduced from the object image. Next, in Figure 8c, the color for each pixel was acquired by HSV from the image after reducing the color information, and clustering was performed using the k-means method. The number of clusters was the one with the highest accuracy, on average, among trials of two-to-five classes. We chose three clusters, in consideration of the average number of components contained in each object.

4.4. Transfer Learning

To improve the recognition accuracy of material estimation in the real environment, transfer learning was performed, using the image data of each material acquired in the actual usage environment. The number of material classes was also reduced, based on the acquired data. Therefore, the material classes to be utilized here were changed from the 16 classes, included in the Greatest Hits dataset, to six classes, based on data that can be acquired in the actual usage environment: cloth, glass, metal, paper, plastic, and wood.
In addition, the dimensions of the output layer were changed to six, in order to perform transfer learning on the trained model. Table 3 shows examples of data and the number of data acquired from the actual environment, that is, examples of images of materials of each class and how many we used. Transfer learning was performed using the images of this training data.
Table 4 shows the recognition results of the trained model and the model after transfer learning for each material class. We can see that the material estimation recognition accuracy was improved in all classes, and sufficient classification accuracy was obtained.

5. Impact Sound Generation for Object Materials

5.1. Generative Adversarial Networks

In recent years, deep generative models, for sampling data from high-dimensional data distributions, have been attracting interest. Among these, GAN is a method mainly for the purpose of image generation and has been utilized for high-resolution images and property synthesis, such as transferring the features of one image to another. GAN was first proposed by Goodfellow et al. [2], and they showed that it is also possible to generate data that is not included in the training data.
The purpose of GAN is to obtain generated data P g x that matches the training data distribution P r x . To achieve this, it constructs a learning network, consisting of two networks, to generate data: a Generator and a Discriminator. The first network, Generator, takes random numbers, z ~ P r z , as inputs and maps them to the data space x = G z .
The second network, Discriminator, gives the probability p = D x 0 , 1 , if the input data x is sampled from P r x , generated by Generator. Then, if it is sampled from the training data, P g x , the probability 1 p is given. In each learning, Generator learns, so that the generated data gives the probability 1 p , at the input of Discriminator. Then, Discriminator learns by competing with Generator, so that the generated data and the training data can be distinguished.
The objective functions of Generator and Discriminator, in learning, are expressed by Equation (1) below, and optimization is performed by the objective functions of Min-Max. V represents the value of the objective function, and D and G represent the Discriminator and Generator, respectively. D x is the output of Discriminator, and G z is the output of Generator; p z indicates the distribution of random numbers, and E indicates the expected value.
min G   max D V D ,   G = E x ~ p r x log D x   +   E x ~ p x x log 1 D G z
Odena et al. proposed the Auxiliary Classifier GAN (AC-GAN) [29], as a conditional GAN that limits the generated data. Unlike the standard GAN mentioned above, AC-GAN generates data by inputting, not only the random number z, but also a label that combines the attribute label c of the data as the input of the Generator. The Discriminator determines whether the input is “training data” or “data generated by Generator” for the generated data, as in GAN, and simultaneously determines which input image is based on the attribute label c. It also classifies whether it belongs to a label.
By using the above network structure, it is possible to construct a learning network, based on the estimated labels. In doing so, we expect that the impact sound can be generated, based on the condition of the material label and the texture image, which is the purpose of this research.

5.2. Generation of Time-Series Data

As mentioned earlier, GAN is mainly used for image generation, but in recent years, it has also been applied to the generation of time-series data, such as voice generation and vibration data. Here, we focus on using the GAN architecture, for the purpose of generating such time-series data.
Chris et al. [19] compared the generation results of two GAN architectures: WaveGAN, which convolves as a one-dimensional array when modeling time-series data centered on acoustic data (i.e., spectrogram images), and SpecGAN, which models acoustic data in a two-dimensional time-frequency representation.
They found that SpecGAN had a better Inception Score, which indicates the evaluation of the quality and variation of the generated data, with the standard evaluation index of GAN. On the other hand, WaveGAN had better sound quality than SpecGAN. Chris et al. also pointed out that a large amount of audio sampling is a possible advantage of learning by GAN. We, therefore, expect GAN to be useful for the dynamic generation of impact sound, which is the purpose of this study.

5.3. Proposed GAN Architecture

In our method, we focused on GAN for image generation and applied it to dynamic impact sound generation. This section outlines the following three points, related to the characteristics of the neural network architecture used in this study.
  • Introduction of residual block, from the SRResNet structure used for super-resolution image generation in Generator
  • Introduction of residual block to Discriminator
  • Introduction of projection to Discriminator, to improve accuracy for multi-category tasks.
Residual block is an architecture based on the deep residual network (ResNet-50) [26] used in architectures such as TactGAN [18] and SRGAN [30]. By using a shortcut for this network, gradient disappearance and gradient explosion can be prevented, which enables a deeper network structure. Figure 9 shows the basic architecture of residual block. In ResNet, the purpose is to learn H x = F x + x by inserting a network structure, called skip connection, as shown in x: identity, in Figure 9. That is, the difference is trained for the two weight layers in Figure 9, namely, F x = H x x . This network structure is called Residual. Here, H x indicates the function that we want to learn. The problem of gradient disappearance can be avoided by learning the difference from the function H x to be learned.
Figure 10 shows the architecture constructed by the residual block in this study, which is based on WGAN-GP [31].
In Discriminator, downsampling is performed by average pooling, after the second convolution. Learning can be stabilized by using a normalization function, or activation function, as the processing, after each convolution layer [32]. There are several types of activation functions, but Discriminator uses the Leaky ReLU function. The Leaky ReLU function is an improved version of the ReLU function and, having a small gradient at x < 0 , can prevent the gradient from disappearing, due to the input of a negative value.
In Generator, the basic structure is the same as Discriminator, but the normalization function is included before the activation function, and there is an upsampling layer, instead of average pooling. The ReLU function is used as the activation function. The formulae of the ReLU function and the Leaky ReLU function are shown in Equations (2) and (3), respectively. The downsampling and upsampling procedures are constructed according to the implementation in [33].
We determined the activation function by referring to related studies, such as TactGAN.
f x = max 0 ,   x
f x = x     ( x > 0 ) a x     x   0
Figure 11 shows the GAN architecture, constructed using the residual block architecture.
Next, we explain the Projection, shown in the Discriminator architecture. In our method, the generation of spectrogram images, based on the material labels of texture images, is required. In AC-GAN [29], this is done by simultaneously discriminating both Real/Fake input images and the class labels. A similar method is utilized in the TactGAN architecture [18], but it has the disadvantage of the learning becoming more difficult, since the loss function term of Discriminator increases. As a countermeasure, we introduce Projection [34], as shown in Figure 11b.
In [34], the output of Discriminator is expressed by decomposing it into the sum of two log-likelihoods. Therefore, we derive the output of Discriminator using Equation (4).
f x ,   y ; θ   : = f 1 x ,   y ; θ + f 2 x ; θ = y T V ϕ x ; θ Φ + ψ ϕ x ; θ Φ ; θ Ψ
For the output function f of Discriminator, x is the input image, y is the condition vector, and θ is the parameter. The second term on the right side of Equation (4) shows ψ, which is one of the outputs from ϕ, and the first term embeds the first output of ϕ and the condition vector y. This makes it easier to control because the loss function is only adversarial loss, unlike with AC-GAN. Ref. [34] is also aimed at super-resolution image generation by label classification, as in the AC-GAN GAN architecture, and when the conditional GAN model is applied, the accuracy of label classification is higher than that of the conventional concatenation-based conditional GAN, achieving higher quality, super-resolution generation.
Miyato et al. came up with an architecture, based on Residual Block. Based on their research results, we found that it should be possible to introduce it into the architecture of this research and, thereby, to improve the accuracy for the task of generating the impact sound for each material label. By introducing Projection, we can generate spectrogram images of various classes and represent material classes continuously, so if the input is not one-hot, that is, the difference between classes, learning can also be expected in spectrogram image generation, in which the estimation result of the material class is directly input.
For image generation, our method performed learning using the architecture based on Residual Block. Adversarial loss and gradient penalty [31] were used as the loss functions during learning based on DRAGAN [35]. Each weight is 1.0, for adversarial loss, and 0.5, for gradient penalty. We used Adam (α = 0.0002, β1 = 0.5) [36] as the weight optimization method.
Before performing the spectrogram image generation experiments, it was necessary to create a dataset using the generative model. We first describe the restrictions on the dataset and the material label (class) we used, and then present the algorithm for spectrogram image generation.
When learning, using a deep learning model, it is important to use a dataset suitable for the purpose. In addition, with learning aimed at generating different data, as in this study, it is important that the data distribution in the dataset, that is, the interclass and intraclass variance of the dataset, be suitable for the application.
Therefore, we needed to determine the validity of the dataset to be used as training data. The proposed method utilized the Greatest Hits dataset to generate spectrogram images, based on material labels. In this dataset, as the material label is annotated with the sound of each action of the object in the video, we considered it suitable for the purpose of learning.
As mentioned earlier, this dataset contains 17 classes of material data, and in theory, all of them can be trained. However, learning becomes difficult, depending on the distribution of data in all classes. Therefore, to investigate the variance in the data used for learning, we visualized the training data, based on TactGAN. Principal component analysis (PCA) was used as the method of dimensional compression of images for visualization. PCA is an effective tool for investigating the distribution of images and is mainly utilized for visualizing the similarity between multiple image data and clustering results. The method of converting audio data into images is described later.
Figure 12 shows the results of visualizing 100 items of data, randomly acquired from each class in the Greatest Hits dataset.
As we can see, learning is expected to be difficult here because there are no clear features in the distribution between the data in all 17 classes. This is why we decided to use six classes (cloth, glass, metal, paper, plastic, and wood) for the training of the material estimation model of the texture image. Figure 13 shows the results of the same analysis using the data of these six classes.
As we can see, the variance between classes here is easier to characterize, compared to in Figure 12. A few of the classes have similar variances, but to some extent, this is unavoidable, due to the characteristics of the impact sound data. For the above reasons, we selected the six classes (cloth, glass, metal, paper, plastic, and wood) as the material classes used in learning.

5.4. Converting Sound into Spectrogram

Our aim was to achieve effective learning in GAN by converting time-series data, such as impact sounds, into two-dimensional data, that is, image data. For the dataset, we needed to convert the sound data of the impact sound into a spectrogram image, which represented the time change of the frequency characteristics of voice data. By performing short-time Fourier transform (STFT) on speech data, the frequency characteristics (=spectrogram) of the specified section can be obtained.
The spectrogram is composed of time, frequency, and amplitude elements for time-series data. Therefore, by converting the amplitude level into color, it is possible to display the time on the horizontal axis and the frequency on the vertical axis in two dimensions. Figure 14 shows the spectrogram image dataset for the GAN training model, created using the Greatest Hits dataset.
Sound data for 0.4 s was acquired from the hit start time for each class from the dataset. Since Owens et al. [23] demonstrated that sounds can be separated by 0.25 s or more, we adopted 0.4 s, to make each image one impact sound. At this time, the sampling frequency was 16 kHz, and a spectrogram image was generated by STFT, with a sample point of 512, a Hamming size of 512, and a hop size of 128. We call the dataset, created by the above processing, the Hits Spectrogram Dataset (HSD).

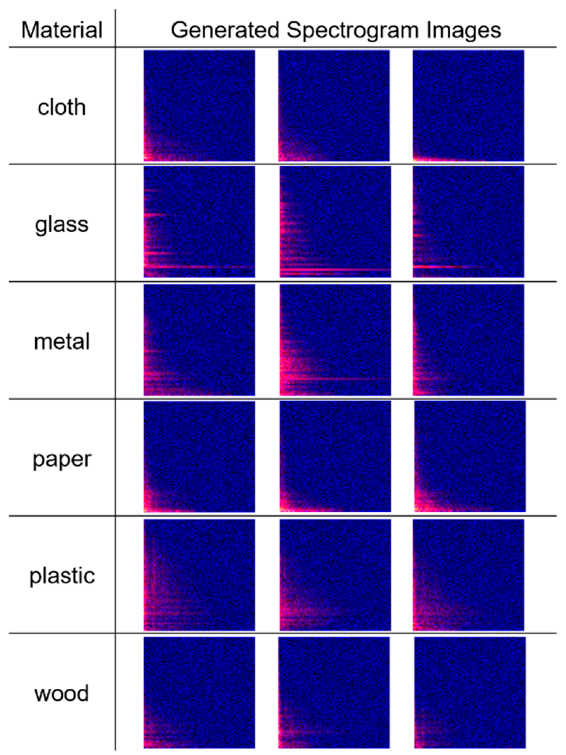
5.5. Results of Learning

Figure 15 shows the results of learning by HSD using the two GAN architectures, constructed based on residual block and our proposed method. The two columns on the left are the sample data, that is, the images extracted from the HSD, and the central two columns are the results of training using the GAN architecture based on Residual Block. The two columns on the right are generated images, as the result of learning using the GAN architecture, by the proposed method.
In order to quantitatively evaluate the generated image (by the trained model, using the GAN architecture), we performed the evaluation based on Fréchet Inception Distance [37] (FID). The FID can calculate differences in feature representations extracted from pre-trained inception networks, with standard datasets, such as CIFAR-10 and ImageNet. As a result, it is frequently used as an index for quantitatively judging the quality of the generated image.
A low FID means that the actual sample and the generated sample are more similar. Assuming that the distribution of each image is the set A i , each element is a A i , and the output of the Inception network is h, the formulae for obtaining the mean vector μ and covariance Σ of each image group are as follows.
μ = 1 A h H h
Σ = 1 A 1 h H h μ h μ T
Assuming that the feature vector, obtained from the trained inception network, follows a multivariate normal distribution, the formula for calculating the Wasserstein-2 distance between the distributions of image sets A 1 and A 2 is as follows.
FID A 1 , A 1 = μ 1 μ 2 2 + T r Σ 1 + Σ 2 2 Σ 1 × Σ 2 1 2
Table 5 lists the results of the compared learning models using this index. The learning models used for comparison are as follows. WaveGAN, which is a method for generating sound data by GAN, and TactGAN, which generates tactile vibration using spectrogram images, were learned using the datasets. The DCGAN model, which was referred to as the structure of the loss function, was trained in the same way. The learning model based on residual block and the learning model based on residual and SE block (Squeeze-and-Excitation Block) [38] were trained using the same dataset. A total of 2400 spectrogram images, generated using each GAN learning model, were randomly selected, and the FID with the sample images was calculated.
The SE block, proposed by Hu et al. [38], is not a specific network but, rather, one component in the network. One advantage of SE block is that it can be expected to improve the accuracy of existing models, while suppressing the increase in the amount of calculation of the entire model.
As we can see in Table 5, the proposed method obtained the best evaluation in the FID evaluation index. In addition, the FID value of the proposed method was smaller than that of the proposed method combining residual block and SE block and the generative model of only residual block. These results demonstrate that the SE block architecture is useful, for the purpose of this learning.
Next, we discuss the correlation between the evaluation of the FID value and the sound evaluation. In general, in GAN learning for the purpose of image generation, as described above, the smaller the FID value, the closer the distance between the training image group and the generated image group; we can presume that the training data succeeded in generating more similar images. The results, shown in Table 5, confirmed that the proposed method was able to generate data closest to the training data, among the compared learning models.
On the other hand, when Chris et al. [19] compared SpecGAN and WaveGAN, they found that SpecGAN had an excellent evaluation when using the Inception Score [39]. However, in the evaluation using human subjects, WaveGAN was superior, in terms of sound quality and intelligibility. This indicates that the evaluation of the model’s performance and the evaluation of the generated time-series data do not always match in the evaluation of the generation results of the time-series data using GAN. Therefore, we conducted a subject experiment to investigate whether the time-series data (impact sound), generated by the proposed method, satisfied the criteria (that it can be utilized for the user’s activities in a virtual space). The details of the experiment will be described later.

5.6. Sound Generation from Spectrogram Images

As discussed in the previous section, it is necessary to convert the spectrogram image, generated by the generative model, into sound data, in order to present the impact sound. To create a dataset for learning the generative model, we converted the sound data of the impact sound into the generation of the spectrogram image. At that time, the time-series data was transformed into an amplitude spectrogram, obtained by STFT. In this amplitude spectrogram, the characteristic structure of sound data tended to appear, which was useful for processing and compositing in many situations. In this study, as well, we used the amplitude spectrogram as image data, to generate an image using a generation model.
In order to present the impact sound to the user, based on the generated spectrogram image, it is necessary to convert the spectrogram image into sound data. As mentioned earlier, the spectrogram is composed of time, frequency, and amplitude elements for time-series data, but lacks phase information. Therefore, in order to reconstruct the sound data signal from the spectrogram, we restore the phase by using the Griffin-Lim algorithm [3].
The conversion from sound data to spectrogram was performed as follows. First, the result X m ,   k of the STFT was depicted as a complex number. In addition, each m ,   k was provided with an amplitude A m ,   k = X m ,   k and a phase ϕ m ,   k = X m ,   k . Amplitude A m ,   k was called an amplitude spectrogram, phase ϕ m ,   k was called a phase spectrogram, and the power spectrogram, calculated by Equation (8), was used to show the intensity at each frequency component.
X m ,   k 2 = A 2 m ,   k
The spectrogram image used in the learning is this power spectrogram, which was equivalent to the calculation of the magnitude of real and complex vectors from the STFT results. That is, it had X m ,   k as the amplitude, but ϕ m ,   k , as the phase, was lost when converting sound data into a spectrogram. The Griffin-Lim algorithm restores the phase by STFT and inverse STFT.
The amplitude spectrogram X m ,   k was obtained by performing STFT, using the window function w α t . In the Griffin-Lim algorithm, we wanted to satisfy “the phase is consistent with the time signal” from this amplitude spectrogram and proposed the following iterative method for doing so. First, an appropriate initial phase ϕ m ,   k was selected for a given amplitude A m ,   k . Then, after creating X m ,   k = A m ,   k exp j ϕ m ,   k as a spectrogram, based on the initial phase, the following iterative processing was applied.
x t ISTFT X m ,   k
X m ,   k STFT x t
X m ,   k A m ,   k X m ,   k / X m ,   k
X m ,   k , created by giving the initial phase, as described above, is an expression that estimates the correct phase, based on the assumption that the phase is consistent with the time signal. This means that restoration is impossible, even if the inverse STFT and STFT are performed. Therefore, in this iterative method, the phase is obtained with the constraint that the correct STFT expression is obtained while fixing the amplitude to A m ,   k from Equation (9). In this way, the generated image is converted into sound data, and the result is presented to the user.

6. Experiments and Discussion

6.1. Preliminary Experiment

6.1.1. Purpose and Hypothesis

The purpose of the subject experiment was to determine the suitability of the spectrogram image, generated by the proposed method, and the impact sound, generated using the spectrogram image, in the presentation in the VR environment.
The hypothesis here is that humans can estimate the sound generated by striking an object from visual information about the material, that is, they can determine the relationship between the impact sound and the image of the material with a high degree of accuracy.
However, as described in [40], human perception skills in VR change, not only with visual information, such as texture images, but also with other factors, such as sound and rendering.
Furthermore, there are individual differences in human perception, so it is necessary to determine whether each person has sufficient perception skills to achieve the purpose of the experiment. We, therefore, test whether each subject can distinguish the impact sound, based on each material image. In addition, we conducted a preliminary experiment to verify whether there are combinations of materials that are easy or difficult to discriminate.
In the preliminary experiment, we measured the perceptual accuracy of each subject, by assuming that the combination of impact sounds, that matched the material of the object, can be accurately determined. We also determined the combination of materials, for accurately discriminating them. In other words, with this preliminary experiment, we wanted to create an experimental environment, in which perception can be performed, as accurately as possible, when verifying the validity of the generated data.

6.1.2. Subjects

Ten subjects participated in the preliminary experiment (six men, four women, all in their twenties). We first explained the experiment outline and gave them a tutorial on how to use the menu panel in VR. After confirming the operation and volume setting in each trial, we began the perception experiment. After the experiment, we conducted a questionnaire, with a simple interview.

6.1.3. Experimental Conditions and Processes

We used the same experimental data as used to create the spectrogram image data for learning from the Greatest Hits dataset. The material classes used are for six classes (cloth, metal, glass, plastic, paper, and wood). In the experiment, data were selected from three classes, including one correct answer class from these six classes, and the impact sound was presented to the subject.
Each subject performed the experimental task a total of 60 times, to cover all classes. The procedure for each perception experiment was as follows. First, as shown in Figure 16, three cubes were arranged in each VR, and sound was generated by hitting them with the rod-shaped virtual object, shown in Figure 3. Figure 16 shows a scene where we presented the subjects with a wood texture image. A texture image, with a material class corresponding to the correct hitting sound, was presented in the cube, and each of the three cubes generated a hitting sound of a different material class. We also included a condition, where no vibration was generated when the cube was hit, so that the difference in feedback, due to the texture, could be discriminated only by the sound.
In addition to the impact sound, the texture image of the material to be presented was selected from the dataset and presented for each material class, as shown in Figure 17 (cloth, glass, paper, plastic, wood, and metal, from left to right).
In the experiment, the subjects wore an HMD (see Figure 2) and used the VR controller for menu panel operations and hitting operations in the virtual environment. The controller was suitable for the action of hitting, while holding a rod-shaped object, and the same action could be performed with the same controller, using either the left or right hand, regardless of the subject’s dominant hand.

6.1.4. Experimental Results

Table 6 shows all combinations of each material and the accuracy rate of all subjects. The accuracy here was calculated by “the number of correct answers in all subject experiments/all combinations of each material”.
As shown in the table, we found that when all combinations were tried, the proportion of materials, other than cloth, that could be correctly discriminated by the subjects, even when sound was presented from the dataset, was less than 80%.

6.1.5. Discussion and Suggestions for Next Experiment

In the preliminary experiment, the material was perceived only by the enlarged image of the texture and the impact sound, and the shape of the object was only the cube. Therefore, we concluded it was difficult to distinguish the material, because the situation was different from the normal perceptual situation. There was a similar feeling from the subjects, based on their responses after the experiment.
However, even under the same circumstances, there were four or more patterns of all materials, with a correct answer rate of 80% or more. This result suggests that even if only the texture image is presented, it is sometimes possible to perceive with some accuracy, depending on the combination, and that there is a difference in each combination of materials.
Therefore, in the preliminary experiment, the combination, in which the accuracy was 80% or more, was used as the combination capable of correct perception. Table 7 shows the patterns selected, based on this criterion for each material, where the combination of incorrect materials selected for the correct material is indicated by “–”, and each pattern is separated by “,”.
The next problem was the difference in the accuracy rate for each subject. Just as the accuracy differs, depending on the combination of each material, it is possible that each subject has individual differences in their perceptual ability. Therefore, Table 8 shows the accuracy of all materials of each subject for the same material patterns as Table 7.
As we can see here, excluding subjects E and H, all subjects achieved an accuracy of 80% or more, in all selected combinations. We compared the average value of the accuracy of each material for each group, between the subjects whose accuracy was 80% or more, and those whose was not (that is, subjects E and H). The results revealed a significant difference (p = 0.0281 < 0.05), indicating that there is a difference in perceptual ability in the preliminary experiment between these two groups.
On the basis of the above, we selected the subjects with the combination of materials shown in Table 7 and the accuracy of 80% or more in Table 8 and conducted the following experiment.

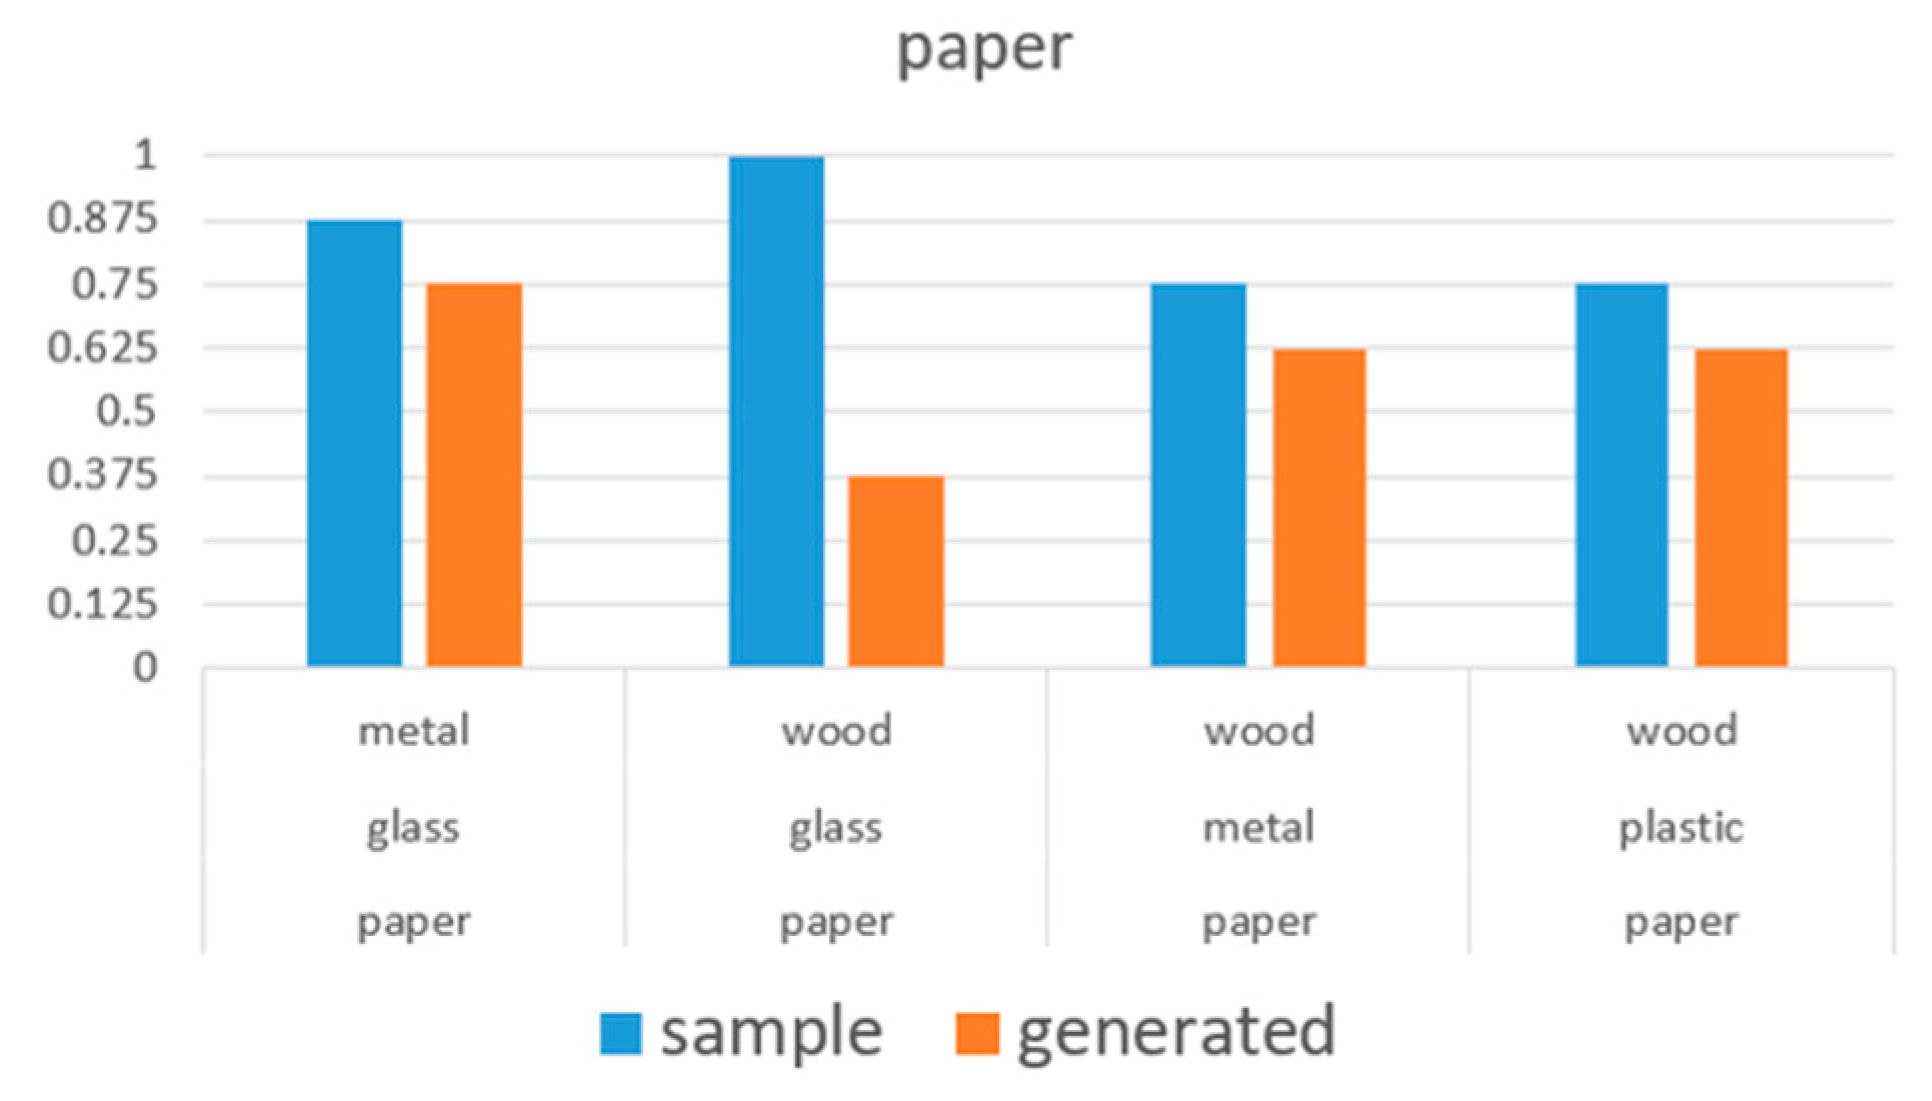
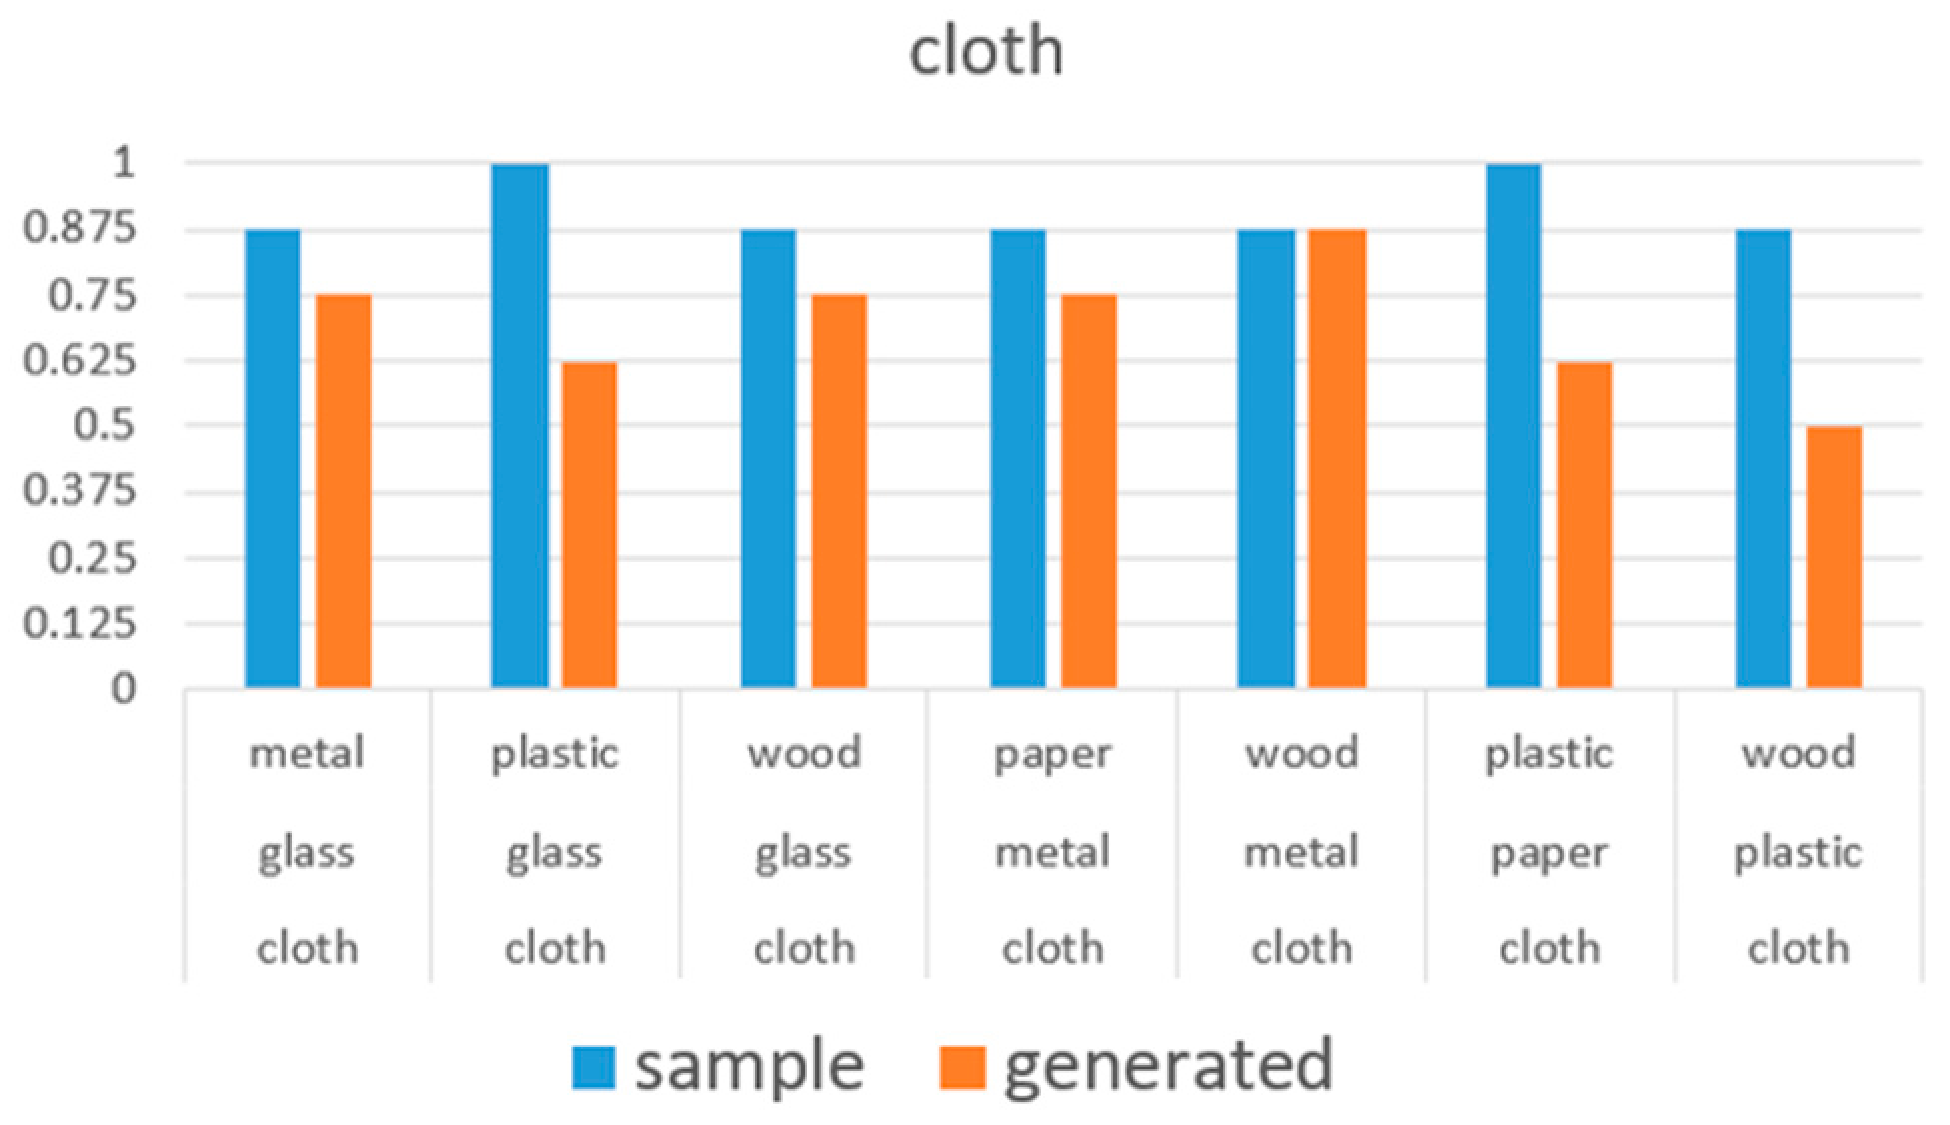
6.2. Evaluation Experiment of Generated Sound

6.2.1. Difference from Preliminary Experiment

In the preliminary experiment, we tried to measure the perceptual accuracy of each subject, which is the ability to accurately discriminate the combination of impact sounds that match the material of the object. In addition, we determined the best combination of materials, to accurately discriminate the materials. In other words, this preliminary experiment was designed to create an experimental environment that enables users to perceive, as accurately as possible, when verifying the validity of the data generated in this experiment.
In the case where all combinations were tried, we found that the percentage of subjects who could correctly discriminate the sounds presented from the dataset, i.e., the sounds that are considered to be the correct answers for each material, was less than 80% for materials, other than cloth.
In other words, even if we investigate the percentage of correct answers to the presentation of the blow sounds generated by the generative model in all combinations, we may not be able to obtain the correct answer, with the correct perception.
In the case of comparing the correct response rates for various combinations, there were more than four patterns of combinations, with a correct response rate of 80% or higher for all materials, indicating that some combinations can be perceived with a certain degree of accuracy, and that there are differences in the combinations for each material.
Therefore, in the preliminary experiment, we decided to use the combination that obtained a correct answer rate of 80% or more in each material as the combination that could be perceived correctly in the subsequent experiments.

6.2.2. Subjects, Conditions, and Processes

In this experiment, we investigated whether the generated impact sound of the material could be discriminated, when compared with other materials. We used 29 patterns of combinations that could be identified by more than 80% of the subjects, based on the results of the preliminary experiment.
The eight participants we used were those who had an accuracy of 80% or more overall in the preliminary experiment (five men and three women). In addition, Cohen’s Kappa coefficient [41]—an index of the degree of agreement among multiple persons, when the same data are evaluated—was computed, to examine the level of individual difference.
Other than the sound data used, the experimental settings were the same as in the preliminary experiment. For the impact sound data, we used the sound data converted by the Griffin-Lim algorithm, from the spectrogram image generated by the trained model, explained earlier. After the experiment, a simple questionnaire was conducted with interviews.

6.2.3. Experimental Results

Table 9 and Figure 18 show the correct answer rate for all combinations, for each material and the difference from the preliminary experiment. “Sample” in Figure 18 means the data of the dataset used in the preliminary experiment, and “generated” means the impact sound data generated by the learning model used in the evaluation experiment.
From Table 9, we can see that the accuracy decreased by about 15% to 20% for each material. Furthermore, in the paper class, there was a difference of 25% from the preliminary experiment, and the accuracy was just 0.594, which was the lowest among all materials. In addition, we had assumed that the material combinations in Table 6 were appropriate for distinguishing the impact sound between materials, but in this experiment, we found that there was a difference among the selected combinations.
As shown in Figure 19 (glass) and Figure 20 (wood), there was a decrease in accuracy for the combination containing wood and plastic, as well as the combination containing glass and metal. These results were also inferred from the results of the questionnaire survey of the subjects. In addition, paper-wood and cloth-plastic are examples of combinations that were not mentioned in the answers to the questionnaire but that were difficult to distinguish.
Among all the combinations we tested, the one with the lowest accuracy was the glass-wood combination, when paper was used as the correct class (as shown in Figure 21); the accuracy was just 37.5%. Paper had the lowest accuracy among all classes, and even when looking at other combinations, the accuracy was low when paper was included as a selection candidate.
On the other hand, there were some combinations in which the correct answer rate was 80% or more, which is the same accuracy as the preliminary experiment. Examples include the combination of metal-wood, when cloth was the correct class (Figure 22), and the combination of cloth-paper, when glass was the correct class (Figure 19). The accuracies for the cloth and glass material classes were 69.6% and 71.9%, respectively, which is about 70% of the accuracy for all combinations. Therefore, we concluded that these two classes were able to generate an impact sound close to the sound of the dataset.
The average Kappa coefficient of the eight subjects was 0.45. This was obtained by taking the average of the Kappa coefficients of 28 subject pairs = C 8   2 for the results of the subjects’ selection of the correct material class from each pattern of combinations. This value indicates a relatively good agreement, in that the difference among the subjects was minor. This suggests that the same tendency would be exhibited, if the number of subjects was increased; thus, the number of subjects used in the present experiment was considered to be appropriate.
In the questionnaire, administered to subjects after the experiment, we verbally asked “Was there a difference in sound discrimination compared to the preliminary experiment?” and “What kind of impression did you get from the presented impact sound?” Regarding the sound quality of the generated impact sound, one subject responded that the generated impact sound was louder than the sound of the dataset. However, another subject answered that there was no discomfort, in terms of the impact sound. Summarizing the experimental results and the answers to the questionnaire, we concluded that the generated impact sound satisfied the necessary condition as a sound to be fed back to the user in the virtual environment, with discrimination using only the texture image.

6.3. Additional Experiment on Psychoacoustic Evaluation

6.3.1. Purpose

Deep learning for generative systems generally has no test oracle for the generated results, and the metamorphic properties are not clear, so it is difficult to evaluate. Therefore, as a kind of metamorphic property for this task, we calculated the Booming Index [42], which is an evaluation index designed to evaluate the muffledness of sound, based on psychoacoustic theory, for the generated sound and compared it with the baseline for a more objective evaluation.

6.3.2. Conditions and Processes

An additional experiment was conducted to compare the generation results of the baseline and the proposed method. In the additional experiments, we used SpecGAN, which is a method to generate spectrogram images using a learning model by GAN as the baseline. We calculated and compared the Booming Index for each of the sample data in the dataset, the data generated in this study, and the data generated by SpecGAN.
The Booming Index was used as the evaluation index to evaluate the degree of sound muffling, based on psychoacoustic theory, as
Booming   Index   =   Bandsum × L i / Loudness
where Bandsum is the weighted 1/3 octave band level power sum of the sound signal, and Loudness is one of the psychoacoustic parameters that indicates the loudness of the sound. The Booming Index is calculated by the ratio of Bandsum to Loudness in the low frequency range.
In this way, the Booming Index is calculated from the psychoacoustic parameters, in relation to loudness and sharpness, i.e., loudness and pitch of the sound. The results of our questionnaire survey indicated that some of the subjects felt the sound was reverberant or blurred, so we compared the results using the Booming Index, based on the assumption that the Booming Index has an influence on the discrimination of sound.

6.3.3. Results

Figure 23 shows the results of comparing the correct data and the average values of each method, where “sample” is the correct answer data selected from each class in the dataset, “generated” is the result of sound transformation from the proposed method, and “spec_gan” is the result of generation from the training result of SpecGAN. Fifty items of data were randomly extracted from each dataset, and the Booming Index was calculated.
The results showed that the sound data, generated by the proposed method, was evaluated as better than the baseline in all classes, except for the class cloth. Even for paper, which is the class with the worst experimental results (as described in the previous subsection), the sound data generated by the proposed method was closer to the correct answer data than the baseline. In Figure 23, the only sound data in which the evaluation was worse than the baseline was cloth, and the correct answer data also had a worse evaluation than the baseline. Since the values of “sample” and “generated” are close to each other, it is safe to say that the evaluation of the sound data itself is closer to the correct data than the baseline.

7. Concluding Remarks

We proposed a dynamic generation system of impact sounds related to objects in a virtual environment, targeting a virtual space that reflects the real world. In the proposed system, the material label of the target object is first estimated based on the texture image of the object. For this purpose, the estimation model is trained using an existing dataset, in which the object image and the striking sound are labeled, and then the trained estimation model is subjected to transfer learning, according to the actual usage environment of the system. By doing so, it becomes possible to estimate the material label of the object that suits the environment assumed by the user.
For the object image acquired from the real space, a unique texture image was acquired from the object image, including multiple parts, by performing material division by processing, based on pixel information and clustering. Next, a generative model was constructed using GAN to output a spectrogram image of the striking sound, with the material label output by the estimation model as input. With the proposed architecture, we demonstrated that better results, than the existing method, can be obtained by comparing the generated images.
The generated spectrogram image is converted into sound data by the Griffin-Lim algorithm. By constructing a series of systems, from the acquisition of the texture image to the generation of the impact sound, it became possible to present the impact sound to the user for the object reflected from the real space to the virtual environment. In addition, by using GAN, we can present various impact sounds that are not limited to the sound data in the dataset.
We conducted an experiment to evaluate the generated impact sound. First, we ran a preliminary experiment, using the sound data in the dataset, to determine whether it is possible to appropriately discriminate the impact sound for each material. After that, we performed the same experiment on the impact sound, generated by the proposed method, and compared the results with those of the preliminary experiment, which was the target value. We found that, although the proposed method showed a slight decrease in identification accuracy between materials, the results were similar to those in the preliminary experiment, depending on the combination of material labels presented. This demonstrates that our method is useful for obtaining feedback information on the interaction between the user and the object in the virtual environment.
In this study, we used the, previously created, Greatest Hits dataset. This dataset includes images, material labels, and striking sounds for each object, so we presumed it was suitable for our purposes. However, the sounds in this dataset are from hitting an object with a wooden stick at a certain speed and not from hitting an object with other materials (e.g., bare hands) or from hitting it harder or faster.
Therefore, it is necessary to create a dataset that collects the sounds of hitting objects of multiple materials in various situations, which is more suitable for the purpose of this research. In addition, we need to make adjustments, so that the sound data collected for creating the dataset can be sufficiently classified by the subjects using the texture images. Our future work will involve the creation of such a dataset, to enable more effective learning by the proposed method.

Author Contributions

Conceptualization, K.N.; Data curation, K.K. and K.H.; Methodology, K.K. and K.H.; Project administration, K.N.; Supervision, K.N.; Writing—original draft, K.N., K.K. and K.H.; Writing—review & editing, K.N. All authors have read and agreed to the published version of the manuscript.

Funding

This research received no external funding.

Institutional Review Board Statement

Not applicable.

Informed Consent Statement

Not applicable.

Data Availability Statement

A publicly available dataset was analyzed in this study. This data can be found here: https://andrewowens.com/vis/, accessed on 24 June 2021. Our created dataset is downloadable from http://www.nagao.nuie.nagoya-u.ac.jp/download/hsd.zip, accessed on 24 June 2021.

Acknowledgments

The authors wish to express gratitude to the students at Nagao Lab, Nagoya University, who participated as subjects in the experiments.

Conflicts of Interest

The authors declare no conflict of interest.

References

  1. Nagao, K.; Yang, M.; Miyakawa, Y. Building-Scale Virtual Reality: Reconstruction and Modification of Building Interior Extends Real World. Int. J. Multimed. Data Eng. Manag. 2019, 10, 1–21. [Google Scholar] [CrossRef] [Green Version]
  2. Goodfellow, I.; Pouget-Abadie, J.; Mirza, M.; Xu, B.; Warde-Farley, D.; Ozair, S.; Courville, A.; Bengio, Y. Generative Adversarial Networks. Adv. Neural Inf. Process. Syst. 2014, 27, 2672–2680. [Google Scholar]
  3. Griffin, D.W.; Lim, J.S. Signal Estimation from Modified Short-Time Fourier Transform. IEEE Trans. Acoust. Speech Signal Process. 1984, 32, 236–243. [Google Scholar] [CrossRef]
  4. Carmigniani, J.; Furht, B.; Anisetti, M.; Ceravolo, P.; Damiani, E.; Ivkovic, M. Augmented Reality Technologies, Systems and Applications. Multimed. Tools Appl. 2011, 51, 341–377. [Google Scholar] [CrossRef]
  5. Akçayır, M.; Akçayır, G. Advantages and Challenges Associated with Augmented Reality for Education: A Systematic Review of the Literature. Educ. Res. Rev. 2017, 20, 1–11. [Google Scholar] [CrossRef]
  6. Azuma, R.; Baillot, Y.; Behringer, R.; Feiner, S.; Julier, S.; MacIntyre, B. Recent Advances in Augmented Reality. IEEE Comput. Graph. Appl. 2001, 21, 34–47. [Google Scholar] [CrossRef] [Green Version]
  7. Scavarelli, A.; Teather, R.J. VR collide! Comparing Collision-Avoidance Methods between Co-located Virtual Reality Users. In Proceedings of the 2017 ACM Conference on Human Factors in Computing Systems, Denver, CO, USA, 6–11 May 2017; pp. 2915–2921. [Google Scholar]
  8. Sra, M.; Garrido-Jurado, S.; Maes, P. Oasis: Procedurally Generated Social Virtual Spaces from 3D Scanned Real Spaces. IEEE Trans. Vis. Comput. Graph. 2018, 24, 3174–3187. [Google Scholar] [CrossRef] [PubMed] [Green Version]
  9. Keller, M.; Exposito, F. Game Room Map Integration in Virtual Environments for Free Walking. In Proceedings of the 2018 IEEE Conference on Virtual Reality and 3D User Interfaces (VR), Reutlingen, Germany, 18–22 March 2018; pp. 763–764. [Google Scholar]
  10. Yang, J.; Holz, C.; Ofek, E.; Wilson, A.D. DreamWalker: Substituting Real-World Walking Experiences with a Virtual Reality. In Proceedings of the 32nd Annual ACM Symposium on User Interface Software and Technology, New York, NY, USA, 20–23 October 2019; pp. 1093–1107. [Google Scholar]
  11. Fujisaki, W.; Goda, N.; Motoyoshi, I.; Komatsu, H.; Nishida, S. Audiovisual Integration in the Human Perception of Materials. J. Vis. 2014, 14, 1–20. [Google Scholar] [CrossRef] [Green Version]
  12. Kern, A.C.; Ellermeier, W. Audio in VR: Effects of a Soundscape and Movement-Triggered Step Sounds on Presence. Front. Robot. AI 2020, 7, 1–13. [Google Scholar] [CrossRef] [Green Version]
  13. Lahav, O.; Mioduser, D. Multisensory Virtual Environment for Supporting Blind Persons’ Acquisition of Spatial Cognitive Mapping–A Case Study. In Proceedings of the EdMedia+ Innovate Learning 2001, Association for the Advancement of Computing in Education (AACE), Tampere, Finland, 25–30 June 2001; pp. 1046–1051. [Google Scholar]
  14. Inman, D.P.; Loge, K.; Cram, A. Teaching Orientation and Mobility Skills to Blind Children Using Computer Generated 3D Sound Environments. In Proceedings of the 6th International Conference on Auditory Display (ICAD2000), Atlanta, GA, USA, 2–5 April 2000. [Google Scholar]
  15. Siu, A.F.; Sinclair, M.; Kovacs, R.; Ofek, E.; Holz, C.; Cutrell, E. Virtual Reality Without Vision: A Haptic and Auditory White Cane to Navigate Complex Virtual Worlds. In Proceedings of the 2020 ACM Conference on Human Factors in Computing Systems, Honolulu, HI, USA, 25–30 April 2020; pp. 1–13. [Google Scholar]
  16. Rausch, D. Modal Sound Synthesis for Interactive Virtual Environments. Ph.D. Thesis, RWTH Aachen University, Aachen, Germany, 2017. [Google Scholar]
  17. Cirio, G.; Li, D.; Grinspun, E.; Otaduy, M.A.; Zheng, C. Crumpling Sound Synthesis. ACM Trans. Graph. 2016, 35, 1–11. [Google Scholar] [CrossRef] [Green Version]
  18. Ban, Y.; Ujitoko, Y. TactGAN: Vibrotactile Designing Driven by GAN-based Automatic Generation. In Proceedings of the SIGGRAPH Asia 2018 Emerging Technologies, Tokyo, Japan, 4 December 2018; pp. 1–2. [Google Scholar]
  19. Chris, D.; McAuley, J.; Puckette, M. Adversarial Audio Synthesis. arXiv 2018, arXiv:1802.04208. [Google Scholar]
  20. Qi, C.R.; Su, H.; Mo, K.; Guibas, L.J. PointNet: Deep Learning on Point Sets for 3D Classification and Segmentation. In Proceedings of the IEEE Conference on Computer Vision and Pattern Recognition (CVPR), Honolulu, HI, USA, 21–26 July 2017; pp. 652–660. [Google Scholar]
  21. Qi, C.R.; Yi, L.; Su, H.; Guibas, L.J. PointNet++: Deep Hierarchical Feature Learning on Point Sets in a Metric Space. Adv. Neural Inf. Process. Syst. 2017, 30, 5099–5108. [Google Scholar]
  22. Redmon, J.; Farhadi, A. YOLOv3: An Incremental Improvement. arXiv 2018, arXiv:1804.02767. [Google Scholar]
  23. Owens, A.; Isola, P.; McDermott, J.; Torralba, A.; Adelson, E.H.; Freeman, W.T. Visually Indicated Sounds. In Proceedings of the IEEE Conference on Computer Vision and Pattern Recognition (CVPR), Las Vegas, NV, USA, 27–30 June 2016; pp. 2405–2413. [Google Scholar]
  24. Farnebäck, G. Two-Frame Motion Estimation Based on Polynomials. In Proceedings of the Scandinavian Conference on Image Analysis, Halmstad, Sweden, 29 June–3 July 2003; Springer: Berlin/Heidelberg, Germany; pp. 363–370. [Google Scholar]
  25. Xue, J.; Zhang, H.; Dana, K. Deep Texture Manifold for Ground Terrain Recognition. In Proceedings of the IEEE Conference on Computer Vision and Pattern Recognition (CVPR), Salt Lake City, UT, USA, 18–22 June 2018; pp. 558–567. [Google Scholar]
  26. He, K.; Zhang, X.; Ren, S.; Sun, J. Deep Residual Learning for Image Recognition. In Proceedings of the IEEE Conference on Computer Vision and Pattern Recognition (CVPR), Las Vegas, NV, USA, 26 June–1 July 2016; pp. 770–778. [Google Scholar]
  27. Tenenbaum, J.B.; Freeman, W.T. Separating Style and Content with Bilinear Models. Neural Comput. 2000, 12, 1247–1283. [Google Scholar] [CrossRef]
  28. Achanta, R.; Shaji, A.; Smith, K.; Lucchi, A.; Fua, P.; Süsstrunk, S. SLIC Superpixels Compared to State-of-the-art Superpixel Methods. IEEE Trans. Pattern Anal. Mach. Intell. 2012, 34, 2274–2281. [Google Scholar] [CrossRef] [Green Version]
  29. Odena, A.; Olah, C.; Shlens, J. Conditional Image Synthesis with Auxiliary Classifier GANs. In Proceedings of the International Conference on Machine Learning, Sydney, Australia, 6–11 August 2017; pp. 2642–2651. [Google Scholar]
  30. Ledig, C.; Theis, L.; Huszar, F.; Caballero, J.; Cunningham, A.; Acosta, A.; Aitken, A.; Tejani, A.; Totz, J.; Wang, Z.; et al. Photo-Realistic Single Image Super-Resolution Using a Generative Adversarial Network. In Proceedings of the IEEE Conference on Computer Vision and Pattern Recognition (CVPR), Honolulu, HI, USA, 21–26 July 2017; pp. 4681–4690. [Google Scholar]
  31. Gulrajani, I.; Ahmed, F.; Arjovsky, M.; Dumoulin, V.; Courville, A. Improved Training of Wasserstein GANs. Adv. Neural Inf. Process. Syst. 2017, 30, 5767–5777. [Google Scholar]
  32. Radford, A.; Metz, L.; Chintala, S. Unsupervised Representation Learning with Deep Convolutional Generative Adversarial Networks. arXiv 2015, arXiv:1511.06434. [Google Scholar]
  33. Dumoulin, V.; Shlens, J.; Kudlur, M. A Learned Representation for Artistic Style. arXiv 2016, arXiv:1610.07629. [Google Scholar]
  34. Miyato, T.; Koyama, M. cGANs with Projection Discriminator. arXiv 2018, arXiv:1802.05637. [Google Scholar]
  35. Kodali, N.; Abernethy, J.; Hays, J.; Kira, Z. On Convergence and Stability of GANs. arXiv 2017, arXiv:1705.07215. [Google Scholar]
  36. Kingma, D.P.; Ba, J. Adam: A Method for Stochastic Optimization. arXiv 2014, arXiv:1412.6980. [Google Scholar]
  37. Heusel, M.; Ramsauer, H.; Unterthiner, T.; Nessler, B.; Hochreiter, S. GANs Trained by a Two Time-Scale Update Rule Converge to a Local Nash Equilibrium. Adv. Neural Inf. Process. Syst. 2017, 30, 6626–6637. [Google Scholar]
  38. Hu, J.; Shen, L.; Albanie, S.; Sun, G.; Wu, E. Squeeze-and-Excitation Networks. In Proceedings of the IEEE Conference on Computer Vision and Pattern Recognition (CVPR), Salt Lake City, UT, USA, 18–22 June 2018; pp. 7132–7141. [Google Scholar]
  39. Salimans, T.; Goodfellow, I.; Zaremba, W.; Cheung, V.; Radford, A.; Chen, X. Improved Techniques for Training GANs. arXiv 2016, arXiv:1606.03498. [Google Scholar]
  40. Paolis, D.; Tommaso, L.; Bourdot, P.; Mongelli, A. Audio-Visual Perception—The Perception of Object Material in a Virtual Environment. In Proceedings of the International Conference on Augmented Reality, Virtual Reality, and Computer Graphics, Ugento, Italy, 12–15 July 2017; pp. 12–15. [Google Scholar]
  41. Cohen, J. A Coefficient of Agreement for Nominal Scales. Educ. Psychol. Meas. 1960, 20, 37–46. [Google Scholar] [CrossRef]
  42. Hatano, S.; Hashimoto, T. Booming Index as a Measure for Evaluating Booming Sensation. In Proceedings of the 29th International Congress and Exhibition on Noise Control Engineering, Nice, France, 27–30 August 2000. [Google Scholar]
Figure 1. HTC VIVE Pro with RealSense.
Applsci 11 07546 g001
Figure 2. Equipment for experiment.
Applsci 11 07546 g002
Figure 3. Rod-shaped object with VR controller.
Applsci 11 07546 g003
Figure 4. System configuration for audiovisual interaction with movable objects.
Applsci 11 07546 g004
Figure 5. Confusion matrix of material estimation.
Applsci 11 07546 g005
Figure 6. Examples of images acquired by object recognition in the usage environment.
Applsci 11 07546 g006
Figure 7. Example of bounding box in object recognition.
Applsci 11 07546 g007
Figure 8. Process of object component segmentation.
Applsci 11 07546 g008
Figure 9. Basic architecture of residual block.
Applsci 11 07546 g009
Figure 10. Residual block architecture for learning.
Applsci 11 07546 g010
Figure 11. Proposed architecture of GAN. (a) generator network, (b) discriminator network.
Applsci 11 07546 g011
Figure 12. Data distribution of 17 material classes.
Applsci 11 07546 g012
Figure 13. Data distribution of six material classes.
Applsci 11 07546 g013
Figure 14. Generated spectrogram images of six material classes.
Applsci 11 07546 g014
Figure 15. Comparison of sample data of each class and spectrogram image generated by Generator.
Applsci 11 07546 g015
Figure 16. Example of displayed cubes.
Applsci 11 07546 g016
Figure 17. Displaying cubes for each material in VR.
Applsci 11 07546 g017
Figure 18. Accuracy of each material class in main (generated) and preliminary (sample) experiments.
Applsci 11 07546 g018
Figure 19. Accuracy of “glass” class in main (generated) and preliminary (sample) experiments.
Applsci 11 07546 g019
Figure 20. Accuracy of “wood” class in main (generated) and preliminary (sample) experiments.
Applsci 11 07546 g020
Figure 21. Accuracy of “paper” class in main (generated) and preliminary (sample) experiments.
Applsci 11 07546 g021
Figure 22. Accuracy of “cloth” class in main (generated) and preliminary (sample) experiments.
Applsci 11 07546 g022
Figure 23. Comparison of results by Booming Index for each class.
Applsci 11 07546 g023
Table 1. Number of image data for each material label.
MaterialNumber
plastic2029
drywall912
metal3926
wood4485
carpet913
plastic-bag901
cloth1986
paper1712
rock2736
leaf2515
gravel905
glass874
tile914
ceramic910
dirt3277
grass980
water982
Table 2. Ratio classified into each material label.
MaterialObject 1Object 2Object 3
cloth 0.15
glass0.85 0.48
metal 0.050.05
paper 0.10
plastic0.150.360.48
wood 0.31
Table 3. Number of data acquired from actual usage environment.
MaterialClothGlassMetalPaperPlasticWood
Example Images Applsci 11 07546 i001 Applsci 11 07546 i002 Applsci 11 07546 i003 Applsci 11 07546 i004 Applsci 11 07546 i005 Applsci 11 07546 i006
Applsci 11 07546 i007 Applsci 11 07546 i008 Applsci 11 07546 i009 Applsci 11 07546 i010 Applsci 11 07546 i011 Applsci 11 07546 i012
Number397010901680129019401470
Table 4. Recognition results.
MaterialOriginalTransfer Learning
cloth0.850.99
glass0.00.96
metal0.110.93
paper0.650.95
plastic0.290.88
wood0.380.99
Table 5. Comparison of learning models by FID value.
ModelFID
Proposed Method
(Residual Block + SE Block)
17.6590
Residual Block20.1736
TactGAN63.2101
DCGAN37.8643
WaveGAN22.3209
Table 6. Accuracy for each material class.
Actual ClassAccuracy
cloth0.80
glass0.61
metal0.73
paper0.67
plastic0.51
wood0.63
Table 7. Combinations capable of correct perception.
Actual ClassPatterns
clothglass-metal, glass-plastic, glass-wood,
metal-paper, metal-wood, paper-plastic,
plastic-wood
glasscloth-metal, cloth-paper, metal-paper,
metal-wood
metalcloth-paper, cloth-plastic, cloth-wood,
glass-paper, paper-plastic, paper-wood
paperglass-metal, glass-wood,
metal-wood, paper-wood
plasticcloth-glass, cloth-paper,
cloth-wood, glass-paper
woodcloth-metal, glass-plastic,
metal-paper, metal-plastic
Table 8. Accuracy of all materials of each subject.
SubjectAccuracy of All Materials
A0.828
B0.828
C0.828
D0.862
E0.724
F0.859
G0.931
H0.682
I0.931
J0.897
Table 9. Accuracy of each material class and difference between main and preliminary experiments.
MaterialAccuracyDifference from Preliminary Experiment
cloth0.696−0.161
glass0.719−0.219
metal0.667−0.208
paper0.594−0.25
plastic0.656−0.156
wood0.689−0.156
Publisher’s Note: MDPI stays neutral with regard to jurisdictional claims in published maps and institutional affiliations.

