1. Introduction
Special education is the branch of education that attempts to minimize the obstacles faced by people with disabilities to enable learning through individualization. Using individualized education, teachers and schools fit the curriculum and lesson plans for each student based on their disabilities [
1,
2]. Special education teachers lead the industry in creative ways of teaching students [
3,
4] in a range of subjects, including mathematics, science, and mobility. In addition, World Health Organization data indicates that about 2.2 billion people have vision impairment, of which 11.5% (253 million people) are severely visually impaired or blind (VIB), and about 24.5 million are students [
5,
6]. Concurrently, teachers of the visually impaired are often limited in their capability to constantly provide new education materials to their students [
7,
8]. Although VIB students are similar to sighted people, in that an important aspect of their lives is their education, this is significantly affected by their loss of sight [
9]. This is most apparent for types of information that are visual in nature such as shape, color, location, and position. Visual information is a vital tool in learning because numerous concepts can be explained more easily using visual aids. Although it is difficult for VIB students to understand visual concepts, it is not impossible [
10]. Limited access is the main hurdle for the teachers of VIB students to teach these concepts. This inaccessibility is due to the limited selection of educational materials, the difficulty in creating specialty materials, and the lack of teacher training in the use of technology or new techniques for teaching VIB students [
11,
12,
13].
Although educational materials are available in VIB schools, these cannot be customized for the student’s preferences, thus preventing the individualization of special education. An important aspect that has been considered is attracting the interest of the students during personalized education. In a study by Reber et al., the students were introduced to different personalized styles of education: contextual personalization, choice, and active personalization. In their research, it was found that the interest in the lesson of the students in the group taught using individual personalization was increased by solving additional problems from the textbook. This connected the learning material to the personal aspects of their lives. It was also found that, if the students were given a choice to pick between two tasks, their interest was increased, possibly due to the increased autonomy. The situational interest was targeted by the choice of the style of education. Finally, the aspect of active personalization increased the interest of their students by involving them in the creation of the learning materials, which enabled them to connect this to their preferred topics, aspirations, and interests. It was found that this method had more effect on low-confidence students, and increased reengagement and retention of their learning. The situational interest effects were observed in the short term, and the individual interest in learning was promoted in the long term [
14]. Subsequently, as we experienced firsthand at the Taichung Special Education School for the Visually Impaired, teachers of the VIB students have made significant advances in terms of creativity to teach concepts. As an example, a teacher constructed an enlarged model of the shoelaces on sneakers, as shown in
Figure 1. This implementation of the teachers has highlighted the creativity needed to teach basic concepts to their VIB students. However, these teachers have limited skills and training on using modern technologies, such as 3D printing and 3D modeling. In research conducted by Chen et al. [
9], such technologies were shown to improve the methods of teachers.
It has been found that graphical information is a crucial aspect in the fields of science and mathematics. As a result, VIB students and workers are usually presented with less information compared to the general population because of the lack of graphics in their system. In general, it is essential to use graphics to portray different aspects of science and its applications. Gupta et al. stated that graphical information would increase the career opportunities for VIB students [
15,
16]. The use of a training system to read and understand tactile graphics is a fundamental step for VIB students in continuing and adapting the different complex tactile graphics for their future studies.
In this research, we developed a system called TacPic, in which tactile educational materials (TEM) are generated without the tedious and difficult process of making them by hand or 3D modeling. Currently, our system can be used to develop tactile flashcards, tactile maps, and tactile peg puzzles, which combine interactive tactile graphics and braille captions. The materials developed can be used as tools for training and learning shapes, geography, and other concepts. Our work is aimed towards the improvement of the development of educational materials, not only for VIB students, but potentially also for normal-sighted students.
2. Materials and Methods
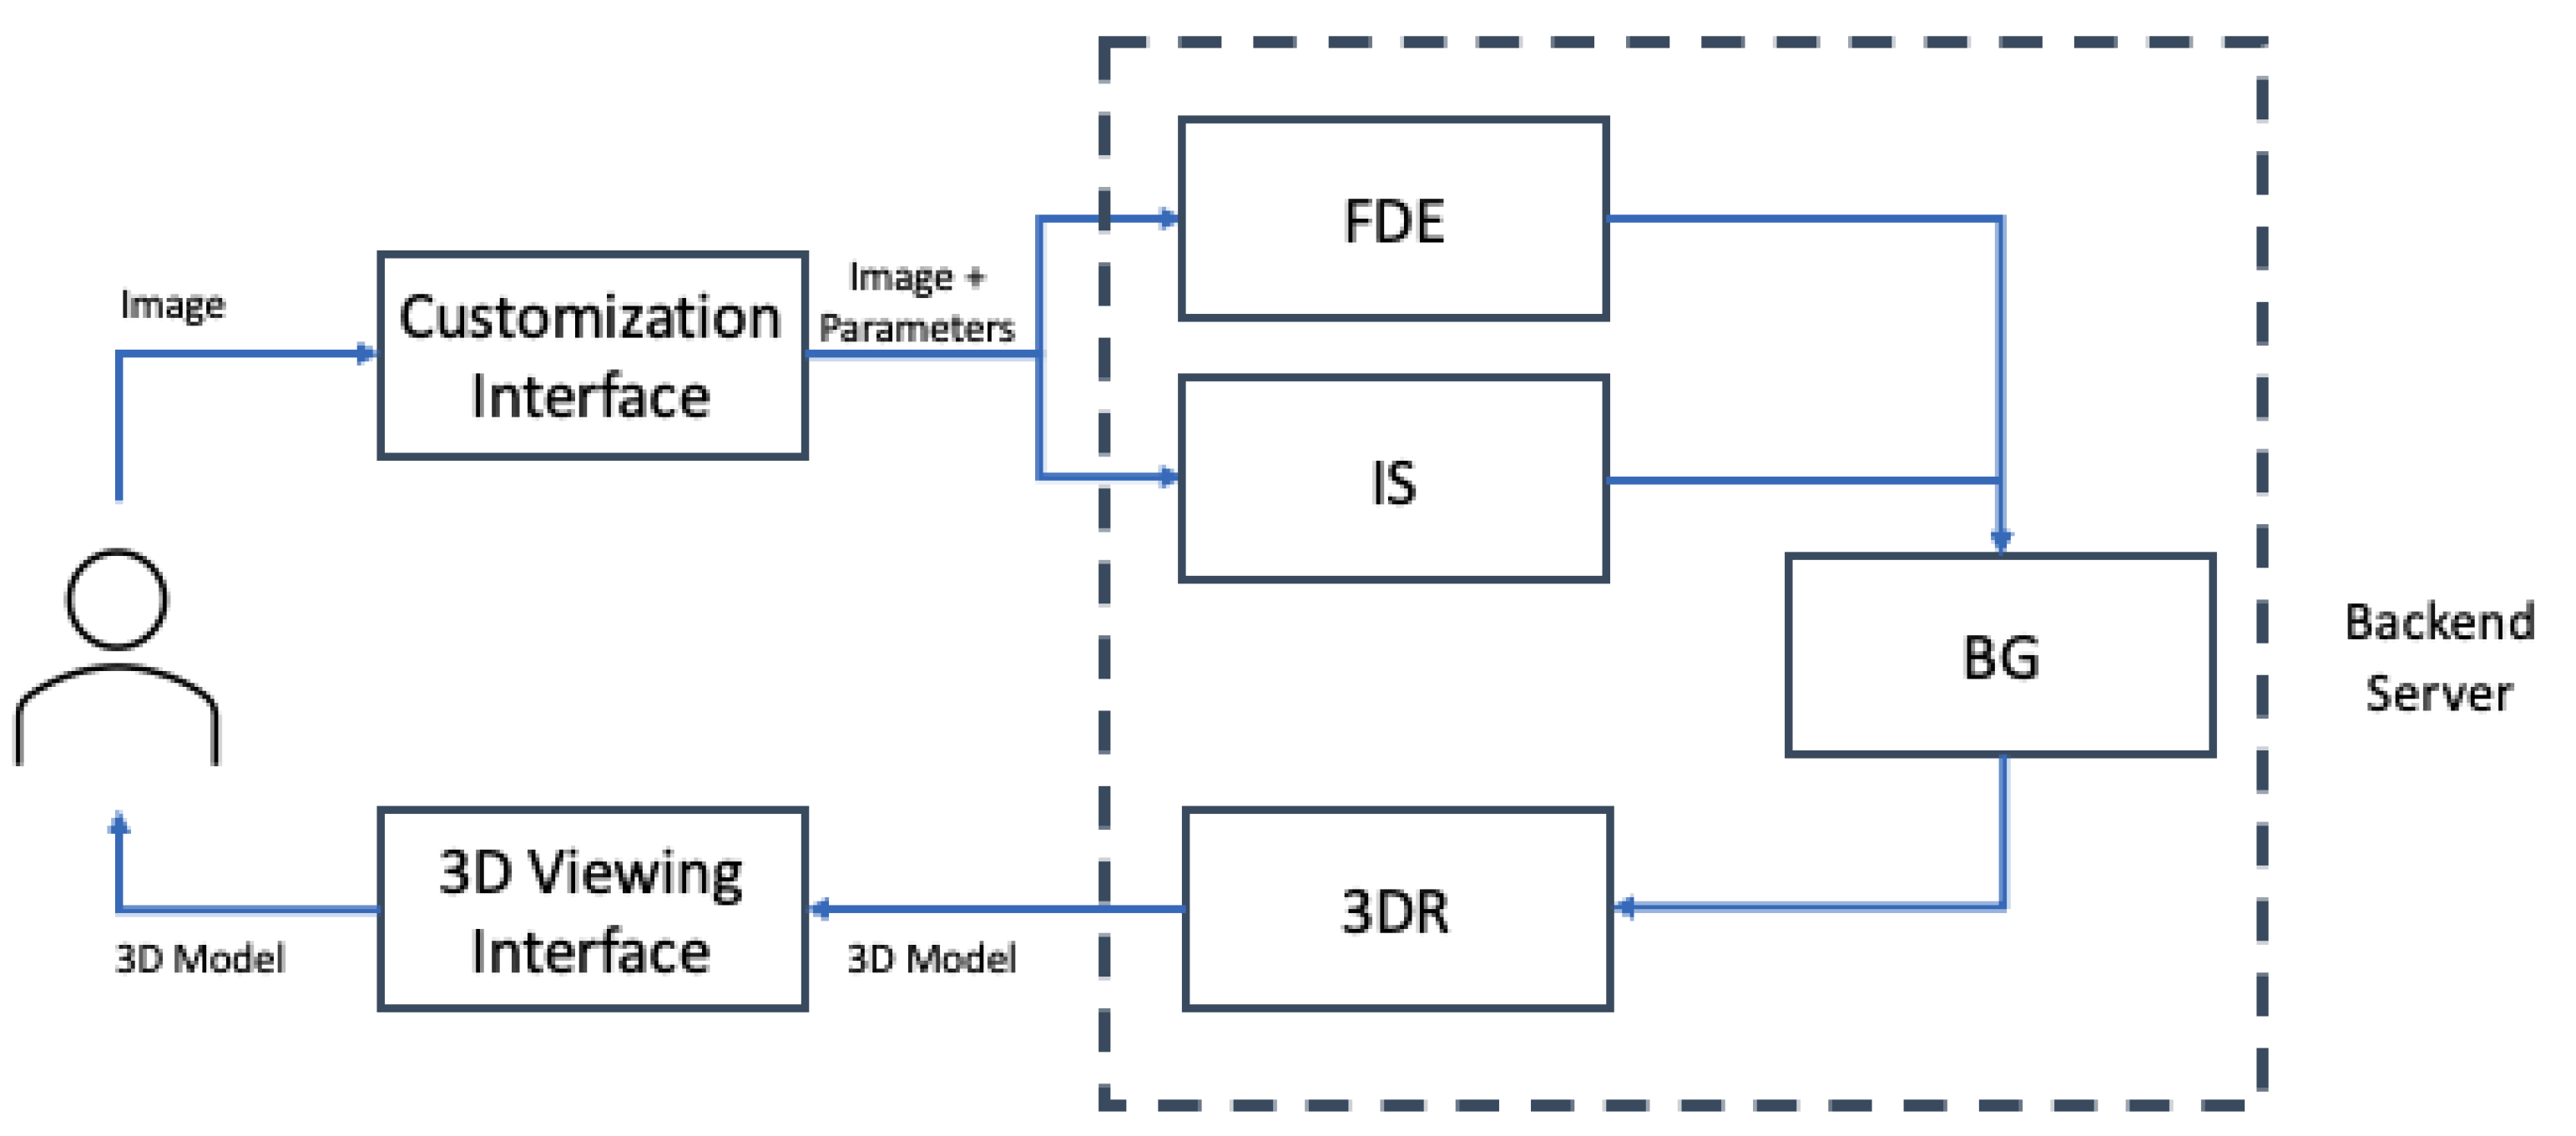
The TacPic system is built using a modular system approach, and passes objects and images onto different modules for each process. Each module within our system conducts a specific task and outputs its result for the next module to use. These modules are also constructed from different programming languages and computing platforms that are integrated with each other. These modules are responsible for the following tasks: Customization Interface, Feature Detection and Extraction (FDE), Instance Segmentation (IS), Braille Generation (BG), 3D Reconstruction (3DR), and 3D Viewing Interface. FDE, IS, BG, and 3DR are included within the backend server. The system infrastructure is shown in
Figure 2.
The flow of the system is similar for all tactile materials, but the algorithms and models used for the backend are different for each type. We propose using this system architecture to develop tactile flashcards, tactile maps, and tactile peg puzzles. Tactile flashcards are generated by creating shapes of the objects and placing a braille caption on top of them as an identifier of the object. These can be used for training to understand shapes and their corresponding names. Geography tactile maps are generated by creating the different cities and segments of a map and labelling the cities within them. These can be used in geography lessons so that the VIB students can have an understanding of the location and geometry of the places within a country. They can also be used to create topography maps to understand the terrain of a certain location. Tactile peg puzzles are generated by segmenting an image and creating a base in which the segmented image can fit. These can be used to mix and match the object with the label based on its shape.
2.1. Deployment of the TacPic System
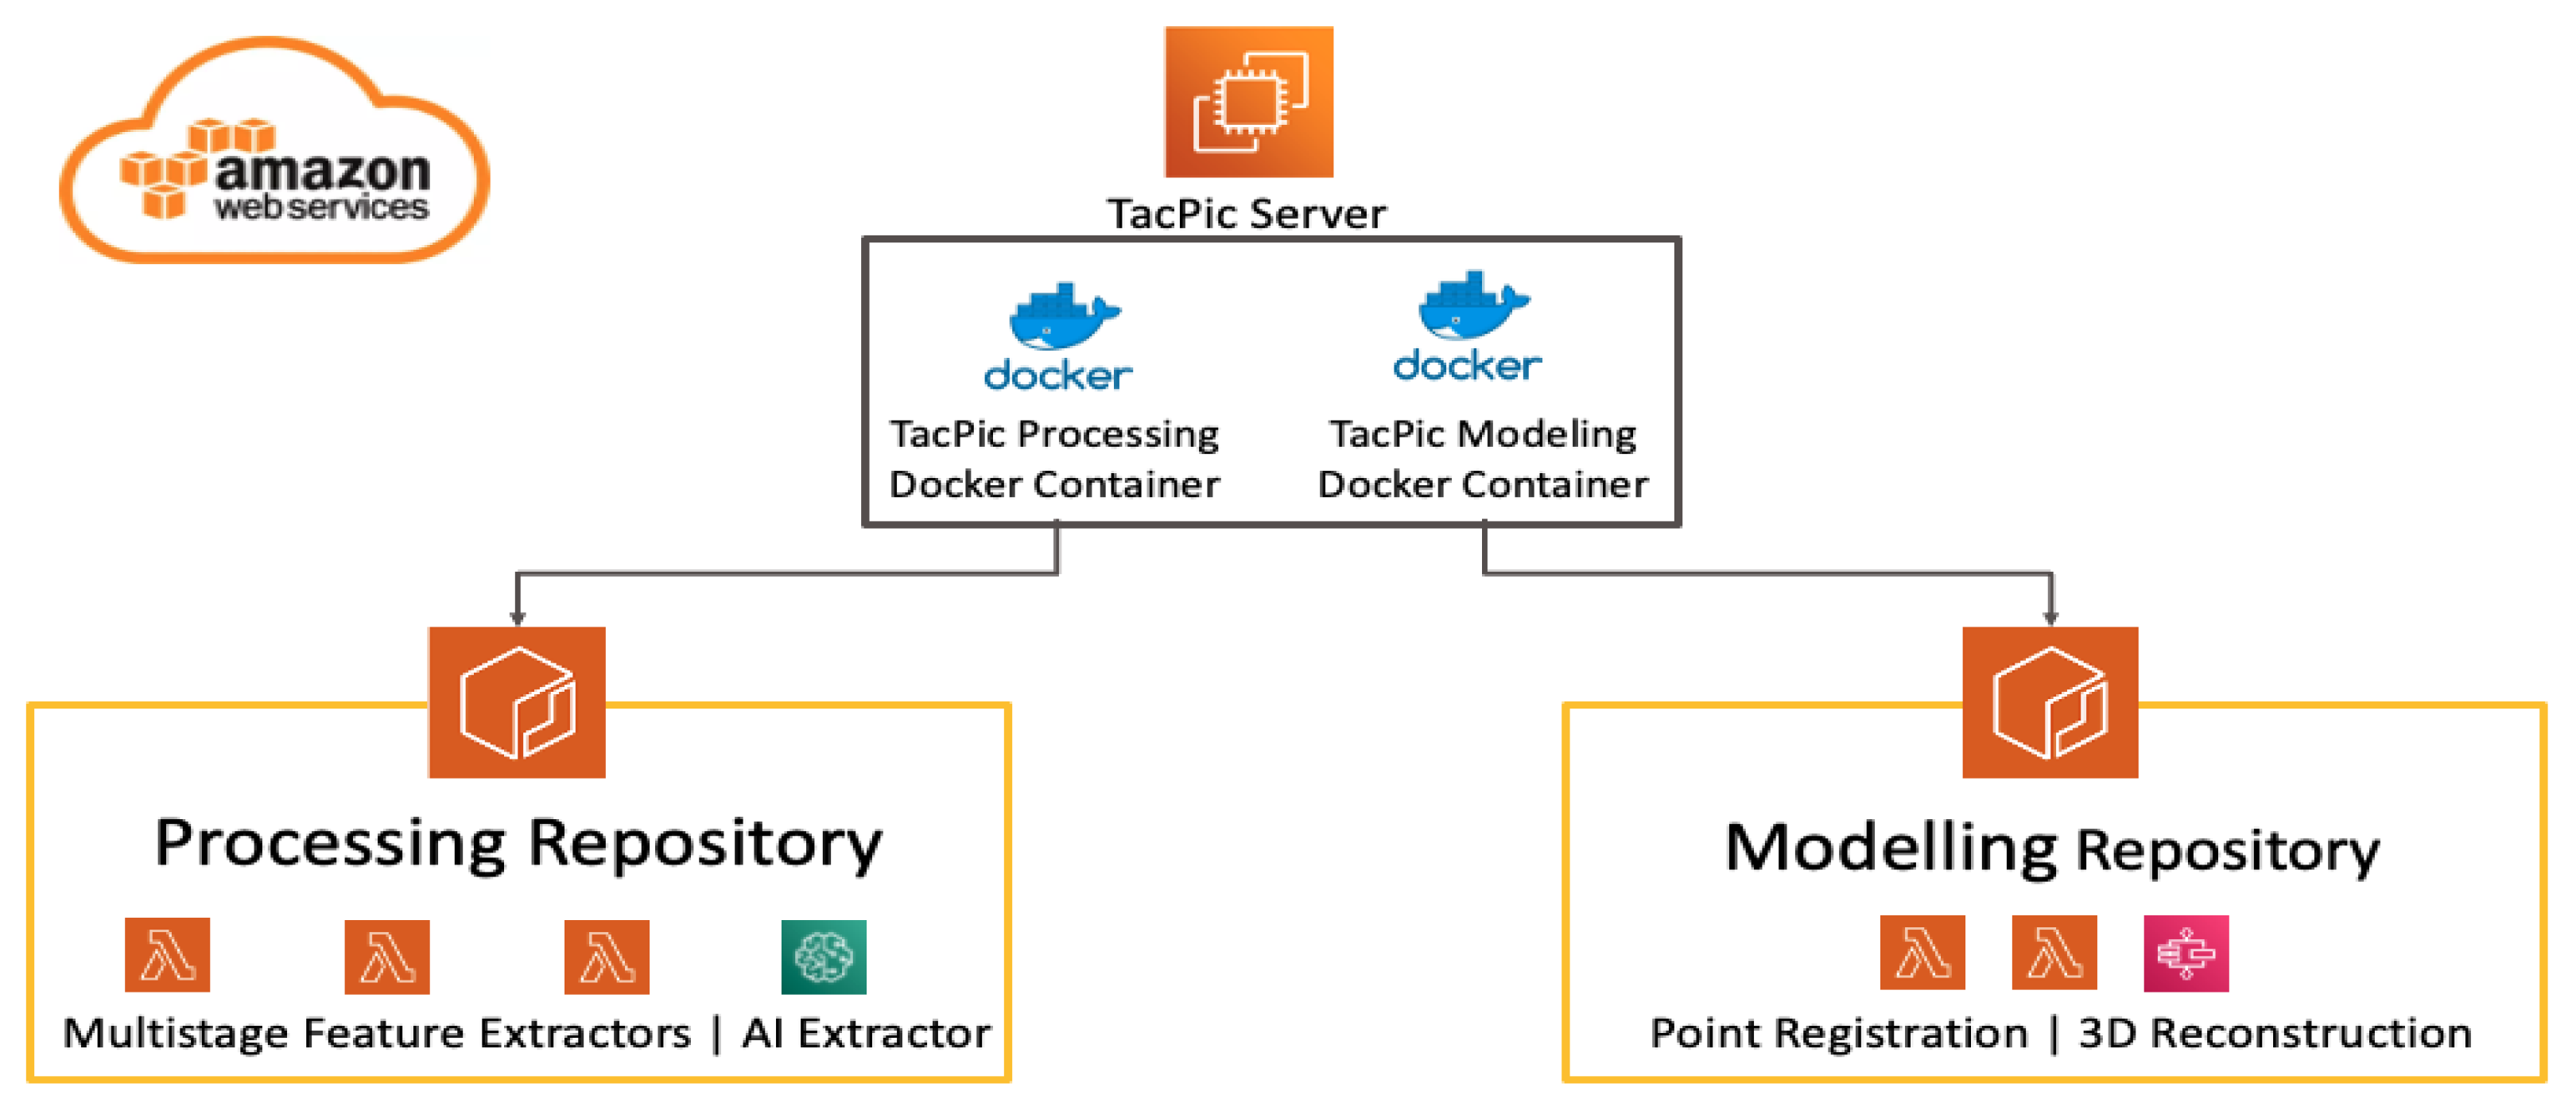
The TacPic system leverages the technologies of AI cloud computing to create TEM for VIB education. AI is deployed to provide a lightweight implementation that teachers and parents of the visually impaired students can easily use on their devices without needing expensive hardware, training on using artificial intelligence and 3D reconstruction, 3D modelling, or 3D printing. This is deployed on a web interface with an Amazon Web Service (AWS) backend. By leveraging the scalability of the deployment on the AWS servers, we were able to allocate the appropriate amount of processing power to each step of the development pipeline.
The system infrastructure is shown in
Figure 3. The user first inputs an image through the web interface and sets the different parameters, such as the type of tactile material, the material size, and rotations. Then, when the user presses the “Submit” button, the web interface sends the image and its parameters to the AWS backend and starts the process. The succeeding web interface fetches the STL file from the output S3 bucket and displays the resulting TEM for inspection by the user. The TEM creation process is as follows:
The user uploads an image to the customization interface and sets the parameters for the image type, size, etc.
The image is stored in a user-specific S3 bucket division with its specific parameters.
This event triggers a Lambda function that passes the image to two Lambda functions of masking and pre-processing. After both processes are completed, they each store their resulting outputs in another S3 bucket.
Next, another Lambda function extracts the needed information label from the previous step.
Then, the image from the previous step is processed by the TacPic Modeling Lambda function to create the 3D models of the TEM before combining the braille words and images. Finally, the 3D STL file from this step is stored in the output S3 bucket.
The 3D viewer interface collects the 3D STL file from the S3 bucket and displays an interactive 3D model that can be inspected.
The development of the system was undertaken in a Python environment. The algorithms used were based on the Python implementation within multiple libraries, namely, TensorFlow, OpenCV, and NumPy. The TensorFlow library was used to perform the object detection and instance segmentation on images. The OpenCV library was used to perform the image processing algorithms. Finally, the NumPy library was used for image registration and 3D STL generation. This implementation was applied in the AWS platform for ease of integration with different features. It is beneficial if the algorithm is deployed within a web-based application or a mobile application. Subsequently, the AWS Elastic Container Registry (ECR) was used to store the different algorithms. The algorithms were stored using a Docker container and connected to the AWS Lambda service to enable the container to be run remotely without a dedicated server. Different AWS S3 buckets were used as the storage for the images and STL files used during the testing. The whole process within the AWS platform is shown in
Figure 3.
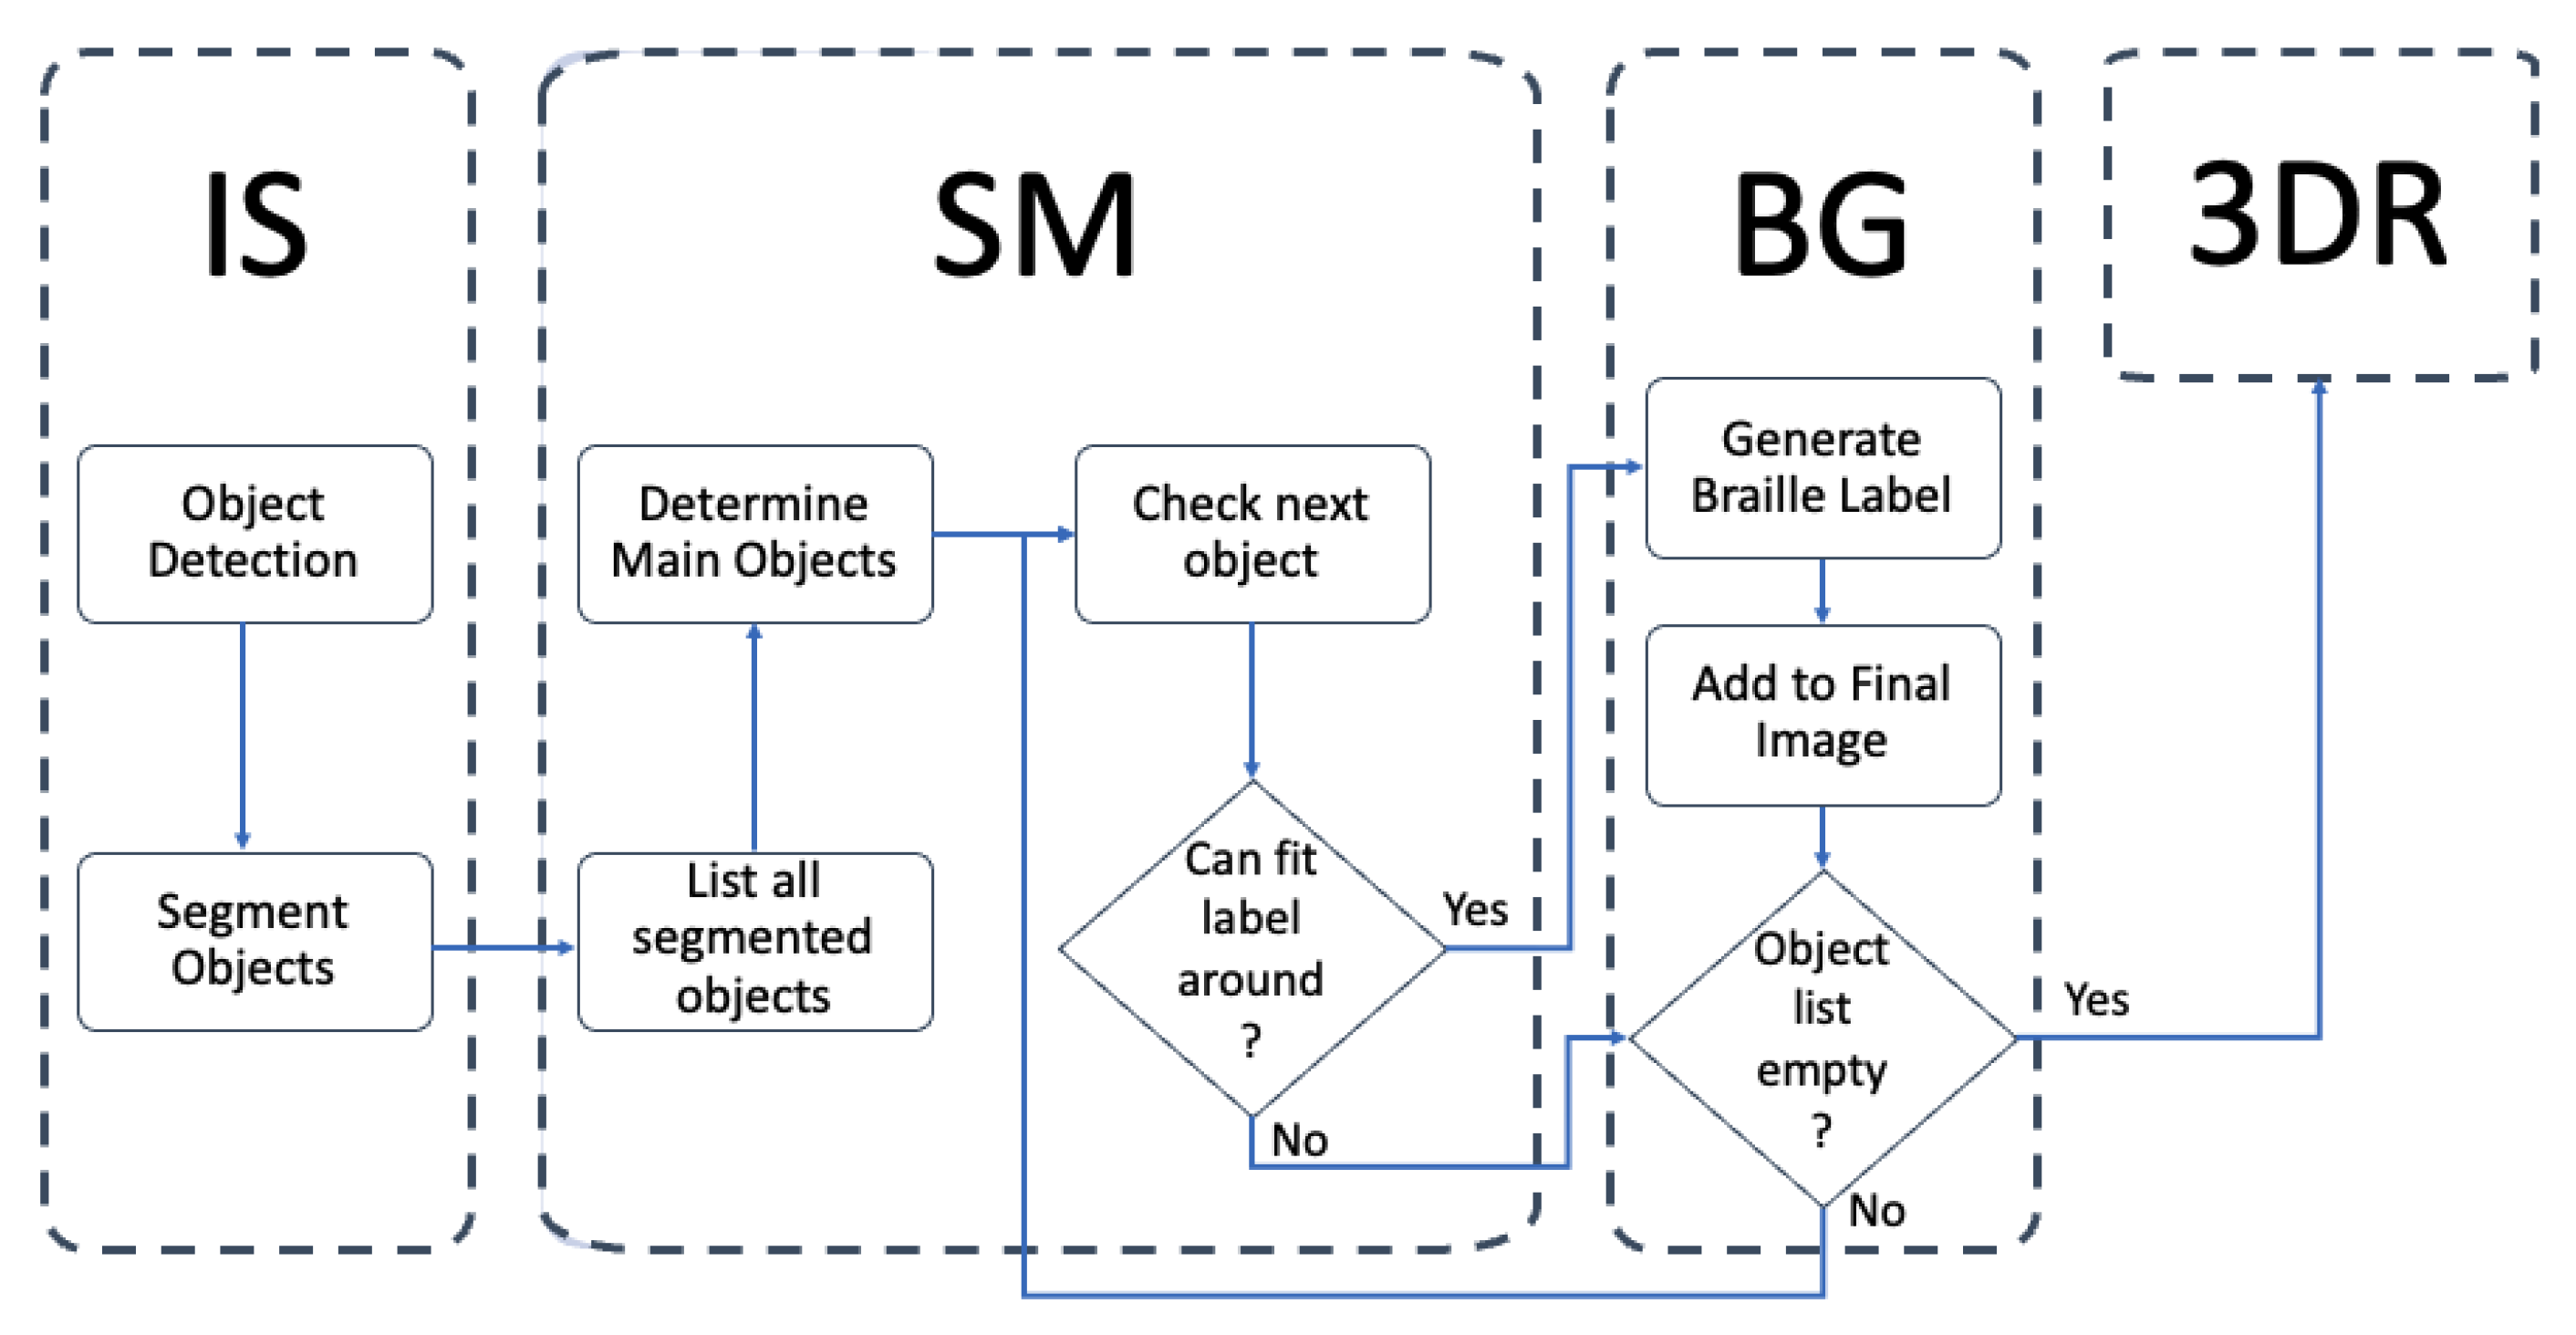
2.2. Selective Model for Object Masks
The guidelines for creating the tactile graphics used the concept of “less is more.” It was considered that it would help users to understand if they were provided with less information on the tactile graphic and the focus was placed on its important features. Because the haptic sense is not sensitive or accurate in terms of minute details, we developed a segmentation method that reduces the number of complexities within a tactile image while preserving the appropriate information. We proposed the use of a selective model (SM) built on top of the instance segmentation method. Depending on the type of tactile material and the spread of the main objects within the image, we limited the selection to between 1 and 3 subjects within the image, even if more were detected. The algorithm is shown in
Figure 4.
All of the information regarding the detected objects, and their masks, labels, and locations, are listed and then analyzed within the selective model. Different features of the masked objects are used to determine the main objects within an image. These objects are the combination of focus level, size of the object, and placement within the image. Objects with higher scores are given priority within the model. To determine the focus level of an object, the Canny edge detection algorithm is used, and the result is analyzed based on the number of detected edges. Then, the score for the size of an object is based on the total number of pixels of each object mask. Finally, the score for the location of the image is based on its horizontal and vertical placement relative to the center lines. The final score is computed with:
where
SS is the final score for the priority,
f is the feature (focus, size, location),
s is the feature score,
ω is the weight for the feature,
p is the pixels, and
o is the object. This score is then ranked based on the final score to determine which objects are above the score threshold and which is the first to be checked. For each main object, the braille label is checked to determine if it interferes with another object or the boundary of the graphic, and if the object is used for the material. Once all information is checked, it is passed to the 3D reconstruction algorithm.
2.3. 3D Reconstruction and 3D Printing
After the image and braille label are processed, a 3D point cloud registration algorithm is applied to place the objects into a unified coordinate system. Each point is arranged based on its pixel location, pixel identifier, and pixel value. The pixel location data determines where the pixel is located on the x, y grid. This is important for easier meshing and arrangement of the voxels. The pixel identifier determines if it is part of the object or just the background. From the output of the selective model, only the objects that are within the threshold and are selected are generated from the final image. The pixels that are part of the background remain neutral for most of the process and serve as the base of the educational materials. The details within the images are dictated by the pixel value. Moreover, the pixel value determines the z value of the pixels. This aspect is also affected when adding texture or details to an image. When combined, these aspects register the points into a singular 3D point cloud space and can be used for a meshing method.
Finally, the point cloud of the different parts of the TEM are combined. These are then passed to a mesh generation algorithm to create the STL file. The point generation of all types of tactile photographs in this system fixes a 3D point array cube, which is represented by a set of values, n
r = [n
r0 n
r1 n
r2 … n
rn], n
c = [n
c0 n
c1 n
c2 … n
cn], and nd = [n
d0 n
d1 n
d2 … n
dn] that are arranged in a 2-dimensional array depicting their positions based on the values. Each value in the array corresponds to a specific point in the 3-dimensional coordinate system in terms of their x, y, z coordinates. Optimal triangulation is achieved to enable the mesh generation of the coordinate points [
17]. The STL mesh is generated from the x, y, z points in the R3 set in the image’s world coordinates, where x represents the horizontal position, y represents the vertical position, and z represents the height position. These points are dictated by the previous image processing algorithms. The triangulation is performed to enable the representation of the complex geometry of surfaces, in this case the tactile photographs, as a simple geometry for easier interpolation of the numerical values. The optimal triangulation used was Delaunay triangulation, which is used for the efficient computation of the meshes [
18]. These meshes are used to generate the STL file of the tactile photographs.
The materials generated through our algorithm were printed using a conventional extruder-based 3D printer. Different tactile materials were printed for evaluation. The materials were given a consistent size of 100 by 115 mm for the small materials and 148 by 210 mm for the large materials. We used the PING DUAL 300 D300 (Taiwan) with SpiderMaker 3D Matte PLA filaments using consistent printing parameters: layer height = 0.2 mm; wall thickness = 1.2 mm; infill density = 10%; infill pattern = Trihexagonal; printing temperature = 210 °C; build plate temperature = 60 °C; retraction speed = 60 mm/s; print speed = 40 mm/s. These parameters were found to be the most compatible with the filament, the 3D printer, and the models being printed.
2.4. Tactile Educational Materials Generated
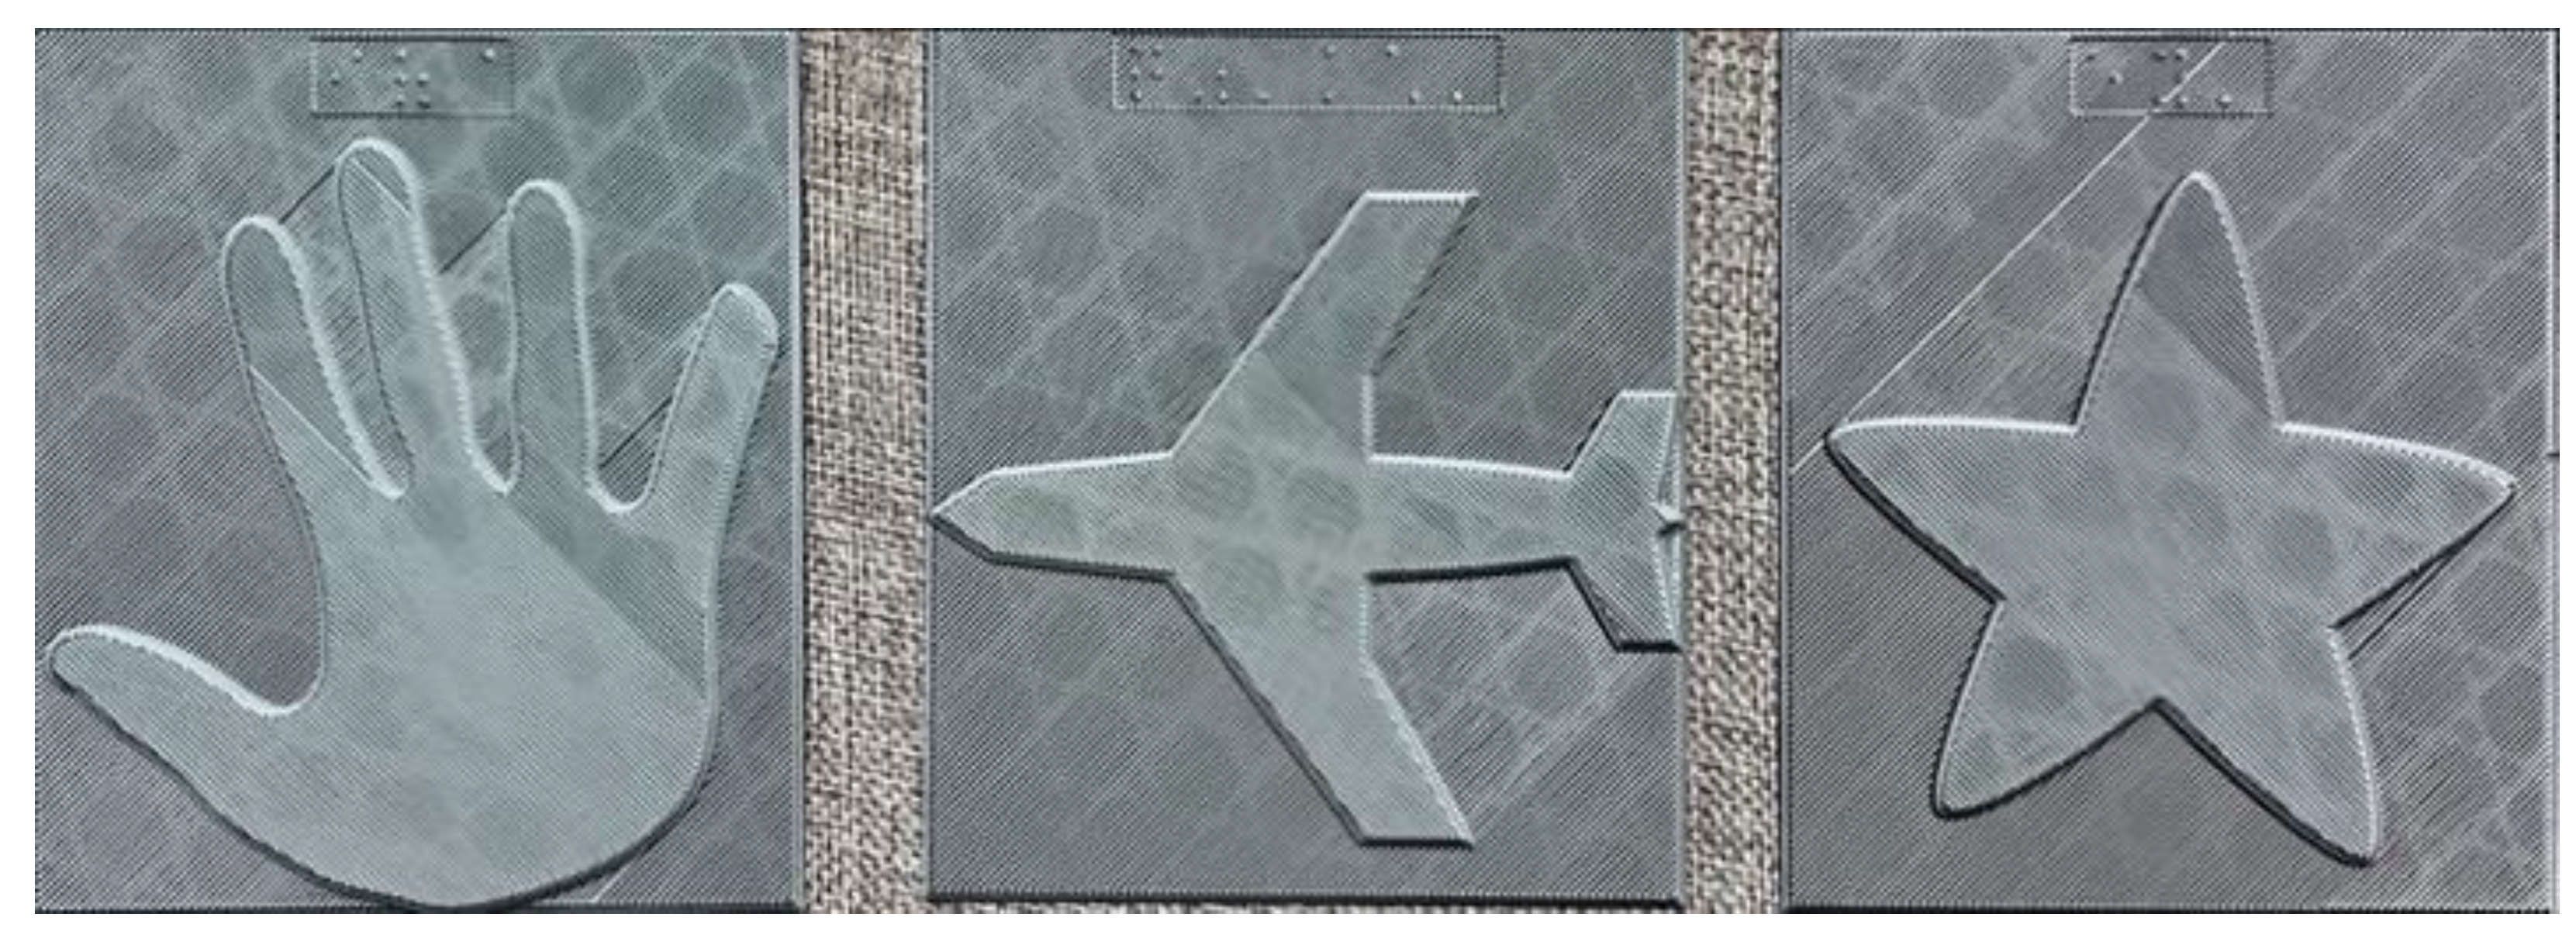
For the tactile flashcards, we developed a format in which braille captions are generated on top of the tactile graphic based on the object label determined by our object detection model. This method uses our selective model to determine one main object within the image and only uses that object for the braille label. This removes the need to check for the fitting of the braille label around the image.
Figure 5 shows some of the tactile flashcards.
For the tactile maps, a blob detector is used to segment the image based on the interconnected pixels with the same intensity. Each blob can then be labelled by the user. A strip packing algorithm is used to space the labels around the images and a connection line is created from the blob to the label. This algorithm is optimized by minimizing the distance from the blob to its corresponding label while having no overlaps with blobs and labels [
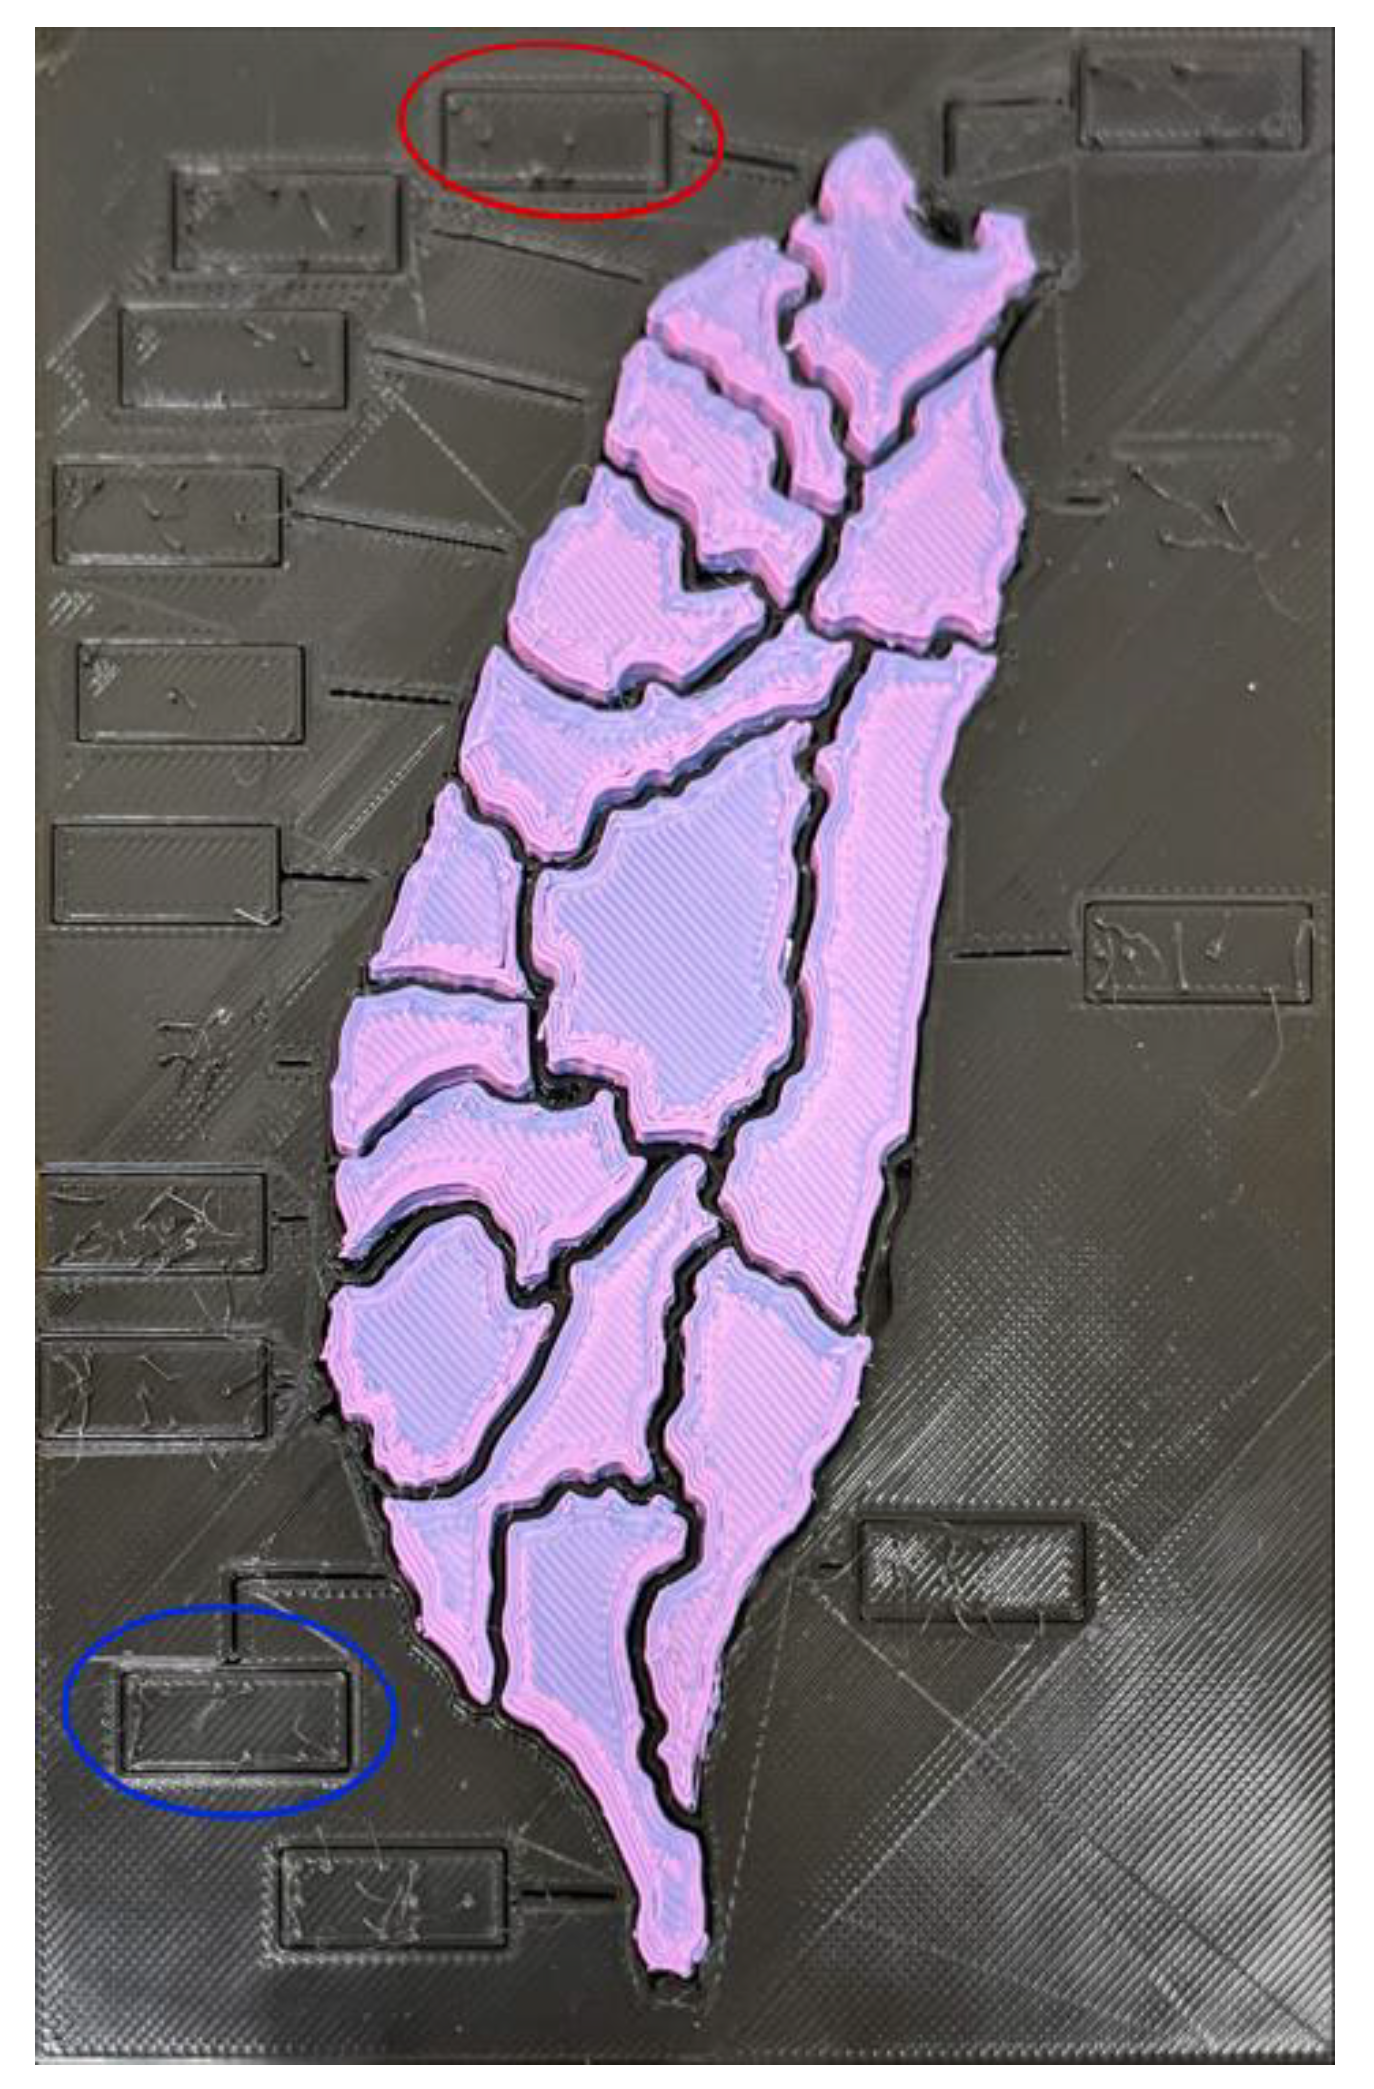
19]. Each blob is generated as one part of the material. A sample of a tactile map is shown in
Figure 6 with purple parts and a black base.
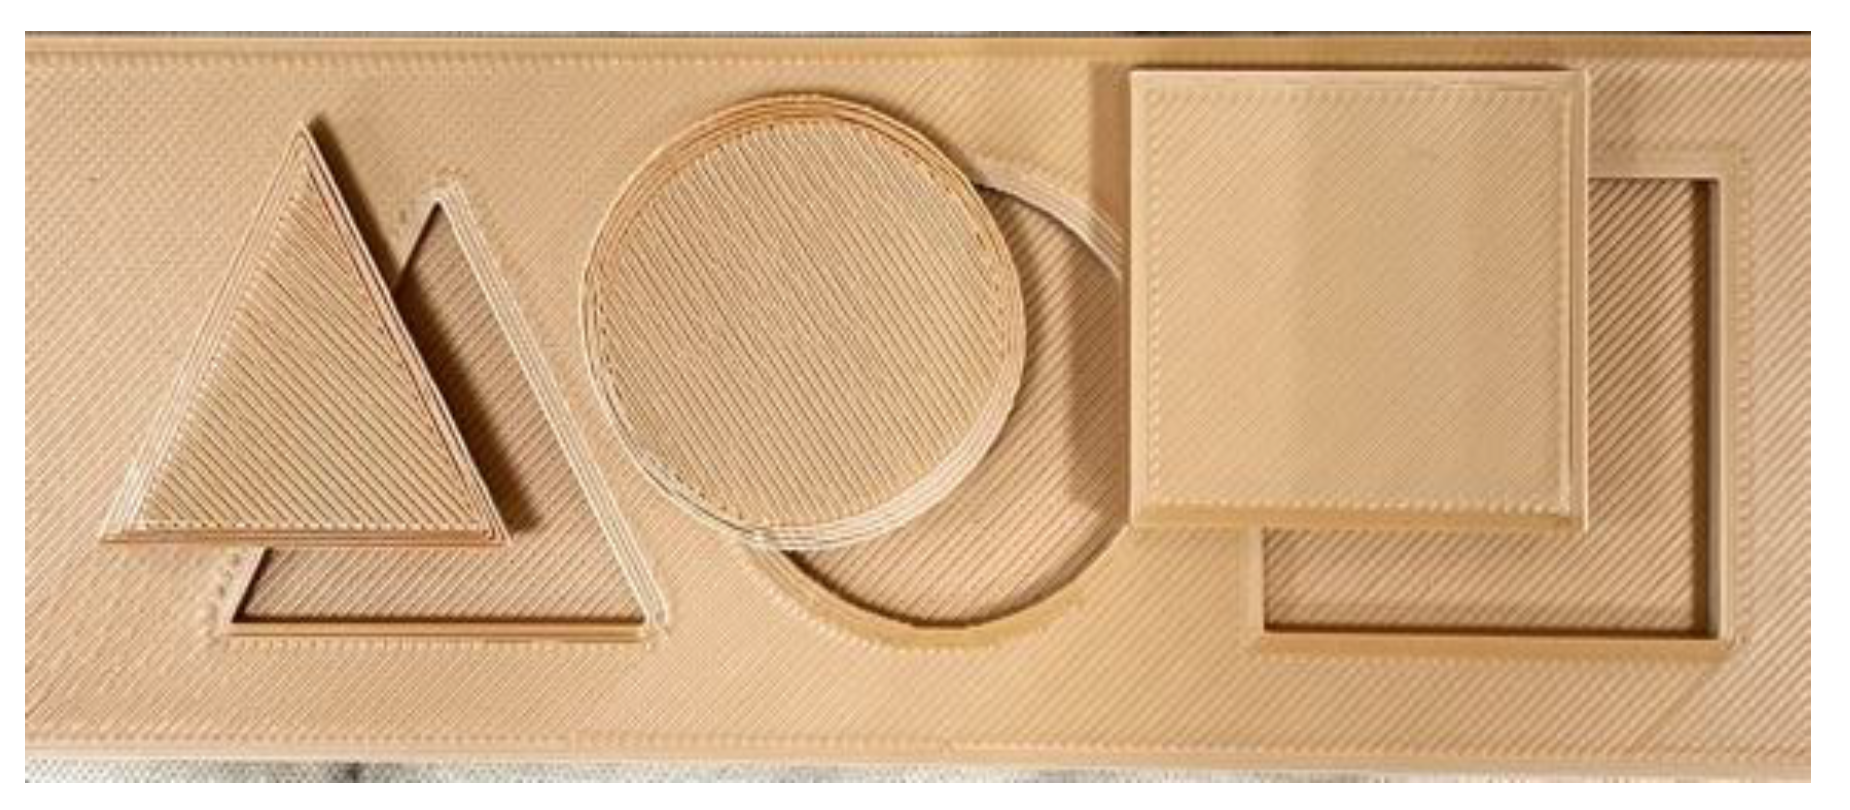
For the tactile peg puzzle, two parts were created: the base plate with braille labels and the object parts. The models were optimized to be able to fit the object parts onto the base plate. To determine the objects to be placed in the material, the selective algorithm is used to fit a maximum of 3 objects without interfering with each other. A sample of the tactile peg puzzle is shown in
Figure 7.
2.5. Testing Methodology and Demographics
For system evaluation purposes, the parameters for the serverless platform, AWS Lambda, are shown in
Table 1. To achieve a consistent result, each Lambda function was implemented using the same parameter values. The Python 3.8 development language was used with allocated memory of 10,240 MB.
Initially, we met with VIB teachers from the Tainan City Life Rehabilitation Center for the Visually Impaired to let them feel the current TEM. This subjective evaluation compared the different methods of the tactile materials and the level of simplicity within the image. We provided the teachers with 20 types of images, and they commented on the aspect that was the easiest to understand. A summary of the demographics of the teachers that tested the tactile flashcards is shown in
Table 2. One teacher was blind from birth and the other developed blindness at age 6.
Next, we visited the Taichung Special Education School for the Visually Impaired, wherein six VIB students were given the educational aids to trial and provide comments. Their ages are between 13 and 20 years. Of the 6 students, 4 were VIB from birth, whereas two developed visual impairment; 1 is fully blind, 4 have light perception, and 1 has vision in one eye. Five of the students are able to read both English and Chinese Braille, although some are better able to use Chinese Braille, and one student uses books with big characters to read from one eye. A summary of the demographics of the students is found in
Table 3. After the evaluation, the students were asked about their thoughts on the tactile materials in individual interviews.
The usability test for the generation website was conducted with the counselling teachers. Their task was to generate a tactile material using a 2D image with the TacPic website. They were then interviewed about their experience and asked for comments on the system. Based on the ISO/IEC 25010:2011 Systems and software engineering—Systems and software Quality Requirements and Evaluation (SQuaRE) quality models, the usability of a system can be determined based on the following sub-characteristics: appropriateness, recognizability, learnability, operability, user error protection, user interface aesthetics, and accessibility. Regarding the aspect of usability evaluation, the most widely used method is the empirical method, consisting of either questionnaires or usability testing which has the advantage that the feedback of the users is directly provided.
3. Results
The main contribution of this study was the use of a selective method algorithm alongside an instance segmentation algorithm to reduce the unnecessary information within an image while retaining the important information. Furthermore, we introduced the use of advanced technologies for the education of the visually impaired students, and an understandable interface so it can be easily used by users who are not experts.
3.1. Evaluation of Selective Model
Our model is based on the Mask RCNN model trained using the common objects with context (COCO) dataset with a backbone of ResNet-50. This model is based on the matterport implementation of Mask RCNN [
20]. In our testing, we detected all of the objects within an image, then used the selective model to remove objects that were not the main object.
Figure 8 demonstrates a selective model using a sample image. As shown in
Table 4, an evaluation of the system was performed by the researchers using images of single or multiple objects in unique cases. This was able to detect the main object, but experienced some failures when faced with objects that were close to the main object. For the first seven cases, the testing was undertaken for the detection of only one object, whereas, for the remaining cases, it was undertaken for the detection of up to three main objects.
3.2. Evaluation of Algorithm Speed on AWS Platform
The AWS CloudWatch Logs provided an accurate summary of the runtime of the different processes. We used this to quantify the speed of the different steps within the process.
Table 5 summarizes the processing time for each step for two different sizes. The bigger image size generally took a longer time to process across the different processes. The first steps of pre-processing and segmentation were undertaken simultaneously, so the longer process was considered regarding the total and the shorter process was able to be ignored. As a result, the total generation time required for an image to become a TEM was within a few hours. To be uniform, the sizes of the materials used in testing were 100 by 115 mm for the small materials, and 148 by 210 mm for the large materials. The results show that the algorithm proposed by the system needs only about 2 min and 48.149 s (small material sample), and 4 min and 25.28 s (large material sample), to generate a TEM. In addition, it would take about 2 h and 47 min to print a small material sample, whereas large materials can be printed in around 6 h and 37 min. This is an improvement over the current methods, which normally take from 2 weeks to several months to complete, depending on the complexity of the material.
3.3. Pilot Evaluation from Teachers of the Blind
The tactile graphics we generated for the teachers who were blind comprised two levels; one was a lithophane-based tactile graphic, and the other was a shape-embossed version that was generated using our method. Based on our trials of 30 tactile graphics, the teachers preferred the simplest version of the tactile graphic, with which they were able to identify the objects within the TEM. We noted this was because different elements within the lithophane-based tactile graphic were unnecessary and unreadable using the tactile sense. Our results showed the graphics were more easily understood by the teacher who was not congenitally blind. The teacher noted that this was due to their previous background of learning shapes prior to developing blindness.
Table 6 summarizes the testing of the flashcards with the teachers.
3.4. Evaluation of Tactile Materials
The images used for the generation of TEM were different common objects and words that can be learned by children. For the tactile flashcards, different simple shapes, such as a moon, triangle, square, circle, star, hand, cloud, coffee, car, and heart, were used to ensure they would be easy to understand. For the tactile maps, the map of Taiwan was used to ensure that it would be relatable to the user. For the tactile peg puzzles, different fundamental shapes, such as a circle, square, and triangle, were used. The TEM were simulated and generated at a uniform size and aspect ratio, but with differences in each of the types of materials. Their teachers supervised the evaluation and guided the students on the processes and the graphics that they did not understand.
The tactile materials generated by our system were tested by different VIB students to determine if the illustrations on the flashcards were identifiable. Tests for the peg puzzles and map were evaluated in terms of the student’s completion. The students were not trained in how to use the tactile educational materials prior to testing. In the first test, each of the six VIB students was given a set of 10 flashcards and instructed to use the embedded shape to try to identify each object within the set.
Table 7 summarizes the results, and shows that most of the students were able to identify the graphics, and that some used Braille. Most of the failed identifications were the cloud and car objects, which are relatively complex.
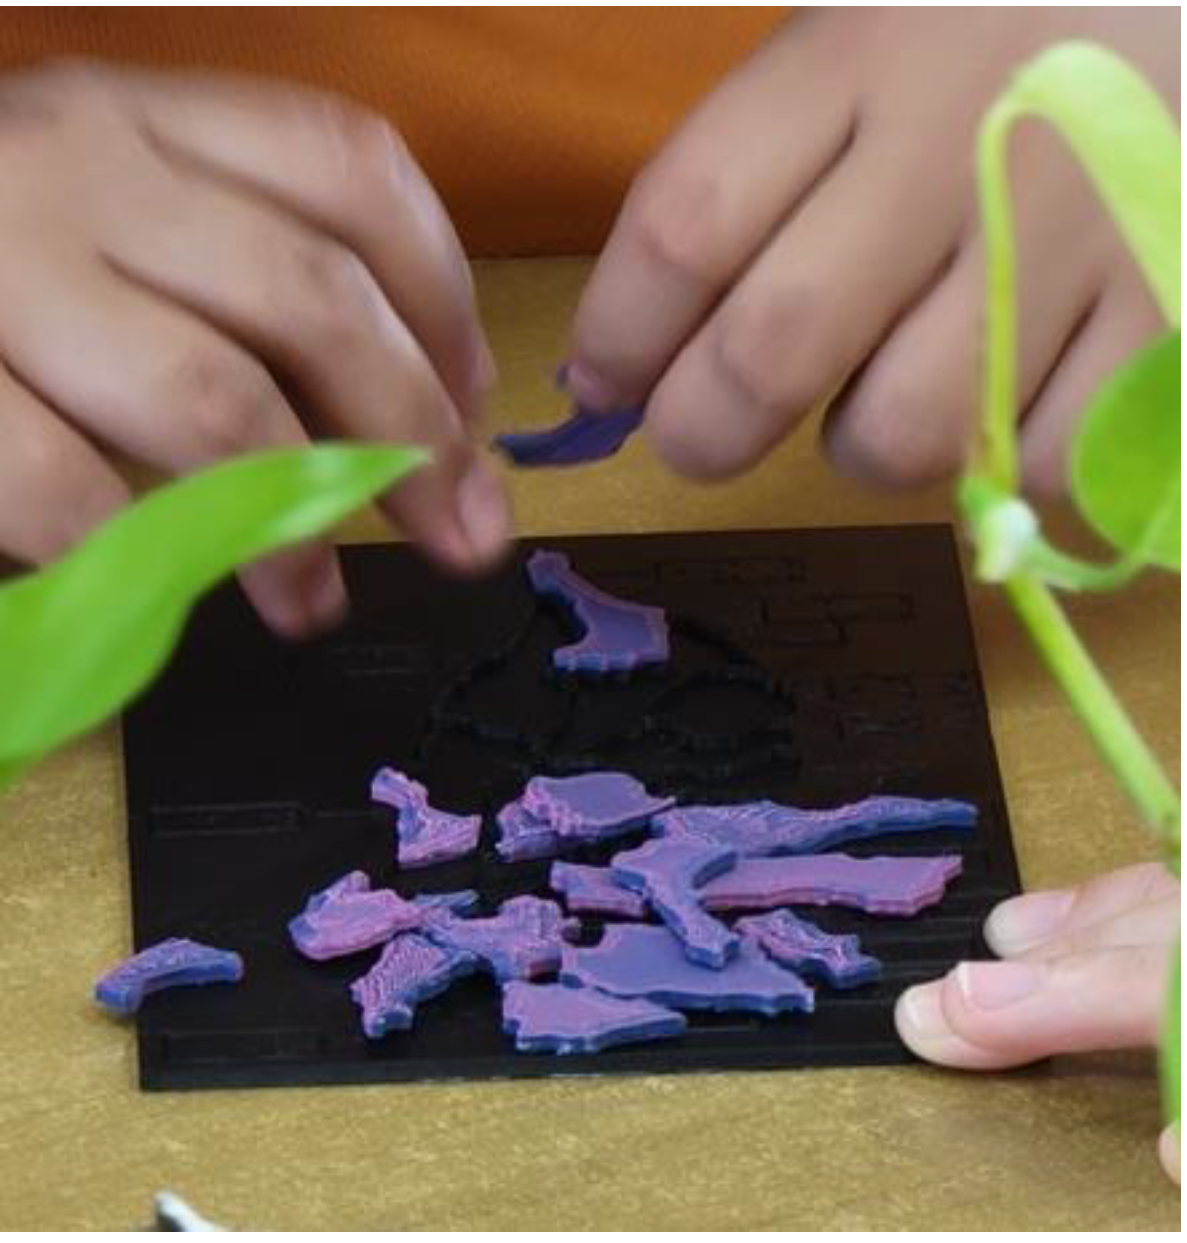
For the tactile maps that were set-up like peg puzzles, the users experienced a slight difficulty in piecing together the Taiwan map. Because the map had a complex shape, the users were initially confused, but were eventually able to place the pieces in their correct slot. With the map base, they were able to locate each Taiwan city using the contracted names of the city (bei for Taipei City, gao for Kaohsiung City, etc.) and also relative to each other. They found that this was an interesting tool to understand geography and the location of each city relative to the others. Images of students using the tactile materials are shown in
Figure 9.
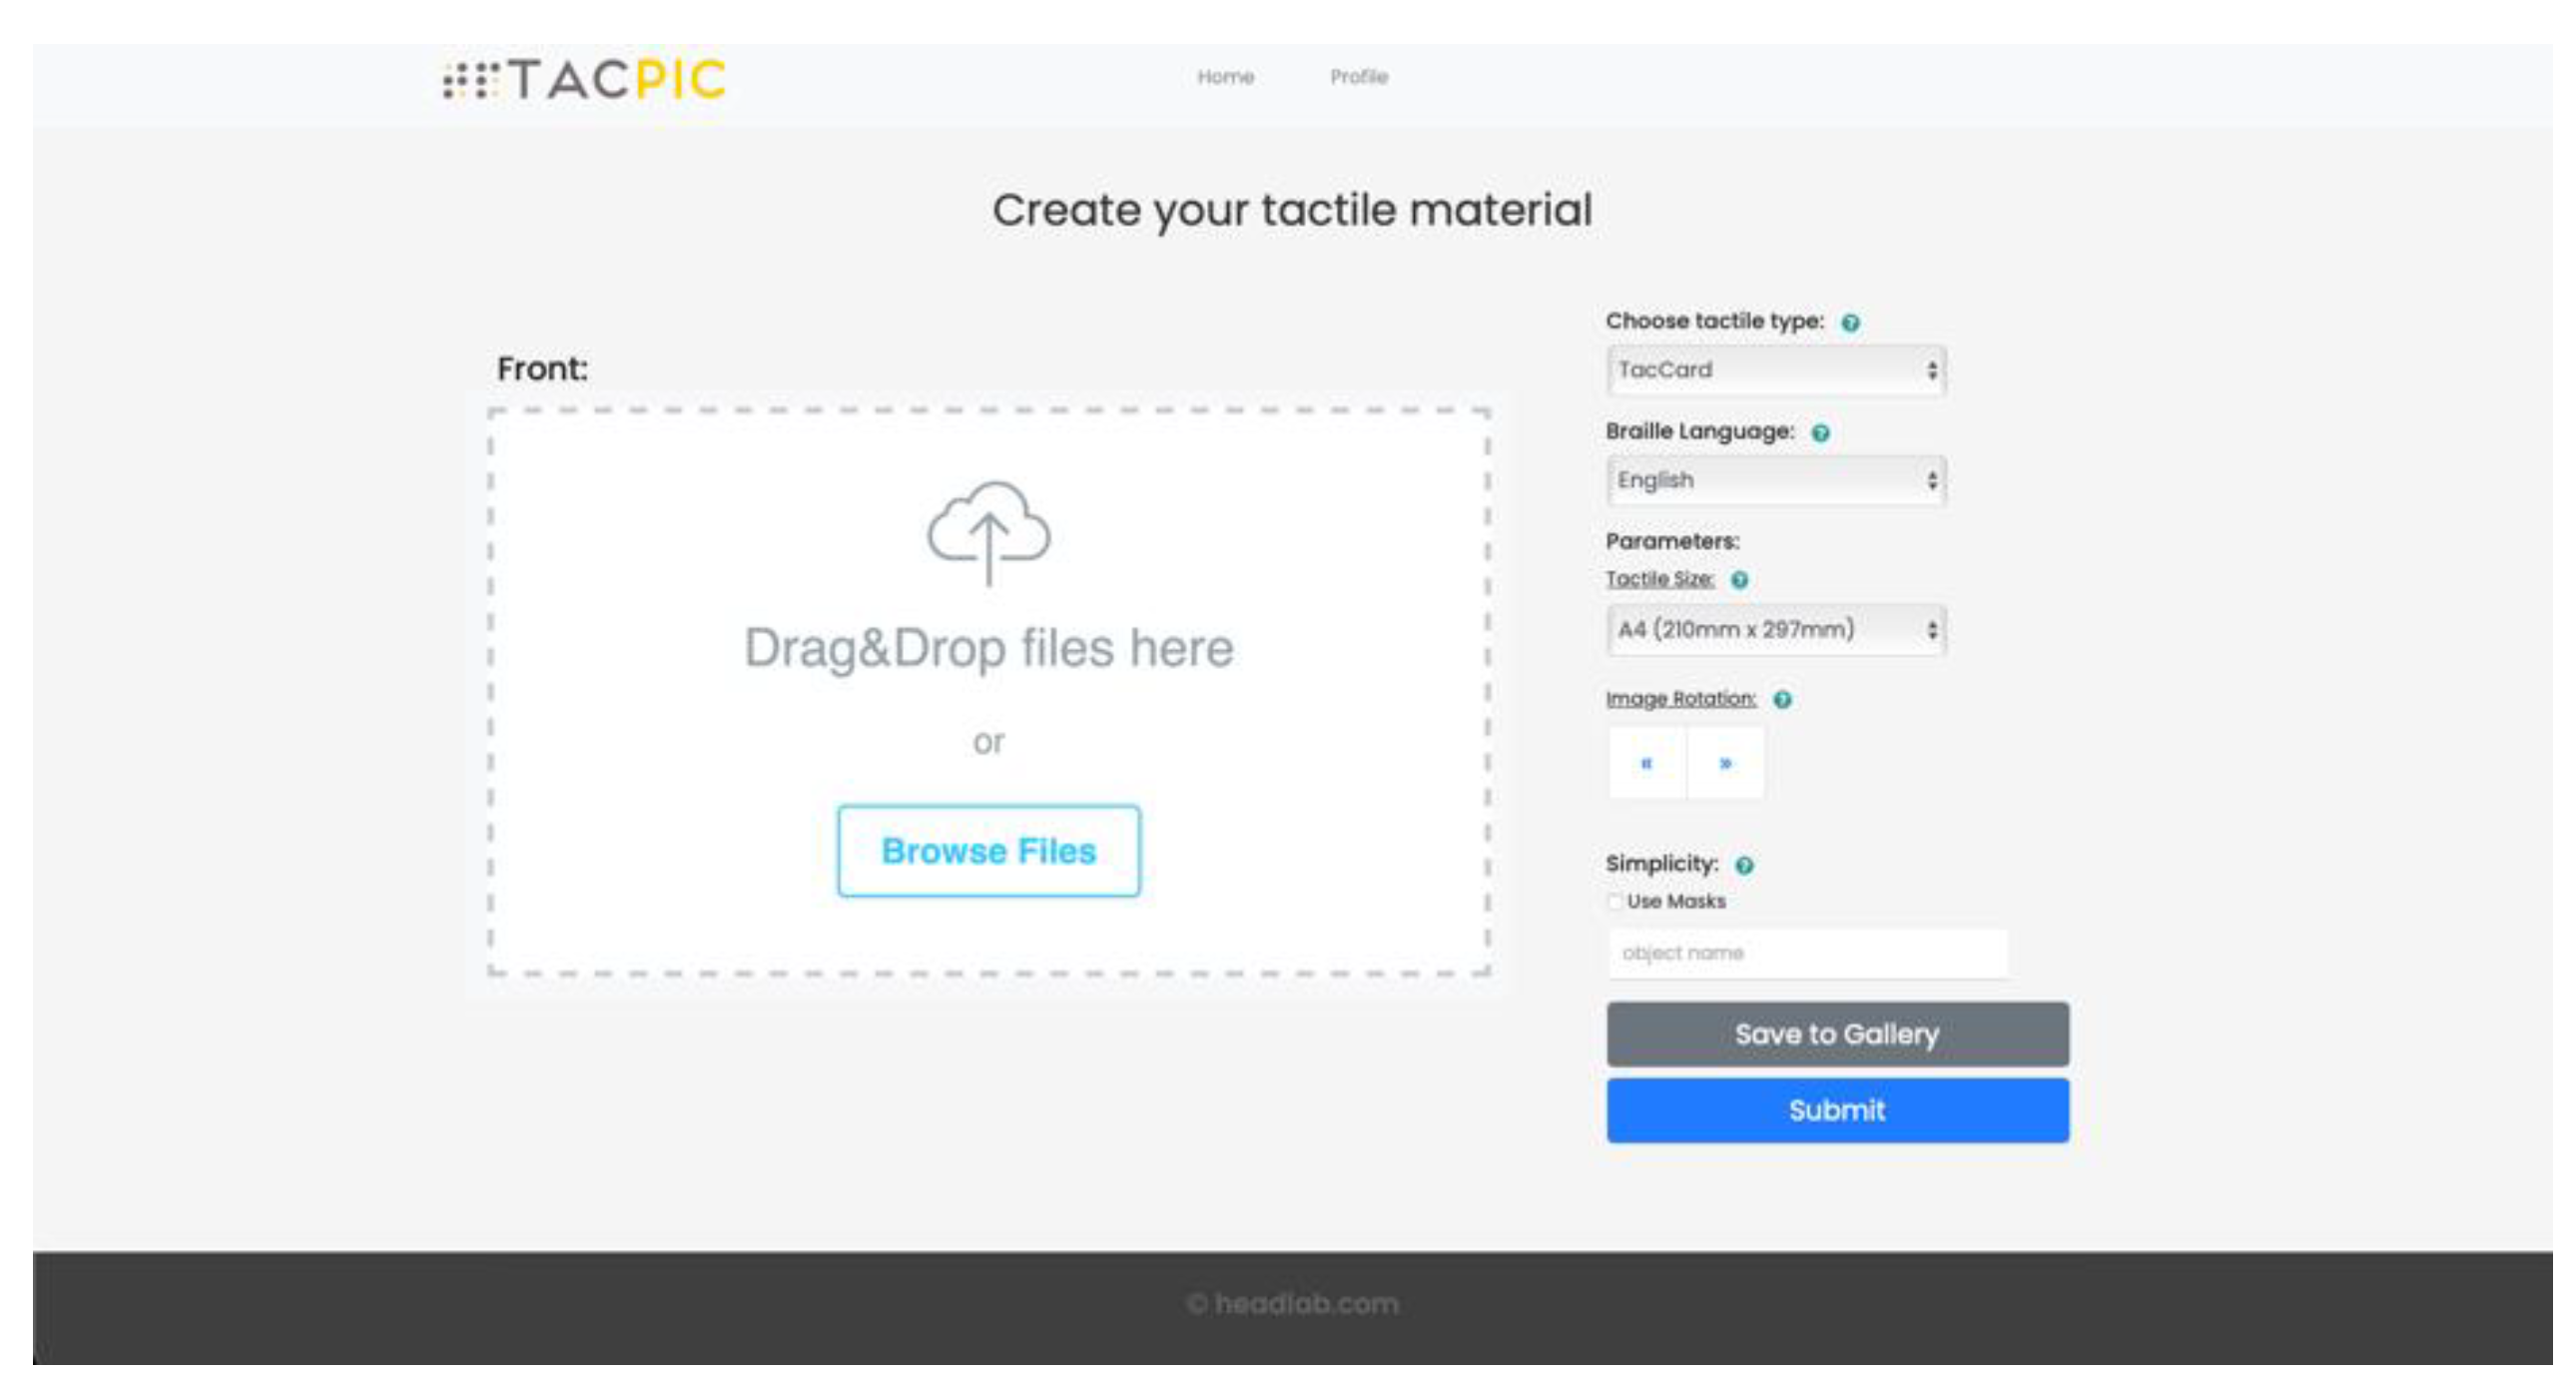
3.5. Evaluation of TacPic Website
The website we developed is shown in
Figure 10. The website was divided into two sections: the image upload and the setting selection. The website was designed for simplicity so that any user, even those who are untrained in tactile materials, would be able to develop TEM. The teachers noted that the students have different abilities, and that it is crucial to design the learning material according to the ability of each student and to undertake further testing to provide a suitable material. Thus, it was crucial that the website enabled the user to easily customize the materials. After testing the website and successfully generating TEM, they found that the concept of easy generation of tactile graphics was helpful for them. They were able to easily develop the tactile materials using 2D images while customizing the different parameters of the generated TEM. The teachers stated that the website was straightforward and easily understood upon initial use. Thus, the teachers could easily become familiar with the system.
4. Discussion
Our selective model algorithm can easily identify the main objects within an image, and ignore the other detected objects to reduce the information. This helps the understandability of the tactile educational materials for visually impaired students. During our pilot testing with VIB teachers, we compared the lithophane method and our method of development of tactile graphics. It was observed that the teachers preferred simpler graphics than complex ones. The students and teachers also commented that most tactile materials are difficult to acquire, particularly in Taiwan where it is rarely manufactured.
During the evaluation of the tactile materials, the shapes were immediately recognized but the users noted that the Braille labels had rectangles that were distracting. In addition to the removal of rectangles for the labels, we will round the corners of the tactile materials to reduce the hazards to the users. Regarding the tactile maps, the users had difficulty in recognizing the complex shapes of the cities but could read the Braille. As with any new platform, a learning curve is associated with the understanding of the shapes and objects being portrayed. People with prior knowledge regarding shapes and objects have an advantage compared to people without prior knowledge about the shapes [
21]. We observed that the students and teachers who previously had vision were faster and more accurate at identifying the shapes. By comparison, although others were able to understand some of the shapes, they were slower. Based on our testing, there appeared to be a correlation in which the students with prior knowledge of the shapes were able to recognize them more quickly than the other students who had no sight since birth. The purpose of the tactile materials in our study was for training, so it is expected that the students will not be able to understand all of the shapes immediately [
9]. In our test results, there were only a few cases in which students did not understand the illustrations. With future training and more testing, the users will potentially be better able to understand and utilize these shapes. In addition to the students, the teachers were instrumental members of our evaluation, and provided meaningful insights into our development of the generation system and the tactile materials. The most notable comment they provided was that the system would be significantly improved if it was able to provide a universal design that can be used by both the sighted and the visually impaired students, thus making the materials more inclusive and enjoyable for all students. The ease of understandability and ease of use are extremely important for enhancing the generation of TEM by teachers and encouraging them to use it more.
The teachers found that the concept will help ease their burden in creating tactile materials, and that the website was easy to understand and easy to use. From the conducted interviews, we summarize the different themes and corresponding quotes of the teachers that reflected their experience and thoughts on using the TacPic system in
Table 8.
6. Conclusions
We successfully developed a platform that that allows users to quickly develop personalized and individualized tactile learning materials without prior experience in tactile photo development or 3D printing. This platform can be used to create tactile educational materials, such as tactile flashcards, tactile maps, and tactile peg puzzles. These materials can be used in shape perception and object identification with the use of touch to improve the current learning platforms. The proposed method provides the teachers and parents of VIB students a robust means of more quickly creating different types of TEMs than traditional methods, by taking advantage of the rapid prototyping method of 3D printing. This can be undertaken with minimal human interaction and no prior experience in 3D printing.
Although the algorithm enables the robust construction of TEM, its general variable formatting allows for the use of other sources, such black and white and RGB images, and the use of other preprocessing filters, which can alter the style and fit the context and information being displayed. Therefore, the system is not limited to only three types of TEM. Rather, it acts as a baseplate for the different types and styles available to the user. This proposed platform has the capability of being expanded to a different variety of data sources, such as depth [
22], LiDAR [
23], radar [
24], or stereo imaging [
25]. Currently, we are using 3D printing as the means for rapid prototyping of the developed tactile photographs. However, we are also examining other types of generation surface haptics, which may be developed using CNC milling, and virtual haptic interfaces [
26,
27,
28]. A GCode generation algorithm may be added to the system to further reduce the need for human interaction within the process from the input to the output.
A future area of research that can be integrated into this study is the concept of color theory for tactile systems. Patterns can be used to correspond to different colors or shapes to provide more information to the VIB students, such as that shown in [
29]. Subsequently, further optimization of the algorithms to improve segmentation, and the inclusion of other features such as color and texture, can be undertaken. The teachers of the visually impaired students can continually generate tactile graphics using our platform, and provide feedback regarding the new features that we introduce into the system. Finally, new materials and methods in printing are needed to hasten the printing process and enable more efficient mass production of the tactile educational materials.


