
Simulation and Analysis of the Impact of Cylinder Deactivation on Fuel Saving and Emissions of a Medium-Speed High-Power Diesel Engine


Featured Application
Abstract
1. Introduction
2. Numerical Models
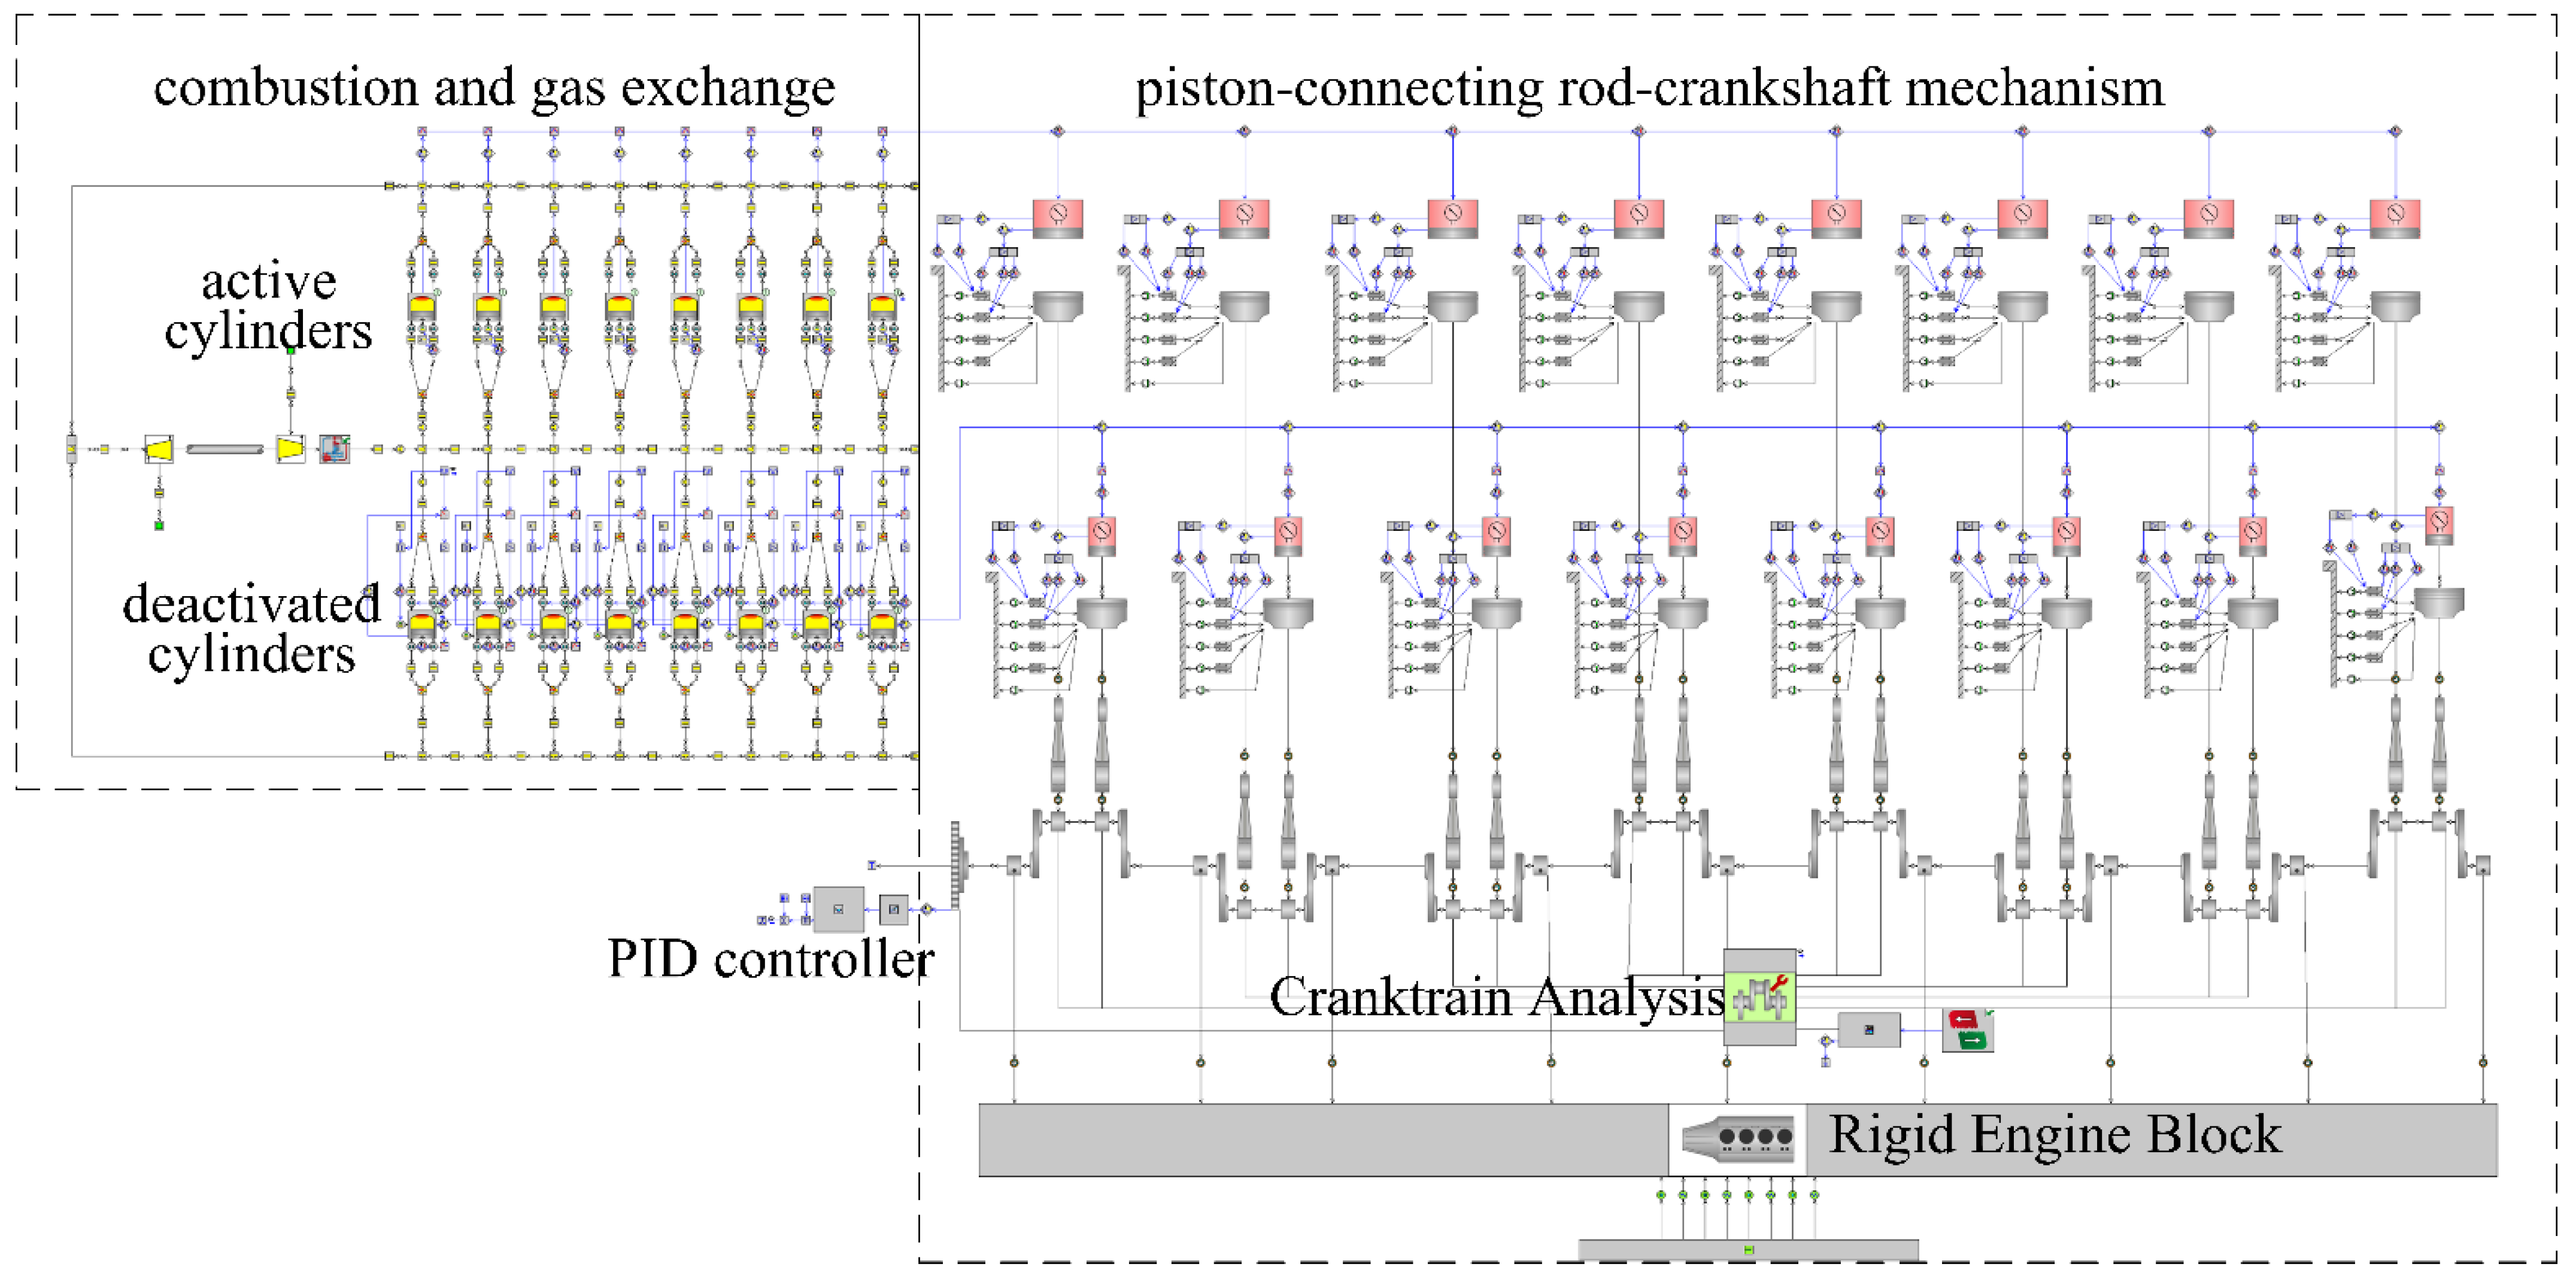
2.1. Engine Model
2.2. 3D Engine Combustion Model
2.3. Model Validation
3. Results and Discussion
- 1.
- CDAo—cutting off the fuel supply in the deactivated cylinders;
- 2.
- CDAc—cutting off the fuel supply and disabling intake and exhaust valves in the deactivated cylinders;
- 3.
- CDAc + EGR—cutting off the fuel supply and disabling intake and exhaust valves in the deactivated cylinders incorporated with controlling the EGR rate.
3.1. Fuel Consumption
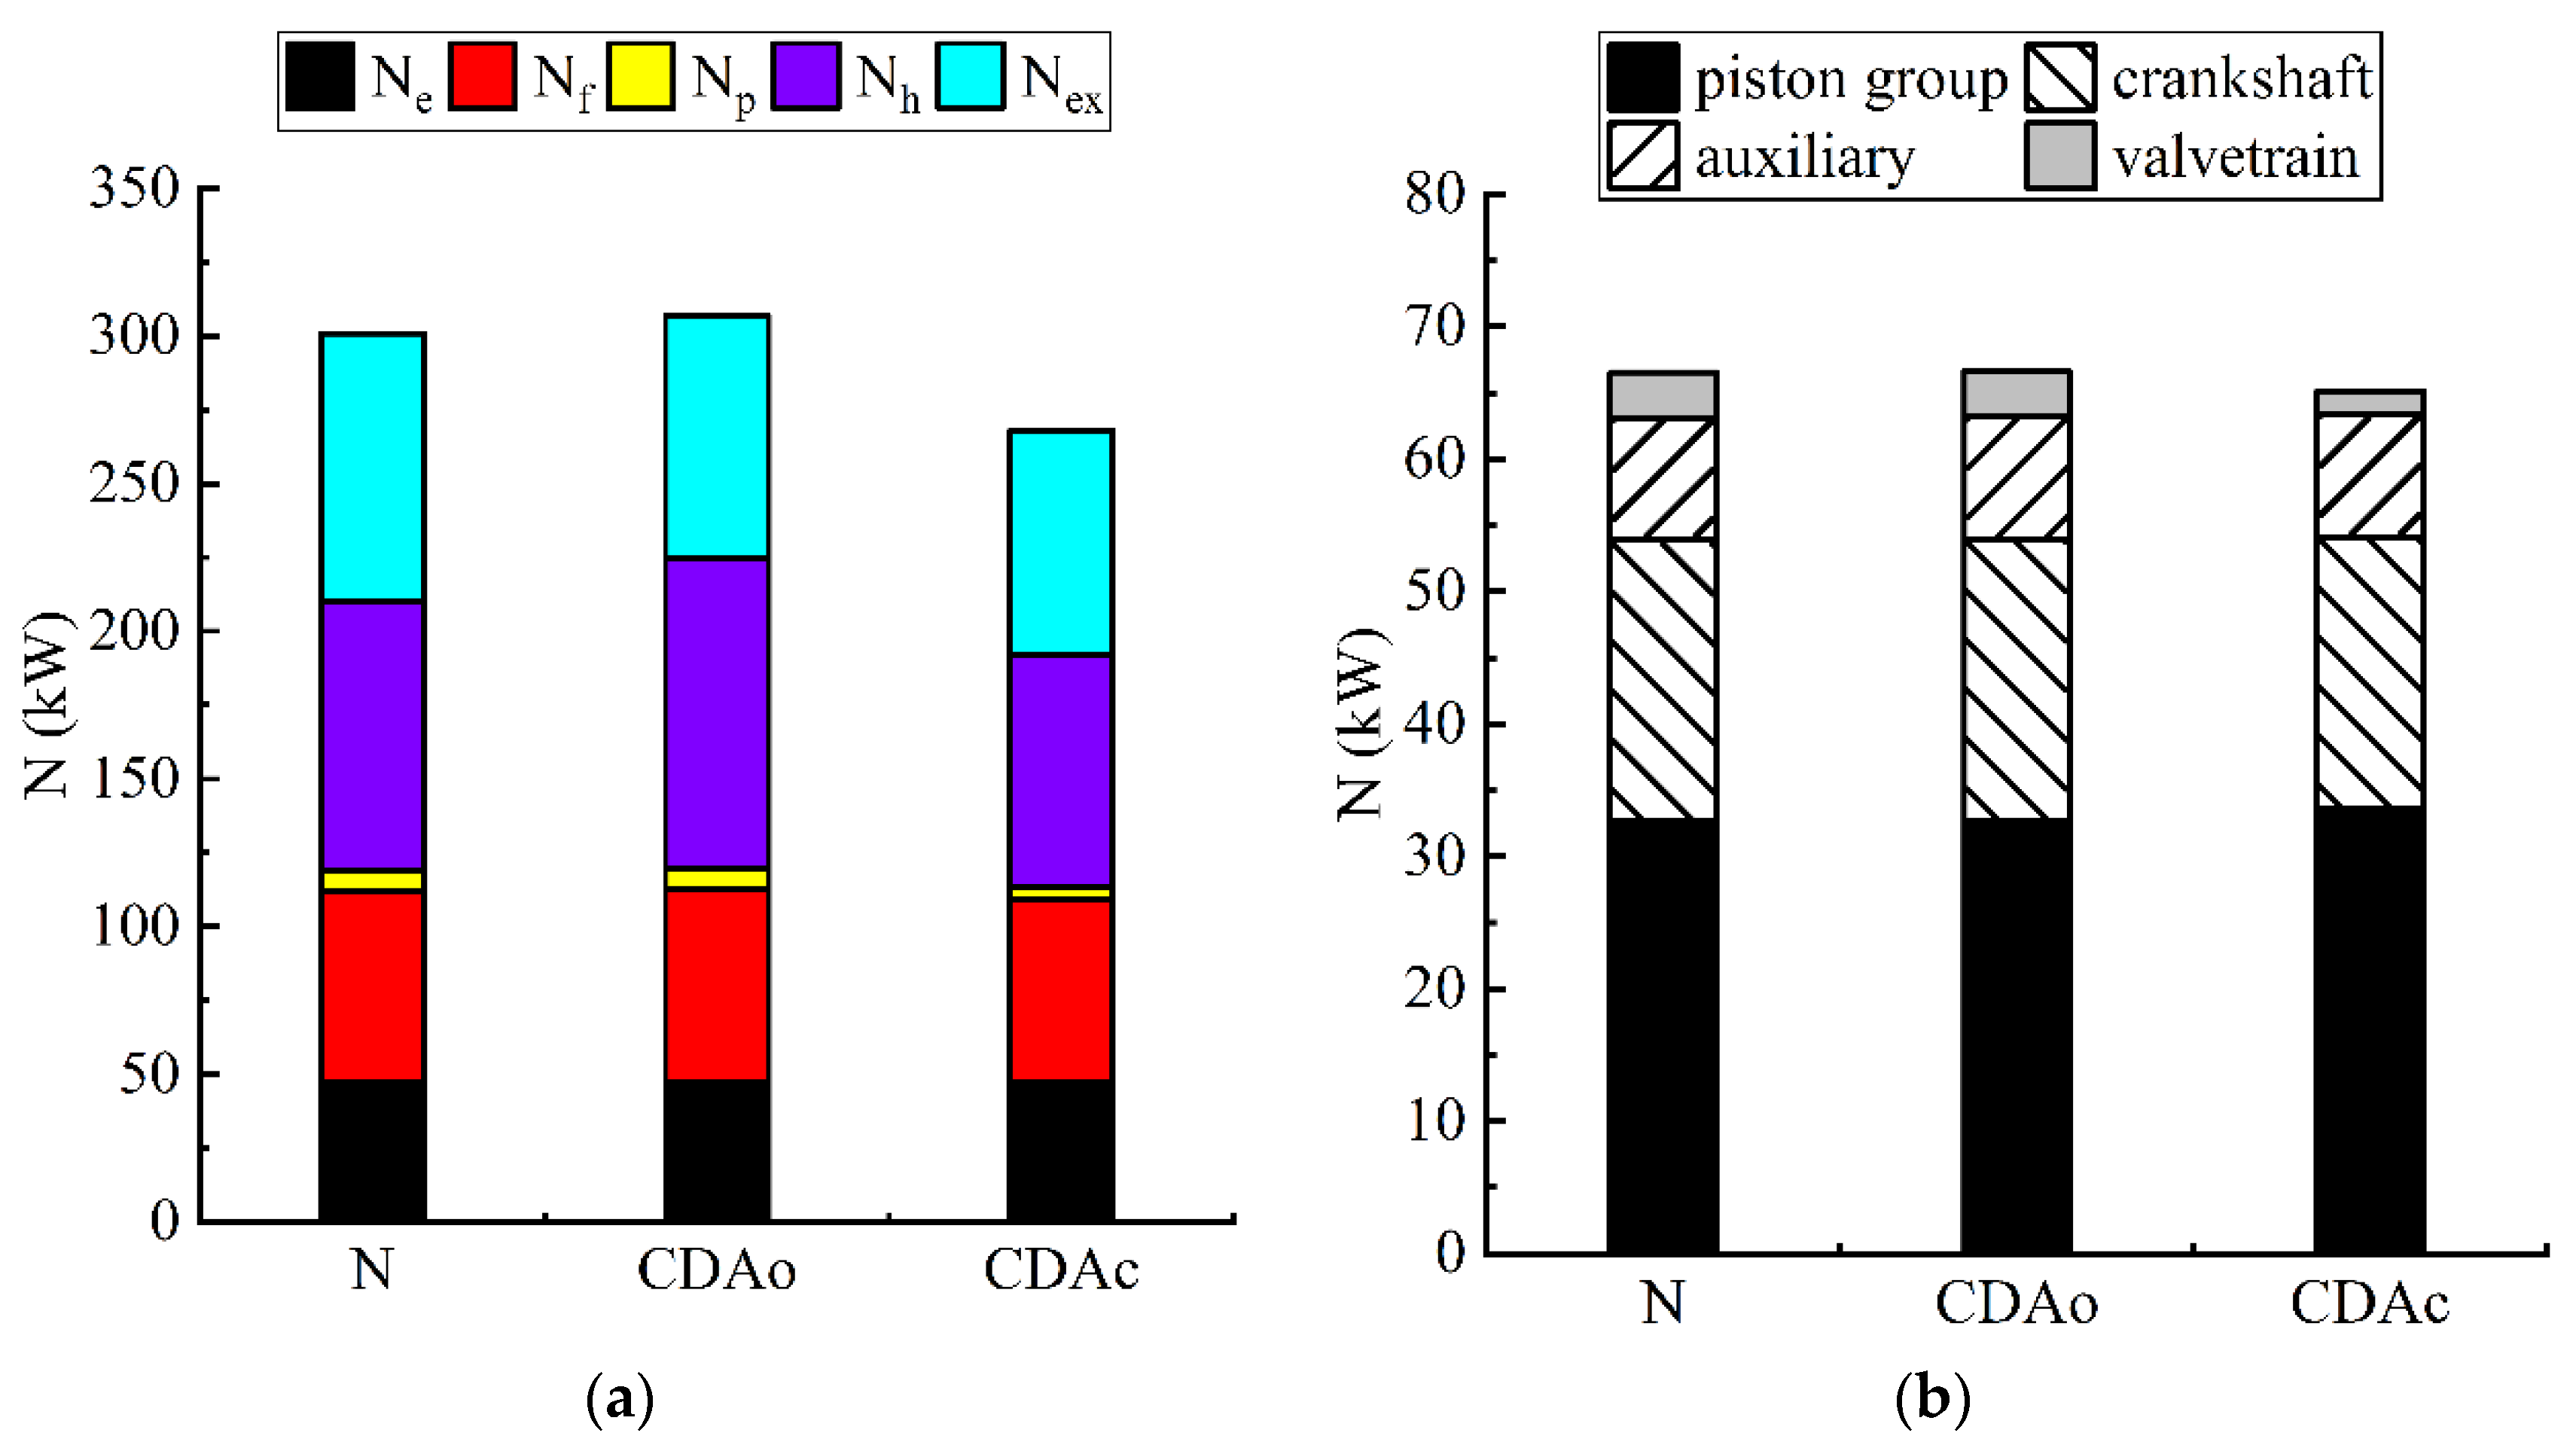
3.2. Energy Analysis for the Engine
3.3. Emission Performance
4. Conclusions
- (1)
- The BSFC reduction is obtained in the engine operating range from 1000 to 3000 N∙m at 450 rpm and 556 rpm. CDA with intake and exhaust valves closed reduces the BSFC by 11 and 14% at engine speeds of 450 rpm and 556 rpm at a load of 1000 N∙m.
- (2)
- The BSFC reductions are attributed to the increase in the indicated efficiency in the active cylinder and the reduction in the motoring losses, the pumping losses, and friction losses of the valvetrain in the deactivated cylinder. Fixed cylinder deactivation will increase the hydraulic friction loss in the deactivated cylinders.
- (3)
- At low speeds and light engine loads, CDA with all valves closed without EGR reduces CO and soot emissions attributed to the improved fuel-air mixing formation and increased combustion temperature in the active cylinder, which in turn results in an increase in NOx emission.
- (4)
- At 450 rpm and 1000 N·m, CDA combined with EGR control dramatically reduces the BSNOx emission to 4.2 g/(kW·h) at the cost of only a 0.8% increase in the BSFC, while the BSCO emission is maintained in low levels.
- (5)
- The investigation confirms the benefit of combining CDA with all valves closed and EGR as an effective method to reduce the BSFC and engine emission levels simultaneously for a medium-speed high-power engine, without the significant modification of engine construction.
Author Contributions
Funding
Institutional Review Board Statement
Informed Consent Statement
Conflicts of Interest
Abbreviations
| BSFC | Brake-specific fuel consumption |
| BSCO | Brake-specific carbon monoxide |
| BSsoot | Brake-specific soot |
| BSNOx | Brake-specific nitrogen oxides |
| CDA | Cylinder deactivation |
| CDAo | Cylinder deactivation with valve open |
| CDAc | Cylinder deactivation with valve closed |
| EGR | Exhaust gas recirculation |
| MMEP | Mechanical mean effective pressure |
References
- Reducing CO2 Emissions from Heavy-Duty Vehicles. Available online: https://ec.europa.eu/clima/policies/transport/vehicles/heavy_en (accessed on 20 July 2021).
- Mueller, N.; Strauss, S.; Tumback, S.; Goh, G.C.; Christ, A. Next generation engine start/stop systems: Free-wheeling. SAE Int. J. Engines 2011, 4, 874–887. [Google Scholar] [CrossRef]
- Lijewski, P.; Szymlet, N.; Fuć, P.; Domowicz, A.; Rymaniak, Ł. The effect of start-stop systems on scooter exhaust emissions. Transp. Res. Part D Transp. Environ. 2021, 91, 102684. [Google Scholar] [CrossRef]
- Warguła, Ł.; Krawiec, P.; Waluś, K.J.; Kukla, M. Fuel Consumption Test Results for a Self-Adaptive, Maintenance-Free Wood Chipper Drive Control System. Appl. Sci. 2020, 10, 2727. [Google Scholar] [CrossRef]
- Warguła, Ł.; Kukla, M.; Lijewski, P.; Dobrzyński, M.; Markiewicz, F. Influence of Innovative Woodchipper Speed Control Systems on Exhaust Gas Emissions and Fuel Consumption in Urban Areas. Energies 2020, 13, 3330. [Google Scholar] [CrossRef]
- Savickas, D.; Steponavičius, D.; Domeika, R. Analysis of Telematics Data of Combine Harvesters and Evaluation of Potential to Reduce Environmental Pollution. Atmosphere 2021, 12, 674. [Google Scholar] [CrossRef]
- Zsiga, N.; Ritzmann, J.; Soltic, P. Practical Aspects of Cylinder Deactivation and Reactivation. Energies 2021, 14, 2540. [Google Scholar] [CrossRef]
- Gutarevych, Y.; Mateichyk, V.; Matijošius, J.; Rimkus, A.; Gritsuk, I.; Syrota, O.; Shuba, Y. Improving Fuel Economy of Spark Ignition Engines Applying the Combined Method of Power Regulation. Energies 2020, 13, 1076. [Google Scholar] [CrossRef]
- Fridrichová, K.; Drápal, L.; Vopařil, J.; Dlugoš, J. Overview of the potential and limitations of cylinder deactivation. Renew. Sustain. Energy Rev. 2021, 146, 111196. [Google Scholar] [CrossRef]
- Millo, F.; Mirzaeian, M.; Luisi, S.; Doria, V.; Stroppiana, A. Engine displacement modularity for enhancing automotive si engines efficiency at part load. Fuel 2016, 180, 645–652. [Google Scholar] [CrossRef]
- Said, M.F.M.; Latiff, Z.A.; Abidin, S.F.Z.; Zahari, I. Investigation of Intake Valve Strategy on the Cylinder Deactivation Engine. Appl. Mech. Mater. 2016, 819, 459–465. [Google Scholar] [CrossRef]
- Zhao, J.; Xi, Q.; Wang, S.; Wang, S. Improving the partial-load fuel economy of 4-cylinder SI engines by combining variable valve timing and cylinder-deactivation through double intake manifolds. Appl. Therm. Eng. 2018, 141, 245–256. [Google Scholar] [CrossRef]
- Abas, M.; Martinez-Botas, R. Engine Operational Benefits with Cylinder Deactivation in Malaysian Urban Driving Conditions; Technical Papers; SAE: Evanston, IL, USA, 2015; Volume 2015. [Google Scholar]
- Hu, M.; Chang, S.; Xu, Y.; Liu, L. Study on Valve Strategy of Variable Cylinder Deactivation Based on Electromagnetic Intake Valve Train. Appl. Sci. 2018, 8, 2096. [Google Scholar] [CrossRef]
- Lee, N.; Park, J.; Lee, J.; Park, K.; Choi, M.; Kim, W. Estimation of Fuel Economy Improvement in Gasoline Vehicle Using Cylinder Deactivation. Energies 2018, 11, 3084. [Google Scholar] [CrossRef]
- Wilcutts, M.; Switkes, J.; Shost, M.; Tripathi, A. Design and benefits of dynamic skip fire strategies for cylinder deactivated engines. SAE Int. J. Engines 2013, 6, 278–288. [Google Scholar] [CrossRef]
- Hu, M.; Chang, S.; Liu, L.; Xu, Y.; Xu, J. Design and analysis of skip fire valve strategies based on electromagnetic valve train. Appl. Therm. Eng. 2018, 129, 833–840. [Google Scholar] [CrossRef]
- The EPA Automotive Trends Report. Available online: https://www.epa.gov/automotive-trends/highlights-automotive-trends-report (accessed on 20 July 2021).
- Chen, H.; Shuai, S.J.; Wang, J.X. Study on combustion characteristics and PM emission of diesel engines using ester-ethanol-diesel blended fuels. Proc. Combust. Inst. 2007, 31 II, 2981–2989. [Google Scholar] [CrossRef]
- Ramesh, A.K.; Gosala, D.B.; Allen, C.; Joshi, M.; McCarthy, J., Jr.; Farrell, L.; Koeberlein, E.D.; Shaver, G. Cylinder Deactivation for Increased Engine Efficiency and Aftertreatment Thermal Management in Diesel Engines; Technical Papers; SAE: Evanston, IL, USA, 2018. [Google Scholar] [CrossRef]
- Liu, Y.; Kuznetsov, A.G. An Analysis of the Working Process of a Diesel Engine under Cylinder Deactivation. Proc. High. Educ. Inst. Machine Build. 2019, 9–18. [Google Scholar] [CrossRef]
- Yang, J.; Quan, L.; Yang, Y. Excavator energy-saving efficiency based on diesel engine cylinder deactivation technology. Chin. J. Mech. Eng. 2012, 25, 897–904. [Google Scholar] [CrossRef]
- Zammit, J.P.; McGhee, M.J.; Shayler, P.J.; Pegg, I. The influence of cylinder deactivation on the emissions and fuel economy of a four-cylinder direct-injection diesel engine. Proc. Inst. Mech. Eng. Part D J. Automob. Eng. 2014, 228, 206–217. [Google Scholar] [CrossRef]
- Pillai, S.; Lorusso, J.; Van Benschoten, M. Analytical and Experimental Evaluation of Cylinder Deactivation on a Diesel Engine; Technical Papers; SAE: Evanston, IL, USA, 2015. [Google Scholar] [CrossRef]
- Allen, C.M.; Gosala, D.B.; Shaver, G.M.; McCarthy, J. Comparative study of diesel engine cylinder deactivation transition strategies. Int. J. Engine Res. 2019, 20, 570–580. [Google Scholar] [CrossRef]
- Singh, D.; Gu, F.; Fieldhouse, J.D.; Singh, N.; Singal, S.K. Prediction and analysis of engine friction power of a diesel engine influenced by engine speed, load, and lubricant viscosity. Adv. Tribol. 2014, 2014, 928015. [Google Scholar] [CrossRef]
- Bewsher, S.R.; Turnbull, R.; Mohammadpour, M.; Rahmani, R.; Rahnejat, H.; Offner, G.; Knaus, O. Effect of cylinder de-activation on the tribological performance of compression ring conjunction. Proc. Inst. Mech. Eng. Part J J. Eng. Tribol. 2016, 231, 997–1006. [Google Scholar] [CrossRef]
- Morris, N.; Mohammadpour, M.; Rahmani, R.; Johns-Rahnejat, P.M.; Rahnejat, H.; Dowson, D. Effect of cylinder deactivation on tribological performance of piston compression ring and connecting rod bearing. Tribol. Int. 2018, 120, 243–254. [Google Scholar] [CrossRef]
- Lu, Y.; Liu, C.; Zhang, Y.; Wang, J.; Yao, K.; Du, Y.; Müller, N. Evaluation on the tribological performance of ring/liner system under cylinder deactivation with consideration of cylinder liner deformation and oil supply. PLoS ONE 2018, 13, e0204179. [Google Scholar] [CrossRef] [PubMed]
- Turnbull, R.; Dolatabadi, N.; Rahmani, R.; Rahnejat, H. Energy loss and emissions of engine compression rings with cylinder deactivation. Proc. Inst. Mech. Eng. Part D J. Automob. Eng. 2021, 235, 1930–1943. [Google Scholar] [CrossRef]
- Ding, C.; Roberts, L.; Fain, D.J.; Ramesh, A.K.; Shaver, G.M.; McCarthy, J.; Ruth, M.; Koeberlein, E.; Holloway, E.A.; Nielsen, D. Fuel efficient exhaust thermal management for compression ignition engines during idle via cylinder deactivation and flexible valve actuation. Int. J. Engine Res. 2016, 17, 619–630. [Google Scholar] [CrossRef]
- Mo, H.; Huang, Y.; Mao, X.; Zhuo, B. The effect of cylinder deactivation on the performance of a diesel engine. Proc. Inst. Mech. Eng. Part D J. Automob. Eng. 2013, 228, 199–205. [Google Scholar] [CrossRef]
- Zhou, P.; Zhang, J.; Zhang, Z.; Hao, B.; Lu, Y. Diesel Engine Cylinder Deactivation Experimental Research on Asymmetric Exhaust System. In Proceedings of China SAE Congress 2018: Selected Papers; Springer: Singapore, 2020; pp. 453–465. [Google Scholar]
- Wang, Z.; Kuang, H.; Zhang, J.; Chu, L.; Ji, Y. Nitrogen Oxide Removal by Coal-Based Activated Carbon for a Marine Diesel Engine. Appl. Sci. 2019, 9, 1656. [Google Scholar] [CrossRef]
- Ritzmann, J.; Zsiga, N.; Peterhans, C.; Onder, C. A control strategy for cylinder deactivation. Control Eng. Pract. 2020, 103, 104566. [Google Scholar] [CrossRef]
- Ramesh, A.K.; Shaver, G.M.; Allen, C.M.; Nayyar, S.; Gosala, D.B.; Parra, D.C.; Koeberlein, E.; McCarthy, J., Jr.; Nielsen, D. Utilizing low airflow strategies, including cylinder deactivation, to improve fuel efficiency and aftertreatment thermal management. Int. J. Engine Res. 2017, 18, 1005–1016. [Google Scholar] [CrossRef]
- Vos, K.R.; Shaver, G.M.; Ramesh, A.K.; McCarthy, J. Impact of Cylinder Deactivation and Cylinder Cutout via Flexible Valve Actuation on Fuel Efficient Aftertreatment Thermal Management at Curb Idle. Front. Mech. Eng. 2019, 5, 52. [Google Scholar] [CrossRef]
- Allen, C.M.; Joshi, M.C.; Gosala, D.B.; Shaver, G.M.; Farrell, L.; McCarthy, J. Experimental assessment of diesel engine cylinder deactivation performance during low-load transient operations. Int. J. Engine Res. 2019, 22, 606–615. [Google Scholar] [CrossRef]
- Carlton, J.; Aldwinkle, J.; Anderson, J. Future Ship Power Options: Exploring Alternative Methods of Ship Propulsion; Royal Academy of Engineering: London, UK, 2013; ISBN 9781909327016. [Google Scholar]
- Sharma, A.; Strezov, V. Life cycle environmental and economic impact assessment of alternative transport fuels and power-train technologies. Energy 2017, 133, 1132–1141. [Google Scholar] [CrossRef]
- García-Garre, A.; Gabaldón, A. Analysis, Evaluation and Simulation of Railway Diesel-Electric and Hybrid Units as Distributed Energy Resources. Appl. Sci. 2019, 9, 3605. [Google Scholar] [CrossRef]
- Khan, A.B.M.S.; Clark, N.N.; Thompson, G.J.; Wayne, W.S.; Gautam, M.; Lyon, D.W.; Hawelti, D. Idle emissions from heavy-duty diesel vehicles: Review and recent data. J. Air Waste Manag. Assoc. 2006, 56, 1404–1419. [Google Scholar] [CrossRef]
- Lou, Z.; Zhu, G. Review of Advancement in Variable Valve Actuation of Internal Combustion Engines. Appl. Sci. 2020, 10, 1216. [Google Scholar] [CrossRef]
- Dorofeev, V.M. Locomotive Diesel Engine of D-49 Series. Construction, Maintenance, Repair; Training and Methodological Center for Education in Railway Transport: Moscow, Russia, 2016; ISBN 978-5-89035-908-7. (In Russian) [Google Scholar]
- Kumar, R.; Reader, G.T.; Zheng, M. A Preliminary Study of Ignition Consistency and Heat Release Analysis for a Common-Rail Diesel Engine; Technical Papers; SAE: Evanston, IL, USA, 2004. [Google Scholar] [CrossRef]
- Kamil, M.; Rahman, M.M.; Bakar, R.A. An integrated model for predicting engine friction losses in internal combustion engines. Int. J. Automot. Mech. Eng. 2014, 9, 1695–1708. [Google Scholar] [CrossRef]
- Shi, C.F.; Wang, P.K.; Liu, J.M.; Kang, Q.; Dong, Y. Research of the Frictional Characteristics of Piston Ring-Cylinder Liner Based on GT-Suite. MATEC Web Conf. 2018, 179. [Google Scholar] [CrossRef]
- Irimescu, A.; Di Iorio, S.; Merola, S.S.; Sementa, P.; Vaglieco, B.M. Evaluation of compression ratio and blow-by rates for spark ignition engines based on in-cylinder pressure trace analysis. Energy Convers. Manag. 2018, 162, 98–108. [Google Scholar] [CrossRef]
- Tormos, B.; Martiń, J.; Blanco-Cavero, D.; Jiménez-Reyes, A.J. One-dimensional modeling of mechanical and friction losses distribution in a four-stroke internal combustion engine. J. Tribol. 2020, 142. [Google Scholar] [CrossRef]
- Radulescu, A.; McCarthy, J.; Brownell, S. Development of a Switching Roller Finger Follower for Cylinder Deactivation in Gasoline Engine Applications; Technical Papers; SAE: Evanston, IL, USA, 2013. [Google Scholar] [CrossRef]
- Lee, S.; Kang, J.; Park, S. Measurement and modeling of crank train friction in light-duty diesel engines. J. Mech. Sci. Technol. 2020, 34, 889–903. [Google Scholar] [CrossRef]
- Lamani, V.T.; Yadav, A.K.; Narayanappa, K.G. Influence of low-temperature combustion and dimethyl ether-diesel blends on performance, combustion, and emission characteristics of common rail diesel engine: A CFD study. Environ. Sci. Pollut. Res. 2017, 24, 15500–15509. [Google Scholar] [CrossRef] [PubMed]
- Liu, A.B.; Mather, D.; Reitz, R.D. Modeling the Effects of Drop Drag and Breakup on Fuel Sprays; Technical Papers; SAE: Evanston, IL, USA, 1993. [Google Scholar]
- Dukowicz, J.K. Quasi-Steady Droplet Phase Change in the Presence of Convection; Los Alamos Scientific Lab: Los Alamos, NM, USA, 1979. [Google Scholar]
- Dlouhy, J.; Gauvin, W.H. Evaporation rates in spray drying. Can. J. Chem. Eng. 1960, 38, 113–120. [Google Scholar] [CrossRef]
- Durbin, P.A. Near-wall turbulence closure modeling without “damping functions” . Theor. Comput. Fluid Dyn. 1991, 3. [Google Scholar] [CrossRef]
- Priesching, P.; Ramusch, G.; Ruetz, J.; Tatschl, R. 3D-CFD Modeling of Conventional and Alternative Diesel Combustion and Pollutant Formation—A Validation Study; Technical Papers; SAE: Evanston, IL, USA, 2007. [Google Scholar] [CrossRef]
- Ban, M.; Priesching, P.; Duic, N. N-heptane autoignition tabulation for ECFM-3Z Model. In Proceedings of the CD Proceedings of Third European Combustion Meeting ECM2007, Athens, Greece, 11–13 April 2007. [Google Scholar]
- AVL FIRE. Emission Module User Manual; AVL List GmbH: Graz, Austria, 2018. [Google Scholar]
- Zamboni, G. Influence of Fuel Injection, Turbocharging and EGR Systems Control on Combustion Parameters in an Automotive Diesel Engine. Appl. Sci. 2019, 9, 484. [Google Scholar] [CrossRef]
- Kaminaga, T.; Yamaguchi, K.; Ratnak, S.; Kusaka, J.; Youso, T.; Fujikawa, T.; Yamakawa, M. A Study on Combustion Characteristics of a High Compression Ratio SI Engine with High Pressure Gasoline Injection; Technical Papers; SAE: Evanston, IL, USA, 2019. [Google Scholar] [CrossRef]
- Markov, V.; Kamaltdinov, V.; Zherdev, A.; Furman, V.; Sa, B.; Neverov, V. Study on the Possibility of Improving the Environmental Performance of Diesel Engine Using Carbon Nanotubes as a Petroleum Diesel Fuel Additive. Energies 2019, 12, 4345. [Google Scholar] [CrossRef]
- Verschaeren, R.; Schaepdryver, W.; Serruys, T.; Bastiaen, M.; Vervaeke, L.; Verhelst, S. Experimental study of NOx reduction on a medium speed heavy duty diesel engine by the application of EGR (exhaust gas recirculation) and Miller timing. Energy 2014, 76, 614–621. [Google Scholar] [CrossRef]
- Chen, Z.; Wu, Z.; Liu, J.; Lee, C. Combustion and emissions characteristics of high n-butanol/diesel ratio blend in a heavy-duty diesel engine and EGR impact. Energy Convers. Manag. 2014, 78, 787–795. [Google Scholar] [CrossRef]
- Ratnak, S.; Kusaka, J.; Daisho, Y.; Yoshimura, K.; Nakama, K. Experiments and Simulations of a Lean-Boost Spark Ignition Engine for Thermal Efficiency Improvement. SAE Int. J. Engines 2016, 9, 379–396. [Google Scholar]
- Rimkus, A.; Vipartas, T.; Matijošius, J.; Stravinskas, S.; Kriaučiūnas, D. Study of Indicators of CI Engine Running on Conventional Diesel and Chicken Fat Mixtures Changing EGR. Appl. Sci. 2021, 11, 1411. [Google Scholar] [CrossRef]


| Parameters | Value |
|---|---|
| Engine type | V16 |
| Rated power | 2250 kW |
| Rated speed | 1000 rpm |
| Stoke/Bore | 260 mm/260 mm |
| Compression ratio | 13.5 |
| Total displacement | 220.8 L |
| Valve train | Four valves per cylinder (two intake; two exhaust) |
| Fuel supply system | Direct-acting plunger pump |
| Parameters | Value |
|---|---|
| Initial air pressure | 1.18 bar |
| Initial air temperature | 322 K |
| Cylinder wall temperature | 345 K |
| Cylinder head temperature | 354 K |
| Piston top temperature | 358 K |
| Start and end of injection | −8 °CA/−7.5 °CA |
| The cycle injection mass | 80 mg/cycle |
| Model Constant | Value | |
|---|---|---|
| Dukowicz evaporation model | E1 | 1.2 |
| Wave breakup model | C1 | 0.61 |
| C2 | 15 | |
| ECFM-3Z combustion model | Mixing model constant | 1 |
| Auto ignition parameter | 1 | |
| Engine Load N·m | BSNOx, g/(kW·h) | Relative Error (%) | BSCO, g/(kW·h) | Relative Error (%) | ||
|---|---|---|---|---|---|---|
| Simulation | Experiment | Simulation | Experiment | |||
| 4000 | 12.17 | 12.66 | 3.9 | 4.40 | 4.64 | 5.0 |
| 5940 | 12.60 | 12.91 | 2.4 | 3.60 | 3.80 | 5.3 |
| 8210 | 13.28 | 13.16 | 0.9 | 2.27 | 2.21 | 3.0 |
Publisher’s Note: MDPI stays neutral with regard to jurisdictional claims in published maps and institutional affiliations. |
© 2021 by the authors. Licensee MDPI, Basel, Switzerland. This article is an open access article distributed under the terms and conditions of the Creative Commons Attribution (CC BY) license (https://creativecommons.org/licenses/by/4.0/).
Share and Cite
Liu, Y.; Kuznetsov, A.; Sa, B. Simulation and Analysis of the Impact of Cylinder Deactivation on Fuel Saving and Emissions of a Medium-Speed High-Power Diesel Engine. Appl. Sci. 2021, 11, 7603. https://doi.org/10.3390/app11167603
Liu Y, Kuznetsov A, Sa B. Simulation and Analysis of the Impact of Cylinder Deactivation on Fuel Saving and Emissions of a Medium-Speed High-Power Diesel Engine. Applied Sciences. 2021; 11(16):7603. https://doi.org/10.3390/app11167603
Chicago/Turabian StyleLiu, Ying, Alexandr Kuznetsov, and Bowen Sa. 2021. "Simulation and Analysis of the Impact of Cylinder Deactivation on Fuel Saving and Emissions of a Medium-Speed High-Power Diesel Engine" Applied Sciences 11, no. 16: 7603. https://doi.org/10.3390/app11167603
APA StyleLiu, Y., Kuznetsov, A., & Sa, B. (2021). Simulation and Analysis of the Impact of Cylinder Deactivation on Fuel Saving and Emissions of a Medium-Speed High-Power Diesel Engine. Applied Sciences, 11(16), 7603. https://doi.org/10.3390/app11167603