1. Introduction
Better understanding of the variability in individual driving styles would be especially useful for understanding driver preferences, mechanisms for vehicle control, path planning, and for developing more realistic traffic simulations [
1,
2] to improve road safety and driver’s acceptance of L2–L3 level intelligent vehicles [
3,
4]. Previous studies have shown that drivers with an aggressive style are prone to bad behavior such as rapid acceleration, rapid deceleration, near following, and frequent lane changing in the process of driving. Regulating and warning of such behavior are conducive to promote the driving safety of vehicles [
5]. In addition, drivers have personalized requirements for the advanced driver assistance system (ADAS) due to different driving styles. For example, a personalized adaptive cruise control (PACC) was designed to satisfy the personalized needs of drivers with different driving styles [
6]. Yang et al. [
7] collected various styles of lane changing characteristics and designed a personalized lane change strategy to meet the personalized requirements of lane changing. It is necessary to explore the driving styles and their application.
Figure 1 summarizes the framework of driving style analysis [
8,
9]. Driving style refers to all activities (layers) performed by a driver, including perception, strategic decision, state adjustment, vehicle operation (action), as well as maintaining situation awareness and engaging in secondary tasks. Existing studies have been performed on the above activities. Studies on the perception aspects of driving style focus on visual characteristics before and after lane changes, such as the different focuses in scanning and critical areas [
10]. Studies of the decision aspects of driving style consider time–saving or short–distance routes [
11]. Studies of the state aspects of driving style consider maneuver preferences such as close following, far following, and frequently changing lanes, etc. [
12]. Studies of the operation (action) aspects of driving style include preferences for rapid acceleration, hard braking, etc. [
13].
Previous studies showed that driving style mainly concerns state and operational aspects [
13]. They categorized driving behavior into driving maneuvers (e.g., following, deceleration with respect to a moving target, lane changing, etc.) [
14]. These studies focused on identifying the difference in driving style between categories based on statistical features with respect to multi representation of driving layers, without further consideration of the driving behavior frequency and duration proportion properties. This paper focuses on quantizing driving style and revealing the correlation between driving style and driving behavior.
The key of driving style analysis is to segment the time series driving data into fragments and extract effective indicators to characterize driving behaviors. Usually, the vehicle states and driver actions are recorded in time series data and can be decomposed into fragments to characterize the driving style. Schwarzer et al. [
15] proposed a novel methodology to generate a stochastic driving cycle by segmenting the highly simplified acceleration and deceleration. However, because the synthetic character and numerous driving situations of real driving, such as transition areas from city to country driving, were not considered, it does not reflect actual driving behavior. Higgs and Abbas [
16] developed a two–step algorithm to segment drivers’ behaviors in car–following. Eight predefined variables, longitudinal acceleration, lateral acceleration, yaw rate, vehicle speed, lane offset, yaw angle, range, and range rate, were used to obtain 30 state–action clusters, based on which the car–following model related to the driving style was established. Schockenhoff [
14] and Zähringer [
17] presented a new two–stage segmentation approach. This two–stage classification procedure enables the robust and unambiguous assignment of sequences to the four global driving states, acceleration, deceleration, cruising, and idling with fixed criteria. The result showed that more than 95% of all driving points can be assigned to one of the four global driving states. Taniguchi et al. [
18,
19] proposed the double articulation analyzer with temporal prediction (DAA–TP) model on the basis of the double articulation analyzer (DAA) model. It was applied to the ADAS to predict the driving scene and driving behaviors in the near future. In order obtain the more precise solution for log time series data, Hyunki et al. [
20] proposed a memetic algorithm for multivariate time–series segmentation by calculating the score of a point using regularized covariance. Experiments demonstrated that the proposed method was superior to conventional segmentation methods. Bargi et al. [
21] presented an online timing data segmentation and behavior recognition model using HDP–HMM (hierarchical Dirichlet process–hidden Markov model). The above approaches can decompose time series data effectively. However, they require prior knowledge about the number of states or clusters. Setting prior information artificially may lead to mode overfitting or underfitting. Meanwhile, the residence time distribution of each state is not considered, which may result in an extremely short period of some data fragments.
Although many studies have been carried out to characterize driving styles, most of the current studies use statistical features or the frequency and duration proportion of driving maneuvers separately and in combination to quantify driving styles. In order to obtain better speed performance control, Xu et al. [
22]. collected driving data under different scenarios through a real vehicle platform and divided drivers into three categories (aggressive, moderate, and mild) according to the statistical characteristics of the data (the mean/standard deviation of brake pressure, throttle position, and vehicle speed). Their analysis result showed that the aggressive driver had the highest values for all throttle position indices, while the mild had the least. The hidden Markov model (HMM) has been widely applied to model and predict the driver state and driving behavior; researchers in [
23,
24] applied a hidden Markov model (HMM) to identify the underlying relationship between observations and driver state. To deal with driver behavior uncertainty in driving style recognition, Han et al. [
25] developed a statistical–based recognition method, based on the Bayesian theory, to classify drivers into two groups, i.e., aggressive and normal (typical) using vehicle speed and throttle position. Xue et al. [
26] presented a rapid driving style recognition method in a car following scene based on the trajectory features (acceleration, relative speed, and relative distance). These methods are easy to describe driver characteristics from a statistical perspective. However, under actual traffic conditions, people’s driving behaviors are random, and it is not sufficient to use statistical metrics to describe the driving styles. Considering user comfort, Bellem [
13,
27] classified driving style based on the objective variables (longitudinal acceleration and jerk) selected according to their frequency of occurrence in real traffic. These variables allow the driving style to be classified on a comfort–oriented scale. However, the maximum acceleration or maximum speed was limited during driving behavior construction. Li et al. [
8] presented a method to estimate driving style in highway traffic using the transition probabilities between 12 maneuvers. The result demonstrated that high–risk drivers were more likely to be involved in approaching, near following, and constrained left and right lane changes. The above studies focused on identifying the differences in driving style between groups but did not create a model to quantify individual risk indices.
The driving style plays an important role in improving the safety and the ride comfort of autonomous vehicles although the driving style is difficult to perceive and describe accurately. Decomposing complex driver behaviors into simple, smaller behaviors can facilitate identifying and analyzing driving styles. In this paper, a novel framework to identify driving style with a quantitative method is proposed (
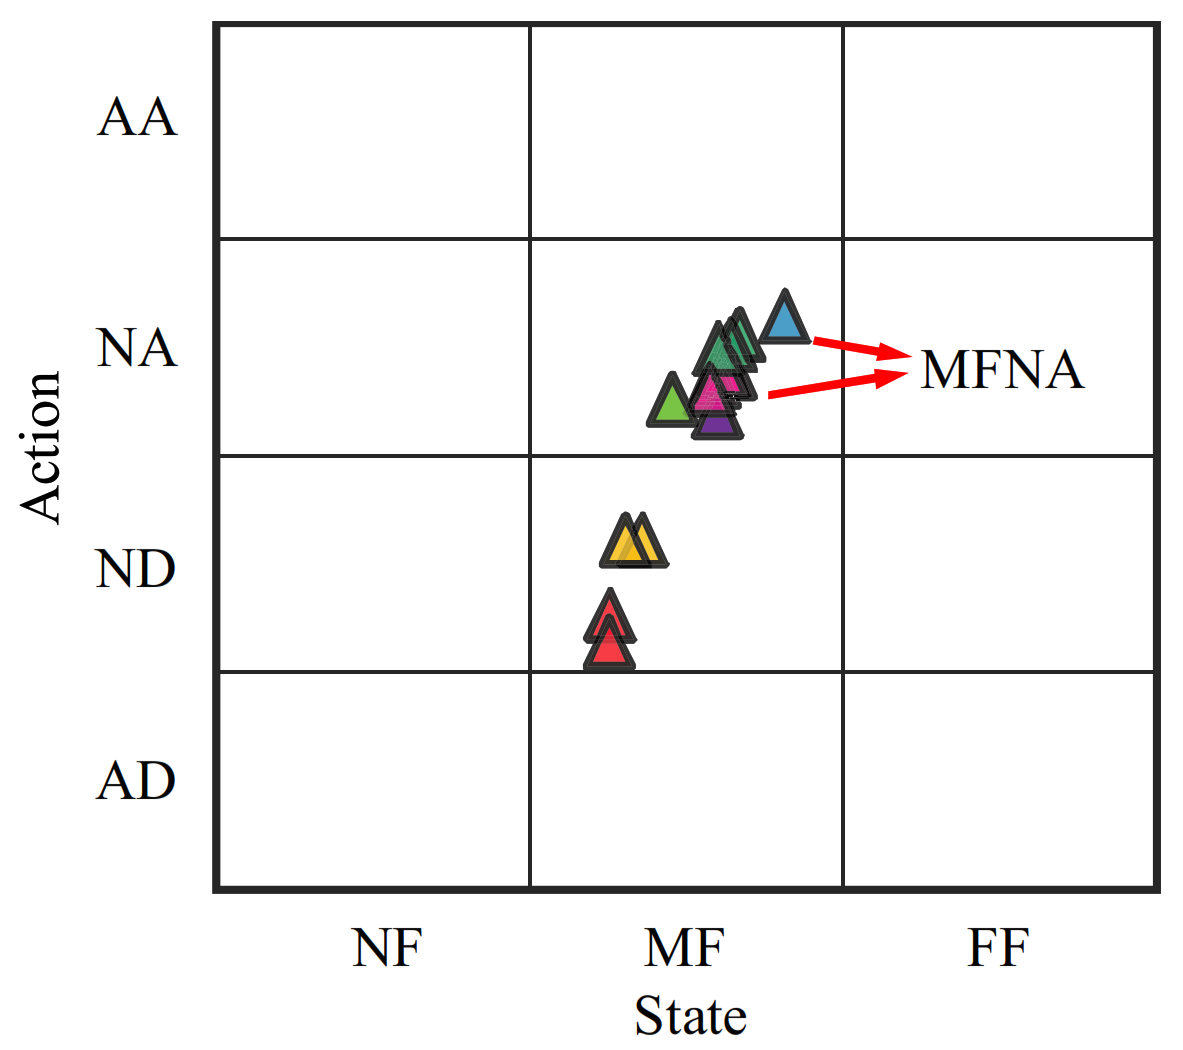
Figure 2). The main contributions of this paper are as follows. (I) the Bayesian nonparametric method, i.e., HDP–HSMM, is innovatively applied to segment the time series driving data. It can decompose the time series driving data into fragment clusters with similar characteristics effectively. (II) The novel State–Action semantic plane is proposed to analyze and quantify the driving style, expressing driving preference simply and intuitively. (III) The transition probabilities are extracted based on the semantic plane to reveal interrelationships among driving behaviors. The transition probabilities are used to improve the identification accuracy of driving styles. The benefit of the proposed method is further verified by a comparison with the conventional statistical feature’s method.
The remainder of this paper is organized as follows:
Section 2 introduces the simulator platform in detail, including the data collection, participants, and data analysis.
Section 3 presents the framework of the driving style and the basic methods.
Section 4 demonstrates the segment results using HDP–HSMM and the State–Action semantic plane.
Section 5 presents the discussion of the results in detail and possible applications. Lastly, the conclusions are summarized in
Section 6.


 ,
, 


