Article

A Numerical Simulation of Blasting Stress Wave Propagation in a Jointed Rock Mass under Initial Stresses

1
Hubei Key Laboratory of Blasting Engineering, Jianghan University, Wuhan 430056, China
2
Hubei (Wuhan) Institute of Explosion Science and Blasting Technology, Jianghan University, Wuhan 430056, China
3
Hubei Key Laboratory of Road-Bridge and Structure Engineering, Wuhan University of Technology, Wuhan 430070, China
*
Author to whom correspondence should be addressed.
Appl. Sci. 2021, 11(17), 7873; https://doi.org/10.3390/app11177873
Submission received: 29 July 2021 / Revised: 23 August 2021 / Accepted: 24 August 2021 / Published: 26 August 2021
(This article belongs to the Special Issue Blast and Impact Engineering on Structures and Materials)

Abstract

:
The initial stresses have a strong effect on the mechanical behavior of underground rock masses, and the initial stressed rock masses are usually under strong dynamic disturbances such as blasting and earthquakes. The influence mechanism of a blasting excavation on underground rock masses can be revealed by studying the propagation of stress waves in them. In this paper, the improved Mohr-Coulomb elasto-plastic constitutive model of the intact rock considering the initial damage was first established and numerically implemented in Universal Distinct Element Code (UDEC) based on the variation of the experimental stress wave velocity in the initial stressed intact rock, and the feasibility of combining the established rock constitutive model and the BB (Bandis-Barton) model which characterizes the nonlinear deformation of the joints to simulate stress waves across jointed rock masses under initial stress was validated by comparing the numerical and model test results subsequently. Finally, further parameter studies were carried out through the UDEC to investigate the effect of the initial stress, angle, and number of joints on the transmission of the blasting stress wave in the jointed rock mass. The results showed that the initial stress significantly changed the propagation of the stress waves in the jointed rock mass. When the initial stress was small, the transmission coefficients of the stress waves in the jointed rock were vulnerable to be influenced by the variation of the angle and the number of joints, while the effect of the angle and the number of joints on the stress wave propagation gradually weakened as the initial stress increased.

1. Introduction

Underground rock masses are inevitably in a certain geological and tectonic environment, and are subject to initial stresses such as gravitational stress, tectonic stress, temperature stress, etc. The initial stresses have a strong effect on the mechanical behavior of the underground rock masses and the stability of the underground engineering [1,2,3]. Meanwhile, the drill-and-blast method is the most widely used technique for tunnel excavation and underground mining. In this process, the initial stressed underground rock masses are under strong dynamic disturbances, and the underground structure can be damaged by the stress waves generated during the excavation process. Hence, it is of great practical significance to study the propagation of stress waves in underground rock masses under initial stress for the optimal design of underground rock mass blasting excavation parameters and the dynamic stability analysis of underground engineering.
Rock masses contain various types of discontinuous interfaces such as joints and fractures and so on, which have a noticeable effect on the mechanical response of the rock mass [4,5]. Discontinuous interfaces in natural rock mass are usually distributed in groups, such as a stratified rock mass, and it is particularly important to study the propagation of blasting stress waves in the layered rock mass and to monitor the vibrations generated during the blasting of the stratified rock masses [6]. Intensive studies have been conducted to investigate the propagation of stress waves across jointed rock masses via various theoretical and experimental methods. In terms of theoretical research, the displacement discontinuity model (DDM) proposed by Schoenberg [7] has been widely applied to study stress wave propagation through a jointed rock mass [8,9]. The DDM was also combined with other analysis methods, e.g., the method of characteristics (MC) [10], the scattering matrix method [11], and the time-domain recursive method (TDRM) [12] to study the stress waves passing through linear and nonlinear joints [13,14], one single joint and a set of parallel joints [15,16], and even intersecting rock joints [17]. By experimental means to date, the split Hopkinson pressure bar (SHPB) apparatus has been mainly used to study stress wave propagation across rock masses [18,19].
In contrast, the numerical simulation method is an economical and feasible alternative to survey the stress wave propagation across a jointed rock mass. Based on the discrete element method (DEM) proposed by Cundall [20], the universal distinct element code (UDEC) has been widely used to calculate the propagation problems of stress waves in a jointed rock mass [21,22,23]. Furthermore, other numerical methods and software have been adopted to solve the problems involving the stress wave propagation in a rock mass, e.g., the particle manifold method (PMM) [24,25], the numerical manifold method (NMM) [26,27], the particle flow code (PFC) [28,29], and the three-dimensional element code (3DEC) [30]. However, the above theoretical, experimental, and numerical methods have mainly focused on the effect of the parameters of the joints, e.g., joint stiffness, joint spacing, joint number, and the parameters of the stress wave, e.g., waveform, amplitude, frequency, and the incident angle of stress wave on the stress wave propagation pattern, and have proposed that the attenuation of the stress wave only occurs at the joints, while it has been assumed that the intact rock is elastic. Few works have been conducted that investigate the effect of initial stresses on the stress wave propagation in the jointed rock mass, and studies considering the initial damage of intact rocks in the rock mass under initial stresses are much rarer.
On the other hand, besides discontinuous interfaces, intact rocks are the other part of the rock mass. Due to their long geological age and various complex tectonic effects, intact rocks inevitably contain a certain number of defects such as microcracks and micropores; therefore, intact rock can be considered as an initial damaged medium [31,32,33]. Considerable studies have revealed that in the process of static loading, the microcracks in the intact rock experience the stages of closure, development, extension, and interactive penetration [34,35,36], and the wave impedance of intact rocks is strongly affected by the initial stress given the stress sensitivity of the wave velocity and density. Consequently, microcracks within the intact rock enter different evolution stages under different initial stresses, leading to changes in wave impedance, which in turn have an influence on the stress wave propagation.
The variation in the quantity of microcracks inside the intact rock under initial stress causes changes in the macroscopic mechanical properties of the rocks, which is usually named initial damage [37,38]. In the progressive destruction process of rocks under static loading, the closure effect of the microcracks at the initial loading stage can significantly affect the deformation characteristics of rocks, and the current research on the damage of intact rocks has rarely considered the compaction stage of the initial void. For a porous medium with natural defects such as rocks, when the porosity of rocks is high, the compaction stage of the initial microcracks is even more non-negligible. However, related research has been rarely reported.
This paper presents a numerical exploration of blasting stress wave propagation in the initial stressed jointed rock mass. Firstly, based on the variation of the stress wave velocity in the intact rock under different equal biaxial static loading in the model test, the initial damage variable was determined, and the Mohr-Coulomb elasto-plastic constitutive model of the rock considering initial damage was established and subsequently implemented in the UDEC. Then, the feasibility of combining the developed model and the BB (Bandis-Barton) model which characterizes the nonlinear deformation of the joints to simulate stress waves across the jointed rock mass under initial stress was validated by comparing the numerical results with the model test results. Finally, further parameter studies were carried out through the UDEC to investigate the effect of the initial stress, angle, and number of joints on the transmission of blasting stress waves in the jointed rock mass.

2. A Brief Introduction of the Model Test

The detailed model test process is referred to in another two papers [39,40], and is only briefly described in this paper, as follows:
(1)
For the instrument providing the biaxial static loads in the model test, the corresponding size of the specimen was 1.6 m (length) × 1.3 m (height) × 0.4 m (thickness), as shown in Figure 1.
(2)
The prototype of the model test was the deep-buried underground engineering surrounding rock, and the physical and mechanical parameters of the prototype are shown in Table 1. The corresponding intact rock simulation material was low strength cement mortar containing cement, sand, water, and a plasticizer. Meanwhile, the stress similarity coefficient Cσ between the prototype and simulation material was 20. Through a series of tests, the mechanical parameters of the cement mortar material were obtained and are shown in Table 1. In addition, the joints in the model test samples were simulated by the mica plates, and their normal and tangential stiffnesses were 12 GPa/m and 7.53 GPa/m, respectively, and were obtained through laboratory tests.
(3)
According to the number and the angle of the joints, a total of three model test samples were made, named T1, T2, and T3 respectively, as shown in Figure 2. Due to the structural characteristics of the cylindrical charge, two test sections were uniformly arranged along the thickness direction in each model test sample. Four measuring lines were arranged on each section to measure the stress and strain at different distances from the explosion source. Sixteen strain measuring points were arranged on the strain testing section, ranging from 1 to 16, and eight stress measuring points were arranged on the stress testing section, ranging from 17 to 24.
(4)
The T1 and T2 samples were designed to study the propagation of the blasting stress waves in intact rock, and the normal or oblique impact of the blasting stress wave on the rock mass containing joints with a different number and angle, and the corresponding research objects of the T1 and T2 test samples were intact rock and single-joint and double-joints rock masses of 30°, 60°, and 90°, respectively. Meanwhile, the T3 sample was designed to study the propagation of the blasting stress waves in intact rock and the normal jointed rock mass. According to the number of joints in the four measuring lines, the corresponding research objects were intact rock, 90° single-joint rock mass, 90° double-joints rock mass, and 90° three-joints rock mass.
(5)
In the model test, detonating cords with a total length of 1.6 m and TNT (Trinitrotoluene) with an equivalence of 17.6 g were used as the explosive sources to generate the blasting stress wave, and the detonating cords were fixed in the seamless steel pipe in the center of the test samples through the wooden centering stent. Subsequently, the quick-drying materials were poured into the pipes as the loading core in the samples, as shown in Figure 3. At the same time, seamless steel tubes were arranged to reduce the damage of the blasting loads, and repeated dynamic loading was realized by replacing the crushed quick-drying materials in the seamless steel tubes. In the model test, the vertical static load PV and horizontal static load PH applied on the model specimens were equal and were 0, 0.75 MPa, 1.5 MPa, and 3 MPa, respectively, and the corresponding initial in situ stresses were 0, 15 MPa, 30 MPa, and 60 MPa, respectively.

3. Establishment of the Mohr-Coulomb Elasto-Plastic Constitutive Model of the Rock Considering Initial Damage

Under different initial static loads, the microcracks in rocks enter different stages of evolution, so the physical and mechanical properties of rocks change correspondingly, leading to different propagation laws of stress waves in the rocks. Therefore, it is necessary to establish a constitutive model that can consider the initial damage of rocks caused by initial static stresses. Based on this, the influence of the change of initial stress on the propagation law of stress waves in rocks can be considered in a numerical simulation.
In the model test, the initial stresses applied on the test samples were the biaxial static loads, but in the test process, only the uniaxial compressive strength Rc of the rock simulation material was obtained as 5.864 MPa. Intensive studies have shown that the biaxial compressive strength Rbc of brittle materials such as rock and concrete was improved compared with the uniaxial compressive strength. The ratio of the biaxial compressive strength Rbc to the uniaxial compressive strength Rc of the brittle materials as β was defined by Papanikolaou et al. [41] and Huang [42], and through considerable test data, the fitting formula of β changing with the uniaxial compressive strength was obtained as the followed equation:
β = 1.493 R c 0.0634
The above equation shows that the relationship between β and the uniaxial strength Rc of the rock meets a negative exponential relationship, and β decreases with the increase in the uniaxial strength Rc, indicating that the difference between the biaxial strength Rbc and the uniaxial strength Rc of the rock gradually decreases with the increase in the uniaxial strength Rc, and β is greater than 1 in the conventional uniaxial strength range of the rock. Substituting the uniaxial compressive strength Rc of the rock simulation material into Equation (1), the biaxial compressive strength Rbc of the rock simulation material can be obtained as 7.826 MPa.
The propagation velocity in the material is an important part of the propagation characteristics of stress waves, which can reflect the evolution of microcracks and the damage degree of the medium [43]. Based on this, to study the initial damage evolution of the intact rock under different static loads, the stress wave velocities of the intact rock in each model test sample under different biaxial static loads were calculated, and the initial damage variation of the intact rock was obtained through the change in the wave velocities. Specifically, the stress wave propagation velocity can be calculated by the arrival time difference in the stress wave recorded by the sensors arranged in the intact rock at different distances from the explosion source. In the three model test samples, the number of strain sensors in the intact rock area was more than that of the stress sensors, and the range of the strain sensors was also larger. Therefore, the strain time history curves recorded at the strain measuring points at different distances from the explosion source were used to calculate the stress wave velocity through the arrival time difference of the waves.
In each model test sample under different biaxial static loads, based on the time difference Δt corresponding to the jumping point in the time history curves of strain measuring points 13 and 16 in the intact rock, and the distance between the two measuring points Δl, the value of the stress wave velocity c of the intact rock can be calculated by the following equation:
c = Δ l Δ t
Through the above equation, the average propagation velocities of stress waves in the intact rock section of each model test sample under different biaxial static loads were calculated, which were 1990 m/s, 2077 m/s, 2099 m/s, and 1898 m/s when the static loads were 0, 0.75 MPa, 1.5 MPa, and 3 MPa. The reason for this phenomenon was that when the static load was small, the initial microcracks in the intact rock started to close with the growth of the static load, resulting in the increase in the wave velocity with the elastic modulus. When the static load was raised to a critical value, the initial microcracks in the intact rock were completely closed, and when the static load continued to rise, new microcracks were initiated, resulting in the decrease in the wave velocity, and this critical value of the static load can be obtained by a subsequent analysis. Meanwhile, it can be seen that when the static load was 0 MPa, the average stress wave velocity in the intact rock was about 1990 m/s. Meanwhile, the ultrasonic wave velocity of the intact rock, similar to the material measured in the model test, was 1980 m/s. The results showed that when the amplitude of the stress wave was not large enough, its propagation speed in the rocks was about the same as that of an elastic wave, which is consistent with the conclusion that when the stress wave amplitude is small under the combined action of dynamic and static, the initial damage to the rock is mainly caused by the application of the static load [40].
To derive the variation law of stress wave velocities in the rocks under biaxial static loading, the average stress wave velocities in the intact rock under different static loads were plotted, as seen in Figure 4. It should be noted that for the subsequent initial damage analysis, the stress wave velocity in the intact rock was assumed to drop to zero when the biaxial static load reached the biaxial compressive strength of 7.826 MPa.
From the above Figure 4, it can be seen that the stress wave velocity in the intact rock increased and then decreased with the increase in the static load, which was also similar to the variation law of the physical attenuation of stress waves in the intact rock with the biaxial static load derived from the model test results, reflecting the stress sensitivity of the evolution of the microcracks in rocks. Numerous studies have shown that there is a close connection between the wave velocity and the intrinsic damage of a medium, so the damage evolution of the propagation medium can be described by the change of wave velocity. Combining the fitted static load versus the stress wave velocity curve in Figure 4, the maximum wave velocity of the intact rock was 2109 m/s, and the corresponding biaxial static load was 1.23 MPa, which was about 15.7% of the biaxial compressive strength, indicating that the microcracks inside the rocks were in the fully compacted stage at this static load level. Meanwhile, the new microcracks had not yet started to initiate.
The maximum wave velocity v0 was defined as the wave velocity of the undamaged rock, so the initial damage variable D0 of the rock can be defined by the following equation, when the value of D0 is 0 and 1, respectively, indicating that the rocks are in an undamaged and fully damaged stage.
D 0 = 1 ( v 1 v 0 ) 2
where, v1 is the stress wave velocity under different static loads. Therefore, through Figure 4, the initial damage variable D0 variation curve of the rock under different biaxial static loads can be derived, as shown in Figure 5, while the initial damage value of the rock was considered to be 1 when the biaxial static load reached the biaxial compressive strength.
Based on the five data samples in Figure 5, including four experimental data points and one data point that characterized the failure of the intact rock obtained by mechanical analysis, the fitting equation was obtained by the least square polynomial fitting as shown in Equation (4), and the adjusted R-square and residual sum of squares of the equation were 0.994 and 1.034 × 10⁻⁴, respectively.
            D 0 = 0.11253 0.18321 σ b + 0.08918 σ b 2 0.00655 σ b 3
The above equation is the initial damage evolution equation considering the compaction effect of the microcracks inside the rocks under different biaxial static loads. In addition, since the object studied in this section is the intact rock without macroscopic fractures, the initial damage evolution within the rocks can be assumed to be isotropic.
After the evolution equation of the initial damage variable D0 was determined, it was coupled with the internal Mohr-Coulomb elasto-plastic model in UDEC to establish the improved model considering the initial damage for the intact rock. Based on the Lemaite strain equivalence principle, the principal stress tensor σ i and the effective principal stress tensor σ ˜ i , the bulk modulus K and the initial damage bulk modulus K ¯ , the shear modulus G , and the initial damage shear modulus G ¯ should satisfy the following relationships:
{ σ ˜ i = σ i / ( 1 D 0 ) K ¯ = ( 1 D 0 ) K G ¯ = ( 1 D 0 ) G
After the bulk modulus K ¯ and the shear modulus G ¯ containing the initial damage factor D0 were obtained, the relationship between the stress increment Δ σ i and the strain increment Δ ε i in the Mohr-Coulomb elastic-plastic model of the rocks was given by:
Δ σ i = λ ¯ δ i Δ ε i + 2 G ¯ Δ ε i
where, λ ¯ is the Lame constant of the damaged rock and δ i is the Kronecker symbol. Meanwhile, both the rock yield damage function and the plastic flow law within the Mohr-Coulomb elasto-plastic constitutive model were changed to functions based on the effective principal stress tensor σ ˜ i , and the Mohr-Coulomb elasto-plastic constitutive model considering the initial damage was established. Based on the internal Fish language in UDEC, the relevant parameters in the calculation process of the constitutive model were modified through the custom functions and variables to establish the user-defined constitutive model, and the calculation procedure of the established Mohr-Coulomb elasto-plastic constitutive model considering the initial damage is shown in Figure 6.
Combined with Figure 6, the detailed calculation process was as follows: The initial damage variable D0 was first calculated based on the biaxial static load σb of the numerical model using Equation (4), and the physical and mechanical parameters of the rock considering the initial damage such as K ¯ and G ¯ , as well as the total strain increment Δ ε i of the element under the initial static load were derived. Then, based on the Lemaite strain equivalence principle and combined with the initial damage variable D0, the effective principal stress increment Δ σ ˜ i was derived by Equation (6), and finally the effective principal stress σ ˜ i of the element was obtained by an iterative calculation.
When the effective principal stress σ ˜ i of the element reached the yield condition and entered the plastic phase, the updated stress state of the element was obtained by the plastic flow law, and the above process was divided into two cases: The first case was when h ( σ ˜ 1 , σ ˜ 3 ) 0 , the shear failure occurred in the element, through the shear yield function f s expressed by the effective principal stress and the shear plastic flow method, the new effective principal stress increment Δ σ ˜ i was calculated by the total strain increment Δ ε i , and finally the effective principal stress σ ˜ i N of the element was obtained. The other was when h ( σ ˜ 1 , σ ˜ 3 ) 0 , the element underwent tensile damage, and the new effective principal stress σ ˜ i N of the element was calculated by the tensile yield function f t and the tensile plastic flow law according to the same steps of the first case.
It is worth noting that the established rock constitutive model was based on the model test results and the damage mechanics theory, which can take into account the initial damage of intact rock under different biaxial equal static loads. For an underground rock mass with caverns, blast holes, and stress relief holes, numerical modeling can be carried out based on the established model as long as the initial boundary static load condition can be simplified to biaxial equal static loading.

4. Verification of the Established Rock Constitutive Model

In order to verify the accuracy of the established rock constitutive model based on this model and the widely adopted BB (Bandis-Barton) model which describes the nonlinear deformation characteristics of the joints [4], the model tests were numerically reproduced by the UDEC, and the experimental and numerical results were compared to analyze and verify the feasibility of the established rock constitutive model.

4.1. Numerical Model and Calculation Procedure

According to the three test samples designed in the model test as shown in Figure 2, the corresponding discrete element numerical models based on UDEC were established as shown in Figure 7. The dimensions of the numerical models were identical to the model test samples, whose length and width were 1600 mm and 1300 mm, respectively, while the lengths and spatial locations of the joints in the different numerical models were consistent with the model test samples. Due to the high mechanical strength of the seamless steel pipe, its deformation under static loads was approximately negligible, so it was not necessary to consider the quick-drying material inside the seamless steel pipe in the numerical model. The interior of the steel pipe was blank and the equivalent blast loads were applied directly to the inner wall of the steel pipes.
After meshing, the established numerical models all contained intact rock, joint, and seamless steel pipe elements, and the number of degrees of freedom of the element was 3, including the translation in the x and y directions, and the rotation in the x-y plane. According to the statistics, the number of seamless steel pipe elements in the T1, T2, and T3 test blocks was 40, while the number of intact rock and joint elements were 25,510 and 84, 36,752 and 178, and 32,536 and 148, respectively. The static loading and constraints of the numerical models were the same as that of the model test samples. The fixed constraint was applied at the lower end of the model, and the uniformly distributed load was applied on the other three sides. The magnitude of the static loads applied on the numerical models was the same as the biaxial static loads in the model test. In reference to the physical and mechanical parameters of the rock and the joint simulated materials in the model test, the corresponding mechanical parameters of the rock, joint, and seamless steel pipe in the numerical simulation are shown in Table 2.
Only the elastic modulus and Poisson’s ratio of the simulated rock material were derived in the model tests, while the mechanical parameters used in the established rock constitutive model were the bulk modulus K and shear modulus G , which can be converted by the following equation.
{ K = E 3 ( 1 2 μ ) G = E 2 ( 1 + μ )
In the numerical model, the developed Mohr-Coulomb elasto-plastic constitutive model considering the initial damage was used to simulate the intact rock. According to the results of the model test, the nonlinear BB model could express the mechanical response of the joints under dynamic loading in the presence of the initial static loading, so the joints were simulated in the numerical simulation using the BB model in UDEC. Meanwhile, the strength of the seamless steel pipe was relatively higher compared to the rock and joints simulation materials as seen in Table 2, so the linear elastic model in UDEC was chosen for the simulation. The detailed numerical calculation process was as follows:
(1)
The initial static loads were first applied on the numerical model, where the applied static loads in the horizontal and vertical directions were of equal magnitude. To compensate for the insufficient static load conditions in the model test and considering the biaxial compressive strength of the rock material of 7.826 MPa, the number of static load conditions was increased in the numerical simulation, and there were 11 different static load conditions, namely 0, 0.75 MPa, 1.5 MPa, 2.25 MPa, 3 MPa, 3.75 MPa, 4.5 MPa, 5.25 MPa, 6 MPa, 6.75 MPa, and 7.5 MPa.
(2)
After the static loads were applied, an equivalent blast load curve was applied to the inner wall of the seamless steel tubes in the numerical model. The equivalent blast load was determined as follows: In the T3 test sample, an additional stress sensor was arranged in the quick-drying material inside the seamless steel pipe, and the sensor was arranged close to the inner wall of the steel pipe to record the time history curve of the blasting load generated during the detonation of the detonating cords. The measured blasting load is shown in Figure 8a below. Figure 8a shows that the measured blast load curve was roughly triangular, with a peak value of 47.59 MPa, a duration of 0.24 ms, and a rise time of about 0.11 ms. After the measured blast load curve was derived, it was applied to the inner wall of the steel pipe as shown in Figure 8b below. The totally computational time of the T1, T2, and T3 numerical models was 327 s, 539 s, and 473 s, respectively.

4.2. Comparison of the Numerical and Model Test Results

In order for a comparison with the model test results, the nodes near the stress measurement points in the corresponding model test samples were selected in each numerical model, and the radial stress time history curves at this point were obtained under the combined effect of different biaxial pressures and blasting loads. The waveforms of the measured and numerical stress time history curves at the same locations in different model test samples were firstly compared, and the measured and numerical stress time curves of the stress measurement points 17 and 18 in the T1, T2, and T3 test samples were selected under the biaxial pressure conditions of 0, 0.75 MPa, 1.5 MPa, and 3 MPa in both the model tests and numerical simulations as shown in Figure 9.
As seen in Figure 9, the measured and numerical stress wave curves recorded at P17 and P18 stress measurement points in each model test sample under different biaxial pressures were relatively similar in form and amplitude, and the stress wave amplitude decreased as the biaxial pressure increased. The above phenomena demonstrate the feasibility and accuracy of the numerical calculations based on a combination of the BB model describing the nonlinearity of the joints and the established Mohr-Coulomb elasto-plastic rock constitutive model considering the initial damage.
In order to verify the rationality of the established rock constitutive model from the perspective of stress wave propagation, the stress wave transmission coefficients of the jointed rock masses contained in each numerical model under different biaxial pressures were used for comparing the numerical and experimental results, as shown in Figure 10. It should be noted that the stress wave transmission coefficients of rock masses with a different number and angle joints in the model test were determined by the incident wave and the transmitted wave collected by the stress sensors arranged before and after the rock masses, which was the ratio of the amplitude of the transmitted stress wave to the incident wave. For example, for the T1, T2, and T3 test samples in Figure 2, the amplitude ratios of the stress wave recorded by the stress measuring points 22 and 21 were the stress wave transmission coefficients of the 90° single-joint rock mass, the 90° double-joints rock mass, and the 90° three-joints rock mass, respectively. In the numerical modeling, the nodes corresponding to the stress measuring points in the model test samples were selected in the numerical model to determine the incident and transmitted stress wave of the rock mass, and the numerical transmission coefficients were obtained. Meanwhile, the applied confining pressures in the model tests were 0, 0.75 MPa, 1.5 MPa, and 3 MPa, respectively, but the range of confining pressures was increased in the numerical calculations, which were from 0 to 7.5 MPa, with an interval of 0.75 MPa, for a total 11 different confining pressures. For a comparative analysis, the numerical results were expressed as smoothed curves of numerical transmission coefficients under different biaxial loads.
Figure 10 shows that the measured and numerical transmission coefficients of the jointed rock mass contained in each numerical model under different static loads were relatively close to each other, and when the static load increased from 0, the measured and numerical transmission coefficients both showed a trend of increasing first and then decreasing. Based on the numerical simulation results in Figure 10, the stress wave transmission coefficient of the jointed rock mass containing different angles and numbers reached its maximum value when the static load was about 2.2 MPa, which was about 28.1% of the biaxial compressive strength.
It can also be seen in Figure 10 that the measured and numerical transmission coefficients of the jointed rock masses within different numerical models were relatively close in the ascending part of the curve, while a certain deviation occurred in the descending part. The reason was that in the model test when the static load increased to 3 MPa, which was about 38.3% of the biaxial compressive strength, the closed microcracks within the intact rock started to expand, and new microcracks were initiated, resulting in a decrease in the transmission coefficient [40]. However, in the numerical calculation, the expansion of the microcracks within the intact rock was not considered, which led to the larger numerical results.

5. Numerical Calculation of the Effect of the Angle and the Number of Joints on the Stress Wave Propagation

The last section obtained a high agreement between the numerical and experimental results, which verified the accuracy of the established rock constitutive model considering the initial damage and the feasibility of the adopted numerical simulation method. Due to the limited angle and number of joints set in the model test, a numerical calculation of the stress wave propagation in rock masses with various angles and numbers of joints under different biaxial static loads was carried out based on the same numerical simulation method in Section 4 for a more thorough study of the effect of the angle and number of joints on the stress wave propagation. The physical and mechanical parameters of the rocks and joints in the numerical calculations are shown in Table 2.

5.1. Effect of the Angle of Joints

The angles of the joints selected in the model tests were 30°, 60°, and 90°, while the selection range of the joint angles was expanded in the numerical calculations, with nine different joint angles selected ranging from 10° to 90° and with an interval of 10°. In order to eliminate the effect of the number of joints, only one single joint was selected for the study, and appropriate simplifications were made on the basis of the single-joint model test sample T1.
According to the symmetry of the model test sample, the numerical model was developed as shown in Figure 11 with the size of 800 mm (length) × 1300 mm (width), and a penetration joint was contained in the numerical model. A fixed restraint was applied at the bottom of the numerical model, and biaxial static loads were applied to the remaining three outlines. During the numerical calculation, the applied biaxial static loads were the same as in Section 3, from 0 to 7.5 MPa for total eleven conditions, and the applied blast stress wave load P(t) is shown in Figure 8a.
According to the actual positions of the stress measurement points P17 and P18 arranged before and after the joint in the single-joint model test sample T1, nodes A and B near the same position before and after the joint were selected in the numerical model as shown in Figure 11, and the stress wave transmission coefficients were calculated from the stress wave amplitudes recorded by the measurement points A and B in the numerical model. The variation of the stress wave transmission coefficient with the angle of the joint under different biaxial static loads was compiled and is shown in Figure 12 below.
As seen in Figure 12, the transmission coefficient increased and then decreased with the increase in the joint angle when the circumferential pressure was 0. The transmission coefficient was at a maximum when the joint angle was close to 30° and decreased with the increase in the joint angle when the joint angle was greater than 30°, which was also consistent with the measured results [40]. The transmission coefficient increased, then slightly decreased, and finally increased with the increase in the joint angle at the biaxial static load of 0.75 MPa and 1.5 MPa and showed an overall trend of increasing. When the biaxial static load was greater than 2.25 MPa, the transmission coefficient decreased and then increased with the increase in the joint angle, and the transmission coefficient was the smallest when the joint angle was about 40°. In addition, it can be seen from Figure 12 that the overall transmission coefficient of rock masses containing one single joint with different angles showed a pattern of increasing and then decreasing with the increase in the biaxial static load, which was also consistent with the results shown in Figure 10.

5.2. Effect of the Number of Joints

In order to investigate the effect of the number of joints on the transmission coefficient of stress waves under different biaxial static loads, numerical calculations were conducted on the cases of jointed rock masses with vertical incidence (i.e., the angle of joints was 90°) and oblique incidence (the angle of joints was 60°) of stress waves propagation. Based on this, the numerical models of rock masses containing a different number of 90° and 60° joints were established. In the numerical calculation, six different number of joints were selected, which were 1, 2, 3, 5, 7, and 9, respectively. At the same time, according to the joint spacing in the three-joints test sample T3 in the model test, the joint spacing selected in the numerical model was also 50 mm. According to the number of joints, the size of the numerical model established was 1300 mm (length) × 1300 mm (width), and the numerical models including five joints with angles of 90° and 60° are shown in Figure 13.
The applied biaxial static loads in the numerical simulation were somewhat different from those in Section 4.1, which were 0 MPa, 0.75 MPa, 1.5 MPa, 2.25 MPa, 4.5 MPa, and 6.75 MPa, for a total of six conditions, while the applied stress wave load P(t) remained the same as in Section 4.1. To eliminate the effects of the geometric and physical attenuation of the stress waves, the selected measurement points in the numerical model were node A located on the measurement line near the left side of the first joint and node B located on the measurement line near the right side of the ninth joint when the number of joints was nine, as shown in Figure 13 above, which was slightly different from the arrangement of the measurement points in the T2 test sample in the model test. The variation of the transmission coefficient with the number of joints for vertical and oblique incidence of stress waves under different biaxial static loads was sorted out as shown in Figure 14.
As can be seen from Figure 14 above, the transmission coefficients of both the 90° and 60° joint rock masses showed a decreasing trend with an increase in the number of joints under the same static load, and the decreasing increment gradually became smaller, especially after the number of joints reached a certain number (more than five), the attenuation effect of the increase in the number of joints on the stress wave propagation gradually weakened.
At the same time, the reduction in the transmission coefficient for the 90° joint rock mass was 70.5%, 47.1%, 34.2%, 32.6%, 29.1%, and 26.8% when the number of joints was increased from 1 to 9 with biaxial static loads of 0 MPa, 0.75 MPa, 1.5 MPa, 2.25 MPa, 4.5 MPa, and 6.75 MPa, respectively, and the corresponding reduction in the transmission coefficient for the 60° joint rock mass was 36.3%, 34.4%, 31.7%, 30.0%, 25.7%, and 22.6%, respectively. The above results showed that when the static load was small, such as 0 MPa and 1.5 MPa, the decrease in the transmission coefficient of the 90° jointed rock masses caused by increasing the number of joints was significantly larger than that of the 60° jointed rock masses, and the larger the static load was, the smaller the decrease in the stress waves transmission coefficient caused by increasing the number of joints for both 90° and 60° jointed rock masses, indicating that the attenuation effect of the number of joints on stress wave propagation became weaker as the static load increased.

6. Conclusions

In this paper, the variation of the initial damage variable was firstly determined based on the change in the stress wave velocity in the intact rock under different equal biaxial static loads in the model test, and the Mohr-Coulomb elasto-plastic constitutive model of the rock considering initial damage was established by combining the Mohr-Coulomb strength criterion. The developed rock constitutive model was then numerically implemented using the Fish language in discrete element software UDEC, and the model tests were numerically reproduced in conjunction with the BB model characterizing the nonlinear deformation properties of the joints. Finally, further numerical studies on the effects of the biaxial static load, the angle, and the number of joints on the propagation of stress waves in the jointed rock mass were carried out, and the following conclusions were drawn.
(1)
The numerical and experimental results of the propagation law of stress waves in the jointed rock masses under different biaxial static loads were compared and analyzed from the perspectives of the waveform, amplitude, and the transmission coefficient of stress waves, which were relatively consistent, verifying the feasible of the adopted numerical calculation method.
(2)
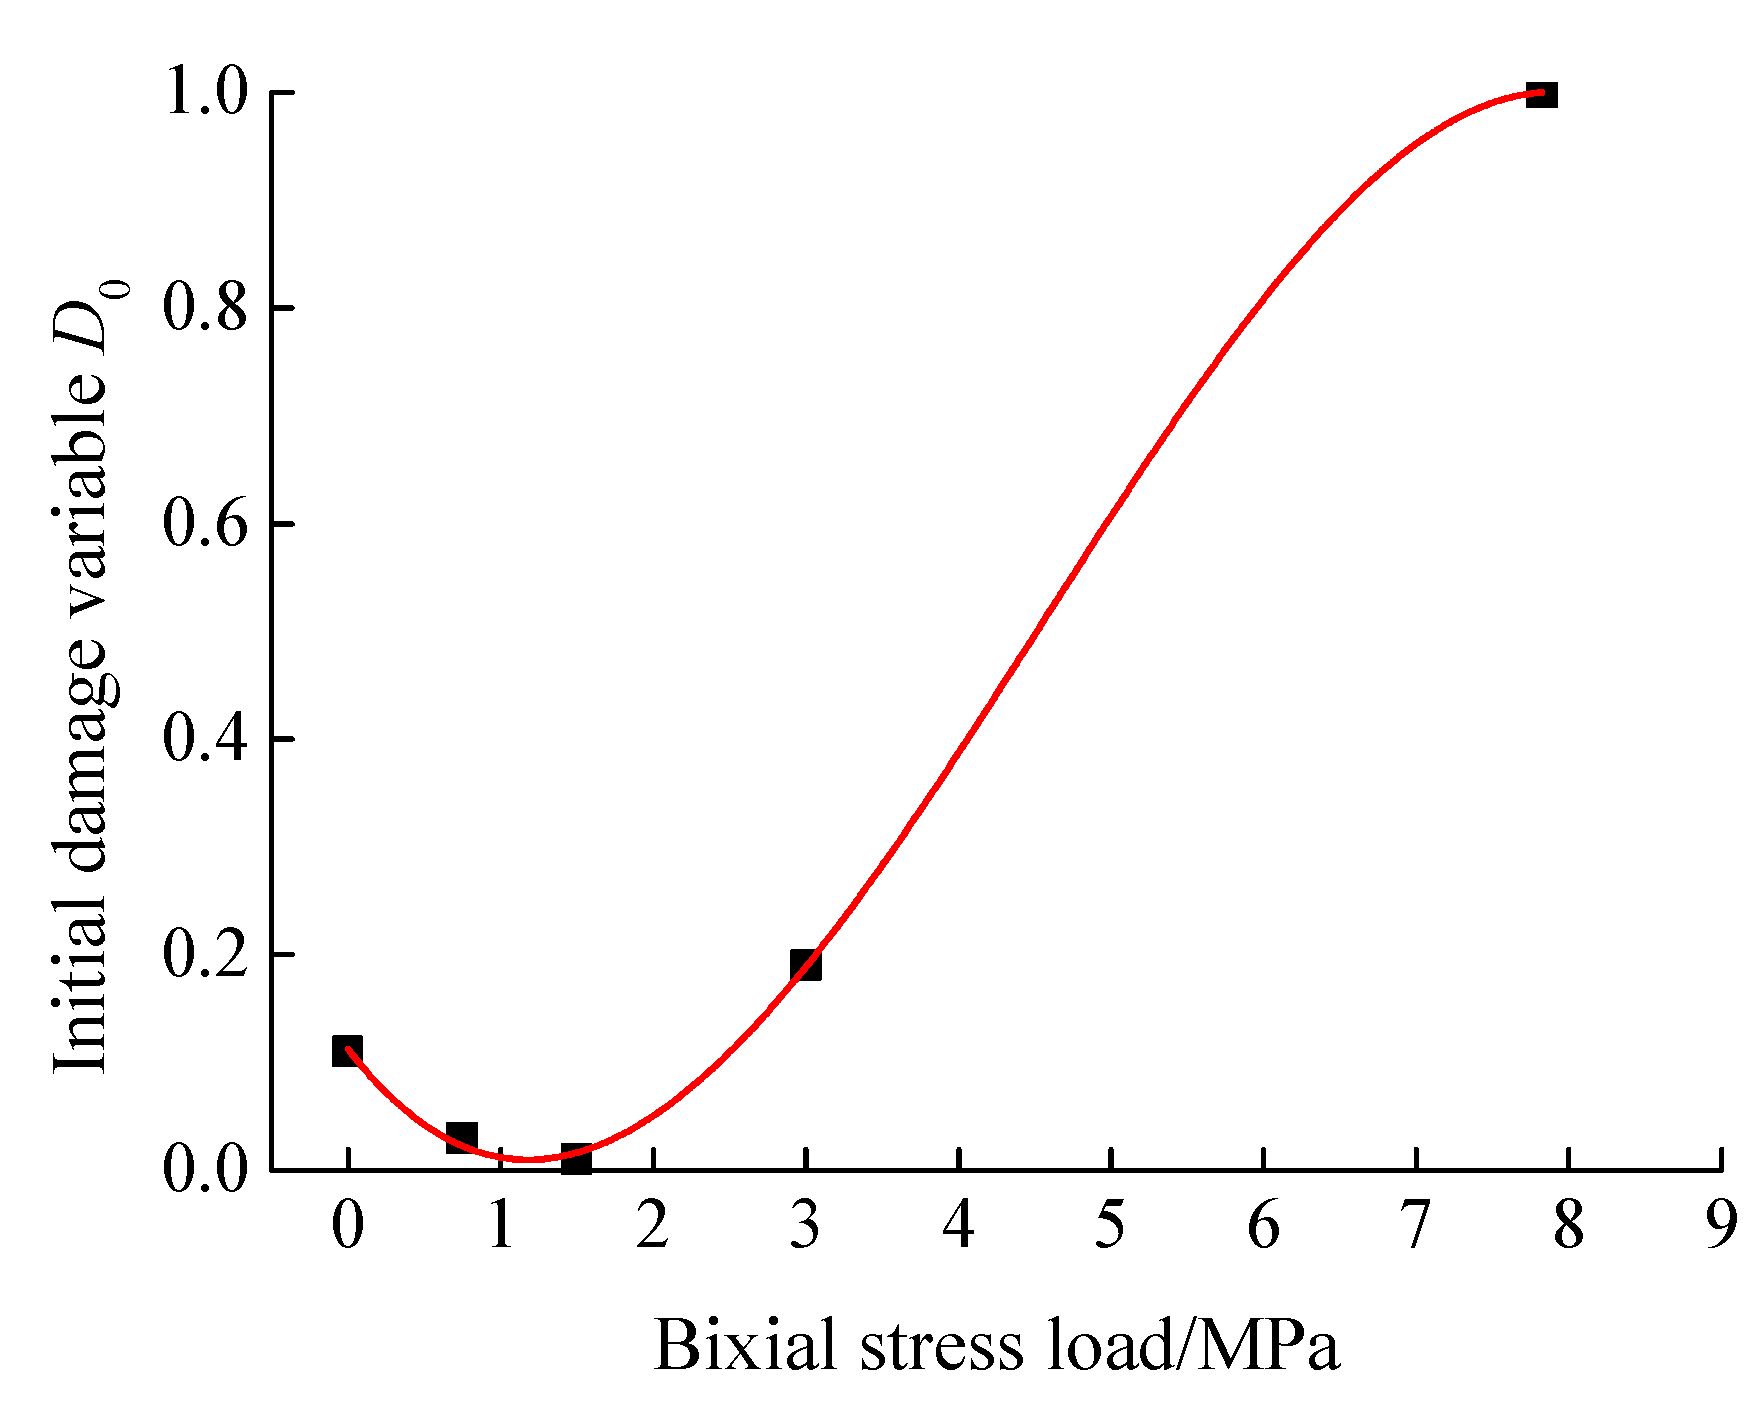
The initial damage variation in the intact rock with the biaxial static load increased first and then decreased. When the biaxial static load was 1.23 MPa, which was about 15.7% of the biaxial compressive strength of the intact rock, the stress wave velocity reached its maximum value while the initial damage was the smallest, indicating that the internal microcracks in the intact rock were in a fully compacted state under this static load.
(3)
As the biaxial static loads increased, the measured and numerical transmission coefficients of the rock masses containing different angles and numbers of joints all showed a trend of first increasing and then decreasing, and the transmission coefficient was the largest when the static load was about 2.2 MPa, which was about 28.1% of the biaxial compressive strength of the intact rock.
(4)
The transmission coefficient increased and then decreased with the increase in the joint angle without the static load and was the largest when the joint angle was close to 30°. The transmission coefficient continuously increased with the increase in the joint angle when the static load was relatively small, such as 0.75 MPa and 1.5 MPa, i.e., less than 20% of the biaxial compressive strength of the intact rock. The transmission coefficient decreased and then increased with the increase in the joint angle when the static load was greater than 2.25 MPa (28.7% biaxial compressive strength of the intact rock) and was the smallest at the joint angle of about 40°.
(5)
Under the same static loading, the transmission coefficients of the jointed rock masses all showed a tendency to decrease with the increase in the number of joints, and the decreasing increment gradually became smaller. The larger the static load, the smaller the decrease in the transmission coefficients caused by the increase in the number of joints, indicating the effect of the number of joints on the transmission coefficients which decreased as the static load increased.
(6)
In the blasting excavation of the underground rock mass, the in situ stress and the spatial distribution of the joints significantly affected the propagation of the blasting stress wave. When the blasting stress wave vertically impacted the initial stressed rock mass, the transmission coefficient was the largest. Therefore, the connection line of blast holes should be perpendicular to the dominant joints in an underground rock mass to ensure the efficient transmission of explosive energy, so that the rock mass can be efficiently and adequately fragmented.

Author Contributions

Conceptualization, Q.D.; methodology, Q.D. and X.L.; software, Q.D.; validation, Y.J. and J.S.; formal analysis, Q.D.; investigation, Q.D.; resources, X.L.; data curation, Q.D.; writing—original draft preparation, Q.D.; writing—review and editing, Q.D.; visualization, Q.D.; supervision, Y.J.; project administration, Q.D.; funding acquisition, X.L., Y.J. and J.S. All authors have read and agreed to the published version of the manuscript.

Funding

This research was funded by the Natural Science Foundation of Hubei Province, China (2020CFB428), the Innovation Group Project of the Natural Science Foundation of Hubei Province, China (2020CFA043), the Key Research and Development Project of Hubei Province, China (2020BCA084), the National Natural Science Foundation of China (51774222), and the Research Start-Up Foundation of Jianghan University (1027-06020001).

Institutional Review Board Statement

Not applicable.

Informed Consent Statement

Not applicable.

Data Availability Statement

The data used to support the findings of this study are available from the corresponding author upon request.

Acknowledgments

Special thanks for organizing and conducting the experimental studies to the faculty of the Hubei Key Laboratory of Blasting Engineering, Jianghan University.

Conflicts of Interest

The authors declare no conflict of interest.

References

  1. Fan, L.F.; Sun, H.Y. Seismic wave propagation through an in-situ stressed rock mass. J. Appl. Geophys. 2015, 121, 13–20. [Google Scholar] [CrossRef]
  2. Yi, C.P.; Johansson, D.; Greberg, J. Effects of in-situ stresses on the fracturing of rock by blasting. Comput. Geotech. 2018, 104, 321–330. [Google Scholar] [CrossRef]
  3. Tao, J.; Yang, X.G.; Li, H.T.; Zhou, J.; Fan, G.; Lu, G. Effects of in-situ stresses on dynamic rock responses under blast loading. Mech. Mater. 2020, 145, 103374. [Google Scholar] [CrossRef]
  4. Bandis, S.C.; Lumsden, A.C.; Barton, N.R. Fundamentals of rock joint deformation. Int. J. Rock Mech. Min. Sci. Geomech. Abstr. 1983, 20, 249–268. [Google Scholar] [CrossRef]
  5. Babanouri, N.; Mansouri, H.; Nasab, S.K.; Bahaadini, M. A coupled method to study blast wave propagation in fractured rock masses and estimate unknown properties. Comput. Geotech. 2013, 49, 134–142. [Google Scholar] [CrossRef]
  6. Skrzypkowski, K.; Korzeniowski, W.; Zagórski, K.; Zagórska, A. Adjustment of the Yielding System of Mechanical Rock Bolts for Room and Pillar Mining Method in Stratified Rock Mass. Energies 2020, 13, 2082. [Google Scholar] [CrossRef] [Green Version]
  7. Schoenberg, M. Elastic wave behavior across linear slip interfaces. J. Acoust. Soc. Am. 1980, 68, 1516–1521. [Google Scholar] [CrossRef] [Green Version]
  8. Pyrak-Nolte, L.J.; Myer, L.R.; Cook, N.G.W. Transmission of seismic waves across single natural fractures. J. Geophys. Res. Solid Earth 1990, 95, 8617–8638. [Google Scholar] [CrossRef]
  9. Zhao, J.; Cai, J.G. Transmission of Elastic P-waves across Single Fractures with a Nonlinear Normal Deformational Behavior. Rock Mech. Rock Eng. 2001, 34, 3–22. [Google Scholar] [CrossRef]
  10. Zhao, J.; Cai, J.G.; Zhao, X.B.; Li, H.B. Dynamic Model of Fracture Normal Behaviour and Application to Prediction of Stress Wave Attenuation Across Fractures. Rock Mech. Rock Eng. 2008, 41, 671–693. [Google Scholar] [CrossRef]
  11. Perino, A.; Orta, R.; Barla, G. Wave Propagation in Discontinuous Media by the Scattering Matrix Method. Rock Mech. Rock Eng. 2012, 45, 901–918. [Google Scholar] [CrossRef]
  12. Li, J.C.; Li, H.B.; Ma, G.W.; Zhao, J. A time-domain recursive method to analyse transient wave propagation across rock joints. Geophys. J. Int. 2012, 188, 631–644. [Google Scholar] [CrossRef]
  13. Zhao, X.B.; Zhao, J.; Cai, J.G. P-wave transmission across fractures with nonlinear deformational behaviour. Int. J. Numer. Anal. Methods Geomech. 2006, 30, 1097–1112. [Google Scholar] [CrossRef]
  14. Li, J.C.; Ma, G.W. Analysis of Blast Wave Interaction with a Rock Joint. Rock Mech. Rock Eng. 2010, 43, 777–787. [Google Scholar] [CrossRef]
  15. Cai, J.G.; Zhao, J. Effects of multiple parallel fractures on apparent attenuation of stress waves in rock masses. Int. J. Rock Mech. Min. Sci. 2000, 37, 661–682. [Google Scholar] [CrossRef]
  16. Li, J.C. Wave propagation across non-linear rock joints based on time-domain recursive method. Geophys. J. Int. 2013, 193, 970–985. [Google Scholar] [CrossRef] [Green Version]
  17. Chai, S.B.; Li, J.C.; Zhang, Q.B. Stress Wave Propagation across a Rock Mass with Two Non-parallel Joints. Rock Mech. Rock Eng. 2016, 49, 4023–4032. [Google Scholar] [CrossRef]
  18. Ju, Y.; Sudak, L.; Xie, H.P. Study on stress wave propagation in fractured rocks with fractal joint surfaces. Int. J. Solids Struct. 2007, 44, 4256–4271. [Google Scholar] [CrossRef] [Green Version]
  19. Feng, J.J.; Wang, E.Y.; Chen, L.; Li, X.; Xu, Z.; Li, G. Experimental study of the stress effect on attenuation of normally incident P-wave through coal. J. Appl. Geophys. 2016, 132, 25–32. [Google Scholar] [CrossRef]
  20. Cundall, P.A. A computer model for simulating progressive large-scale movements in blocky rock systems. In Proceedings of the Symposium of the International Society for Rock Mechanics, Nancy, France, 4–6 October 1971; pp. 11–18. [Google Scholar]
  21. Zhu, J.B.; Deng, X.F.; Zhao, X.B.; Zhao, J. A Numerical Study on Wave Transmission Across Multiple Intersecting Joint Sets in Rock Masses with UDEC. Rock Mech. Rock Eng. 2013, 46, 1429–1442. [Google Scholar] [CrossRef]
  22. Li, H.B.; Liu, T.T.; Liu, Y.Q.; Li, J.; Xia, X.; Liu, B. Numerical Modeling of Wave Transmission across Rock Masses with Nonlinear Joints. Rock Mech. Rock Eng. 2015, 49, 1115–1121. [Google Scholar] [CrossRef]
  23. Zheng, Y.; Chen, C.X.; Liu, T.T.; Zhang, W. Numerical Study of P-Waves Propagating across Deep Rock Masses Based on the Hoek-Brown Model. Int. J. Geomech. 2020, 20, 04019152. [Google Scholar] [CrossRef]
  24. Sun, L.; Zhao, G.F.; Zhao, J. Particle manifold method (PMM): A new continuum-discontinuum numerical model for geomechanics. Int. J. Numer. Anal. Methods Geomech. 2012, 37, 1711–1736. [Google Scholar] [CrossRef]
  25. Zhao, J.; Sun, L.; Zhu, J.B. Modelling P-wave transmission across rock fractures by particle manifold method (PMM). Geomech. Geoengin. Int. J. 2012, 7, 175–181. [Google Scholar] [CrossRef]
  26. Fan, L.F.; Yi, X.W.; Ma, G.W. Numerical manifold method (NMM) simulation of stress wave propagation through fractured rock mass. Int. J. Appl. Mech. 2013, 5, 1350022. [Google Scholar] [CrossRef]
  27. Zhou, X.; Fan, L.; Wu, Z. Effects of Microfracture on Wave Propagation through Rock Mass. Int. J. Geomech. 2017, 17, 04017072. [Google Scholar] [CrossRef]
  28. Huang, X.; Qi, S.; Williams, A.; Zhou, Y.; Zheng, B. Numerical simulation of stress wave propagating through filled joints by particle model. Int. J. Solids Struct. 2015, 69–70, 23–33. [Google Scholar] [CrossRef]
  29. Zhou, H.; He, C. Propagation law of stress wave and cracks in non-penetrating jointed rock mass: A numerical study based on particle flow code. Geotech. Geol. Eng. 2020, 38, 3967–3981. [Google Scholar] [CrossRef]
  30. Babanouri, N.; Fattahi, H. Evaluating orthotropic continuum analysis of stress wave propagation through a jointed rock mass. Bull. Eng. Geol. Environ. 2018, 77, 725–733. [Google Scholar] [CrossRef]
  31. Heidari, M.; Khanlari, G.R.; Torabi-Kaveh, M. Effect of Porosity on Rock Brittleness. Rock Mech. Rock Eng. 2014, 47, 785–790. [Google Scholar] [CrossRef]
  32. Patrick, B.; Wong, T.F.; Zhu, W. Effects of porosity and crack density on the compressive strength of rocks. Int. J. Rock Mech. Min. Sci. 2014, 67, 202–211. [Google Scholar]
  33. Jin, J.F.; Yuan, W.; Wu, Y.; Guo, Z. Effects of axial static stress on stress wave propagation in rock considering porosity compaction and damage evolution. J. Cent. South Univ. 2020, 27, 592–607. [Google Scholar] [CrossRef]
  34. Martin, C.D.; Chandler, N.A. The progressive fracture of Lac du Bonnet granite. Int. J. Rock Mech. Min. Sci. Geomech. Abstr. 1994, 31, 643–659. [Google Scholar] [CrossRef]
  35. Cai, M.; Kaiser, P.K.; Tasaka, Y.; Maejima, T.; Morioka, H.; Minami, M. Generalized crack initiation and crack damage stress thresholds of brittle rock masses near underground excavations. Int. J. Rock Mech. Min. Sci. 2004, 41, 833–847. [Google Scholar] [CrossRef]
  36. Wang, X.; Ge, H.; Wang, J.; Wang, D.; Chen, H. Evaluation of the Micro-cracks in Shale from the Stress Sensitivity of Ultrasonic Velocities. Rock Mech. Rock Eng. 2016, 49, 4929–4934. [Google Scholar] [CrossRef]
  37. Hou, R.; Zhang, K.; Tao, J.; Xue, X.; Chen, Y. A Nonlinear Creep Damage Coupled Model for Rock Considering the Effect of Initial Damage. Rock Mech. Rock Eng. 2018, 52, 1275–1285. [Google Scholar] [CrossRef]
  38. Du, M.; Su, J.; Wang, X.; Zhang, S.; Zhang, Y. Dynamic response and crack propagation law of tunnel invert with initial damage. Eng. Fail. Anal. 2021, 119, 104939. [Google Scholar]
  39. Dong, Q. Model test study on propagation law of plane stress wave in jointed rock mass under different in-situ stresses. In Proceedings of the IOP Conference Series: Earth and Environmental Science, Singapore, 22–25 December 2017; p. 012009. [Google Scholar]
  40. Dong, Q.; Li, X.P.; Huang, J.H. Model test study on cylindrical blasting stress wave propagation across jointed rock mass with different initial stresses. Adv. Civ. Eng. 2020, 2020, 8881302. [Google Scholar] [CrossRef]
  41. Papanikolaou, V.K.; Kappos, A.J. Confinement-sensitive plasticity constitutive model for concrete in triaxial compression. Int. J. Solids Struct. 2007, 44, 7021–7048. [Google Scholar] [CrossRef] [Green Version]
  42. Huang, H. Experimental Study on Biaxial-to-Uniaxial Strength Ratio of Concrete at Early Age. Master’s Thesis, Dalian University of Technology, Dalian, China, 2013. (In Chinese). [Google Scholar]
  43. Yin, S.; Wang, S. Relation of stresses with elastic modulus and velocities and its application. Rock Soil Mech. 2003, 24, 597–601. (In Chinese) [Google Scholar]
Figure 1. Multifunctional testing machine for the rock and soil: (a) test equipment; (b) static loading schematic.
Applsci 11 07873 g001
Figure 2. Layout of the measuring points and the joints of the model test samples (unit: mm): (a) T1 sample; (b) T2 sample; (c) T3 sample.
Applsci 11 07873 g002
Figure 3. Schematic diagram of the charge structure in the model test samples: (a) detonating cords fixed in the wooden centering stent; (b) wooden centering stent in the model samples; (c) the pouring of quick-drying materials.
Applsci 11 07873 g003
Figure 4. Relationship between the stress wave velocity and the static load of the intact rock.
Applsci 11 07873 g004
Figure 5. Relationship between the initial damage variable and the static load of the intact rock.
Applsci 11 07873 g005
Figure 6. Calculation flow of the Mohr-Coulomb elasto-plastic constitutive model of the rock considering the initial damage.
Applsci 11 07873 g006
Figure 7. Numerical model of the different model test samples (unit: mm): (a) T1 sample; (b) T2 sample; (c) T3 sample.
Applsci 11 07873 g007aApplsci 11 07873 g007b
Figure 8. Measured blast load and applied schematic: (a) measured blasting load time curve; (b) blasting load application.
Applsci 11 07873 g008
Figure 9. Measured and numerical stress wave curve at P17 and P18 points in each sample under different static loads: (a) T1 sample; (b) T2 sample; (c) T3 sample.
Applsci 11 07873 g009
Figure 10. Measured and numerical transmission coefficients of jointed rock masses under different static loads: (a) T1 sample; (b) T2 sample; (c) T3 sample.
Applsci 11 07873 g010
Figure 11. Numerical model containing one single joint with different angles (unit: mm).
Applsci 11 07873 g011
Figure 12. Effect of the joint angle on the transmission coefficient under different biaxial static loads.
Applsci 11 07873 g012
Figure 13. Numerical calculation model of the rock mass containing five joints with different angles (unit: mm): (a) joint angle of 90°; (b) joint angle of 60°.
Applsci 11 07873 g013
Figure 14. Transmission coefficient of the rock mass containing different numbers of 90° and 60° joints under biaxial static loads: (a) 90° jointed rock mass; (b) 60° jointed rock mass.
Applsci 11 07873 g014
Table 1. Physical and mechanical parameters of similar materials and the prototype of the intact rock.
TypeRc/MPaσt/MPaE/GPaφ/(°)C/MPaμρ/kg/m3
Prototype120125030300.2232600
Similar material5.8640.6135.22623.21.490.2031980
Where, Rc, σt, E, φ, C, μ and ρ are the uniaxial compressive strength, tensile strength, elastic modulus, internal friction angle, cohesion, poisson ratio, and density of the prototype and similar material, respectively.
Table 2. Physical and mechanical parameters of the intact rock, joint, and seamless steel pipe.
ParametersIntact RockJointSeamless Steel Pipe
Compressive strength/MPa5.864/645
Tensile strength/MPa0.613/400
Elastic modulus/GPa5.226/206
Internal friction angle/°23.2//
Cohesion/MPa1.49//
Poisson ratio0.203/0.3
Initial normal stiffness/GPa/m/12/
Initial shear stiffness/GPa/m/7.53/
Publisher’s Note: MDPI stays neutral with regard to jurisdictional claims in published maps and institutional affiliations.

