Abstract
The production of ultrafine fibers of proteins and polysaccharides by needleless electrospinning can be performed prior to a thermal treatment to form glycoconjugates via the first stage of the Maillard reaction. The aim was to produce potato protein–maltodextrin conjugates with a varying protein content of 0.05, 0.1, 0.15, and 0.2 g/mL by needleless electrospinning and subsequent thermal treatment (0, 6, 12, 24, and 48 h at 65 °C and 75% relative humidity). The concentrations of the maltodextrins, with a dextrose equivalent of 2 and 21, were kept constant at 0.8 and 0.1 g/mL. The highest fiber production rate was achieved with a protein content of 0.1 g/mL (5.8 ± 0.4 g/h). With increasing protein content, the production rate decreased to 2.8 ± 0.5 g/h. The fibers obtained from the spinning solution containing 0.2 g/mL protein showed the largest average diameter (4.0 ± 1.5 µm) and the broadest fiber diameter distribution. The protein content of the fibers was close to that of the corresponding spinning solution. The browning index after 48 h of heating increased for all samples (9.7–14.7) compared to the unheated samples (1.1–3.3). The results indicate that the protein content has an impact on the yield, the fiber diameter, and the morphology of the fibers.
1. Introduction
Potato protein is an increasingly interesting alternative for many existing proteins used as food ingredients [1,2]. The amino acid composition of potato protein is beneficial due to the high content in essential and branched chain amino acids, and its biological valence is very close to that of whole egg [3]. In addition to its nutritional benefits, potato protein also has functional properties, such as emulsification and foaming ability, which make it useful in the food industry [4]. Potato proteins can be used for the production of vegetable meat substitutes and, because of their combination of emulsification and gelling properties, also in emulsified meat products [5].
Two percent of the potato fruit juice, a byproduct of industrial starch production, makes up for the protein fraction [6]. The soluble potato proteins can be divided into three classes: Patatin, protease inhibitors, and other high molecular weight potato proteins [7]. Protease inhibitors inhibit the activity of serine protease, cysteine protease, aspartate protease, and metalloprotease, thus reducing the digestibility and availability of the proteins [8].
By the covalent binding of carbohydrates to proteins by a mild Maillard reaction, it is possible to improve their functional properties [9] and the nutritional benefits of these proteins by possibly reducing the activity of trypsin inhibitors [10]. Thus, new food ingredients with improved properties can be obtained [11,12]. The glycation is based on the Amadori rearrangement in the Maillard reaction [9,13,14]. The first stage of the Maillard reaction is the condensation of an unprotonated amino group with a reducing sugar to form a Schiff base (glycosylamine) which is then rearranged to the Amadori product [9,14,15]. Since no additional chemicals are required, the modification of proteins via the first stage of the Maillard reaction has a significant advantage over other types of chemical modification of food proteins [13]. The difficulty of producing protein–polysaccharide conjugates is limiting the Maillard reaction to the first stage, e.g., the formation of the Schiff base, and preventing coloration of the product [16]. The conjugation of polysaccharides with proteins via the first stage of the Maillard reaction can be performed under wet or dry conditions or by novel procedures such as electrospinning with subsequent heating [17]. A difficulty with conjugation under wet conditions is the possible denaturation and polymerization of proteins and the low glycation yield [16]. Moreover, both dry and wet state reactions provide only a small yield of glycoconjugates accompanied by undesired browning [9]. Therefore, the described electrospinning procedure becomes increasingly relevant [9,16]. With electrospinning prior to heating, glycation is supposed to be faster, to provide a higher yield and to be less expensive than glycation under dry and wet conditions [18]. Applications of these glycoconjugates could be used as novel emulsifiers for flavor emulsions especially in acidic beverages [19,20]. Additionally, it is known that glycation can lead to an improvement of the solubility, foaming, and textural properties, as well as to an increase in antioxidant activity and heat stability [9].
In electrospinning, ultrafine fibers with small diameters and large surfaces can be obtained from synthetic or natural polymer solutions by applying a strong electric field [21,22]. In the electrospinning process, electrically charged jets are ejected from the polymer solution as soon as the electrostatic repulsion on the surface of the polymer solution overcomes the surface tension [23,24,25]. The jets are then driven by the electric field and move towards the collector [24]. The repulsive forces inside the jet result in instability which is minimized by elongation of the jet. This leads to a significant reduction in the fiber diameter and increase in the surface [24,26]. On the way to the grounded collector, the fibers solidify by evaporation of the solvent and nonwoven mats are formed [23,26]. If a needleless device is used instead of a needle-based system, multiple fibers can be generated simultaneously from the surface of the polymer solution which further increases the yield [27]. Due to the large surface area formed, glycation of proteins via Maillard reaction is already possible at temperatures around 60–70 °C [21].
In a recent study, the successful spinning of maltodextrin DE 2 (0.8 g/mL), maltodextrin DE 21 (0.1 g/mL), and pea protein isolate was shown with deionized water as solvent in a needleless electrospinning device [28]. In comparison to the solubility of pea protein (31.7 ± 15.7%), potato protein is completely soluble in deionized water due to its low molecular weights (5–25 kDa) [29]. The aim of the present study was to obtain potato protein–maltodextrin conjugates with varying protein contents by needleless electrospinning and subsequent heating of the electrospun fibers at 65 °C and 75% relative humidity (RH). Electrospinning of potato proteins with maltodextrin represents a new approach that has not yet been investigated. The fibers that were heated for 6, 12, 24, and 48 h and the unheated fibers were further analyzed; the fiber production rate, protein content, color, and morphology of the fibers was determined to evaluate the formation of potato protein–maltodextrin conjugates and the quality of the fibers. It was hypothesized that the protein content would have a significant influence on the spinnability as well as the morphology and browning of the fibers.
2. Materials and Methods
2.1. Preparation of the Spinning Dispersions
The dispersions of maltodextrin with a dextrose equivalent (DE) of two (ElianeTM MD2 by Avebe, 9640 AA Veendam, The Netherlands), maltodextrin DE 21 (Glucidex® 21D by Roquette, 62136 Lestrem, France), and potato protein (Solanic® 300 by Avebe, 9640 AA Veendam, The Netherlands) were prepared in four different blends which are shown in Table 1. Since the used Solanic® 300 has a protein content of 91.16 ± 0.3 g/100 g, the amount was adjusted to the required protein content of the spinning solutions. The maltodextrin concentrations used were based on a previous study by Kutzli et al. [25]. The used maltodextrin DE 2 was obtained from potato starch whereas the maltodextrin DE 21 is produced from corn starch. All materials were first mixed dry and then dissolved in deionized water. The spinning solutions were stirred overnight on a magnetic stirrer at 100 rpm at room temperature. The foam (1 mm) built over night was taken off before spinning. The blend solutions were used for electrospinning after 30 min under vacuum (~600 mbar, 25 °C).

Table 1.
Production rate for each blend (weight ratio per 100 mL double distilled water), expressed as mass of fibers (g) spun per hour (h), with standard deviations.
2.2. Electrospinning of the Fibers
The solutions of potato protein and maltodextrin were spun in a needleless electrospinning device, designed by the technical workshop of the University of Hohenheim. The machine consisted of the spinneret block, the grounded collector, the command block, and the high voltage supply. The air humidity could be regulated through the compressed air supply and was measured with an air humidity measuring device. The applied high voltage (SL 60, Spellman, Hauppauge, NY, USA) was 64 kV and was transferred to the spinning solution by a rotating stainless-steel cylinder (140 rpm), wrapped with metal wires. The spun fibers were collected on a cylinder rotating at 30 rpm. The distance between collector and spinneret was set to 15.8 cm. The temperature during the spinning process was between 20 and 23 °C; the relative humidity (RH) inside the cabin was between 15% and 25%. Per spinning round, about 25 mL of the spinning solution, prepared the day before, was evenly distributed on the spinneret block. The motors, voltage, and current were switched on; the spinning process was stopped after 30 to 45 min. After removing the spun mats from the grounded collector, they were weighed and stored in a desiccator until further treatment.
2.3. Heating the Fibers
Each blend of the spun fibers was heated at 65 °C and 75% RH for 0, 6, 12, 24, and 48 h in a thermal cabinet HCP 50 (Memmert GmbH+Co. KG, 91126, Schwabach, Germany). After heating, the spun mats were finely ground in order to analyze the powder.
2.4. Visualization of the Fibers
Photographs of the heated and unheated fibers were taken with a Canon EOS 250D (Canon Inc., Tokyo, Japan). In addition, the fibers were examined with a scanning electron microscope (SEM) (JSM-IT100 by JEOL, 85356, Freising, Germany) at an applied voltage of 2 kV under high vacuum. For sample preparation, carrier foil was attached to the collector and the electrospinning process was started for about 30 s until a thin layer of fibers formed on the foil. Fiber distribution and average fiber diameter were determined from SEM images using ImageJ (National Institute of Health, Bethesda, MD, USA). For the measurement, 40 fibers of each blend were analyzed.
2.5. Determination of the Browning Index
To determine the browning index of the grounded powder of all samples, a Chromameter (CR-400/410 with data processor DP-400, Konia Minolta, Inc., Chiyoda, Japan) was used. The device was calibrated with a white standard tile (Y = 93.5, x = 0.3114, y = 0.3190). According to a study of Martinez-Alvarenga et al. [30], the browning index (BI) of the fibers was calculated from the determined L*a*b* values in triplicate (Equations (1) and (2)):
2.6. Determination of the Protein Content According to Dumas
To determine the protein content of the samples by the nitrogen determination according to Dumas, the DUMATHERM® (C. Gerhardt GmbH & Co. KG, 53639, Königswinter, Germany) was used. Fifty to sixty milligrams of each sample were weighed in tin foil (IVA Analysentechnik GmbH & Co. KG, 40670, Meerbusch, Germany) in triple determination. For calibration, 50, 100, and 150 mg EDTA (≥99% Carl Roth GmbH+Co. KG, 76185, Karlsruhe, Germany) were measured. A protein conversion factor of 6.25 was used to infer the protein content from the determined nitrogen content.
2.7. FTIR-Analysis
A FTIR spectra of all the heated and the unheated fibers was captured using a Spectrum 100 (PerkinElmer, Beaconsfield, UK) equipped with a universal attenuated total reflectance (ATR–FTIR) accessory (PerkinElmer, Spectrum 100, Beaconsfield, UK). Sixty-four scans were measured per spectrum within the wavenumber range from 650 to 4000 cm−1 (resolution 4 cm−1) and then averaged. The determination of the peaks was performed with the Spectrum 10 Spectroscopy Software (PerkinElmer, Beaconsfield, UK).
2.8. Statistical Analysis
Means, standard deviations, and analysis of variance to determine significant differences (α = 0.05) were calculated with Excel (Microsoft, 98052, Redmond, WA, USA) and Sigma Plot 14 (Systat Software Inc., San Jose, CA, USA). As an assumption, the data of the product properties were tested for normality and equality of variances (p < 0.05). A Student-Newman-Keuls-test was used to identify statistical differences (p < 0.05) which were marked with different letters.
3. Results and Discussion
3.1. Production Rate of Spinning
The different blends of the spinning solutions, each having a different protein content between 0.05 and 0.2 g/mL respectively, are further referred to as A, B, C, and D (Table 1). To compare the yield of the different spinning solutions, the production rates during spinning were measured by stopping the time and subsequently weighing the produced fibers. The production rates of the different blends with their ratios are listed in Table 1. The significantly highest production rate was achieved with blend B (5.78 ± 0.4 g/h), whereas at the highest protein content (blend D), the production rate significantly decreased to 2.77 ± 0.5 g/h. The comparison of the production rates of the blends B, C, and D shows that the production rate decreased with increasing protein content. Blend A shows a production rate of 3.42 ± 0.17 g/h.
An attempt was also made to spin a fifth solution, varying only in the protein content, which was set to 0.25 g/mL. The maltodextrin concentrations were the same as for the other blends. At this protein concentration, the dispersion was impossible to spin because too much foam formed overnight, which was probably caused by the high protein content of the spinning solution.
In some instances, the production rates showed high standard deviations. This could be explained by the fact that during the spinning process the temperature and the RH could not be kept completely constant. Temperature and humidity influence the spinnability and duration of the spinning process and therefore the productivity [31]. High ambient temperatures and low RH lead to rapid evaporation of the solvent, which was why the solution could not be spun for the desired length of time. The viscosity of the spinning solution can also influence the spinnability and production rate. Mendes et al. found that as the protein concentration of the spinning solution increases, high viscosity inhibits spinnability [32]. The formation of Taylor cones is retarded and thus the spinning process is delayed [33]. This might be a possible explanation for the decreasing yield with higher protein contents.
The spinning solution of blend A was visibly less viscous than the others. This may have caused the solution to drip from the spinneret roll during the spinning process which would explain the low production rate. The biopolymer solution should have a concentration high enough to cause biopolymer entanglement to allow the formation of the fibers [32]. In a recent study, an entanglement concentration between 0.21 and 0.29 g/mL was analyzed and for electrospinning three times higher concentration of the maltodextrin DE2 (0.8 g/mL) was applied [22]. The polymer chain entanglements within the jets prevent them from breaking up during spinning. If the polymer concentration is too low, no chain overlaps can form [18,22]. At low viscosity, the degree of entanglement in the solution is too low and the resulting polymer jets are not very strong which causes them to easily break, thus interrupting the spinning process [33].
Dosunmu et al. reported that in needle spinning, the mass rate of fiber production of the single jet lies typically between 0.1 and 1.0 g/h, but with needleless spinning producing several jets at the same time, much higher fiber yields can be obtained [34] which corresponds with the present results shown in Table 1.
3.2. Visual Appearance of the Fibers
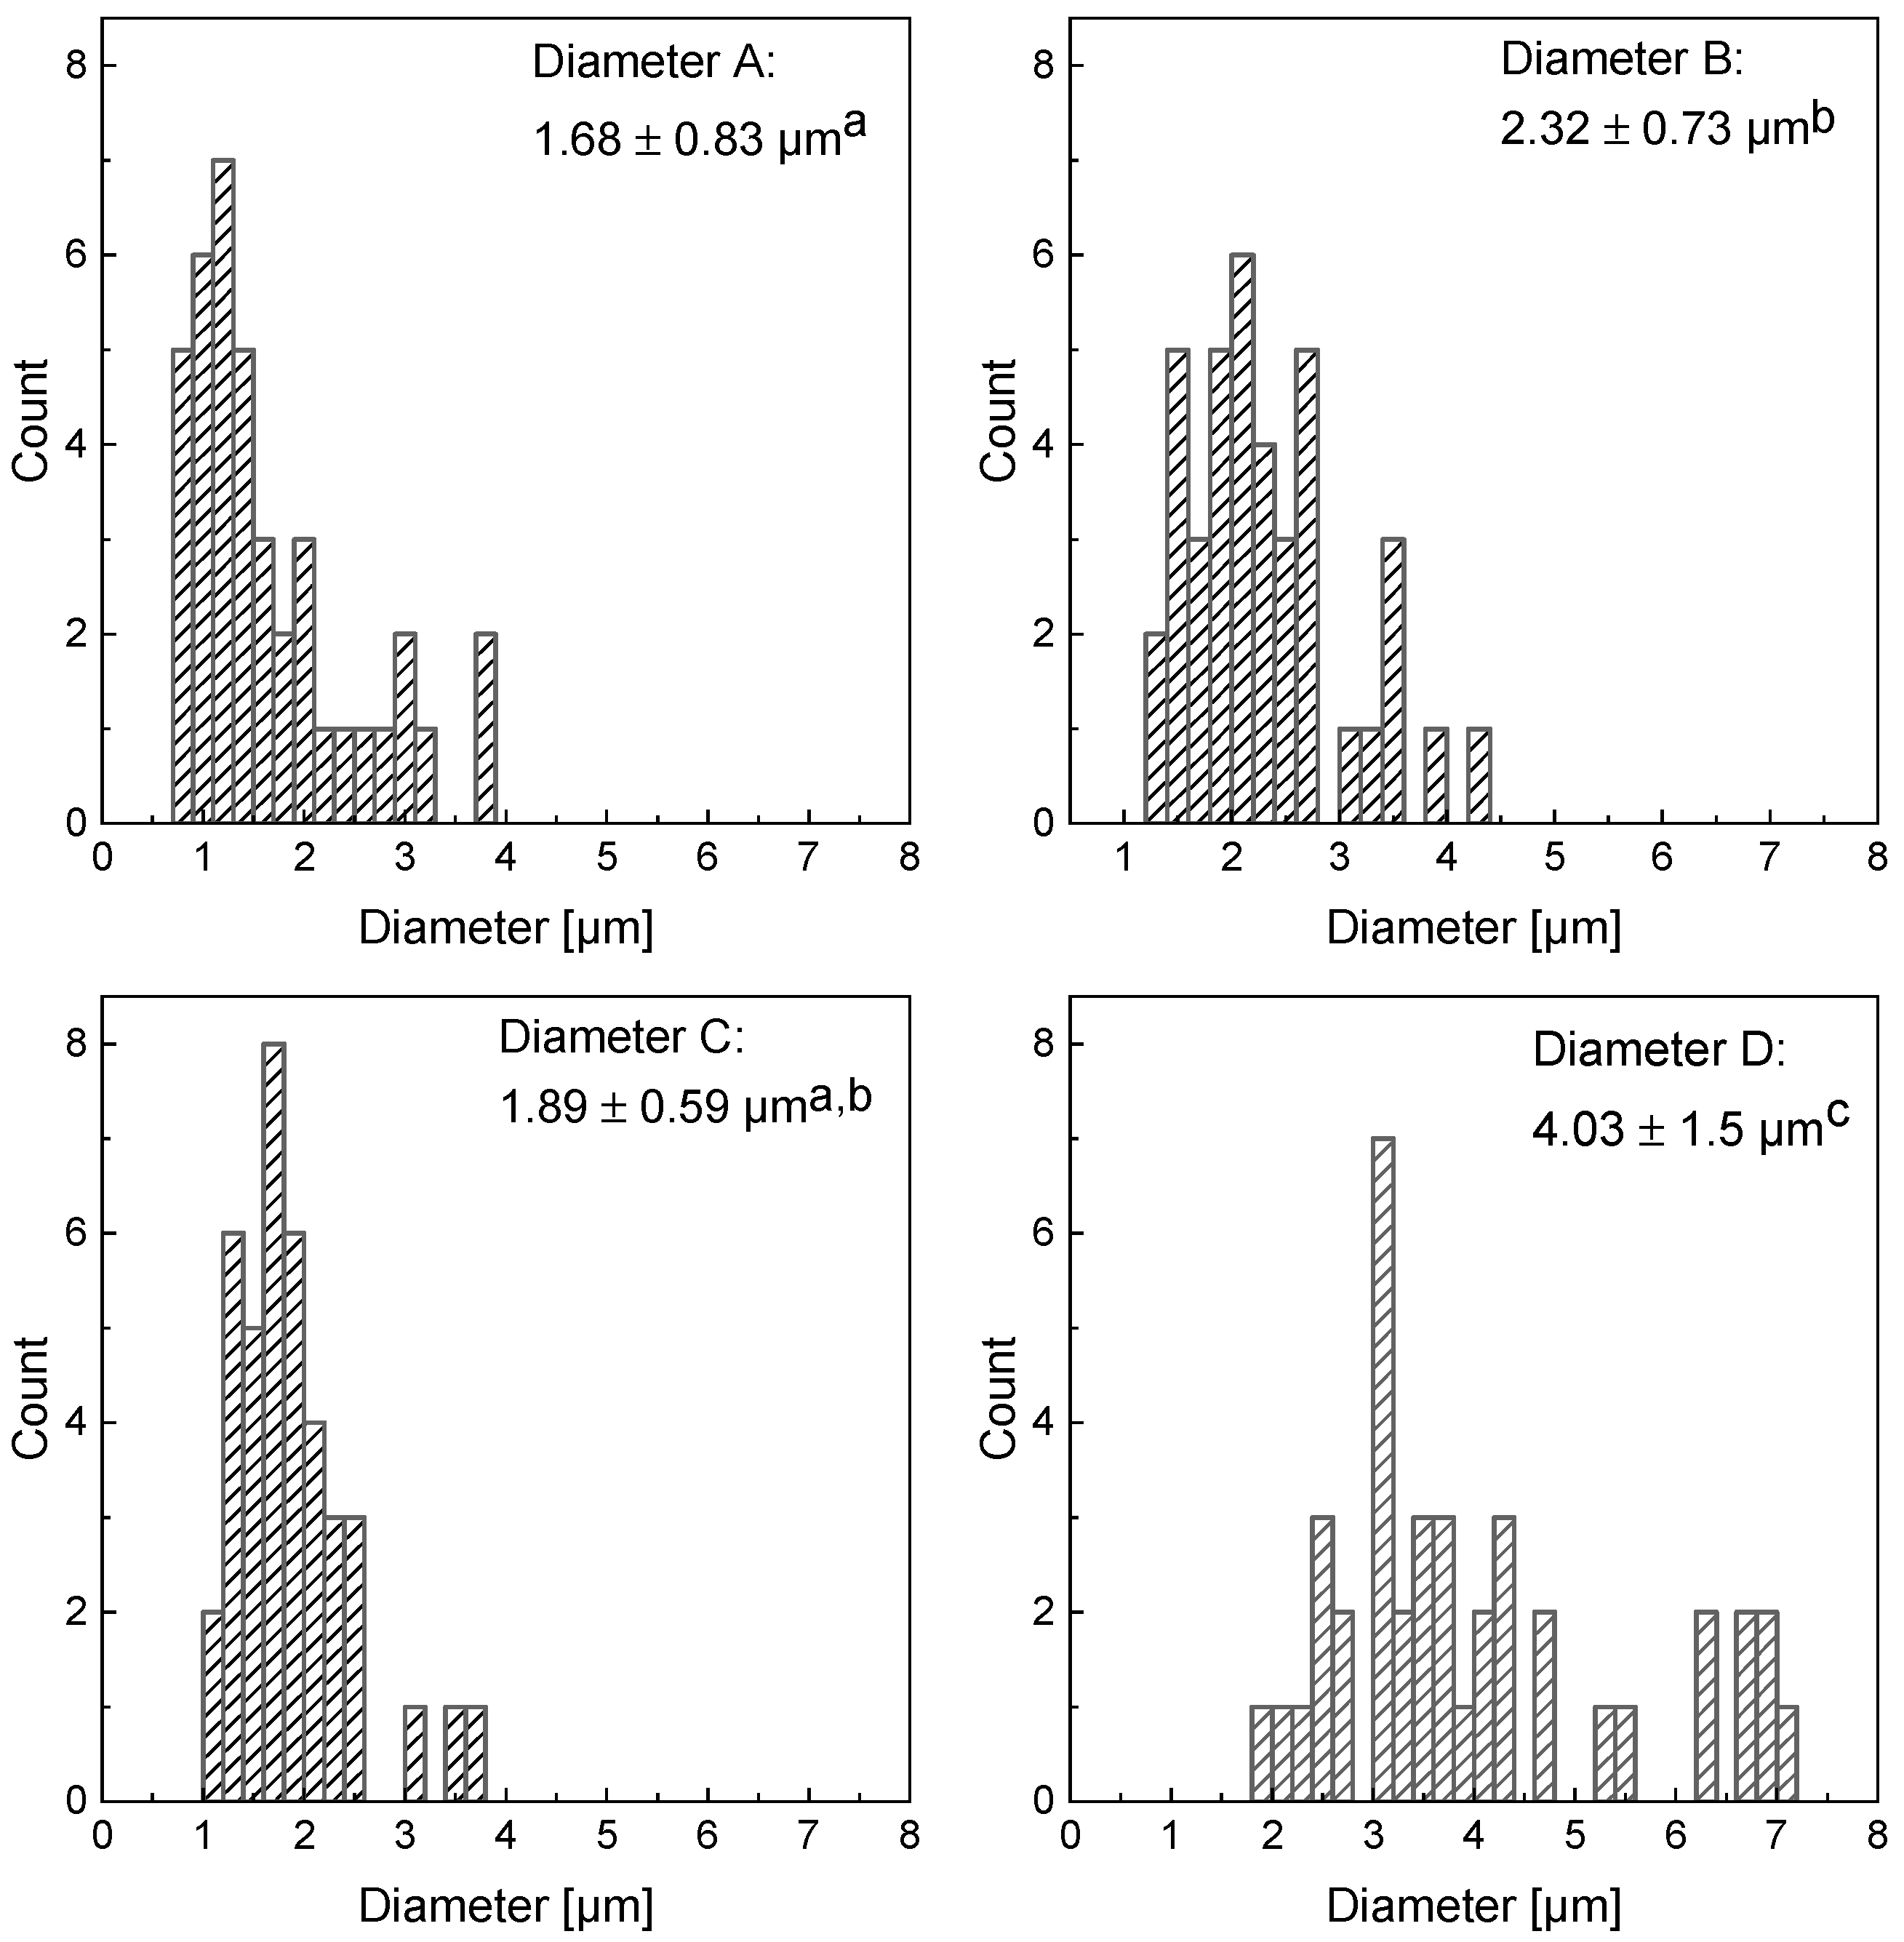
The diameters and visual appearance of the unheated fibers were examined under the scanning electron microscope. Fiber diameter distribution and average fiber diameter are shown in Figure 1. Blend A showed the smallest average diameter with 1.68 ± 0.83 µm, whereas blend D showed the largest with 4.03 ± 1.5 µm. The spun fibers of blend B showed an average fiber diameter of 2.32 ± 0.73 µm. There seems to be no clear correlation between the highest production rate and the highest fiber diameter. Although it was found that the mean values of the diameters of fibers with different contents of protein differed significantly, previous studies showed that other factors besides the protein content such as varying humidity or temperature during spinning may also be responsible [31,35].

Figure 1.
Histograms of the diameters of the different blends (A) (80:10:5), (B) (80:10:10), (C) (80:10:15) and (D) (80:10:20). The different letters represent significant differences (p < 0.05) between the different blends.
Because the concentration of MD DE 2 was kept constant, it was possible to form fibers from all blends. High molecular weight polysaccharides, such as MD DE 2, provide both reducing groups for the Maillard reaction and entanglement of the molecules within the fibers by increasing chain overlap which allows the formation of stable jets [22,26]. Kumar et al. stated that the fiber diameter and its uniformity is strongly dependent on the quantity of the solvent [36]. The observation that the blend with the highest protein content (blend D) resulted in the highest average diameter is consistent with the results of a previous study [37]. In this study, it was stated that a higher viscosity leads to a larger fiber diameter because the viscoelastic force resists stretching and deformation of the fibers [37]. Furthermore, blend D showed the broadest diameter distribution with a standard deviation of 1.5 µm. This suggests that the fibers were less uniform than the fibers from the other blends and that the proteins could not be incorporated evenly into the MD fibers which was previously observed using pea protein and maltodextrin for electrospinning [38].
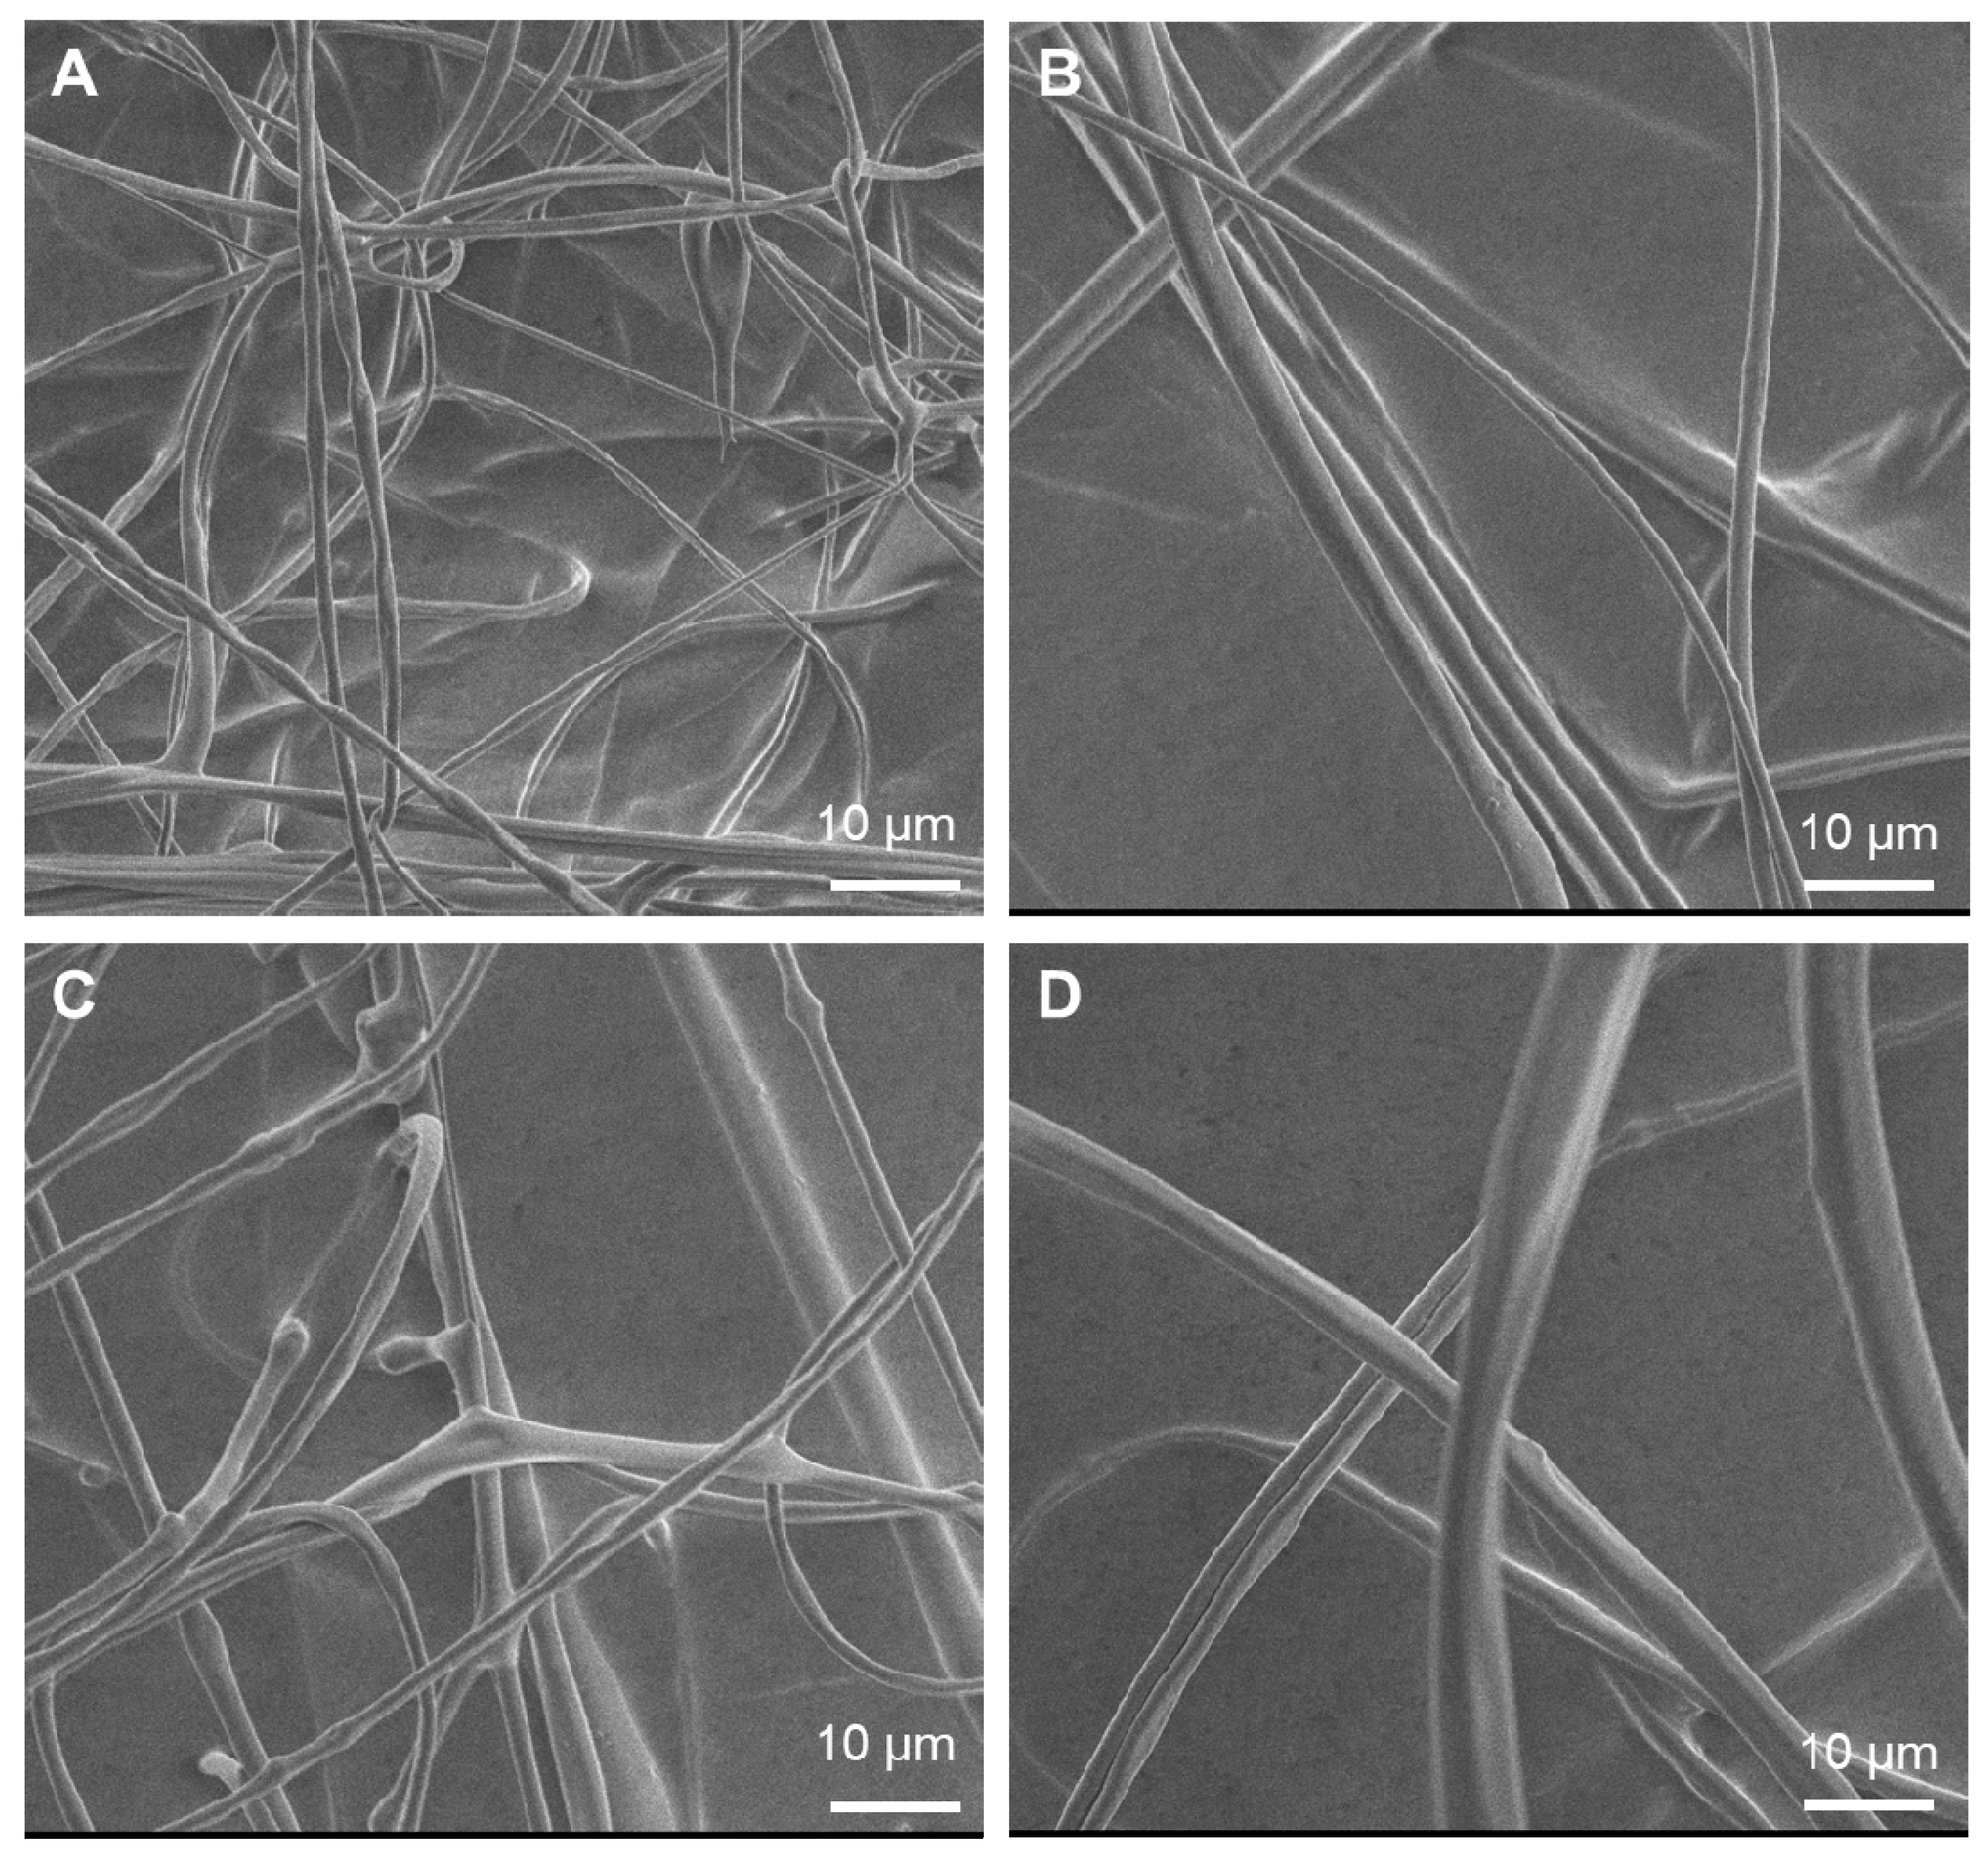
At a low polymer concentration of the spinning solution resulting in a low viscosity, the fibers can be defective due to the reduced entanglement of the polymer chains [39]. As a result, the solution jets may be more likely to break or be electrosprayed during spinning and form polymer droplets or beads. Defects in the spun mats could be detected in all samples. Blend A showed fine fibers and some large non-spun droplets with a diameter of about 140 µm (Figure 2A). These were probably caused by the fast rotation of the spinneret in combination with the low viscosity of the spinning solution caused by the low protein content. At low viscosities, there is an increased risk of bead formation due to the low viscoelastic force [37]. Blend B showed several defects as well (Figure 2B). With increasing viscosity of the spinning solution, the number of beads decreased. In summary, there is an optimum viscosity for the entanglement of the polymers and the overcoming of surface tension that is important for the outcome of the electrospinning process. In this case, the number of defects should be small and the distribution of fiber diameters should be as narrow as possible. Figure 2C,D show connection zones between the individual polymer strands and Figure 2D shows relatively broad fibers. Kriegel et al. explained these fused fibers by a too high humidity level [31]. Increasing humidity leads to a reduced evaporation of the solvent during the transfer of the jet to the collector. The lack of time to evaporate all the solvent promotes the fusion of the individual fibers. If it is impossible for the solvent to evaporate completely before the jet arrives at the collector, the fibers fuse together and form a 3D network of interconnected fibers [19]. The morphology of the fibers is also affected by other ambient conditions, such as temperature, air velocity in the spinning chamber, and air pressure [32]. The observed deviation of the fiber structures in each blend is the result of the slightly different environmental conditions.

Figure 2.
Scanning electron microscopy images showing defects of the electrospun fibers of the different blends (A) (80:10:5), (B) (80:10:10), (C) (80:10:15) and (D) (80:10:20) before thermal treatment. The scale bar represents 10 µm.
3.3. Protein Content According to Dumas
In order to see if the protein content of the spinning solution differed from the protein content of the spun and heated fibers, the protein content of all samples was determined. The protein determination according to Dumas involves combusting the sample. The nitrogen content of the burned sample can then be determined from the resulting exhaust gas. Since the fibers consist only of protein and maltodextrin, which contains almost no nitrogen, the protein content of the fibers can be determined directly from the released nitrogen content. The protein contents of almost all unheated fibers were slightly lower than the calculated protein content in the spinning solutions (Table 2). Only the unheated fibers of blend D showed a slightly higher protein content (20.68 ± 0.29 g/100 g) than the spinning solution with a protein content of 20% w/w.
Table 2.
Protein content of the spinning solution compared to the protein content in the unheated fiber for the different blends with standard deviation.
The ratio between the protein content of the spinning solution and of the unheated fibers ranged between 1:0.90 (blend C) and 1:1.03 (blend D) (Table 2). Since both the protein content of the unheated fibers and the one of the spinning solutions were relatively similar, it seems that the proteins were well included into the fibers by electrospinning. The fact that the fibers were spun in several batches and therefore the spinning solutions of the different ratios had to be prepared several times could also be a reason for the slight variability of the protein contents of each blend.
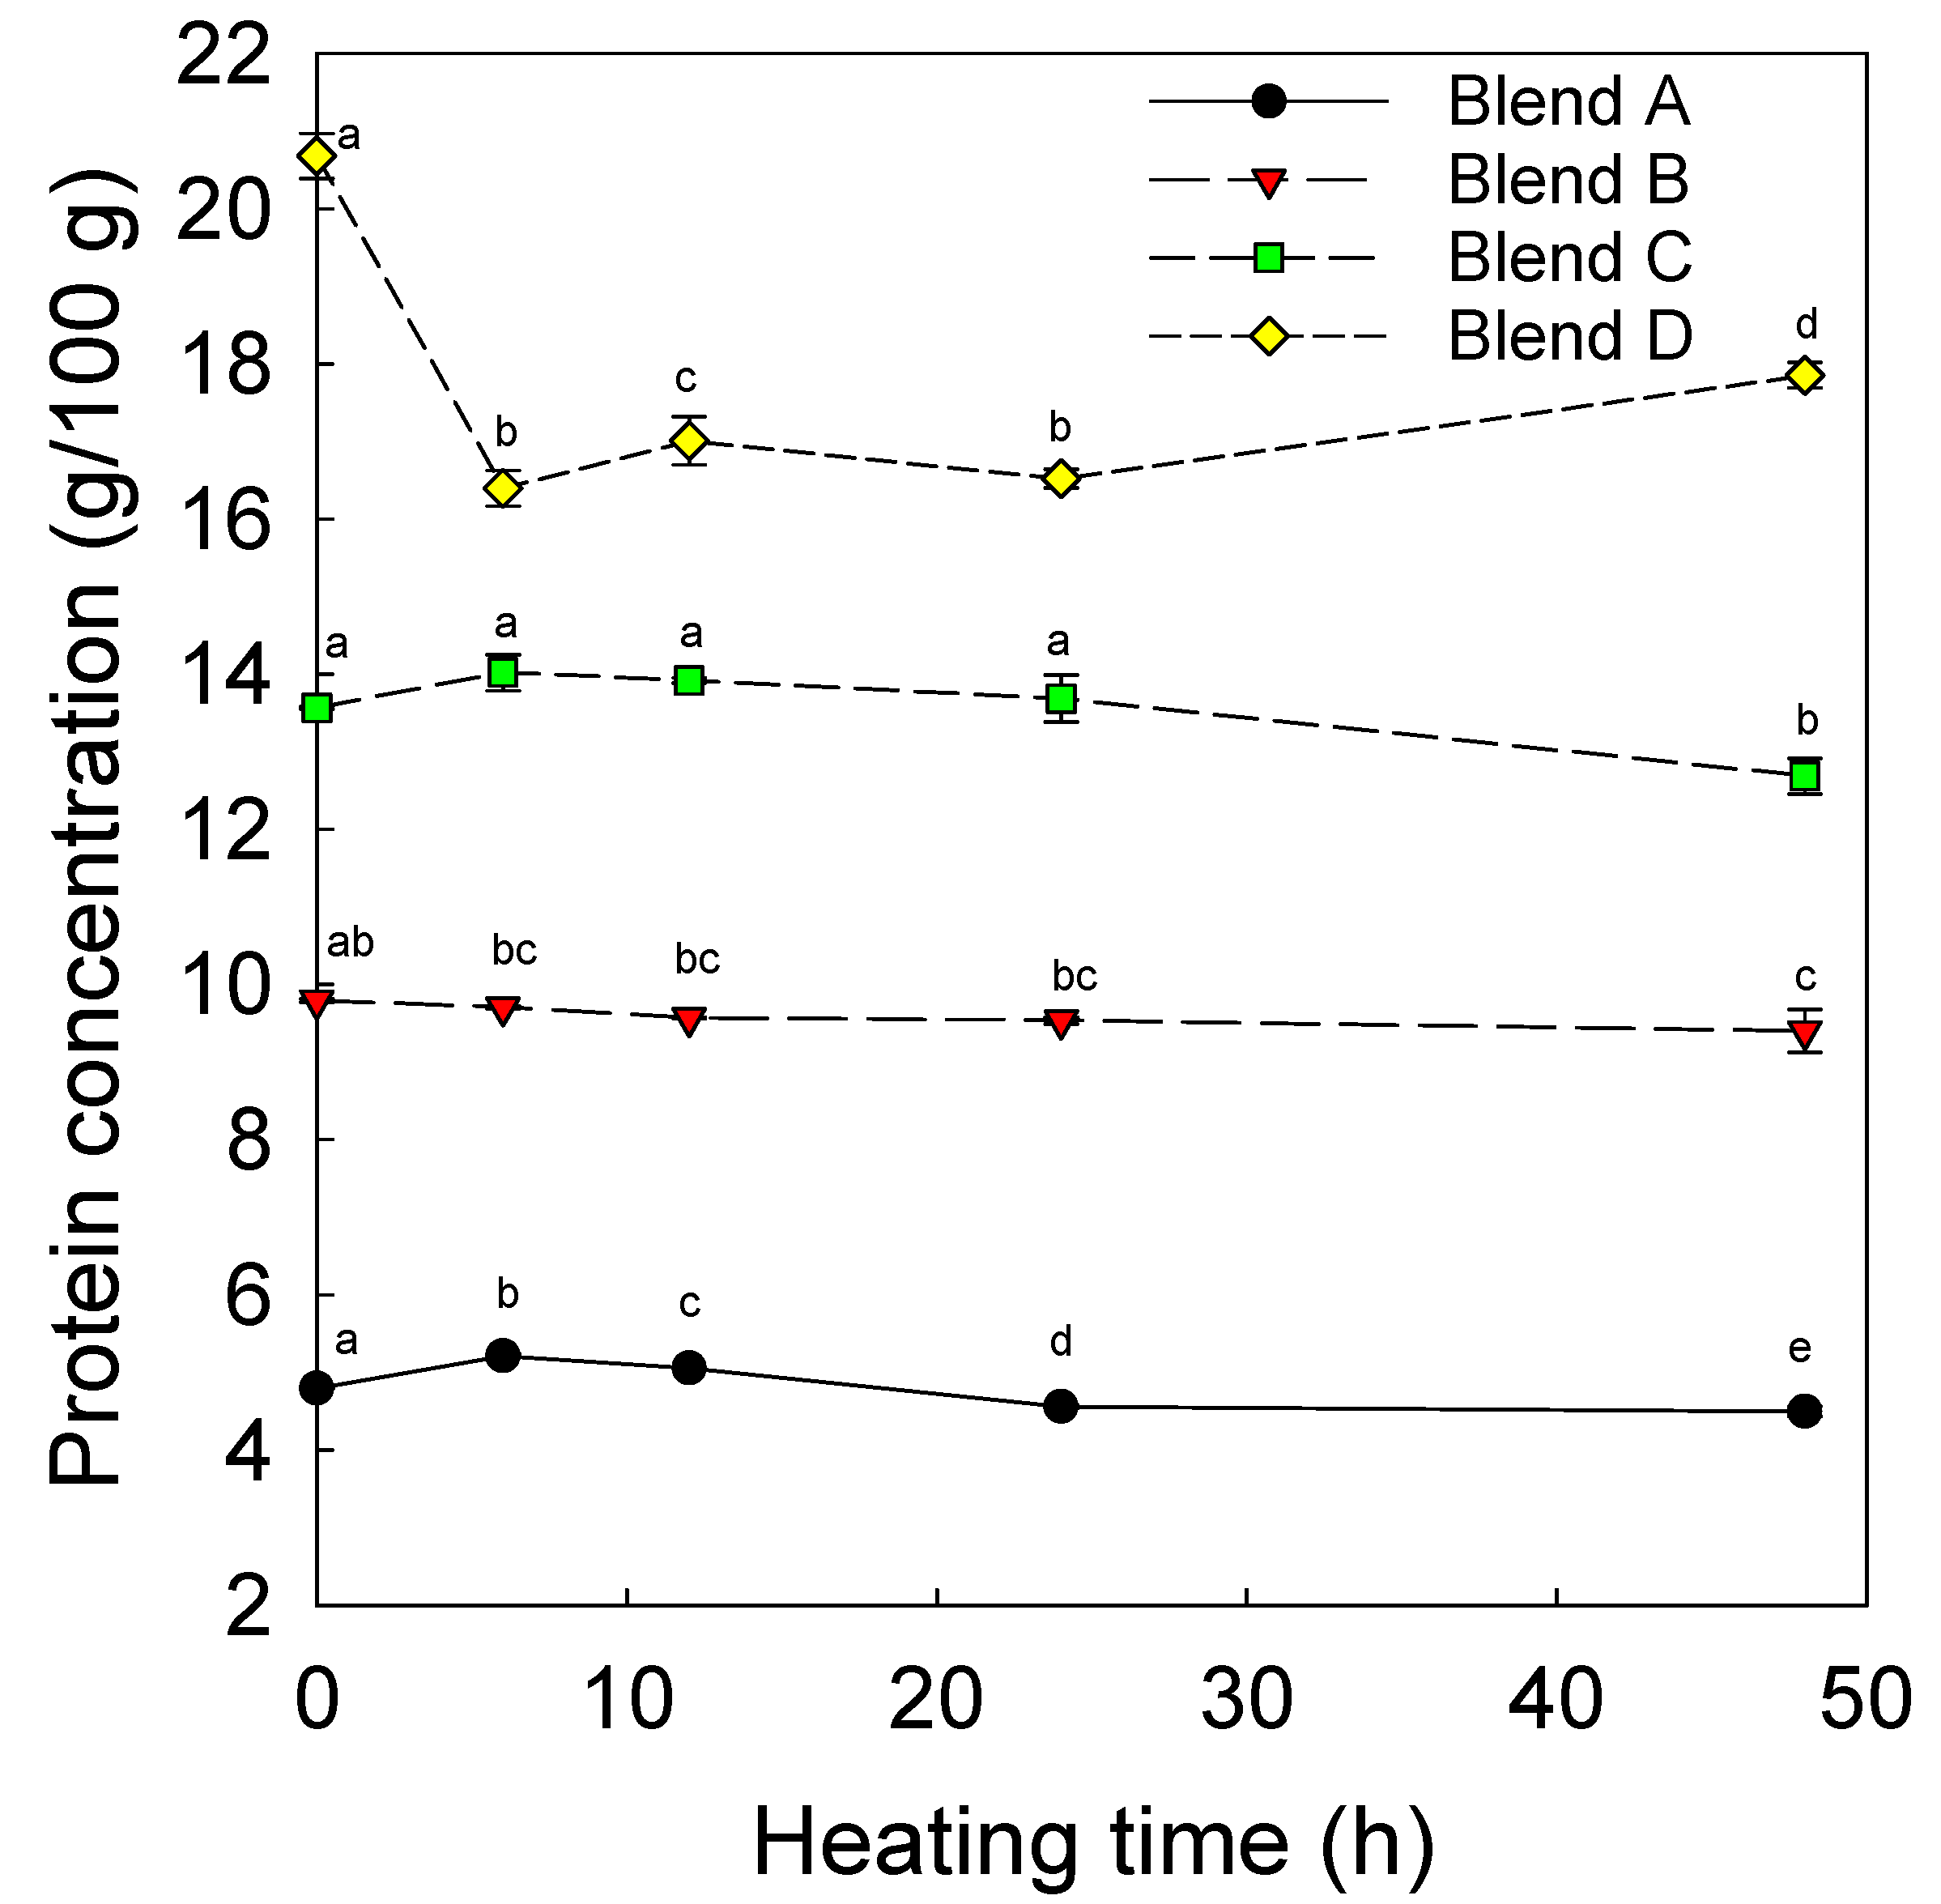
In Figure 3, the protein contents of the different blends are shown as a function of the heating time. All blends showed a significant difference in protein content during heating. Therefore, it appears that the protein content of each mixture fluctuated a little during heating with the exception of mixture D; here, there is a noticeable decrease in protein concentration between 0 and 6 h. (Figure 3). These variations are most likely due to variations in moisture content of the unheated and heated fibers.
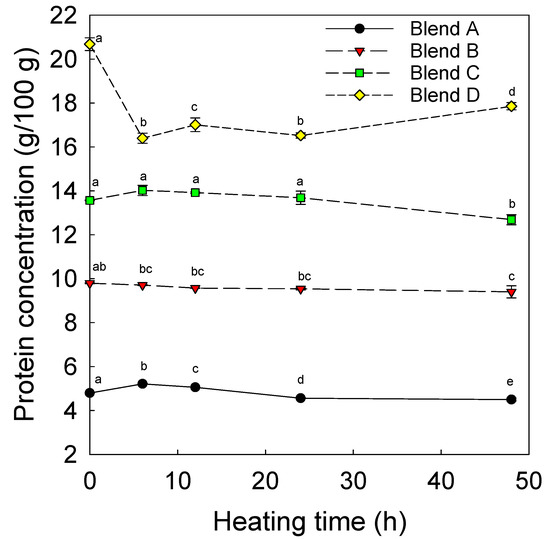
Figure 3.
Protein content (mean ± standard deviation) for electrospun fibers from blend A (80:10:5), B (80:10:10), C (80:10:15), and D (80:10:20) as a function of heating time (the different letters indicate significant differences (p < 0.05).
3.4. Browning Index
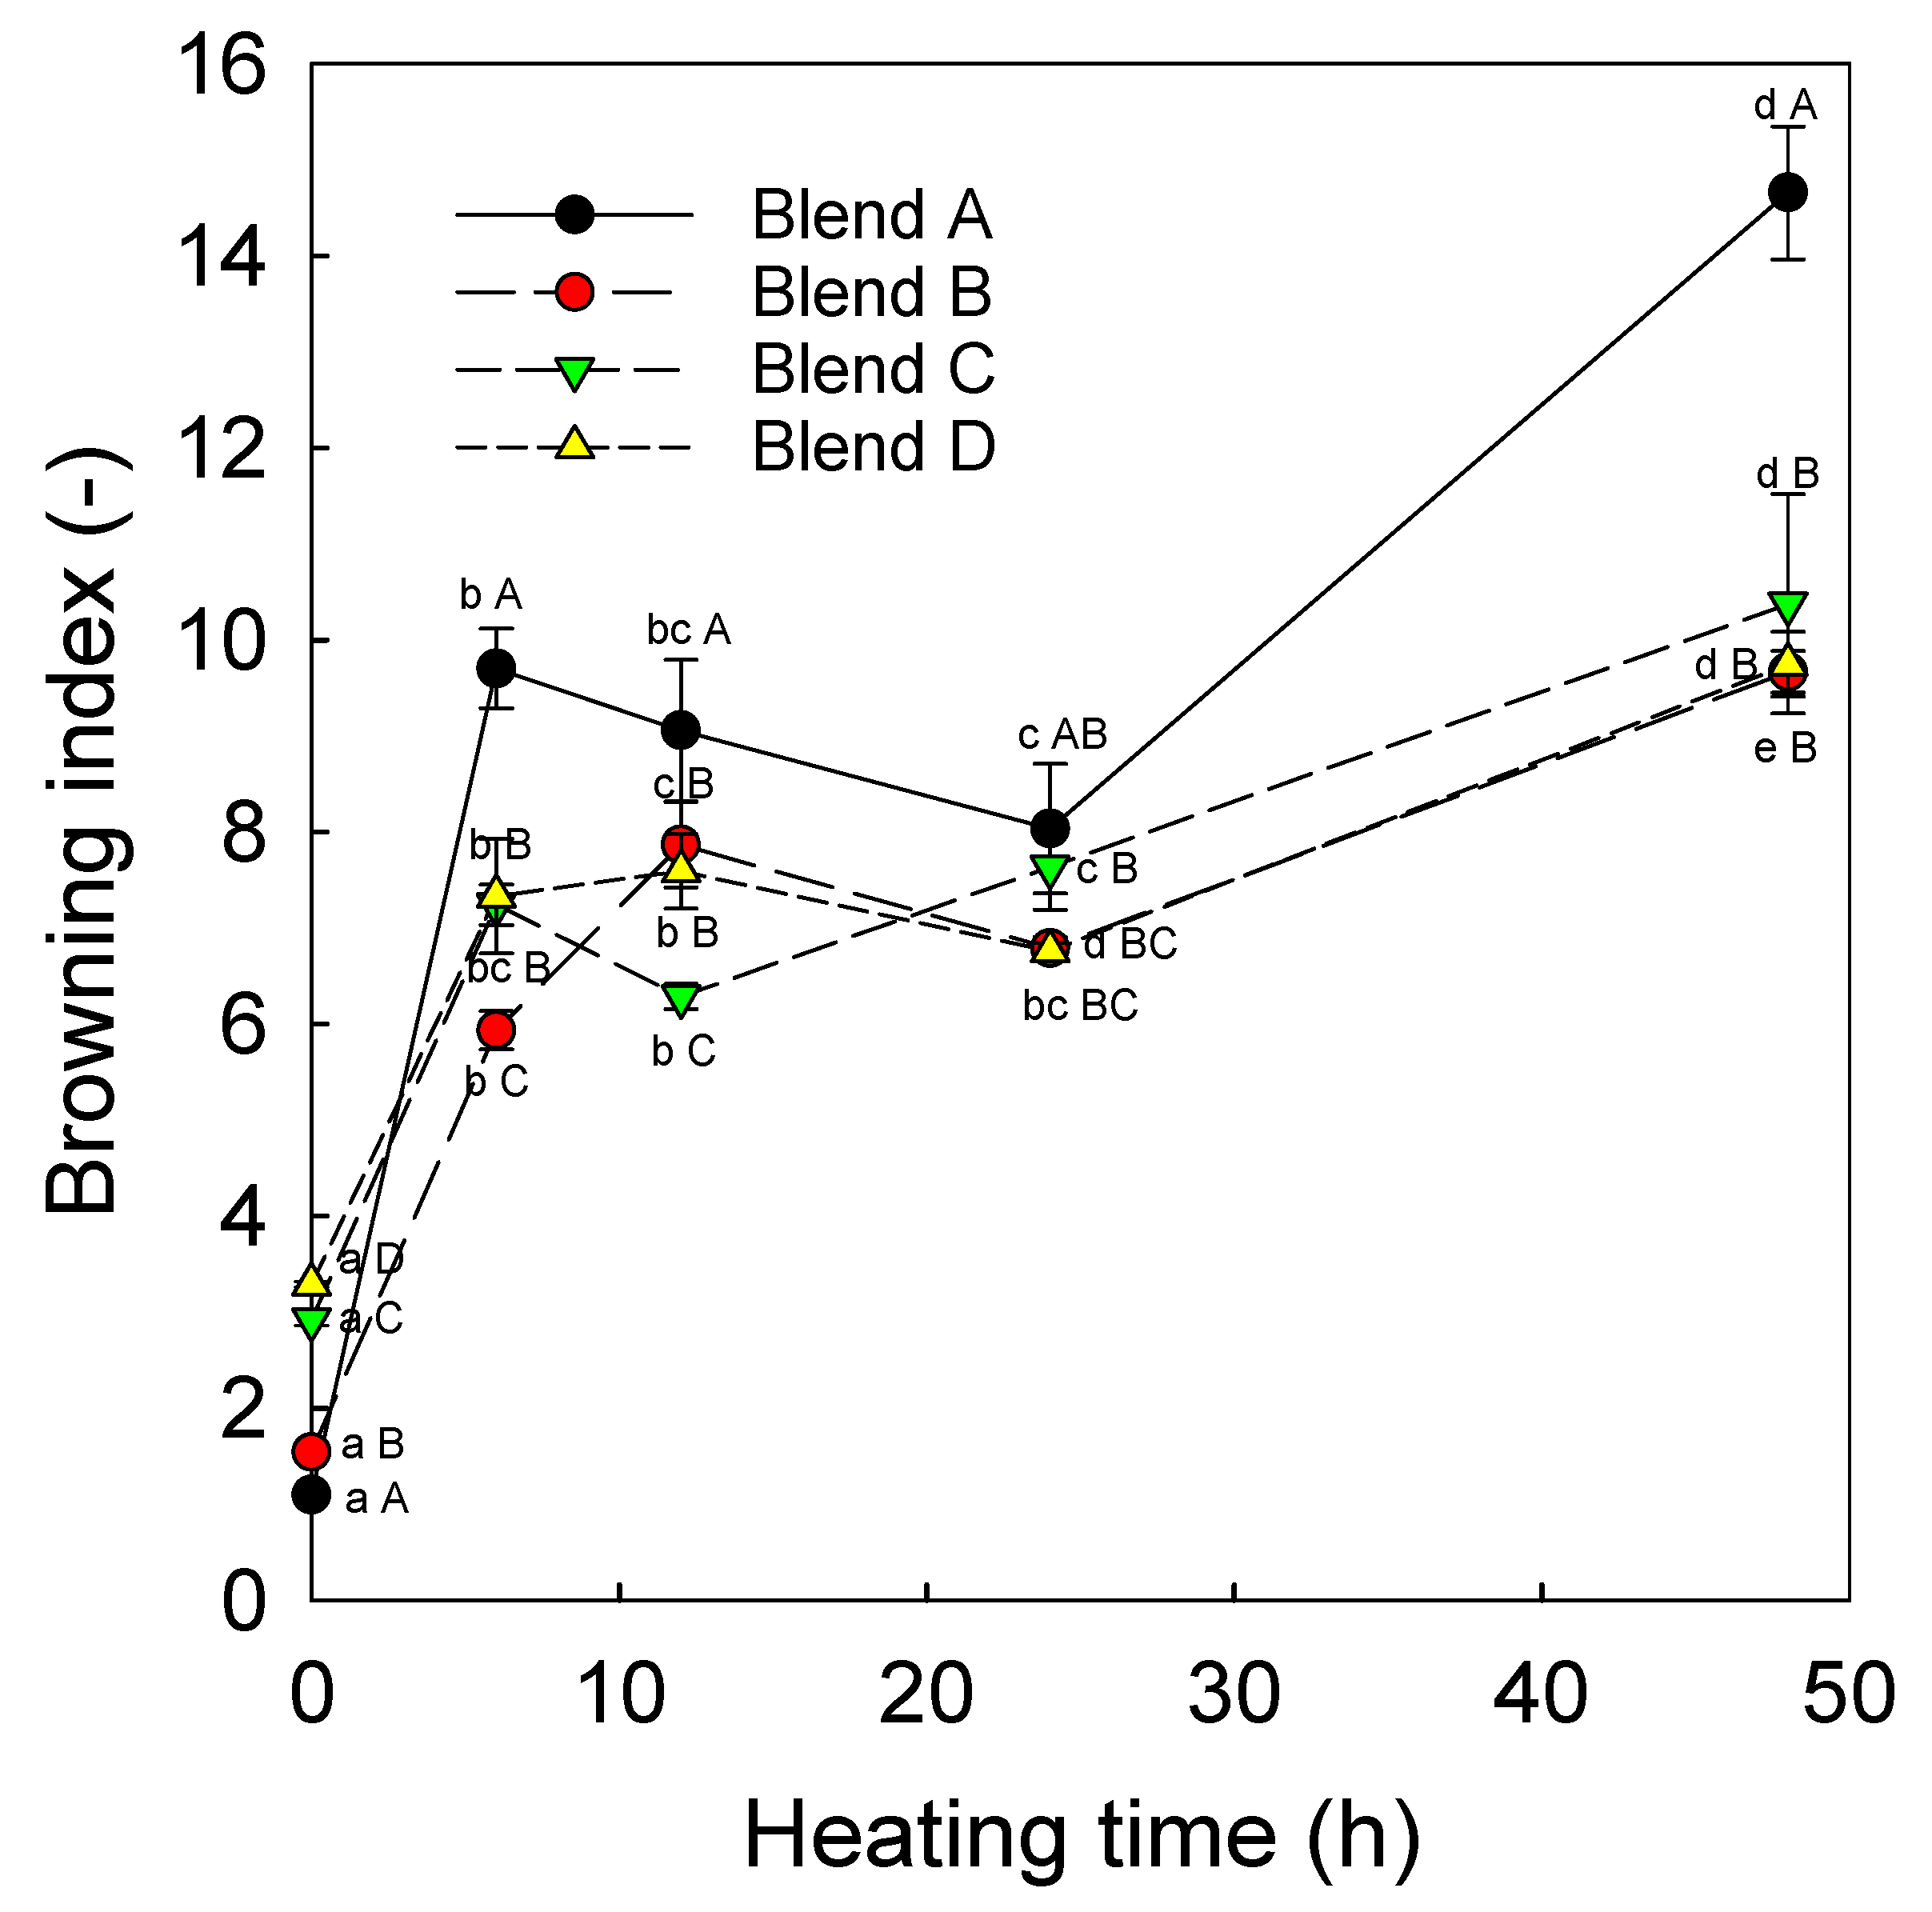
The browning index (BI) is an easily determined indicator for the Maillard reaction between the proteins and the reducing sugars [30]. The BI was calculated (Equations (1) and (2)) using the measured L*a*b* color values (Figure S1) from the unheated and heated fiber samples to detect color active compounds formed during the Maillard reaction. The BI acts as an indirect indicator of the progression of the Maillard reaction. If the focus lays on the glycation of proteins via the first stage of the Maillard reaction, a light and little pigmented sample with a low BI is favorable. If possible, the reaction should be terminated after the Schiff reaction in order to prevent color formation [18]. As expected, the browning index increased within the first 6 h for all blends (Figure 4). Between 6 and 24 h, a slight decrease for all ratios was observed and all samples showed an increase in BI after 48 h heating. However, the BIs of each blend showed mainly significant differences between the unheated and heated fibers (6 up to 24 h) and after 48 h (Figure 4). After 48 h, blends B, C, and D showed similar BIs of approximately 10 without significant difference, whereas the browning index of blend A was significantly higher with 14.7 ± 0.7. One reason for the enhanced browning of blend A could be its very small mean fiber diameter (Figure 1) that might have accelerated the Maillard reaction due to the increased surface. Another potential explanation is the composition of blend A. Due to the lower protein content of blend A, the carbohydrate content was proportionally higher. Some recent studies showed that the carbohydrate content is the limiting factor for Maillard reaction because, in terms of molecular weight, potato protein has more reactive lysine groups than maltodextrin has carbonyl groups [28,38].

Figure 4.
Browning index (mean ± standard deviation) versus the heating time for the different ratios (A (80:10:5), B (80:10:10), C (80:10:15), and D (80:10:20)) of the fibers (the different letters indicate significant differences (p < 0.05) between the heating times of each blend (lowercase) and between blends at the same heating time (upper case)).
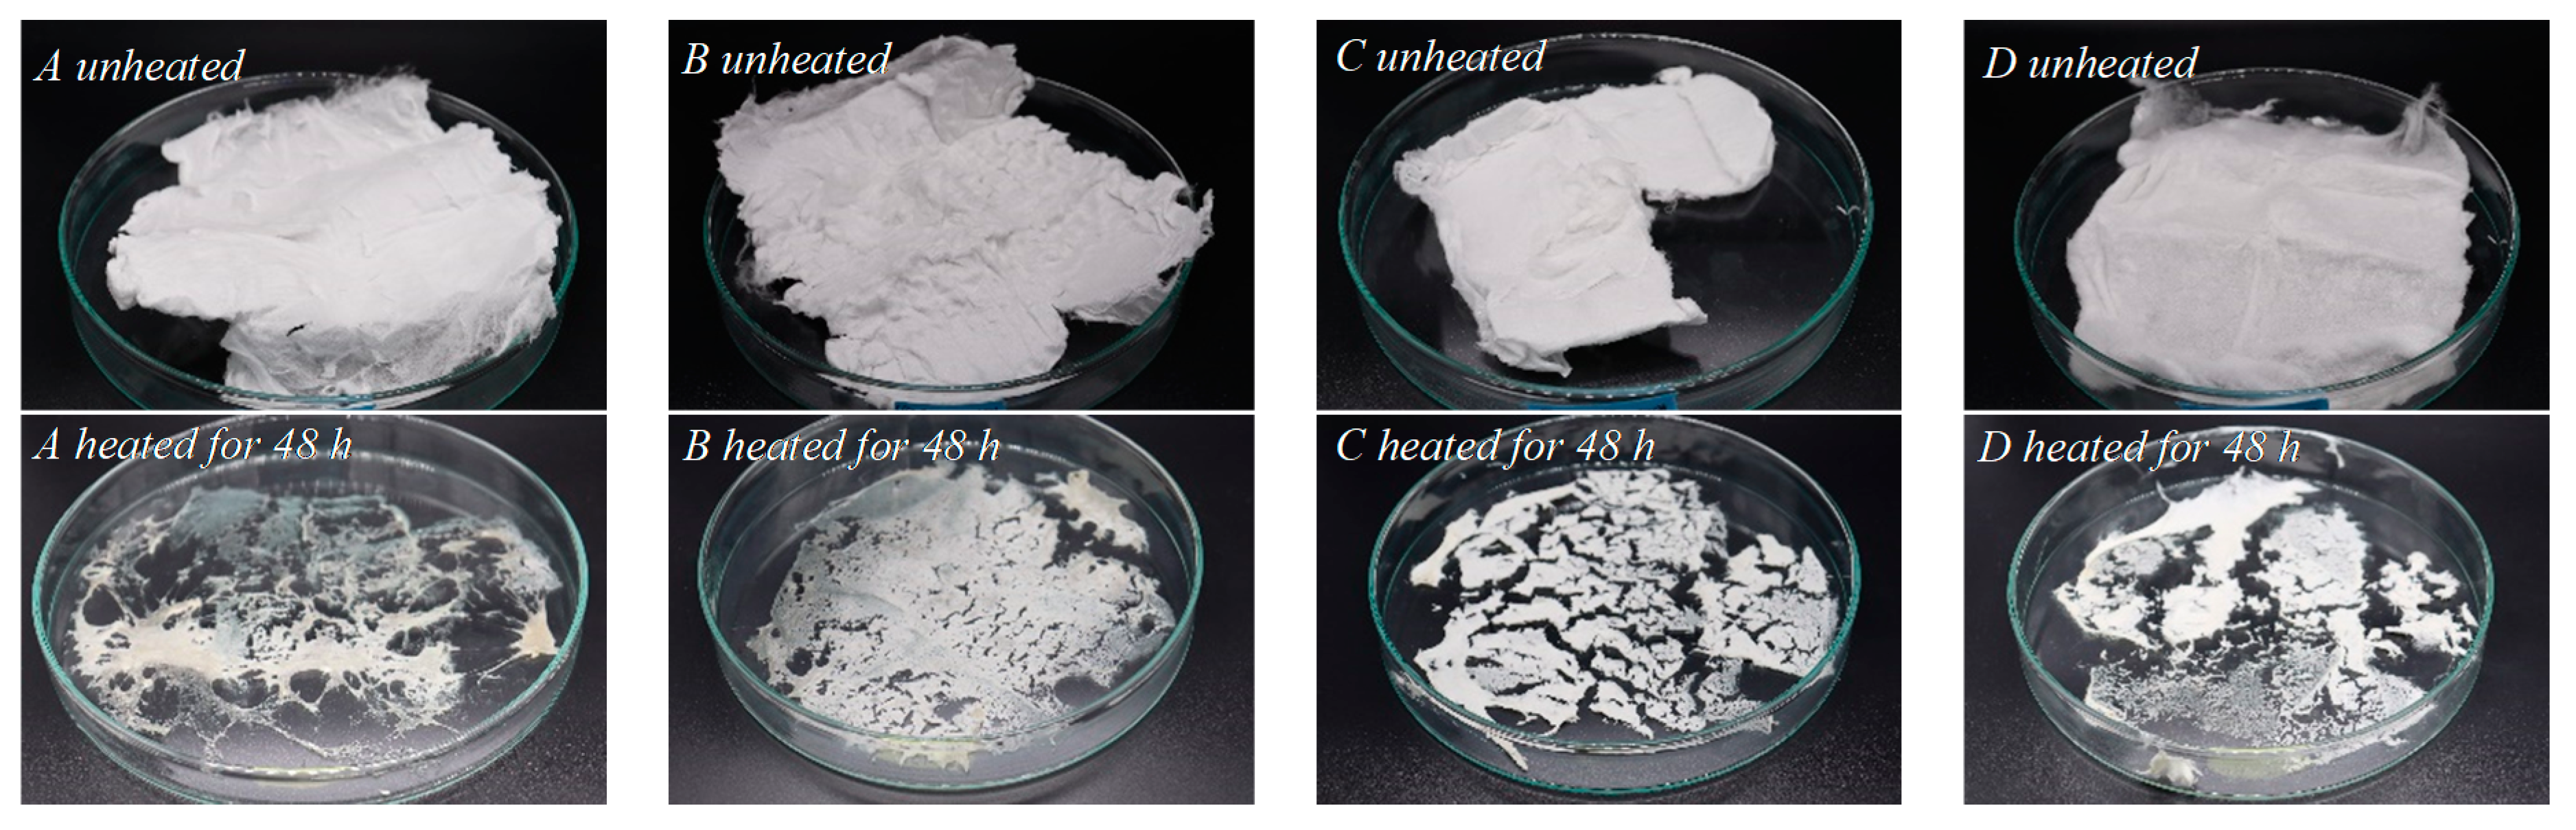
Visual observation of the fiber mats (Figure 5) showed no visible difference between the individual blends of the unheated fibers. All were equally white and voluminous, although the mean values of the browning indices of the unheated fibers showed a significant difference. As shown in Figure 5, after 48 h heating at 65 °C and 75% RH, the fibers shrunk together and developed a very light yellowish/greyish color. The structures of blend A, which had the lowest protein content of 5% w/w, hardened. With increasing protein contents, the heated fibers appeared increasingly porous. After grinding the mats to a powder, a slight brownish, greyish coloration became visible with increasing heating times, which is characteristic of a light degree of nonenzymatic browning [30]. The browning of the heated fibers can be explained by the formation of yellow compounds in the intermediate and brown compounds (melanoidins) in the last stage of the Maillard reaction [40]. Temperature, humidity, and time have a significant effect on browning, which increases with rising temperature and time [30]. The increase in color during heating can be explained by the reaction of carbonyl groups with free amino groups to form a Schiff base. Some intermediates can then polymerize in the further stages of the Maillard reaction and form brown pigments [9,41]. In a study with whey protein and maltodextrin, it was shown that a BI between 10 and 17 corresponded with slight yellow coloration [30]. At a BI of over 25, the products showed a distinct browning [30]. Considering the lack of visible browning of the mats heated for 48 h and the fact that the browning index did not exceed 25, it can be assumed that the third phase of the Maillard reaction was mostly prevented under the given reaction conditions (65 °C, 48 h and 75% RH). Some color was also produced during the first stage of the Maillard reaction, but most of it was only produced during the second intermediate and third advanced final stage, where highly colored, water-insoluble, nitrogenous polymeric compounds called melanoidins were formed [9,42].
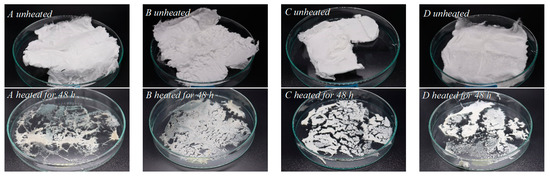
Figure 5.
Photos of the fibers from blend (A) (80:10:5), (B) (80:10:10), (C) (80:10:15) and (D) (80:10:20) unheated and after 48 h of heating at 65 °C and 75% RH.
3.5. FTIR-Spectra
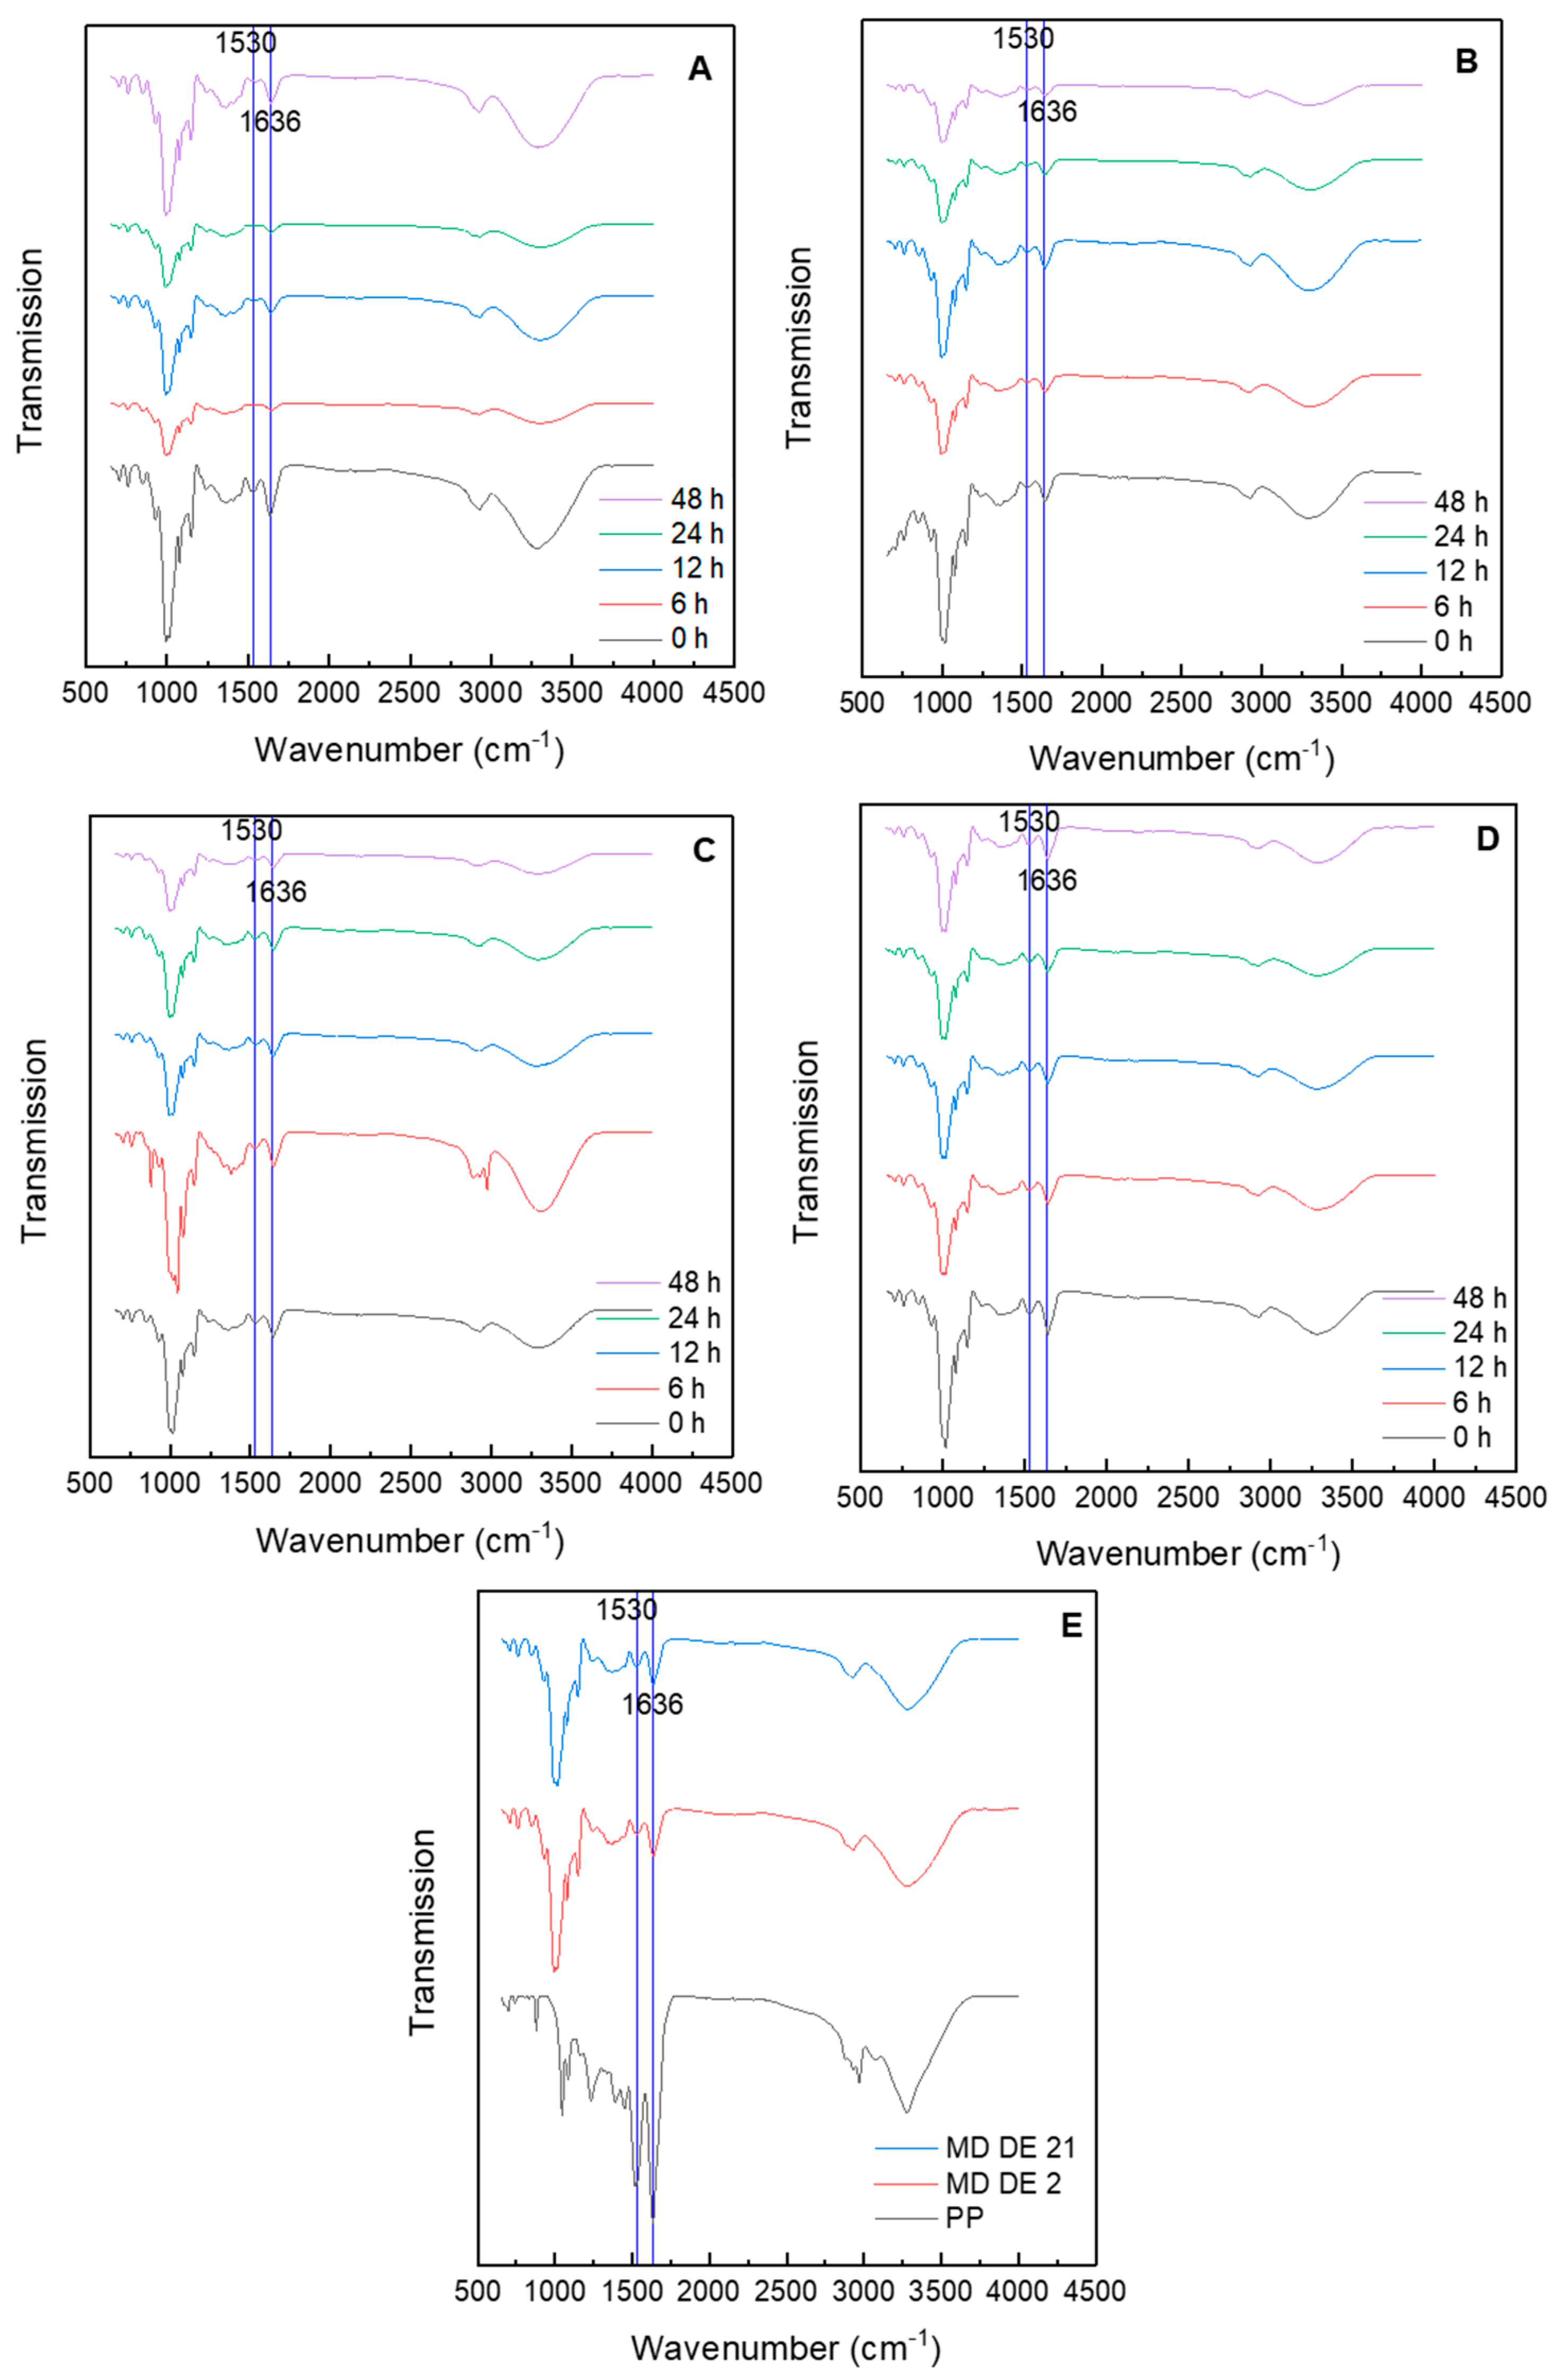
Figure 6 shows the FTIR spectra of the unheated and heated potato protein–maltodextrin fibers after four different heating times (6, 12, 24, 48 h) and the potato protein isolate, maltodextrin DE 21 and DE 2. The major band at 1000 cm−1 was a combination of the vibration of C-O-C glycoside and C-C bonds of pyranoid ring of the glucose monomer, as well as stretching of the C-OH bond of the side group [43]. The peaks around 1636 and 1530 cm−1, belonging to the amide-I and amide-II regions, respectively, showed the proteins. The amide I band was composed of the stretching vibrations of the C-N and C=O groups. The band of the amide II region came from the in-plane N-H bending and the stretching vibrations of the C-N group and the C-C group [44]. After heating the fibers, the amide I band of potato protein–maltodextrin blends shifted toward higher wavenumbers especially in blend A (0.05 g/mL potato protein), from 1636 to 1644 cm−1. All other blends had wavenumbers between 1640 and 1643 cm−1 and no clear shift was observed. The shift was previously attributed to glycation via the first stage of the Maillard reaction during which amino groups are consumed while Schiff bases are formed [44]. It had also been reported that a shift of the amide II region from 1596 to 1581 cm−1 would occur after glycation. However, the shift in the amide II region was not clearly visible. Due to the relatively low protein content of the fibers, the peak of the amide II region was less pronounced at 1530 cm−1 for the unheated fibers and 1540 cm−1 for the heated mixed fibers, and it was not possible to detect a shift in wavenumber between the different heating times (1538–1540 cm−1). It was suggested that the potato protein was not completely homogeneously distributed in the fibers in accordance with a previous study [25].
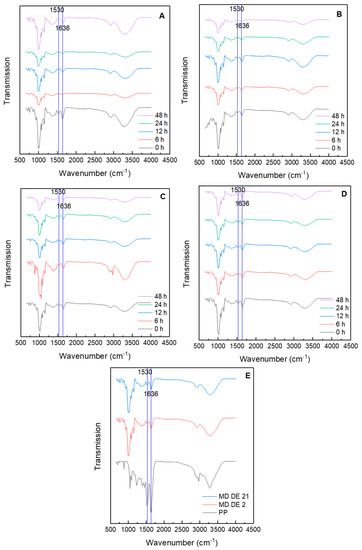
Figure 6.
FTIR spectra of the fibers from blend (A) (80:10:5), (B) (80:10:10), (C) (80:10:15), and (D) (80:10:20) unheated and after 6, 12, 24, and 48 h of heating at 65 °C and 75% RH as well as (E) maltodextrins MD DE21, MD DE 2, and potato protein PP.
4. Conclusions
Electrospinning is a method which can be used to produce nanofibers of proteins and polysaccharides relatively easily and cost-effectively with the help of electrostatic forces. Potato protein–maltodextrin fibers with varying protein contents were successfully spun in a needleless electrospinning device for the first time. It was shown that the production rate, the fiber diameter, and the morphology of the fibers varied with different protein contents. It was also demonstrated that the proteins could be well incorporated into the spun fibers. The degree of browning of all fibers increased after 48 h of heating at 65 °C and 75% RH and a slight yellow color became visible but distinct browning could be prevented. In the future, the potato protein–maltodextrin fibers produced should serve as starting material for glycated proteins that could be considered as possible new emulsifiers. Further studies are forthcoming to investigate the glycation of the potato protein inside the protein–polysaccharide fibers and the resulting effects on its functional and nutritive properties, e.g., on emulsification properties and the possible effect on trypsin inhibitor activity. Further studies are forthcoming.
Supplementary Materials
The following are available online at https://www.mdpi.com/article/10.3390/app11177896/s1, Figure S1: Color measurement of L*-, b*, and a*-values of the different blends (A (80:10:5), B (80:10:10), C (80:10:15), and D (80:10:20)) after thermal treatment (0, 6, 12, 24, and 48 h).
Author Contributions
Conceptualization, M.G. and I.K.; methodology, M.G., I.K. and F.P.; validation, F.P. and M.G.; formal analysis, F.P.; investigation, M.G.; writing—original draft preparation, M.G. and F.P.; writing—review and editing, M.G., J.W. and I.K.; supervision, M.G.; project administration, M.G. and J.W. All authors have read and agreed to the published version of the manuscript.
Funding
This research received no external funding.
Institutional Review Board Statement
Not applicable.
Informed Consent Statement
Not applicable.
Data Availability Statement
Data available on request due to restrictions for privacy or ethical reasons.
Acknowledgments
The authors would like to thank Peter Gschwind and Reinhard Kohlus for the opportunity to take the SEM images (Department of Process Engineering and Food Powders, Institute of Food Science and Biotechnology, University of Hohenheim).
Conflicts of Interest
The authors declare no conflict of interest.
References
- Schieber, A.; Stintzing, F.; Carle, R. By-products of plant food processing as a source of functional compounds—Recent developments. Trends Food Sci. Technol. 2001, 12, 401–413. [Google Scholar] [CrossRef]
- Martín-Alfonso, J.E.; Cuadri, A.A.; Franco, J.M. Development and Characterization of Novel Fibers Based on Potato Protein/Polyethylene Oxide Through Electrospinning. Fibers Polym. 2019, 20, 1586–1593. [Google Scholar] [CrossRef]
- Kofrányi, E.; Jekat, F. Die biologische Wertigkeit von Kartoffelproteinen; VS Verlag für Sozialwissenschaften: Wiesbaden, Germany, 1965; Volume 1582, p. 35. [Google Scholar]
- Waglay, A.; Karboune, S. Chapter 4—Potato Proteins: Functional Food Ingredients. In Advances in Potato Chemistry and Technology, 2nd ed.; Singh, J., Kaur, L., Eds.; Academic Press: San Diego, CA, USA, 2016; pp. 75–104. [Google Scholar]
- Alting, A.C.; Pouvreau, L.; Giuseppin, M.L.F.; van Nieuwenhuijzen, N.H. 12—Potato proteins. In Handbook of Food Proteins; Phillips, G.O., Williams, P.A., Eds.; Woodhead Publishing: Sawston, UK, 2011; pp. 316–334. [Google Scholar]
- van Koningsveld, G.A.; Walstra, P.; Gruppen, H.; Wijngaards, G.; van Boekel, M.A.J.S.; Voragen, A.G.J. Formation and Stability of Foam Made with Various Potato Protein Preparations. J. Agric. Food Chem. 2002, 50, 7651–7659. [Google Scholar] [CrossRef]
- Pots, A.M.; Gruppen, H.; Van Diepenbeek, R.; Van Der Lee, J.J.; Boekel, M.A.J.S.V.; Wijngaards, G.; Voragen, A.G.J. The effect of storage of whole potatoes of three cultivars on the patatin and protease inhibitor content; a study using capillary electrophoresis and MALDI-TOF mass spectrometry. J. Sci. Food Agric. 1999, 79, 1557–1564. [Google Scholar] [CrossRef]
- Kärenlampi, S.O.; White, P.J. Potato proteins, lipids and minerals. In Advances in Potato Chemistry and Technology, 1st ed.; Singh, J., Kaur, L., Eds.; Elsevier Academic Press: Amsterdam, The Netherlands, 2009. [Google Scholar]
- Kutzli, I.; Weiss, J.; Gibis, M. Glycation of Plant Proteins via Maillard Reaction: Reaction Chemistry, Technofunctional Properties, and Potential Food Application. Foods 2021, 10, 376. [Google Scholar] [CrossRef] [PubMed]
- Olías, R.; Becerra-Rodríguez, C.; Soliz-Rueda, J.R.; Moreno, F.J.; Delgado-Andrade, C.; Clemente, A. Glycation affects differently the main soybean Bowman–Birk isoinhibitors, IBB1 and IBBD2, altering their antiproliferative properties against HT29 colon cancer cells. Food Funct. 2019, 10, 6193–6202. [Google Scholar] [CrossRef] [Green Version]
- Aminlari, M.; Ramezani, R.; Jadidi, F. Effect of Maillard-based conjugation with dextran on the functional properties of lysozyme and casein. J. Sci. Food Agric. 2005, 85, 2617–2624. [Google Scholar] [CrossRef]
- Kato, A.; Sato, T.; Kobayashi, K. Emulsifying Properties of Protein–Polysaccharide Complexes and Hybrids. Agric. Biol. Chem. 1989, 53, 2147–2152. [Google Scholar] [CrossRef]
- Liu, J.; Ru, Q.; Ding, Y. Glycation a promising method for food protein modification: Physicochemical properties and structure, a review. Food Res. Int. 2012, 49, 170–183. [Google Scholar] [CrossRef]
- van Boekel, M.A.J.S. Kinetic aspects of the Maillard reaction: A critical review. Nahrung Food 2001, 45, 150–159. [Google Scholar] [CrossRef]
- Martins, S.I.; Jongen, W.M.; van Boekel, M.A. A review of Maillard reaction in food and implications to kinetic modelling. Trends Food Sci. Technol. 2000, 11, 364–373. [Google Scholar] [CrossRef]
- Zhu, D.; Damodaran, S.; Lucey, J.A. Formation of Whey Protein Isolate (WPI)—Dextran Conjugates in Aqueous Solutions. J. Agric. Food Chem. 2008, 56, 7113–7118. [Google Scholar] [CrossRef] [PubMed]
- De Oliveira, F.C.; Coimbra, J.S.D.R.; de Oliveira, E.B.; Zuñiga, A.D.G.; Garcia-Rojas, E.E. Food Protein-polysaccharide Conjugates Obtained via the Maillard Reaction: A Review. Crit. Rev. Food Sci. Nutr. 2013, 56, 1108–1125. [Google Scholar] [CrossRef]
- Baier, S.; Given, P.; Kanjanapongkul, K.; Weiss, J. Formation of Conjugated Protein by Electrospinning. U.S. Patent 20130264731A1, 10 October 2013. [Google Scholar]
- Weiss, J.; Kanjanapongkul, K.; Wongsasulak, S.; Yoovidhya, T. Electrospun fibers: Fabrication, functionalities and potential food industry applications. In Nanotechnology in the Food, Beverage and Nutraceutical Industries; Elsevier: Amsterdam, The Netherlands, 2012; pp. 362–397. [Google Scholar] [CrossRef]
- Kutzli, I.; Griener, D.; Gibis, M.; Grossmann, L.; Baier, S.K.; Weiss, J. Improvement of emulsifying behavior of pea proteins as plant-based emulsifiers via Maillard-induced glycation in electrospun pea protein–maltodextrin fibers. Food Funct. 2020, 11, 4049–4056. [Google Scholar] [CrossRef]
- Turan, D.; Gibis, M.; Gunes, G.; Baier, S.K.; Weiss, J. The impact of the molecular weight of dextran on formation of whey protein isolate (WPI)–dextran conjugates in fibers produced by needleless electrospinning after annealing. Food Funct. 2018, 9, 2193–2200. [Google Scholar] [CrossRef]
- Kutzli, I.; Gibis, M.; Baier, S.K.; Weiss, J. Fabrication and characterization of food-grade fibers from mixtures of maltodextrin and whey protein isolate using needleless electrospinning. J. Appl. Polym. Sci. 2018, 135, 46328. [Google Scholar] [CrossRef]
- Subbiah, T.; Bhat, G.S.; Tock, R.W.; Parameswaran, S.; Ramkumar, S.S. Electrospinning of nanofibers. J. Appl. Polym. Sci. 2005, 96, 557–569. [Google Scholar] [CrossRef]
- Gupta, P.; Elkins, C.; Long, T.E.; Wilkes, G.L. Electrospinning of linear homopolymers of poly(methyl methacrylate): Exploring relationships between fiber formation, viscosity, molecular weight and concentration in a good solvent. Polymer 2005, 46, 4799–4810. [Google Scholar] [CrossRef]
- Kutzli, I.; Gibis, M.; Baier, S.K.; Weiss, J. Electrospinning of whey and soy protein mixed with maltodextrin—Influence of protein type and ratio on the production and morphology of fibers. Food Hydrocoll. 2019, 93, 206–214. [Google Scholar] [CrossRef]
- Shenoy, S.L.; Bates, W.D.; Frisch, H.L.; Wnek, G.E. Role of chain entanglements on fiber formation during electrospinning of polymer solutions: Good solvent, non-specific polymer–polymer interaction limit. Polymer 2005, 46, 3372–3384. [Google Scholar] [CrossRef]
- Yarin, A.; Zussman, E. Upward needleless electrospinning of multiple nanofibers. Polymer 2004, 45, 2977–2980. [Google Scholar] [CrossRef]
- Kutzli, I.; Griener, D.; Gibis, M.; Schmid, C.; Dawid, C.; Baier, S.K.; Hofmann, T.; Weiss, J. Influence of Maillard reaction conditions on the formation and solubility of pea protein isolate-maltodextrin conjugates in electrospun fibers. Food Hydrocoll. 2019, 101, 105535. [Google Scholar] [CrossRef]
- Ebert, S.; Gibis, M.; Terjung, N.; Weiss, J. Survey of aqueous solubility, appearance, and pH of plant protein powders from carbohydrate and vegetable oil production. LWT 2020, 133, 110078. [Google Scholar] [CrossRef]
- Martinez-Alvarenga, M.; Martinez-Rodriguez, E.; Garcia-Amezquita, L.E.; Olivas, G.; Zamudio-Flores, P.; Acosta-Muniz, C.; Sepulveda, D. Effect of Maillard reaction conditions on the degree of glycation and functional properties of whey protein isolate—Maltodextrin conjugates. Food Hydrocoll. 2014, 38, 110–118. [Google Scholar] [CrossRef]
- Kriegel, C.; Arrechi, A.; Kit, K.; McClements, D.; Weiss, J. Fabrication, Functionalization, and Application of Electrospun Biopolymer Nanofibers. Crit. Rev. Food Sci. Nutr. 2008, 48, 775–797. [Google Scholar] [CrossRef]
- Mendes, A.C.L.; Stephansen, K.; Chronakis, I.S. Electrospinning of food proteins and polysaccharides. Food Hydrocoll. 2017, 68, 53–68. [Google Scholar] [CrossRef]
- Cengiz-Çallıoǧlu, F.; Jirsak, O.; Dayik, M. Investigation into the relationships between independent and dependent parameters in roller electrospinning of polyurethane. Text. Res. J. 2012, 83, 718–729. [Google Scholar] [CrossRef]
- Dosunmu, O.; Chase, G.G.; Kataphinan, W.; Reneker, D.H. Electrospinning of polymer nanofibres from multiple jets on a porous tubular surface. Nanotechnology 2006, 17, 1123–1127. [Google Scholar] [CrossRef] [PubMed]
- Pham, Q.P.; Sharma, U.; Mikos, A.G. Electrospinning of Polymeric Nanofibers for Tissue Engineering Applications: A Review. Tissue Eng. 2006, 12, 1197–1211. [Google Scholar] [CrossRef] [PubMed] [Green Version]
- Kumar, T.S.M.; Kumar, K.S.; Rajini, N.; Siengchin, S.; Ayrilmis, N.; Rajulu, A.V. A comprehensive review of electrospun nanofibers: Food and packaging perspective. Compos. Part B Eng. 2019, 175, 107074. [Google Scholar] [CrossRef]
- Haghi, A.K.; Akbari, M. Trends in electrospinning of natural nanofibers. Phys. Status Solidi 2007, 204, 1830–1834. [Google Scholar] [CrossRef]
- Kutzli, I.; Beljo, D.; Gibis, M.; Baier, S.K.; Weiss, J. Effect of Maltodextrin Dextrose Equivalent on Electrospinnability and Glycation Reaction of Blends with Pea Protein Isolate. Food Biophys. 2019, 15, 206–215. [Google Scholar] [CrossRef]
- Ramakrishna, S. An Introduction to Electrospinning and Nanofibers; World Scientific: Singapore, 2005; p. 382. [Google Scholar]
- Hodge, J.E. Dehydrated Foods, Chemistry of Browning Reactions in Model Systems. J. Agric. Food Chem. 1953, 1, 928–943. [Google Scholar] [CrossRef]
- Lertittikul, W.; Benjakul, S.; Tanaka, M. Characteristics and antioxidative activity of Maillard reaction products from a porcine plasma protein–glucose model system as influenced by pH. Food Chem. 2007, 100, 669–677. [Google Scholar] [CrossRef]
- Friedman, M. Food Browning and Its Prevention: An Overview. J. Agric. Food Chem. 1996, 44, 631–653. [Google Scholar] [CrossRef]
- Kacuráková, M.; Capek, P.; Sasinková, V.; Wellner, N.; Ebringerová, A. FT-IR study of plant cell wall model compounds: Pectic polysaccharides and hemicelluloses. Carbohydr. Polym. 2000, 43, 195–203. [Google Scholar] [CrossRef]
- Arrondo, J.L.R.; Muga, A.; Castresana, J.; Goñi, F.M. Quantitative studies of the structure of proteins in solution by fourier-transform infrared spectroscopy. Prog. Biophys. Mol. Biol. 1993, 59, 23–56. [Google Scholar] [CrossRef]
Publisher’s Note: MDPI stays neutral with regard to jurisdictional claims in published maps and institutional affiliations. |
© 2021 by the authors. Licensee MDPI, Basel, Switzerland. This article is an open access article distributed under the terms and conditions of the Creative Commons Attribution (CC BY) license (https://creativecommons.org/licenses/by/4.0/).