Abstract
Energy consumption in Bangladesh increased for economic, industrial, and digitalization growth. Reductions in conventional sources such as natural gas (54%) and coal (5.6%) are calls to enhance renewable resources. This paper aims to investigate the atmospheric variables for potential wind zones and develop a statistical power-forecasting model. The study-site is Bangladesh, focusing on eight divisions across two regions. First, the southern zone includes Dhaka (Capital), Chittagong, Barishal, and Khulna. The northern regions are Rajshahi, Rangpur, Mymensingh, and Sylhet. This investigation illustrates wind (m/s) speeds at various heights (m) and analyzes the boundary layer height (BLH) from the European Center for Medium Range Weather Forecast reanalysis 5th generation (ERA5). The data is from a period of 40 years from 1979 to 2018, assessing with a climatic base of 20 years (1979 to 2000). The climatological analysis comprises trends, time series, anomalies, and linear correlations. The results for the wind speed (BLH) indicate that the weakest (lower) and strongest (higher) regions are Sylhet and Barishal, respectively. Based on power-curve relationships, a simple power predictive model (SPPM) is developed using global wind atlas (GWA) data (sample: 1100) to estimate the power density (W/m2) and found an accuracy of 0.918 and 0.892 for Exponential (EXP) and Polynomial (PN) with mean absolute percentage errors (MAPE) of 22.92 and 21.8%, respectively. For validation, SPPM also forecasts power incorporating historical observations for Chittagong and obtains correlations of 0.970 and 0.974 for EXP and PN with a MAPE of 10.26 and 7.69% individually. Furthermore, calculations for annual energy production reveal an average megawattage of 1748 and 1070 in the southern and northern regions, with an MAPE of 15.71 and 5.85% for EXP and PN models, except Sylhet. The SPPM’s predictability can be improved with observed wind speeds and turbine types. The research wishes to apply SPPM for estimating energy in operational power plants.
1. Introduction
Energy is a key necessity for economic growth and comfortable lifestyles around the world from developed to developing countries. Globally, 28.3% of exported goods are covered by fuel from 60 countries [1]. As global population and energy demand are increasing, only 10% of the overall energy is utilized from alternative resources such as wind and solar in 2020 [2]. The development in renewable energy (RE) sectors is also racing in order to meet sustainable development goals (SDGs). The global emphasis in SDGs and RE has also driven Bangladesh in policies and research for enhancing alternative energy sectors. In 2020, the Bangladesh Power Development Board (BPDP) provided detailed information for energy sources where RE counts only 0.19% for solar and 1.13% for hydropower, respectively. The main sources are natural gas (53.86%), furnace oil (27.18%), diesel (6.33%), coal (5.62%), and imported energy (5.69%), meeting about 58% of the country’s population with grid-line connections [3]. In addition, wind energy is almost negligible, and only a few power plants (barely operational) are limited to coastal regions. For instance, Grameen Shakti set up four wind generators to produce energy for cyclone shelters [4,5]. Thus, there is a strong need from the growing population and the SDGs for investigating and establishing potential eco-friendly energy sources such as wind.
Bangladesh Meteorological Department (BMD) observes wind only at a 10-m (10 m) height. These data are also sparse, i.e., only limited to 34 stations. Weather and climate systems in Bangladesh are influenced by both tropical and subtropical regions. A climatological analysis was conducted for examining probable wind resources around a port city and islands. Remote sensing data (daily) located at a latitude of 20 to 24° N and a longitude of 87.5 to 93.5° E in the Bay of Bengal (BoB) region incorporated wind at 10 m from 1990 to 2016. Results concluded that turbine installations could be possible in hilly regions and open islands to facilitate RE in remote areas [4]. Typically, wind intensity is characterized by two dominant characteristics: diurnal and seasonal variations. In addition to the chaotic behaviors of wind, the diurnal variation shows a maximum in the afternoon and a minimum in the morning [4,5,6,7,8,9]. This means that harvesting wind energy is mostly applicable during the afternoon period. On the other hand, seasonal variability in low-pressure systems and storm wind speed is at its maximum in summer (April–Sepetember) and its minimum during winter (October–March). This refers to a possibility for maximum wind power generation during monsoons in Bangladesh with suitable turbine technology. The large-scale atmospheric circulation is dominated by southwesterly trade winds and sea breezes in summer, while gentle northeasterly trade winds and land breeze dominate in winter [4,5,6,7,8,9]. This signifies a uniform wind direction that can help wind power plants.
Earlier studies extensively explored coastal and hilly regions for potential wind resources to locate either wind or hybrid electricity generation plants [10,11,12,13]. The focused sites are pre-dominated on Chittagong, Rangamati, Kutubdia, Coxs’ bazar, Teknaf, Sitakundu, Khagrachari, and Kuakata [4,5,6,7,8,9,10,11,12,13,14]. Though this investigation shows a decent wind speed for coastal regions in the range of 5 to 8 m per second (m/s), the northern regions consist of riverside that remains underrepresented. Additionally, a statistical approach such as a Weibull distribution is utilized to approximate wind intensity for estimating potential power density. A Weibull distribution is a probability density function (PDF) with scale factor (c) and shape parameter (k) that has applications in weather forecasts, wind to power estimations, survival analysis, and engineering sectors. The mathematical derivations for Weibull PDF are well explained in [10,11,12,13,14,15]. However, Wind-Mind Internationals (WMI) conducted a baseline study for harvesting wind energy in Bangladesh. The findings reported an annual onshore and offshore wind intensity of 5 and 6 m/s, respectively, at 50 m [16]. Consequently, investigating wind for gentle speeds is important to assess to expand the potential energy for riverside regions as well with suitable height in particular location.
From the above literature, two significant aspects are underlined such as seasonal variations in wind speeds and Weibull PDF for power estimation. However, these discoveries limit the study regions only to coastal areas and up to 30 m heights. Similar to WMI, the U.S. Department of Energy (USDE) reported potential wind resources and feasibility for installing power plants over Bangladesh. This empirical investigation summarized wind resources at various heights (up to 200 m) and diverse locations by numerical modelling, onsite observations (seven meteorological towers, one remote sensing, and a sonic detection), and accuracy of power generation [17]. This opens a platform to include onshore regions for potential wind resources assessment. Moreover, Global Wind Atlas (GWA) estimates wind resource and potential power mapping around the globe and sub-regions. GWA datasets also encourage employing wind and power to model energy forecasts. Both USDE and GWA resources are significant to understand mean wind and power relations for maximizing RE production in Bangladesh. As energy demands are projected to double in the future, energy sectors are required to incorporate sustainable production with emerging tools and expertise.
Recent technologies in RE are constantly evolving for converting efficiencies with new materials to harvest power. For instance, in photovoltaic (PV) applications, a computationally efficient approach for a DC–DC converter is developed to detect the steady-state for PV devices [18]. This type of new finding encourages researchers to revisit potential locations for applying RE sources such as wind, solar, or hybrid energy and approximating energy production. Since most studies, particularly in this region, approximate either power density based with 50% accuracy [14] or theoretical outputs [19], this shows a gap in both energy forecasts and annual production. There are several applications on wind power prediction by either physical, statistical, or hybrid methods [20,21,22]. Notable studies are also found in fitting wind speeds and energy based on polynomial regression models [23,24,25,26]. The approach by nonlinear polynomial functions outperforms for fitting both unimodal and multimodal wind distributions, power-curve, and forecasts by utilizing either synthetic or historical data [22,23,24,25,26]. These statistical modellings and findings also have over 90% accuracy and 0.97 for the determination of coefficients in power forecasts.
Thus, in the context of Bangladesh, the above studies illustrate that RE production is inevitable to meet growing energy demands as well as to sustain the environment. As technologies are advancing and expanding significantly, continuous efforts will put RE productions forward with affordable costs for developing countries such as Bangladesh. Current enhancements in computational resources demonstrate wind power estimation for both physical and statistical techniques. As previous studies limit their findings in estimating power at coastal regions in Bangladesh, this paper aims to extend detailed and systematic analyses in onshore wind resources for energy potential. Likewise, the study also attempts to develop a general power estimation model by applying GWA datasets that can be applied for operational uses. Finally, this paper addresses how Bangladesh can lead annual energy production both onshore and offshore at a small and/or large-scale. Therefore, this current research explores wind speeds and boundary layer heights in various cities and optimizes suitable turbine hub heights. The analyses include trends, anomalies, and linear correlations for enhancing accuracy and feasibility for wind resources and annual energy production. The paper is outlined as follows: study-site, materials and methods, results and discussions, and concluding remarks with future directions.
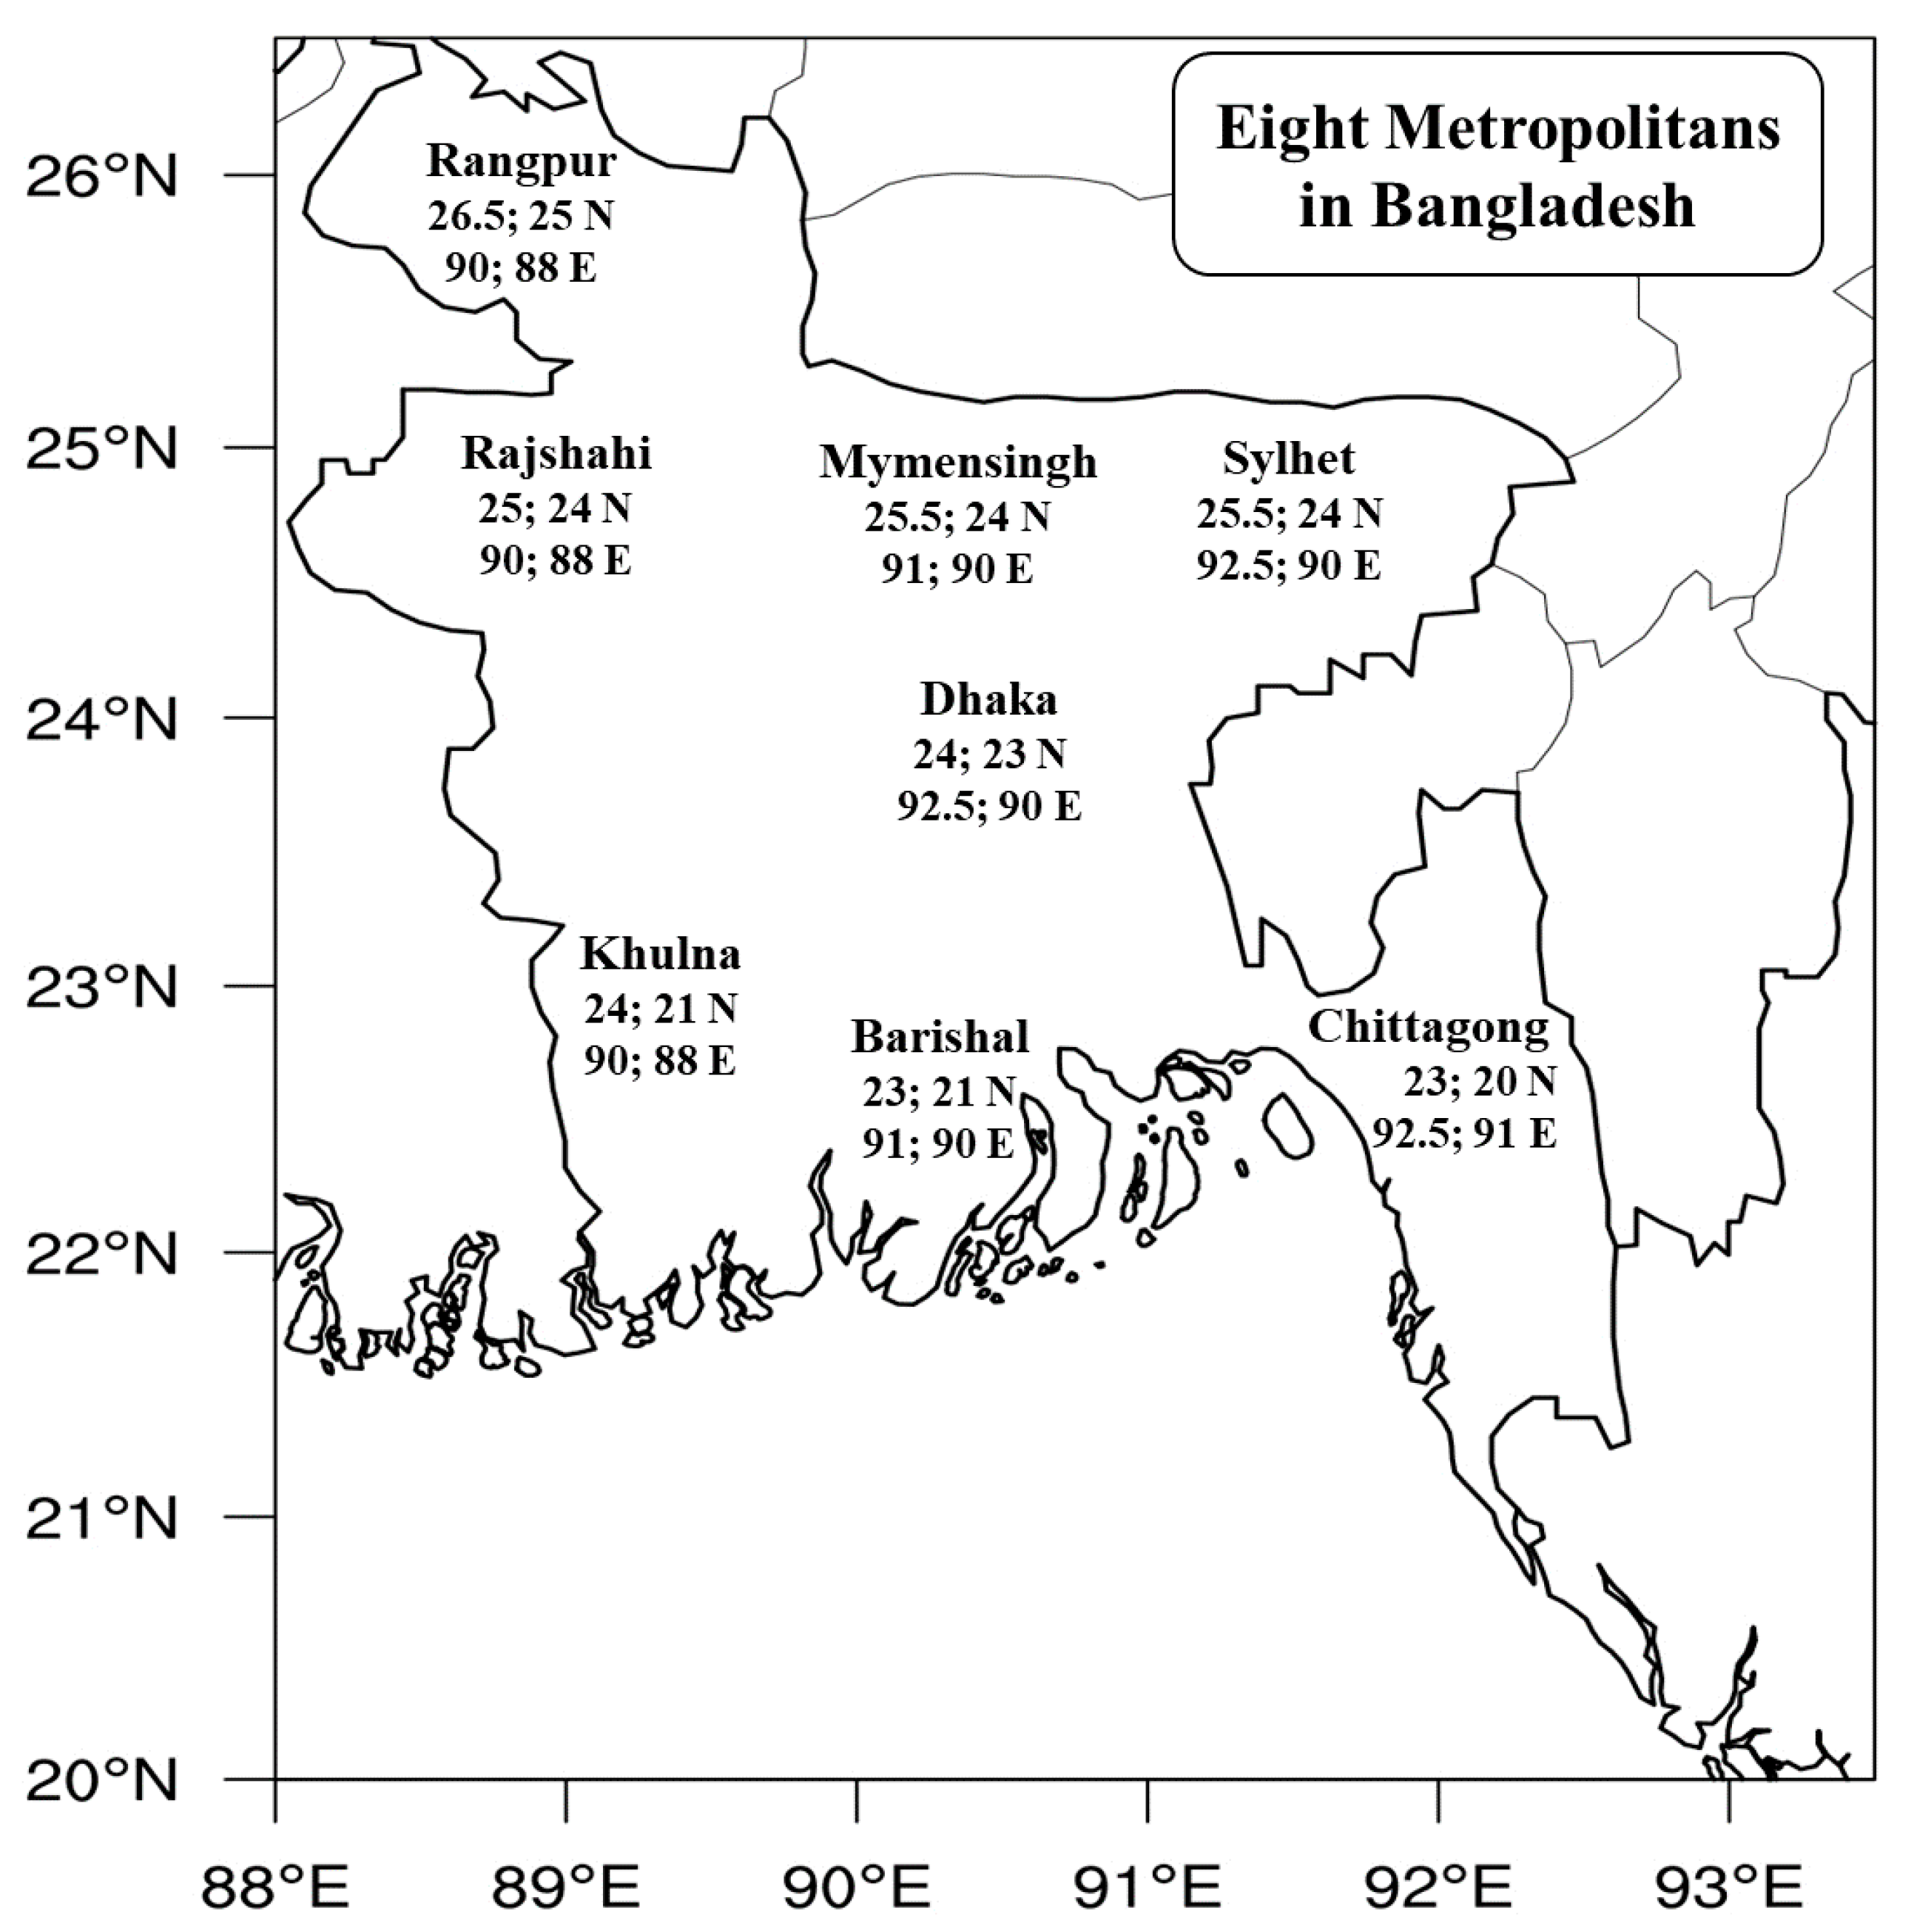
2. Study Site
Bangladesh has eight administrative divisions that are segregated into two parts: the northern and southern regions. These segregations are well established geographically by distributions of land and water bodies. The northern regions are mostly land, including rivers, such as Sylhet, Rajshahi, Rangpur, and Mymensingh. The southern regions include estuaries and coastal belts such as Dhaka, Chittagong, Barishal, and Khulna. Dhaka is the capital and is located by the Buriganga River, whereas Chittagong is the second biggest metropolitan area and is situated near the Bay of Bengal. Barishal and Khulna are both ports and coastal regions. Rajshahi and Rangpur metropolitans have boundaries with the Ganges (the river name is Padma within Bangladesh territories) and Brahmaputra River, respectively. To note, there are several districts and towns are situated closely by both rivers where lands are utilized for agricultural activities. In these open space, modern wind turbines might be feasible to co-exist for farming as well as energy harvests by maximizing both energy and agricultural outputs from a single land-use. Though Mymensingh and Sylhet have several river branches and wetlands, these cities experience topography effects due to the Meghalaya Mountain range. Since the geopolitical locations for each division are known, the coordinates for the latitude and longitude are retrieved. The geographical boundaries for the chosen cities are given in Figure 1.

Figure 1.
Study site: eight divisions and major cities in Bangladesh with coordinates for sub-domains.
3. Materials and Methods
The experimental design carries out an exploration of historical data from the European Center for Medium range Weather Forecast (ECMWF) reanalysis 5th generation (ERA5) and Global Wind Atlas (GWA) for investigating climatological variability in relation to wind power production. ERA5 signifies the latest climate reanalysis products for atmospheric, land surface, and sea-state data based on observations and modelled outputs. The horizontal resolution is about 0.25° × 0.25° and vertical heights are about 37 levels covering the globe. The global data is then extracted to Bangladesh and the chosen regions. Even though ERA5 makes extractions for sub-regions possible, subsets for each division are prepared by rectangular grids, i.e., Cartesian grids from the global domain. For instance, in order to obtain datasets for Dhaka division, coordinate variables are one dimensional for latitude and longitude from 24 to 25.5° N and 90 to 91° E, i.e., start and end coordinate arrays, averaged over a rectangular sub-domain. Similarly, the other coordinate subscripts are extracted for each region (shown in Figure 1). This method might result in two possible uncertainties: (1) underestimations in intensity and (2) coarse representation for geopolitical boundaries due to averaging effects and horizontal grids, respectively.
As Bangladesh does not have high resolution operational numerical weather prediction (NWP), ERA5 is still a resourceful data-store for investigating climatological variability. Meteorological variables namely monthly wind speed (m/s) and mean boundary layer height (BLH) in meters at various pressure levels are explored. The chosen heights for wind components (U and V) are 10 m (10 m), 1000, 975, 950, 925, and 900 hecta-Pascale (hPa). For both variables, time series, mean trends, and anomalies are scrutinized to explore variability and deviation over a historical period for 40 years from 1970 to 2018, with a climate base of 20 years from 1979 to 2000. From ERA5, hourly wind data is also extracted for 2018 and utilized in estimating power (Kilowatt) and annual energy production (Megawatt). Furthermore, Bangladesh does not publicly provide wind power data from operational wind farms (if any). GWA data are incorporated to develop prediction models. GWA is a free web-based application providing downloadable datasets for preliminary calculations. This modelling considers high resolution global maps, country and first administrative provinces, and physical parameters such as surface roughness, topography, obstacles, and weather information. The power datasets are reasonable replacements for historical information in statistical applications. The detailed information for GWA and ERA5 are given in Table 1.

Table 1.
Description of experimental data in the present study.
Wind speeds are the key variable and have strong correlations to power density, and this relationship provides strong insights to utilize as power predictions for wind turbines [20,21,22,23,24]. In polynomial curve-fitting, wind power is estimated based on operational power and wind data by least square methods [25]. In the present study, wind speed and power data are analyzed to establish a simple power predictive model (SPPM) using polynomial and exponential nonlinear regression. The general polynomial and exponential regression equations are given in Equations (1) and (2), respectively. Finally, wind power is also calculated using Equation (3) as a physical model to compare SPPM results for further assessments. Equations (1)–(3) are as follows:
From Equations (1)–(3), represents power in Kilowatt (KW) and V is wind speed (m/s). Here, stands for model parameters in nonlinear regressions and refers to the order of the polynomial. For the physical model, is the air density, i.e., 1.225 (Kg/m3), and A is the area for the rotor blades. In the present study, unit area (m2) is approximated for a wind turbine. Of note, area is another key variable for power estimations as power output doubles by increasing swept areas on the blades for turbines [15].
Model parameters for nonlinear regressions are calculated based on data sensitivity tests and least square methods. The least square method characterizes minimization of loss functions (shown in Equation (4)), which is also well-known as the sum of square error (SSE). For diverse datasets, consistency in determination of coefficients is established for SPPM to generalize fitting curves for all divisions in Bangladesh. Table 2 summarizes sensitivity tests and concludes for SPPM with sample size (N) of 1100. When the determination of coefficients, residual standard error (RSE), and SSE are found consistent and relatively small, SPPM model parameters are concluded for applications. To justify model accuracy, the mean absolute percentage error (MAPE) is calculated by Equation (5) based on [25]. Table 3 summarizes the finalized SPPM and model coefficients and the model predictability for power estimations. To obtain annual energy production (AEP), Equation (6) is incorporated, similar to [23,24,25]. Finally, pressure levels are approximated to meter by Equation (7) for comparing SPPM forecasts to observed wind speed, particularly for ERA5 data. Equation (7) is a general formula to convert atmospheric heights from pressure levels to meters [27]. The conversions might affect coarse representation in meters because atmospheric pressure changes depending upon weather systems. Equations (4)–(6) are presented below:
Table 2.
Data sensitivity in modelling power estimations based on determination of coefficients.
Table 3.
Summaries for SPPM mean absolute percentage and residual standard error (MAPE and RSE).
Here, and illustrate observed and modelled power, respectively, at each wind speed for total datasets, i.e., . is power for SPPM to be calculated within a range of (minimum) and (maximum) wind speeds, and 8760 is a constant value equal number of hours in a year [23,24,25]. As SPPM developed from GWA datasets, these models must forecast in the given range of 1.68 to 11.88, respectively, for and. Moreover, Equation (7) is as follows:
Here, P represents pressure at any expected level where Po is a reference level, i.e., 1000 hPa. H is scale height, i.e., approximated as 3.5 km, where z is the converted height in meters. For instance, wind speed in ERA5 given at 975 hPa would be approximately 82 m.
4. Results and Discussions
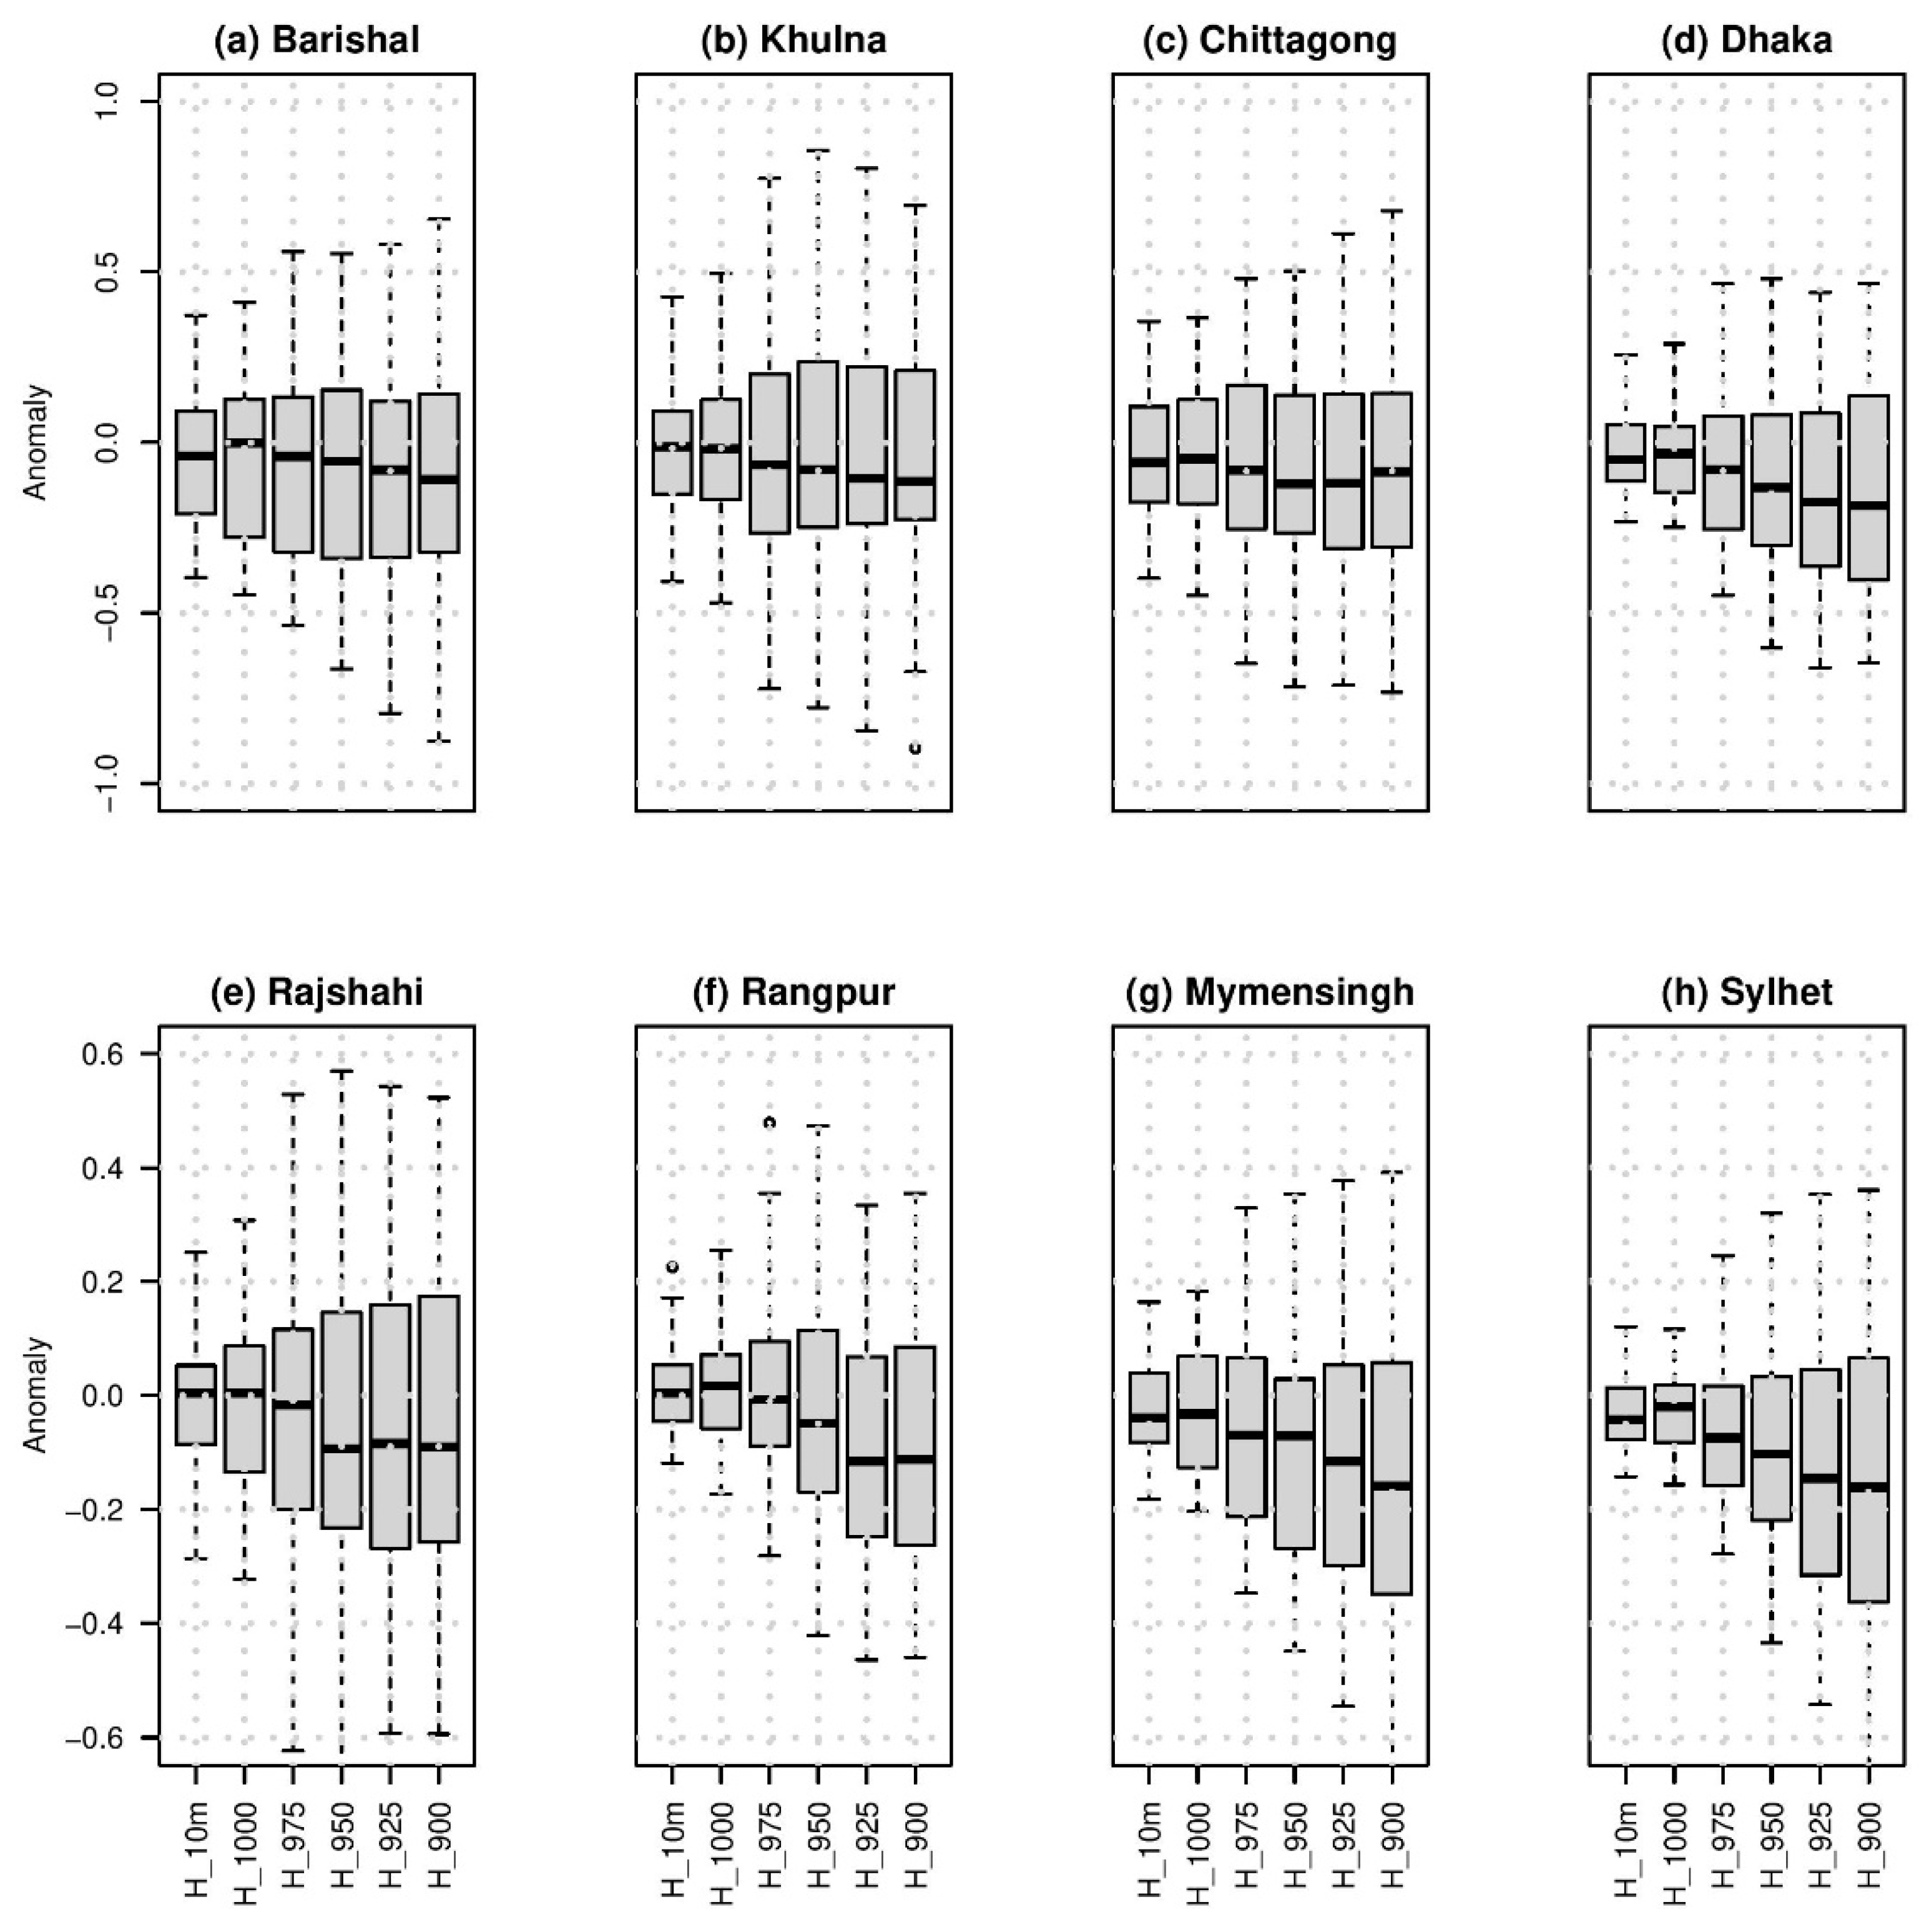
The results are analyzed for wind speed (m/s) and BLH (m), followed by wind power estimations. The boxplots in Figure 2 and Figure 3 illustrate the descriptive statistics for the southern and northern regions, averaged from 1979 to 2018 and with a climate base period of 20 years (1979 to 2018). Figure 2a–d and Figure 3a–d indicate the average wind speed and the anomalies for the southern regions. Here, Barishal (Figure 2a) experiences the highest of about 3.097, 3.565, 4.580, 4.772, and 4.665 (m/s), whereas Dhaka (Figure 2d) has the lowest speeds of about 1.589, 1.806, 3.283, 3.956, and 4.151 (m/s) increasing with the height from 10 to 250 m (converted from pressure levels from 1000 to 900 hPa). Moreover, Khulna (Figure 2b) and Chittagong (Figure 2c) stand quite neutral to the others with gentle speeds. For all cities in Southern region, variations in anomalies are found similar to each other (given in Figure 3a–d). To note, The northern regions show average wind speeds and anomalies for various heights in Figure 2e,f and Figure 3e,f, respectively. In the north, the lowest mean wind speed is found in Sylhet at about 1.094, 1.249, 2.093, 2.599, and 2.922 m/s and the highest is in Rajshahi at about 1.573, 2.007, 3.289, 3.583, and 3.637 m/s as the height increases. On the other hand, the anomalies for each city show similar variations in speed that are slightly increasing with the height (shown in Figure 3e–f).
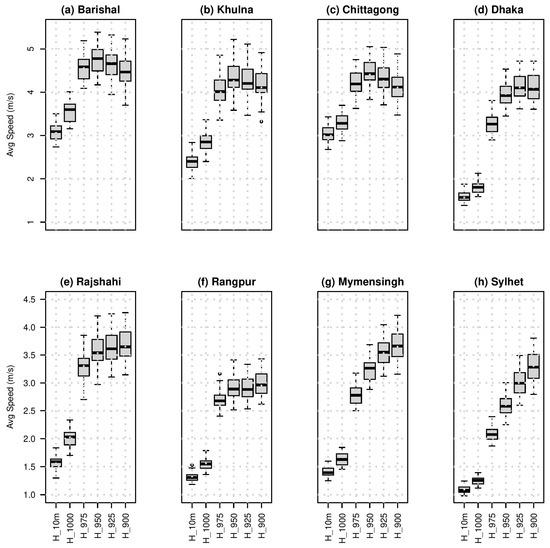
Figure 2.
Descriptive statistics of wind speed (m/s) at 10 m and pressure levels: 1000, 975, 950, and 925 hPa for southern (top panels) and northern region (bottom panels) averaged from 1979 to 2018 with a climatic base of 20 years (1979 to 2000).
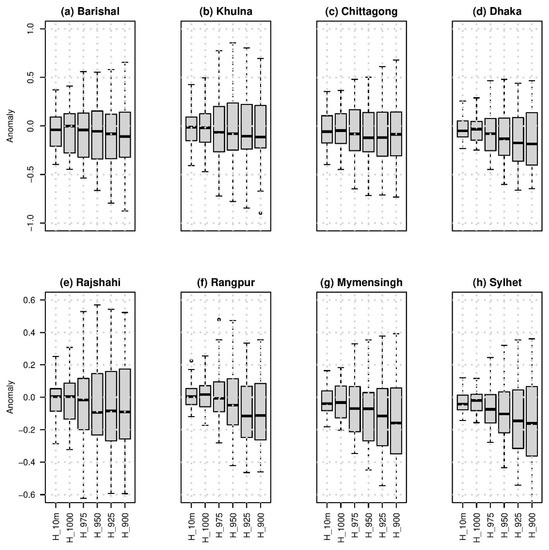
Figure 3.
Same as in Figure 2, but valid for anomalies of wind speed.
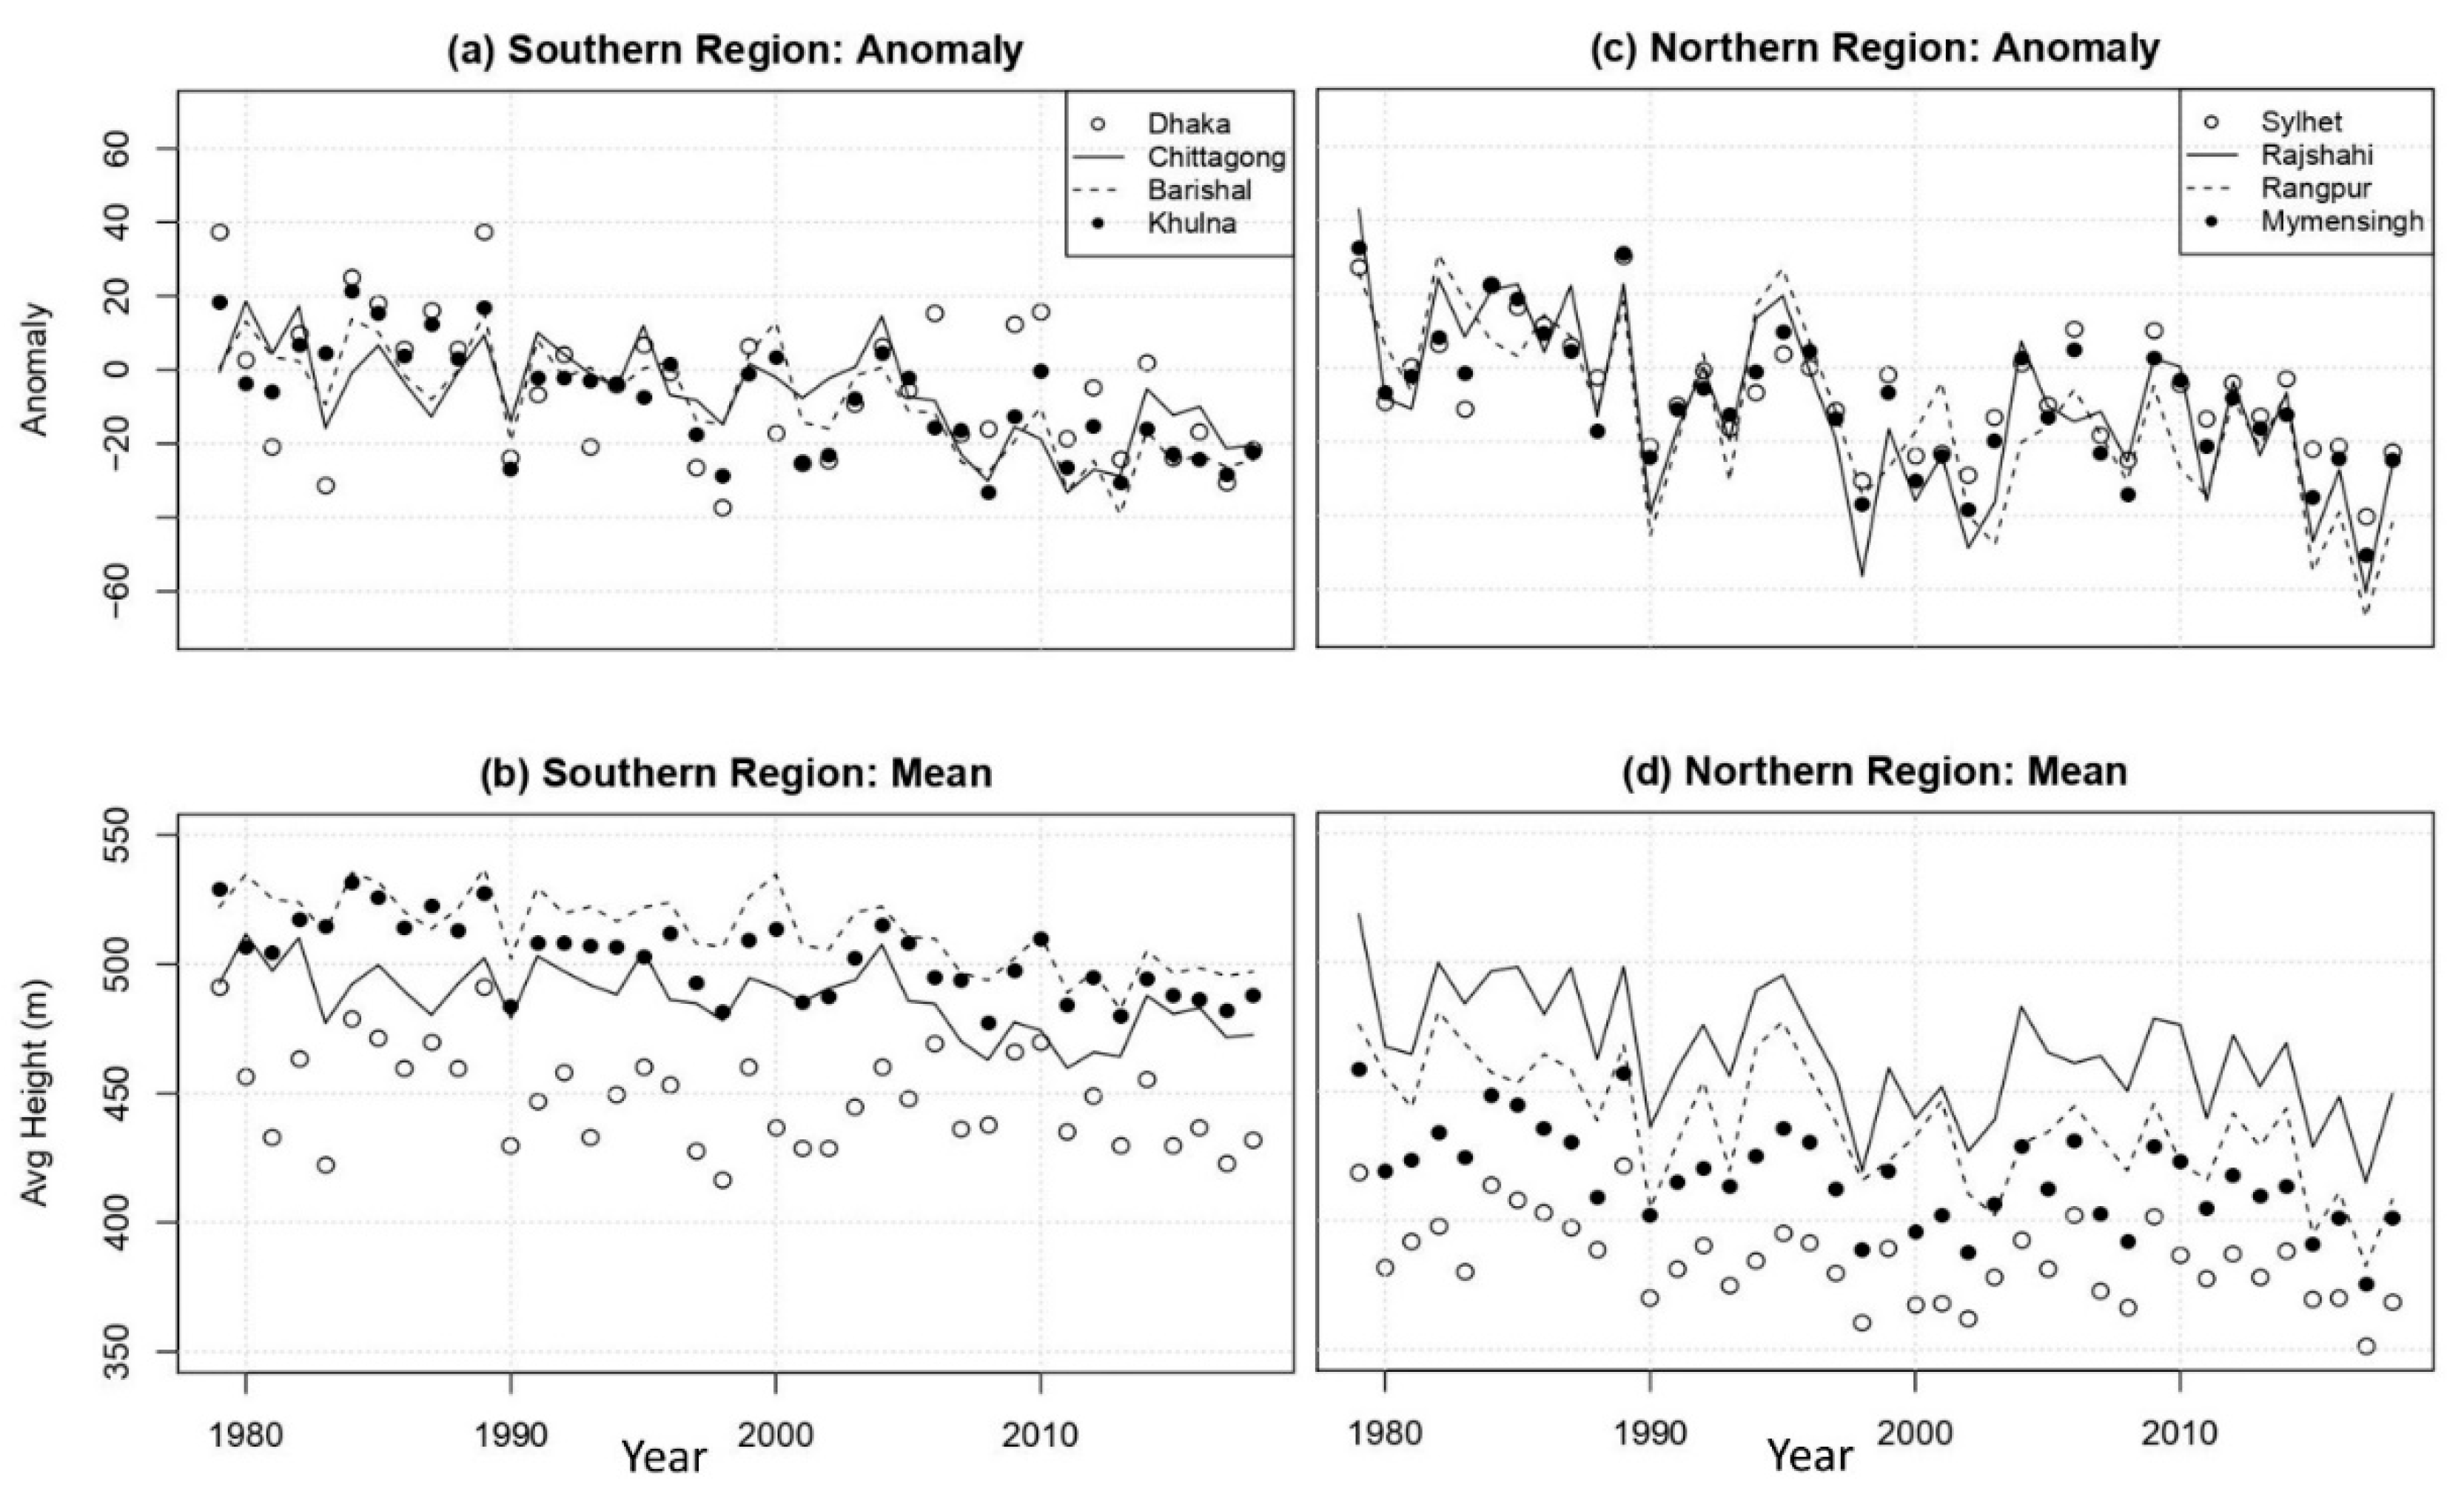
The overall comparison in Bangladesh demonstrates that Sylhet is the weakest region (lowest speed), whereas Barishal is the strongest region (highest) for wind speed. The analysis for wind speed at various heights implies that mean wind speeds from 975 to 925 hPa (~80 to 200 m) are similar to each other. The mean wind speed is 4.3 and 3.3 m/s, respectively, for the southern and northern regions. Wind speeds and their anomalies provide evidence for an optimized height, i.e., 975 hPa (80 m), applicable (shown in Figure 4) in harnessing wind energy efficiently as there are no significant increasing or decreasing trends. For instance, anomalies for both regions are given in Figure 4a,c, which indicate the variations are close to each other for respective cities. However, there are few outliers particularly found for Khulna cities only in 2010 and 2015 that might have resulted because of tropical cyclones passing the region. As similar deviations were found in the range of −0.6 to 0.6, these wind speeds meet the minimum threshold for turbine rotations. The time series for wind speeds also highlights that Barishal (Figure 4b) and Rajshahi (Figure 4d) have stronger wind blows in Southern and Northern areas, respectively than others. Regardless speed’s hierarchy, most cities meet the minimum threseholds i.e., cut-in wind speeds for rotating turbines at around 80 to 100 m except Sylhet.
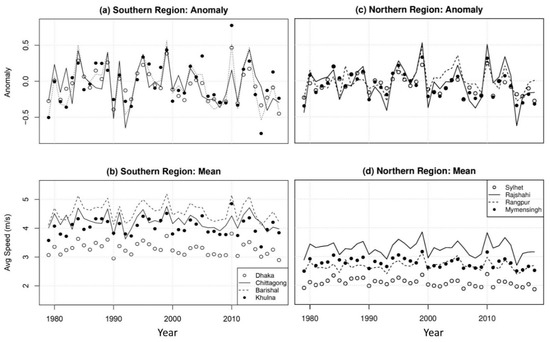
Figure 4.
Time series of averaged wind speed (m/s) at 975 hPa, i.e., ~85 m for the southern (left panels) and northern regions (right panels) from 1979 to 2018 with a climatic base period from 1979 to 2000.
Overall, the ERA5 datasets at pressure levels from 1000 to 900 hPa provide a reference for wind intensity unlike station observations. Several previous studies refer to the higher intensity for observed wind speeds of about 5 to 8 m/s [4,5,6,7,8,9,10,11,12,13,14] than the ERA5 datasets. As the BMD stations have observations at lower heights, i.e., 10 m, this height neither shows strong wind nor conditions appropriate for installing wind turbines. Though ERA5 uses reanalysis datasets, it is worth investigating the mean windiest areas for finding suitable locations to place turbines and to reduce costs for multiple stations. Similar suggestions are emphasized for exploring wind speeds from 10 to 120 m above terrain for turbine installations [14]. Furthermore, ERA5 contains diverse sets of variables for investigating strong or weak relations in numerical modeling. By studying ERA5 datasets, either NWP or data-driven models can further be developed in numerical applications. The analysis for wind at various heights encourages the installation of high-resolution observations in spatial-temporal resolutions for particular regions to investigate more evidence on wind speed durations. For installing highly equipped observations, the above results also help to figure out possible locations such as Rajshahi and Rangpur regions, which are closer to riversides. The obtained wind speed also supports installing small-scale or rooftop-based turbines on tall buildings for both regions.
The atmospheric boundary layer height (BLH) changes by surface roughness, thermal variations, and weather systems that significantly affect wind intensity and duration. The mean BLH is analyzed for understanding the thermal conditions and turbulence effects, which would influence turbine rotations and plant operations. The significance of BLH is discussed in [14], but the study did not provide any estimated values. The current paper finds that the BLH (m) demonstrates decreasing trends and variations for the southern and northern regions given in Figure 5a,c, respectively. The comparisons in anomalies show that the decreasing trends in southern areas (Figure 5a) are slower than norther (Figure 5c) regions. Similar to wind anomalies, BLH also illustrates a comparable pattern for each cities i.e., variations are closer to each other. In the southern areas, Dhaka shows the lowest BLH (416.36 m) while Barishal is the highest (537.13 m) in 40 years (shown in Figure 5b). For the northern regions in Figure 5d, Sylhet has the lowest BLH (351 m) whereas Rajshahi has the highest (414.72 m) in 40 years. This eventually indicates that the minimum and maximum mean BLH in Bangladesh are Sylhet and Barishal, respectively. The result implies that a moderate or stronger wind might result in higher BLH, i.e., supports wind intensity for southern regions. The variations of the BLH infer local vertical mixing, circulation, and turbulence. After assessing the BLH for each city, these results demonstrate that the optimized height would not experience heavy turbulence. After meeting atmospheric conditions, stable infrastructures, i.e., wind turbines, can function and provide desired outputs in renewable energy.

Figure 5.
Time series of atmospheric boundary layer height (m) for the southern (left panels) and northern regions (right panels) averaged from 1979 to 2018 with a climatic base period of 1979 to 2000.
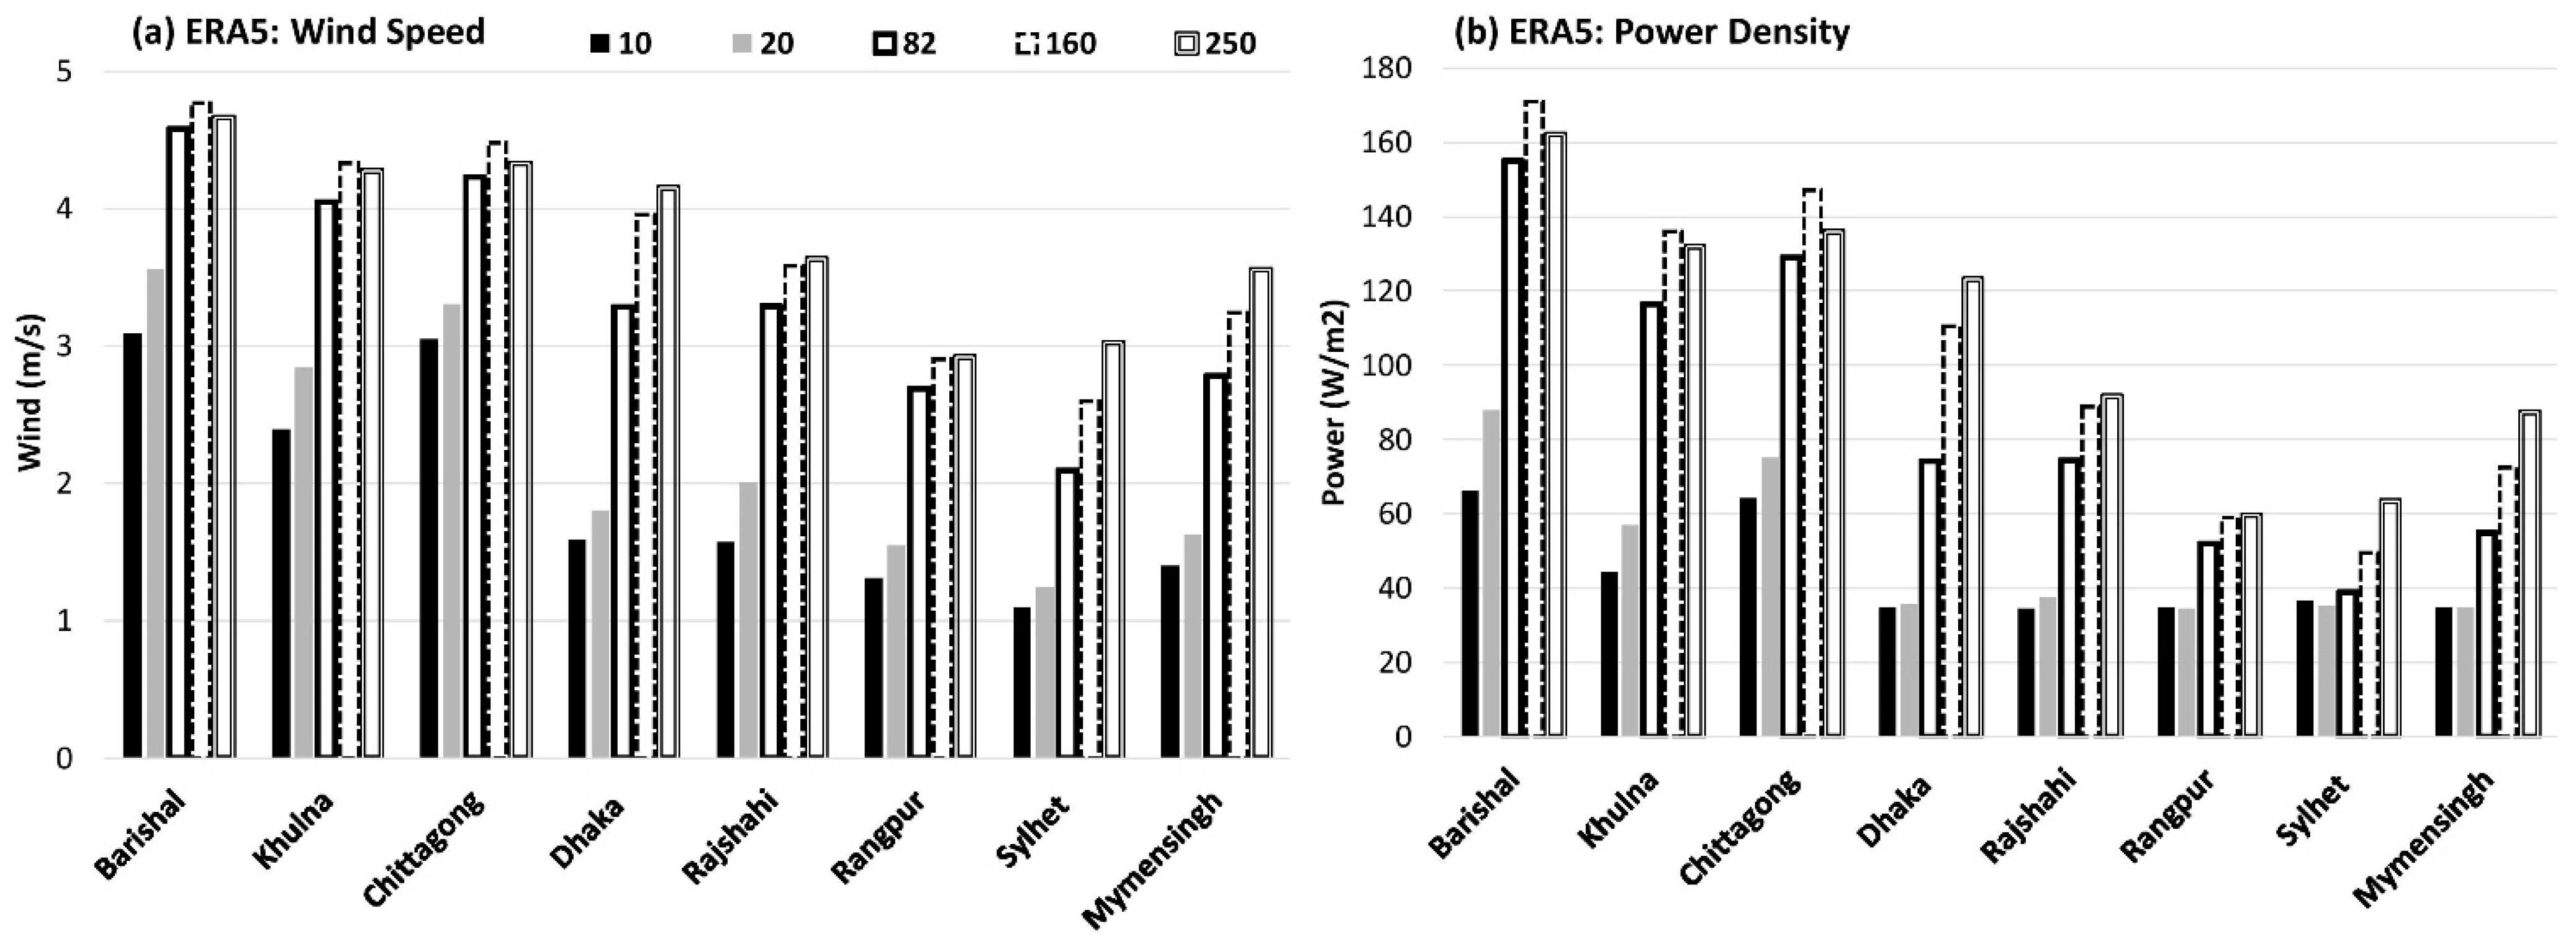
Global Wind Atlas (GWA) provides detailed information for wind and power for each country including main administrative cities. As GWA considers the roughness length, ruggedness index, and terrain effects, the power datasets are incorporated as historical datasets for Bangladesh. For instance, the wind speed (m/s) and power density (W/m2) are in Figure 6 for seven megacities at various heights. Moreover, Figure 7 displays wind speed and power density for the chosen study sites. To note, the power density is calculated by the polynomial model. Similar to GWA, ERA5 also proves Sylhet as a weaker region than the other cities. The average height of 100 m has a wind speed of 5 m/s that provides a power output about 200 W/m2. These reference data can be calculated to develop a statistical model for both power estimation and annual energy production. For given datasets, exponential and polynomial (order = 3) models fit the wind–power curve well, which are eventually compared with the physical model. While modeling, data sensitivity is observed, i.e., summarized in Table 2. Though there are some outliers in power datasets, wind and power data are kept at about a sample size of 1100 for general applications. Based on the determination of coefficients, residual standard errors (RSE), and sum of square error (SSE), the final simple power predictive models (SPPM) are established. Table 3 summarizes the concluded forms of the SPPM with their accuracy, i.e., mean absolute percentage error (MAPE) and residual standard error (RSE). The developed SPPM incorporates only wind speed information regardless of any height or roughness and forecasts power density so that the models can generalize forecasting for any city in Bangladesh. Therefore, SPPM simplifies physical complexities and saves computational time and resources.
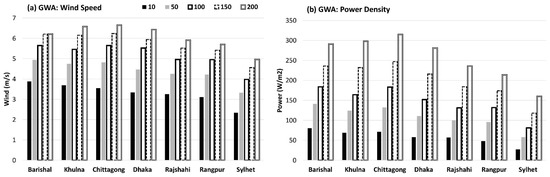
Figure 6.
From GWA representing average (a) wind speed (m/s) at various heights (m) and (b) power density (W/m2).

Figure 7.
Same as in Figure 6 but valid for ERA5 (a) average wind speed (1979 to 2018) and for Polynomial (b) power density.
The average determination of coefficients is around 0.90 for SPPM, which stands statistically strong. Based on the MAPE in Table 3, the polynomial (PN) and exponential (EXP) models indicate similar accuracy of 82%, whereas the linear model shows an MAPE of 58%. Thus, there are no further illustrations or investigations for the Linear model. Though the physical (PS) model shows an accuracy of 55%, the investigations are continued for comparative understandings with statistical approaches. For comparing GWA power datasets, an average wind speed of ERA5 from 1979 to 2018 is incorporated to estimate power (shown in Figure 7a). Particularly, the outputs from PN demonstrated in Figure 7b show the highest potential in Barishal and lowest potential in Sylhet. To note, the MAPE for PN yielded the lowest during training, i.e., around 21.80%. Though Figure 6 also replicates similar characteristics to Figure 7, i.e., stronger wind speed in southern regions, onshore areas, mostly closer to rivers, could provide reasonable energy as well, i.e., around 150 W/m2 at 4 to 5 m/s. Comparing Figure 6 and Figure 7 also indicates that either onsite observations or high-resolution model datasets are inevitable for wind power generation. Except for the Sylhet region, both land and coastal regions are quite suitable for accommodating modern turbine technologies. Even though ERA5 data shows an average height, i.e., 100 m for the minimum threshold to initiate turbine rotation, higher resolution observations with finer instruments can provide accurate information for wind speed. Therefore, these figures (Figure 6 and Figure 7) encourage establishing observations for scrutinizing detailed and more accurate wind information before turbine installations.
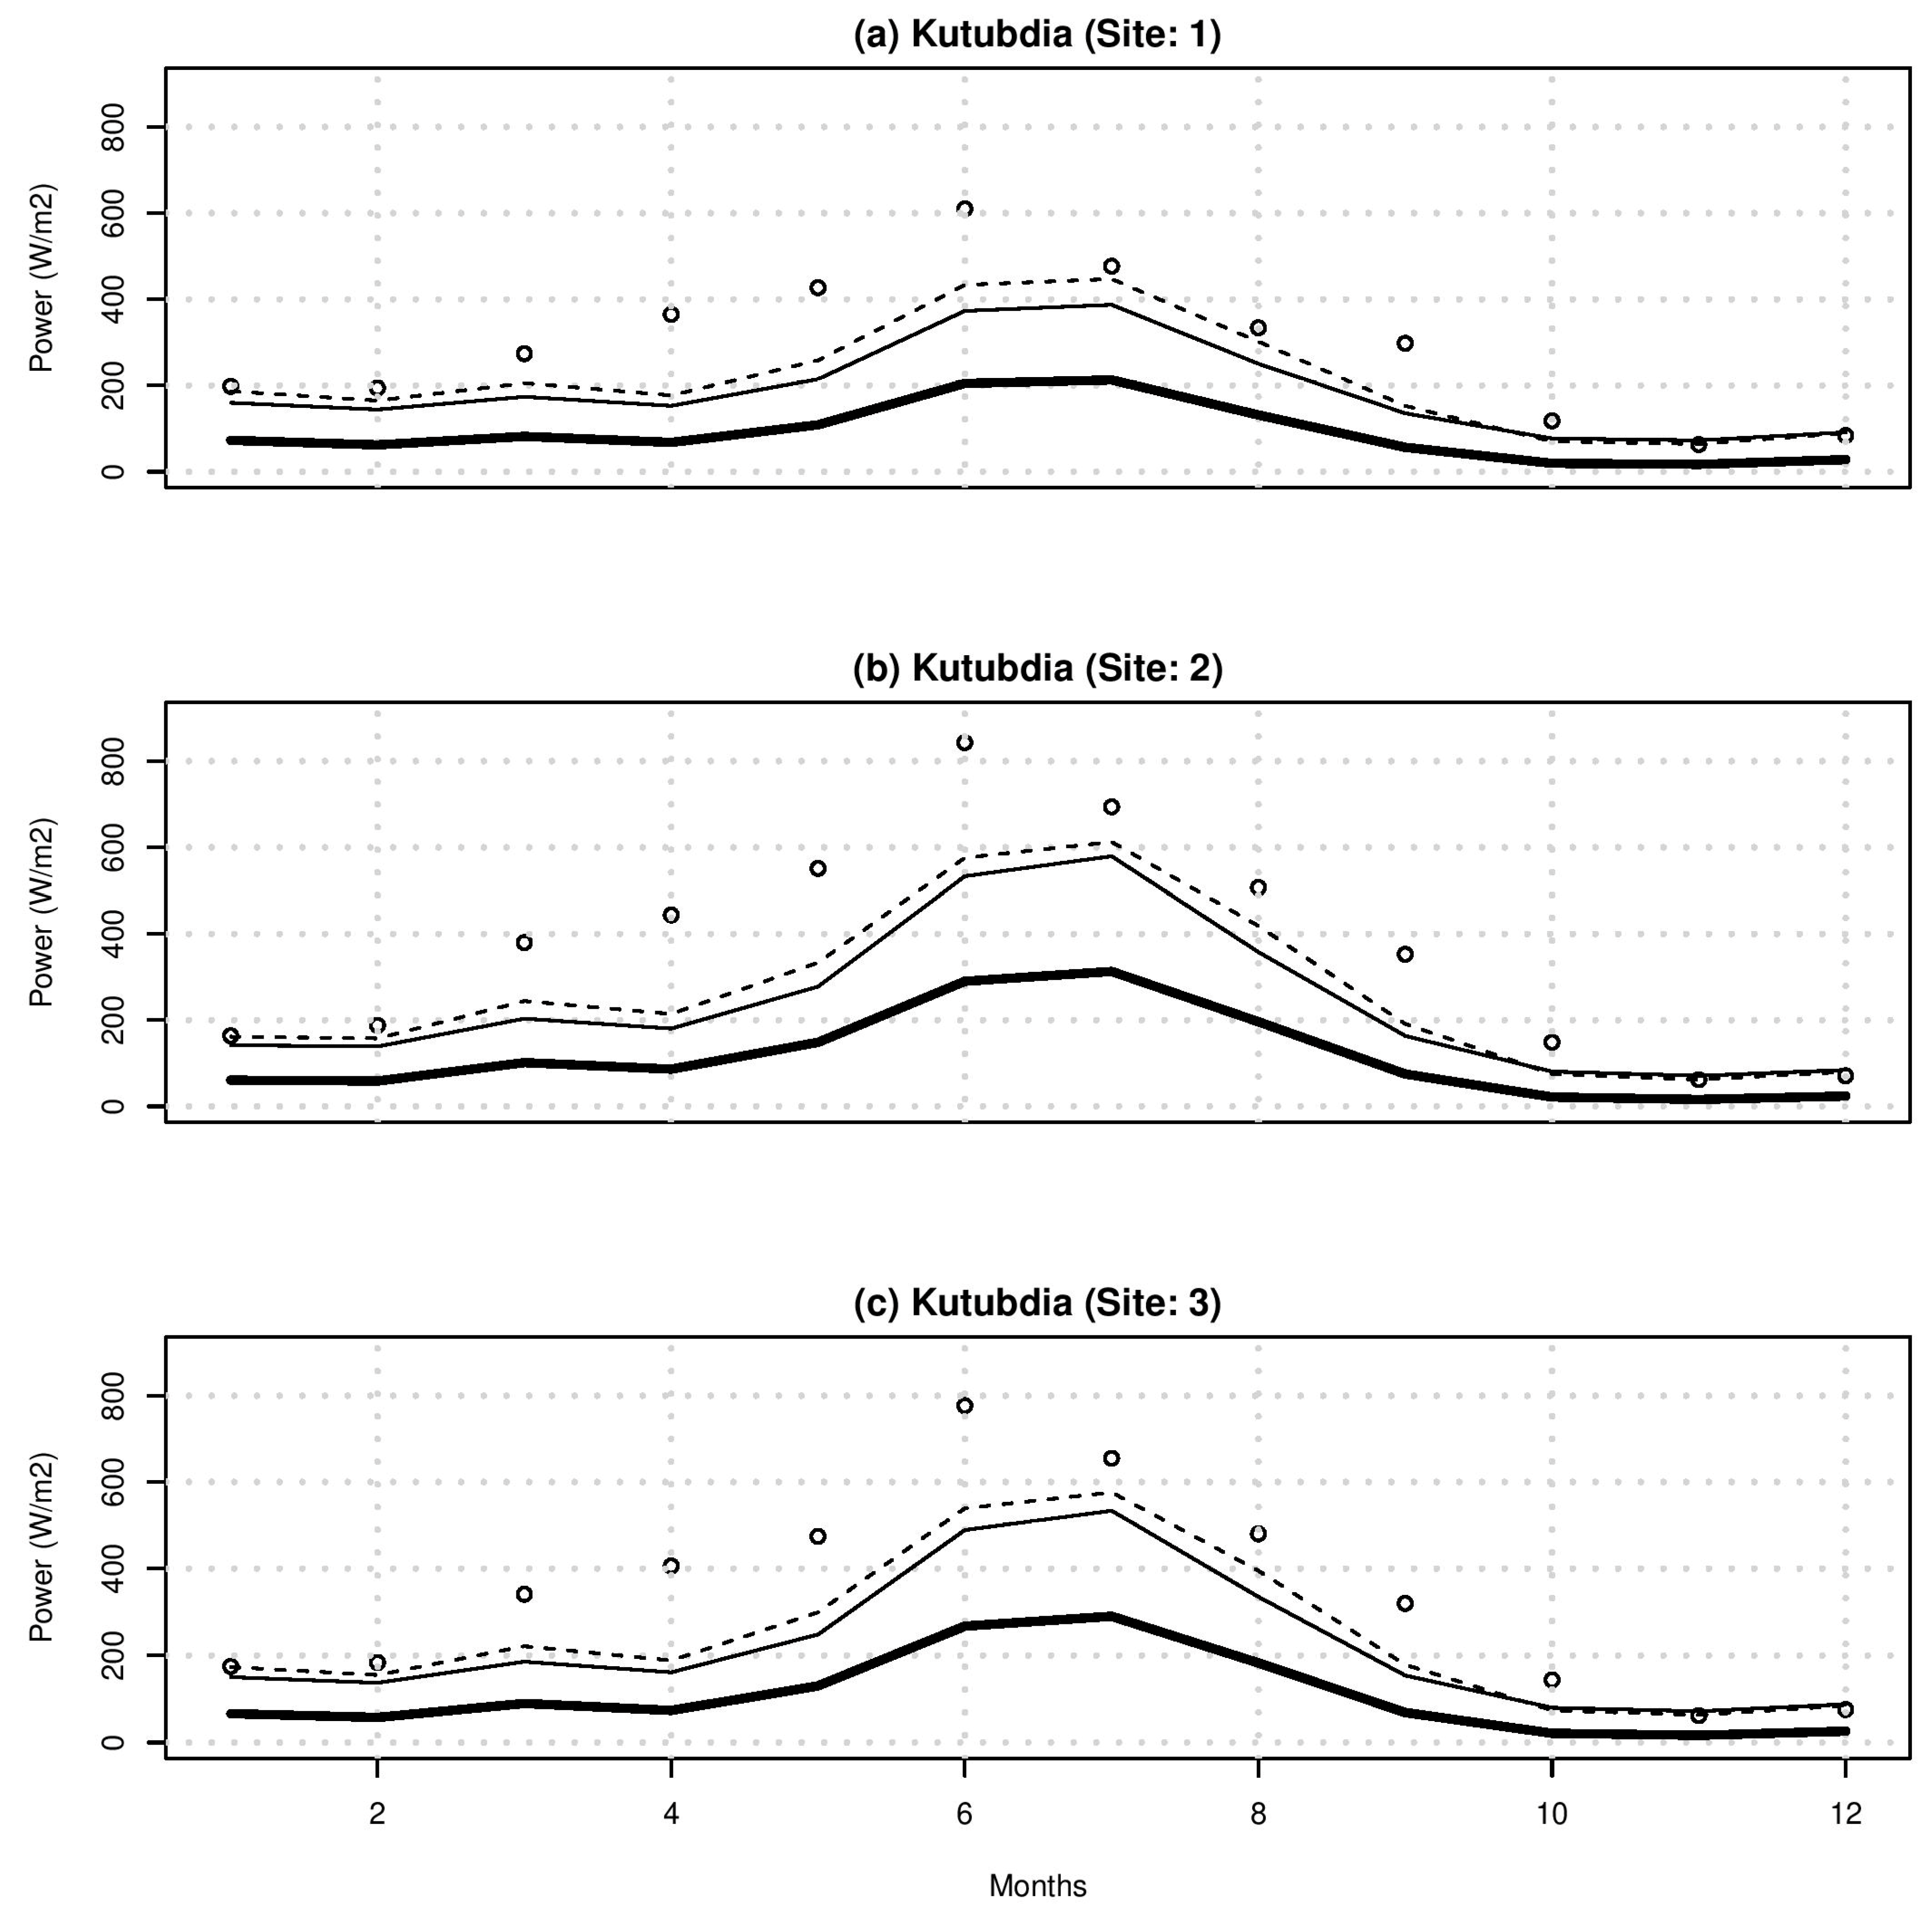
The SPPM results provide valuable inferences in energy approximations regardless of height dependency and/or physics complexities. For validating model estimations, the SPPM performances are associated with previous studies. As [10] had observed wind speed at 50 m height for Kutubdia sites, their power outputs are based on Weibull Distribution. Incorporating these wind speeds, SPPM then applied to estimate power. These comparisons also infer how SPPM performances are compatible with other distribution functions. Figure 8 and Table 4 display the power forecasts and their correlation based on information in [10]. The correlation coefficient is found for three observation sites in the range from 88 to 93%, whereas PN again outperforms both the EXP and PS models with an MAPE in the range of 23 to 26%. The comparison for the SPPM with [10] indicates that the model results are as reliable as Weibull distribution or higher predictability than Weibull. Table 4 implies that when data is more diverse and the wind speed is higher, the forecasting accuracy also increases for SPPM. Additionally, Figure 8 shows the predicted monthly power for three sites in Kutubdia (wind at 50 m) for a year by the EXP, PN, and PS models. Related with wind speed, the observation (open circle) is well matched with the PN model forecasts. The prediction by each model is PN > EXP > PS, whereas their correlation (r) and MAPE are about 0.89 and 25%. The data in [10] shows the highest monthly wind speed and power during monsoons. Figure 8 also signifies the maximum power harnessed during monsoons. Similar to current results, another study found power predictions for operational wind farms in hybrid modeling [20]. In data-driven models, SPPM performs well in reducing power estimations errors despite of source of data. This fitting implies how SPPM particularly polynomial regression can also be calculated for generalized applications. However, the model consistency is also important for customizing and minimizing errors with operational purposes. Therefore, additional assessments are carried out for confirming SPPM and its general applications.
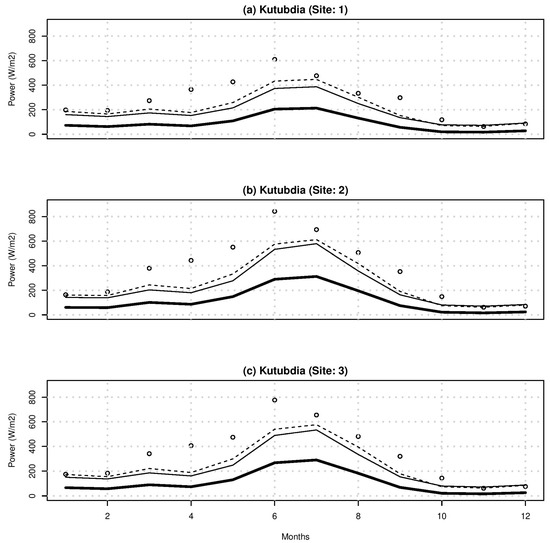
Figure 8.
SPPM Forecasts: Polynomial (dashed line), Exponential (solid line), and Physical (thick solid line) compared with observation (open circle) valid for observed data in Kutubdia from [10].
Table 4.
SPPM correlation and predictability for four locations in Bangladesh.
For further testing the model stability, the SPPM is utilized to forecast power by a historical observed wind data. The given wind speed is for Patenga in Chittagong (CG) at 20 m, Bremerhaven in Germany at 35 m, and Hofa in Jordan at 24 m and similar magnitudes were found. Using geographical location, the ERA5 data are extracted at 975 hPa (approximately 20 m) by keeping reference for 1010 hPa. Figure 9a shows the power based on historical wind speeds from [6] in 1996, whereas Figure 9b illustrates the power from the ERA5 wind datasets for Chittagong by the PN, EXP, and PS models. The estimated power is then compared with observations from GWA power datasets based on corresponding to the given wind speeds. In historical wind speeds, SPPM forecasts conclude that power estimations are also valid with observed wind datasets i.e., particularly PN model very clearly estimates energy as close as to GWA observations (Shown in Figure 9a). Even though ERA5 datasets have quite similar patterns to the observed data, there is a clear underestimation in the wind speed during the late-monsoon period. This difference also resulted in an underestimation in the power forecasts for the SPPM (given in Figure 9b). Moreover, the PN model predicts power higher but closer to observations than the EXP and PS. Between the observed and the modeled data, the power density correlations (r) are 0.97 and 0.60, respectively, for historical and ERA5 wind speeds (given in Table 4). The SPPM model predictability is significantly improved and is found to be 7.69 and 10.26% for the PN and EXP models, respectively. The predictability for the PS model is only 50%, similar to previous results in [14]. The results from PS also infer when wind speeds are higher than 5 m/s, and the model performances are closer to 50% accuracy. This discrepancy suggests incorporating accurate observations for validating SPPM outputs and operational wind turbines. To note, the power density indicates a pattern similar to wind speed and a maximum during monsoons, which means that SPPM follows the wind intensity characteristics.
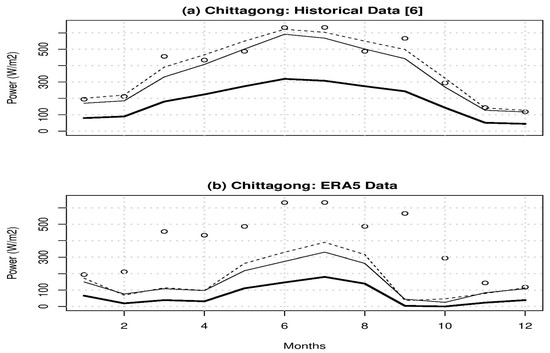
Figure 9.
Same as in Figure 8, but valid for observation from GWA power data.
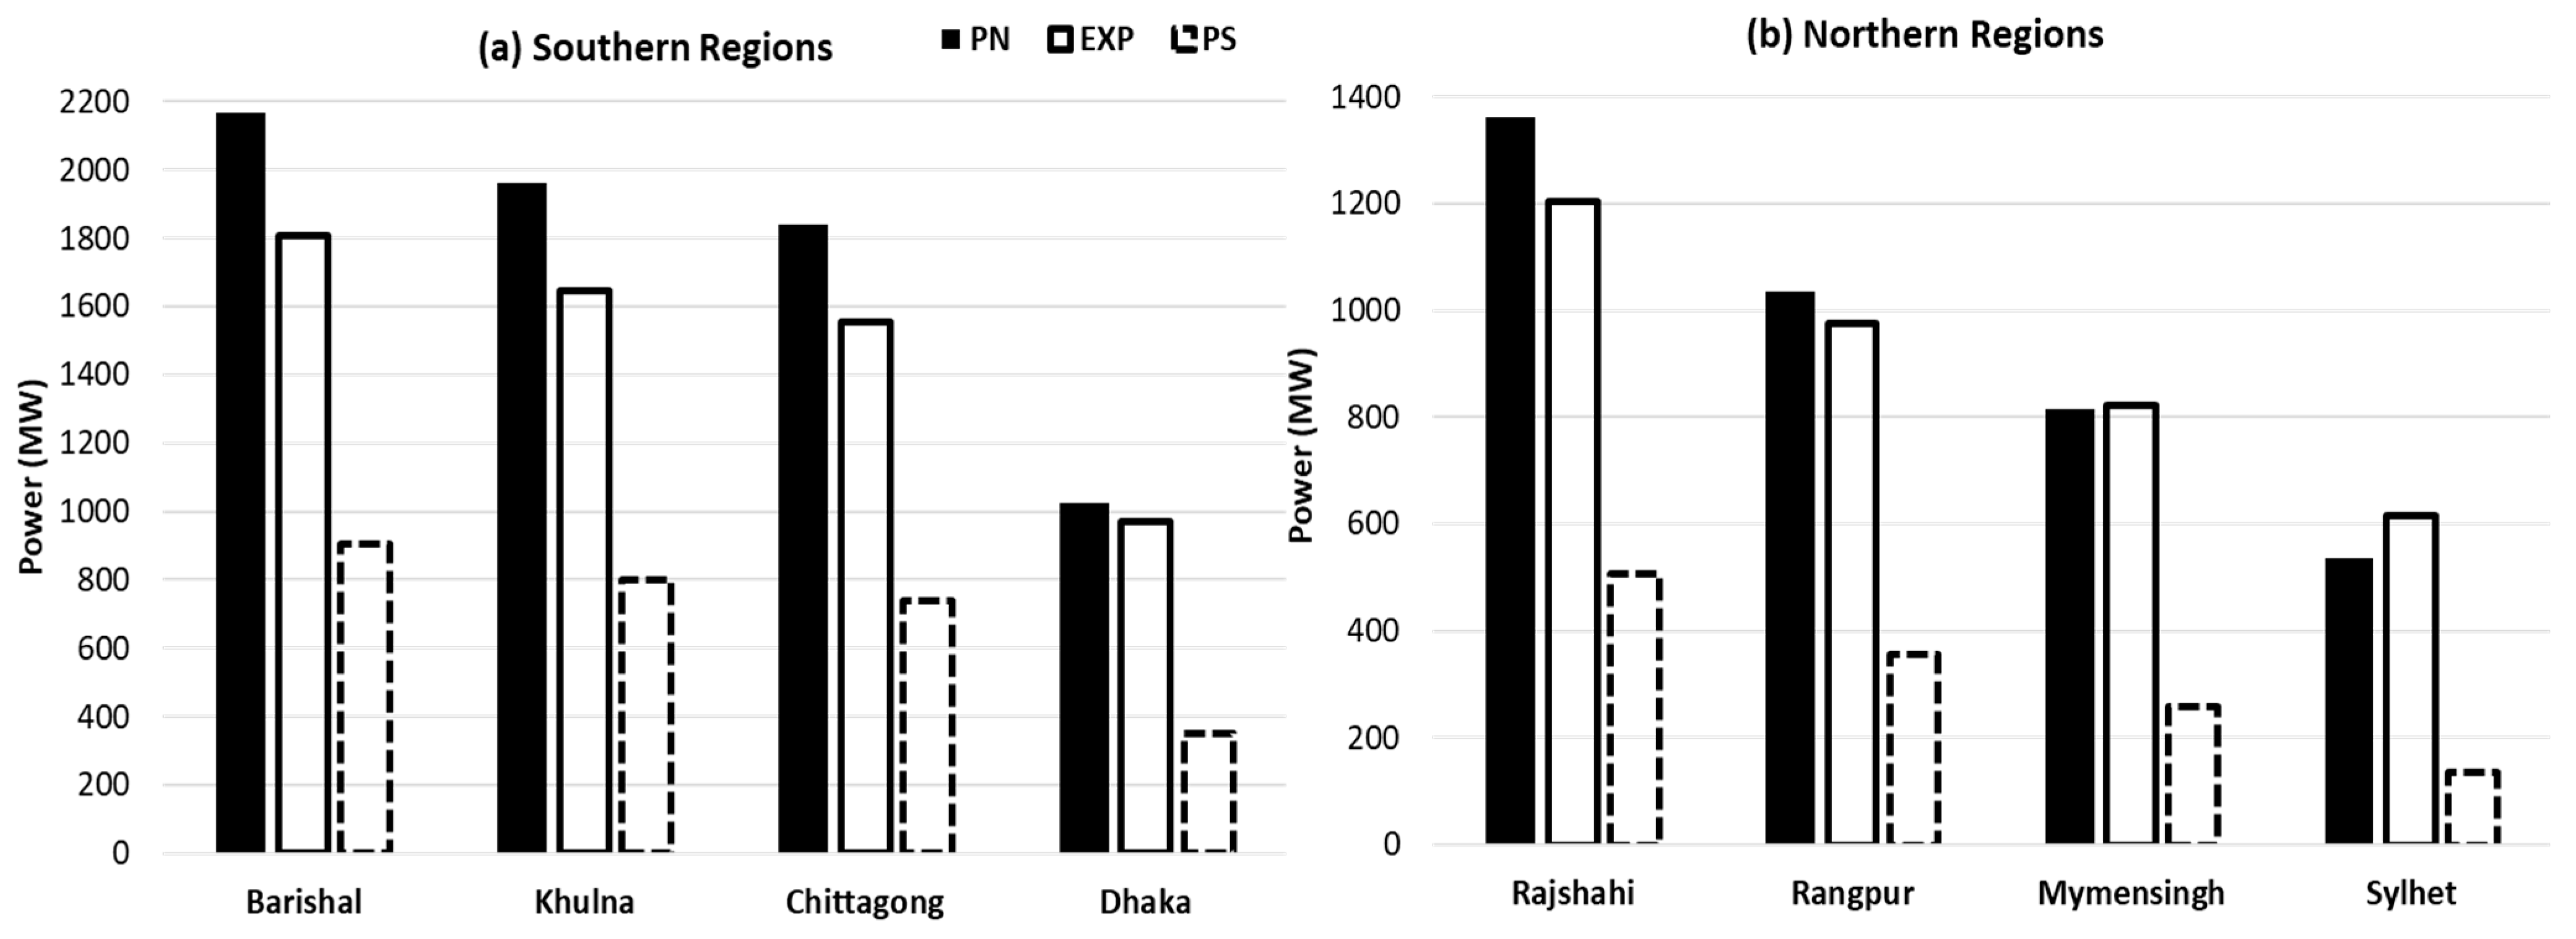
The Annual Energy Production (AEP) is carried out utilizing SPPM models. From ERA5, the descriptive statistics for hourly wind speed in 2018 is given in Table 5. Since the data have unimodal characteristics, average wind speed is considered for AEP calculations. Figure 10 elucidates that the Barishal region is very suitable for wind power production and implies nearly 2200 megawatt (MW) of energy per year. Despite the coastal regions, Rajshahi is also promising for energy harvest, i.e., around 1400 MW. The average AEP for the southern and northern regions is 1748 and 1070 MW, respectively, except Sylhet. The AEP for both regions are reliable, since the MAPE mostly for the PN model is found below 10%. For all models, the MAPE again is calculated with GWA and illustrated in Table 6. Therefore, the best performance for AEP and power forecast is again obtained by the PN model. Further validations and comparisons using secondary data from [6,10] signify a model compatibility of around 85 to 90%, which is higher than 50% accuracy in [14]. To note, wind direction is an important influence on the wake of the wind generator, which can significantly affect the power output [14,20]. The above results from SPPM provide a future platform for incorporating more variables such as wind directions and temperature to improve the model robustness. Several notable previous papers established forecasting with machine learning (ML) algorithms, artificial neural networks, and statistical modeling and found similar predictabilities to the SPPM. For instance, one study compares various ML techniques such as one dimensional (1D) Long-Short Term Memory (LSTM), Support Vector Machine (SVM), and Random Forest (RF), concluding model accuracies reaching up to 93.9% and 94.7%, up to 92.8% and 93.8%, and up to 88.7% and 89.3% for speed and direction, respectively [28,29]. Therefore, the SPPM will reserve its future works incorporating more observed variables and compare its performances to other data-driven models like ML techniques.
Table 5.
For hourly-wind speed (m/s): Descriptive statistics from ERA5 datasets in 2018.

Figure 10.
Annual energy production for (a) southern Regions and (b) northern regions in Bangladesh by SPPM estimations, i.e., Polynomial (PN), Exponential (EXP), and Physical (PS) models.
Table 6.
SPPM prediction error (%) in annual energy production.
5. Conclusions and Future Directions
The growing energy demands and environmental concerns require sustainable energy sources. Nationwide, wind energy is often neglected due to its low magnitude. The present study investigates ERA5 and GWA datasets to analyze variations in wind speeds for potential Eolic estimations. Climatological variabilities imply that the strongest regions are coastal belts such as Barishal, Khulna, and Chittagong, whereas Rajshahi and Rangpur in the northern regions are also found promising for harvesting wind energy. Though Dhaka and Mymensingh demonstrate moderate strength, Sylhet is the weakest region for harvest of wind energy. Similarly, the mean boundary layer height shows a decreasing trend in Sylhet and Dhaka, while the other cities are relatively safer places from atmospheric turbulence for optimized height, i.e., about 100 m to incorporate modern technologies. This study also applied wind power-curve approximations, developed a simple power predictive model (SPPM), and compared with historical and GWA observations. During training, the determination of coefficients and mean absolute percentage (MAPE) are 0.90 and 22% for Exponential (EXP) and Polynomial (PN) models. The SPPM also predicted power from historical (Chittagong) observations and ERA5 wind speed with an accuracy of 93 and 90% respectively for PN and EXP compared with GWA. Finally, the results also suggest that about 2200 and 1400 MW of energy are possible to harvest annually respectively from the southern (Barishal) and northern (Rajshahi) regions. For annual production, an MAPE is obtained at 5.85 and 15.71%, respectively, for PN and EXP, outperforming PS, i.e., 64.6%, which suggests applications with suitable wind turbines. These findings will improve in applications to wind energy for implementing advanced technology. For operational plants, SPPM is beneficial for forecasting energy at small-scale in remote areas, agricultural lands, and/or building rooftops. For SPPM applications in operational purposes, high resolution observations will enhance the model robustness as a mobile-app or smart forecast meter. The research targets to study comparing SPPM forecasts with observed wind and power projecting in the future.
Author Contributions
Conceptualization, M.H. and M.H.; methodology, M.H.; software, M.H., S.K.P.; formal analysis, M.H.; investigation, M.H., S.K.P.; resources, M.H.; data curation, M.H., S.K.P.; writing—original draft preparation, M.H., S.K.P.; writing—review and editing, M.H.; visualization, S.K.P.; supervision, S.K.P.; project administration, S.K.P.; funding acquisition. All authors have read and agreed to the published version of the manuscript.
Funding
This research was supported under the grant of Basic Science Research Program through the National Research Foundation of Korea (NRF) funded by the Ministry of Education at 2018R1A6A1A08025520 and granted to S. K. Park.
Institutional Review Board Statement
Not Applicable.
Informed Consent Statement
Not Applicable.
Acknowledgments
The first author would like to thank Ewha Global Partnership Program (EGPP) and Samsung Dream Fellowship for providing education and research platforms.
Conflicts of Interest
The Authors declare no conflict of interest.
References
- Desjardins, J. Mapping the Top Export of Every Country. Visual Capitalist. 12 March 2018. Available online: https://www.visualcapitalist.com/giant-map-top-export-every-country/ (accessed on 11 December 2020).
- McCarthy, N. Nearly Half of Germany’s Electricity Has Come from Wind and Solar This Year. World Economic Forum. 17 August 2020. Available online: https://www.weforum.org/agenda/2020/08/where-solar-wind-power-are-thriving (accessed on 5 January 2021).
- BPDB. Bangladesh Power Development Board: Key Statistic. 2020. Available online: https://www.bpdb.gov.bd/bpdb_new/index.php/site/page/13e9-2cc0-ce41-9c09-088d-94d5-f546-04a6-b4fa-1d18 (accessed on 8 November 2020).
- Shaikh, A.; Chowdhury, K.M.A.; Sen, S.; Islam, M.M. Potentiality of Wind Power Generation along the Bangladesh Coast. AIP Conf. Proc. 2017, 1919, 020035–020039. [Google Scholar]
- Amin, N.; Langendoen, R. Grameen Shakti: A Renewable Energy Social Business Model for Global Replication. In Proceedings of the 2012 IEEE Global Humanitarian Technology Conference, Seattle, WA, USA, 21–24 October 2012. [Google Scholar]
- Rahman, F. Prospects of wind energy in Bangladesh. Renew. Energy 1996, 9, 806–809. [Google Scholar] [CrossRef]
- Khan, M.G.K.; Rahman, T.; Alam, M.M. Wind Energy in Bangladesh: Prospects and Utilization Initiatives. In Proceedings of the 3rd International Conference on Electrical & Computer Engineering (ICECE), Dhaka, Bangladesh, 28–30 December 2004; pp. 474–477. [Google Scholar]
- Hoque, M.N.; Ghosh, H.R.; Nandi, S.K. Availability of wind resource at few prospective locations of Bangladesh. Dhaka Univ. J. Sci. 2010, 59, 155–156. [Google Scholar]
- Ghosh, S.K.; Shawon, M.H.; Rahman, A.; Nath, S.K. Wind Energy Assessment using Weibull Distribution in Coastal Areas of Bangladesh. IEEE Xplore 2014, 1–6. [Google Scholar]
- Nandi, S.K.; Ghosh, H.R. Techno-economical analysis of off-grid hybrid systems at Kutubdia Island, Bangladesh. Energy Policy 2010, 38, 976–980. [Google Scholar] [CrossRef]
- Nandi, S.K.; Hoque, M.N.; Ghosh, H.R.; Roy, S.K. Potential of Wind and Solar Electricity Generation in Bangladesh. ISRN Renew. Energy 2012, 2012, 1–10. [Google Scholar] [CrossRef] [Green Version]
- Nandi, S.K.; Hoque, M.N.; Ghosh, H.R.; Chowdhury, R. Assessment of Wind and Solar Energy Resources in Bangladesh. Arab. J. Sci. Eng. 2012, 38, 3113–3123. [Google Scholar] [CrossRef]
- Nandi, S.K.; Ghosh, H.R. Prospect of wind–PV-battery hybrid power system as an alternative to grid extension in Bangladesh. Energy 2010, 35, 3040–3047. [Google Scholar] [CrossRef]
- Khan, P.A. Wind Energy Potential Estimation for Different Regions of Bangladesh. Int. J. Renew. Sustain. Energy 2014, 3, 47. [Google Scholar] [CrossRef] [Green Version]
- Shezan, S.A.; Saidur, R.; Ullah, K.; Hossain, A.B.M.S.; Chong, W.T.; Julai, S. Feasibility analysis of a hybrid off-grid wind–DG-battery energy system for the eco-tourism remote areas. Clean Technol. Environ. Policy 2015, 17, 2417–2430. [Google Scholar] [CrossRef]
- Faijer, M.J.; Arends, E. Wind Energy Potential Bangladesh: Baseline Study; Wind Mind Internationals: Hengelo, The Netherlands, 2017. [Google Scholar]
- Jacobson, M.D.; Draxl, C.; Jimenez, T.; O’Neill, B.L.; Capozzola, T.; Lee, J.A.; Vandenberghe, F.; Haupt, S.E.; Jimenez, A. Assessing the Wind Energy Potential in Bangladesh: Enabling Wind Energy Development with Data Products; USAID-NREL, Department of Energy: Washington, DC, USA, 2018. [Google Scholar] [CrossRef] [Green Version]
- Corti, F.; Laudani, A.; Lozito, G.M.; Reatti, A. Computationally Efficient Modeling of DC-DC Converters for PV Applications. Energies 2020, 13, 5100. [Google Scholar] [CrossRef]
- Madlool, N.A.; Hossain, M.S.; Alshukri, M.J.; Selvaraj, J.; A Taher, A.; Das Gupta, V.; Mazumder, P.; Rahim, N.A. Investigation on wind energy for grid connection in Bangladesh: Case study. IOP Conf. Ser. Mater. Sci. Eng. 2021, 1127, 012021. [Google Scholar] [CrossRef]
- Renani, E.T.; Elias, M.F.M.; Rahim, N.A. Using data-driven approach for wind power prediction: A comparative study. Energy Convers. Manag. 2016, 118, 193–203. [Google Scholar] [CrossRef]
- Wang, Y. A summary of wind power prediction methods. AIP Conf. Proc. 2018, 1971, 040003. [Google Scholar] [CrossRef]
- Peng, H.; Liu, F.; Yang, X. A hybrid strategy of short term wind power prediction. Renew. Energy 2013, 50, 590–595. [Google Scholar] [CrossRef]
- Wang, L.; Liu, J.; Qian, F. Wind speed frequency distribution modeling and wind energy resource assessment based on polynomial regression model. Int. J. Electr. Power Energy Syst. 2021, 130, 106964. [Google Scholar] [CrossRef]
- Elfarra, M.A.; Kaya, M. Comparison of Optimum Spline-Based Probability Density Functions to Parametric Distributions for the Wind Speed Data in Terms of Annual Energy Production. Energies 2018, 11, 3190. [Google Scholar] [CrossRef] [Green Version]
- Marčiukaitis, M.; Žutautaitė, I.; Martišauskas, L.; Jokšas, B.; Gecevičius, G.; Sfetsos, A. Non-linear regression model for wind turbine power curve. Renew. Energy 2017, 113, 732–741. [Google Scholar] [CrossRef]
- El Kafazi, I.; Bannari, R.; Abouabdellah, A.; Aboutafail, M.O.; Guerrero, J. Energy Production: A Comparison of Forecasting Methods using the Polynomial Curve Fitting and Linear Regression. In Proceedings of the 2017 International Renewable and Sustainable Energy Conference (IRSEC), Tangier, Morocco, 4–7 December 2017. [Google Scholar] [CrossRef]
- Wallace, M.; Hobbs, P.V. Atmospheric Science: An Introductory Survey, 2nd ed.; Elsevier Academy Press: Amsterdam, The Netherlands, 2011. [Google Scholar]
- Harbola, S.; Coors, V. Comparative Analysis of LSTM, RF and SVM Architectures for Predicting Wind Nature for Smart City Planning. In Proceedings of the ISPRS Annals of the Photogrammetry, Remote Sensing and Spatial Information Sciences, Volume IV-4/W9, Proceedings of the 4th International Conference on Smart Data and Smart Cities, Kuala Lumpur, Malaysia, 1–3 October 2019; pp. 65–70. [Google Scholar] [CrossRef] [Green Version]
- Pandit, R.K.; Kolios, A.; Infield, D. Data-driven weather forecasting models performance comparison for improving offshore wind turbine availability and maintenance. IET Renew. Power Gener. 2020, 14, 2386–2394. [Google Scholar] [CrossRef]


Publisher’s Note: MDPI stays neutral with regard to jurisdictional claims in published maps and institutional affiliations. |
© 2021 by the authors. Licensee MDPI, Basel, Switzerland. This article is an open access article distributed under the terms and conditions of the Creative Commons Attribution (CC BY) license (https://creativecommons.org/licenses/by/4.0/).