
Influence of Air Pressure on the Resonance Properties of a T-Shaped Quartz Tuning Fork Coupled with Resonator Tubes


 ,
, 
 ,
, 
 ,
,  and
and 
Abstract
:1. Introduction
2. Theoretical Model of a Quartz Tuning Fork
2.1. Mechanical Model
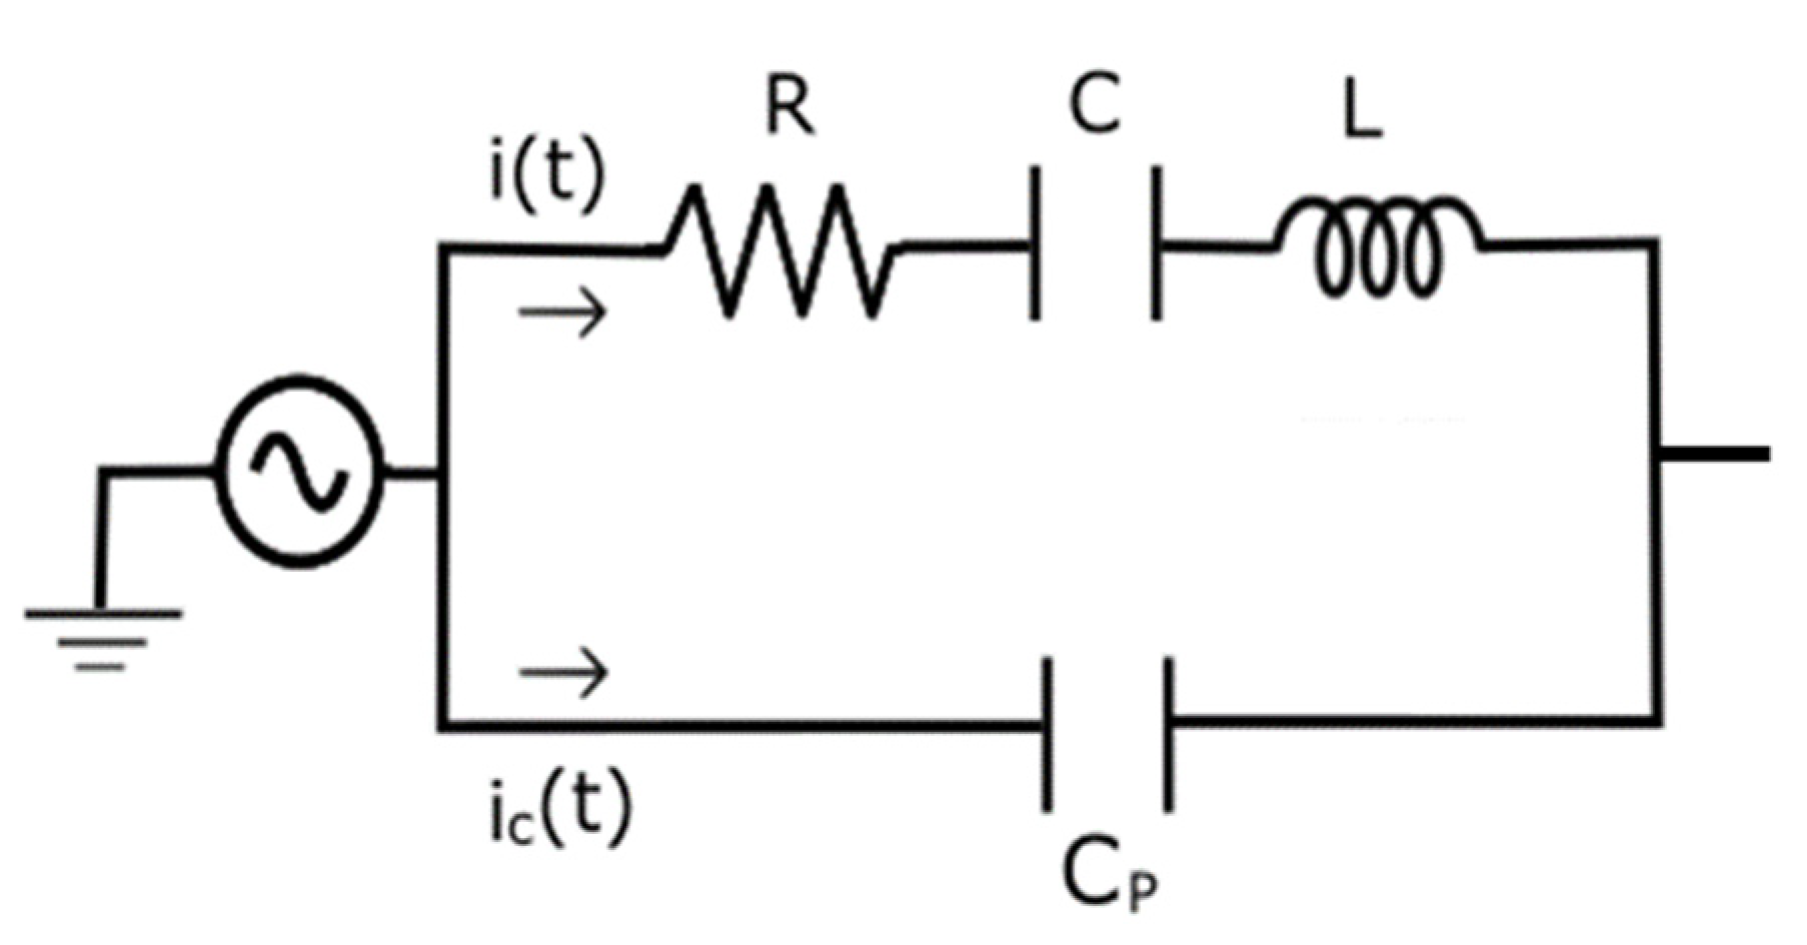
2.2. Electrical Model
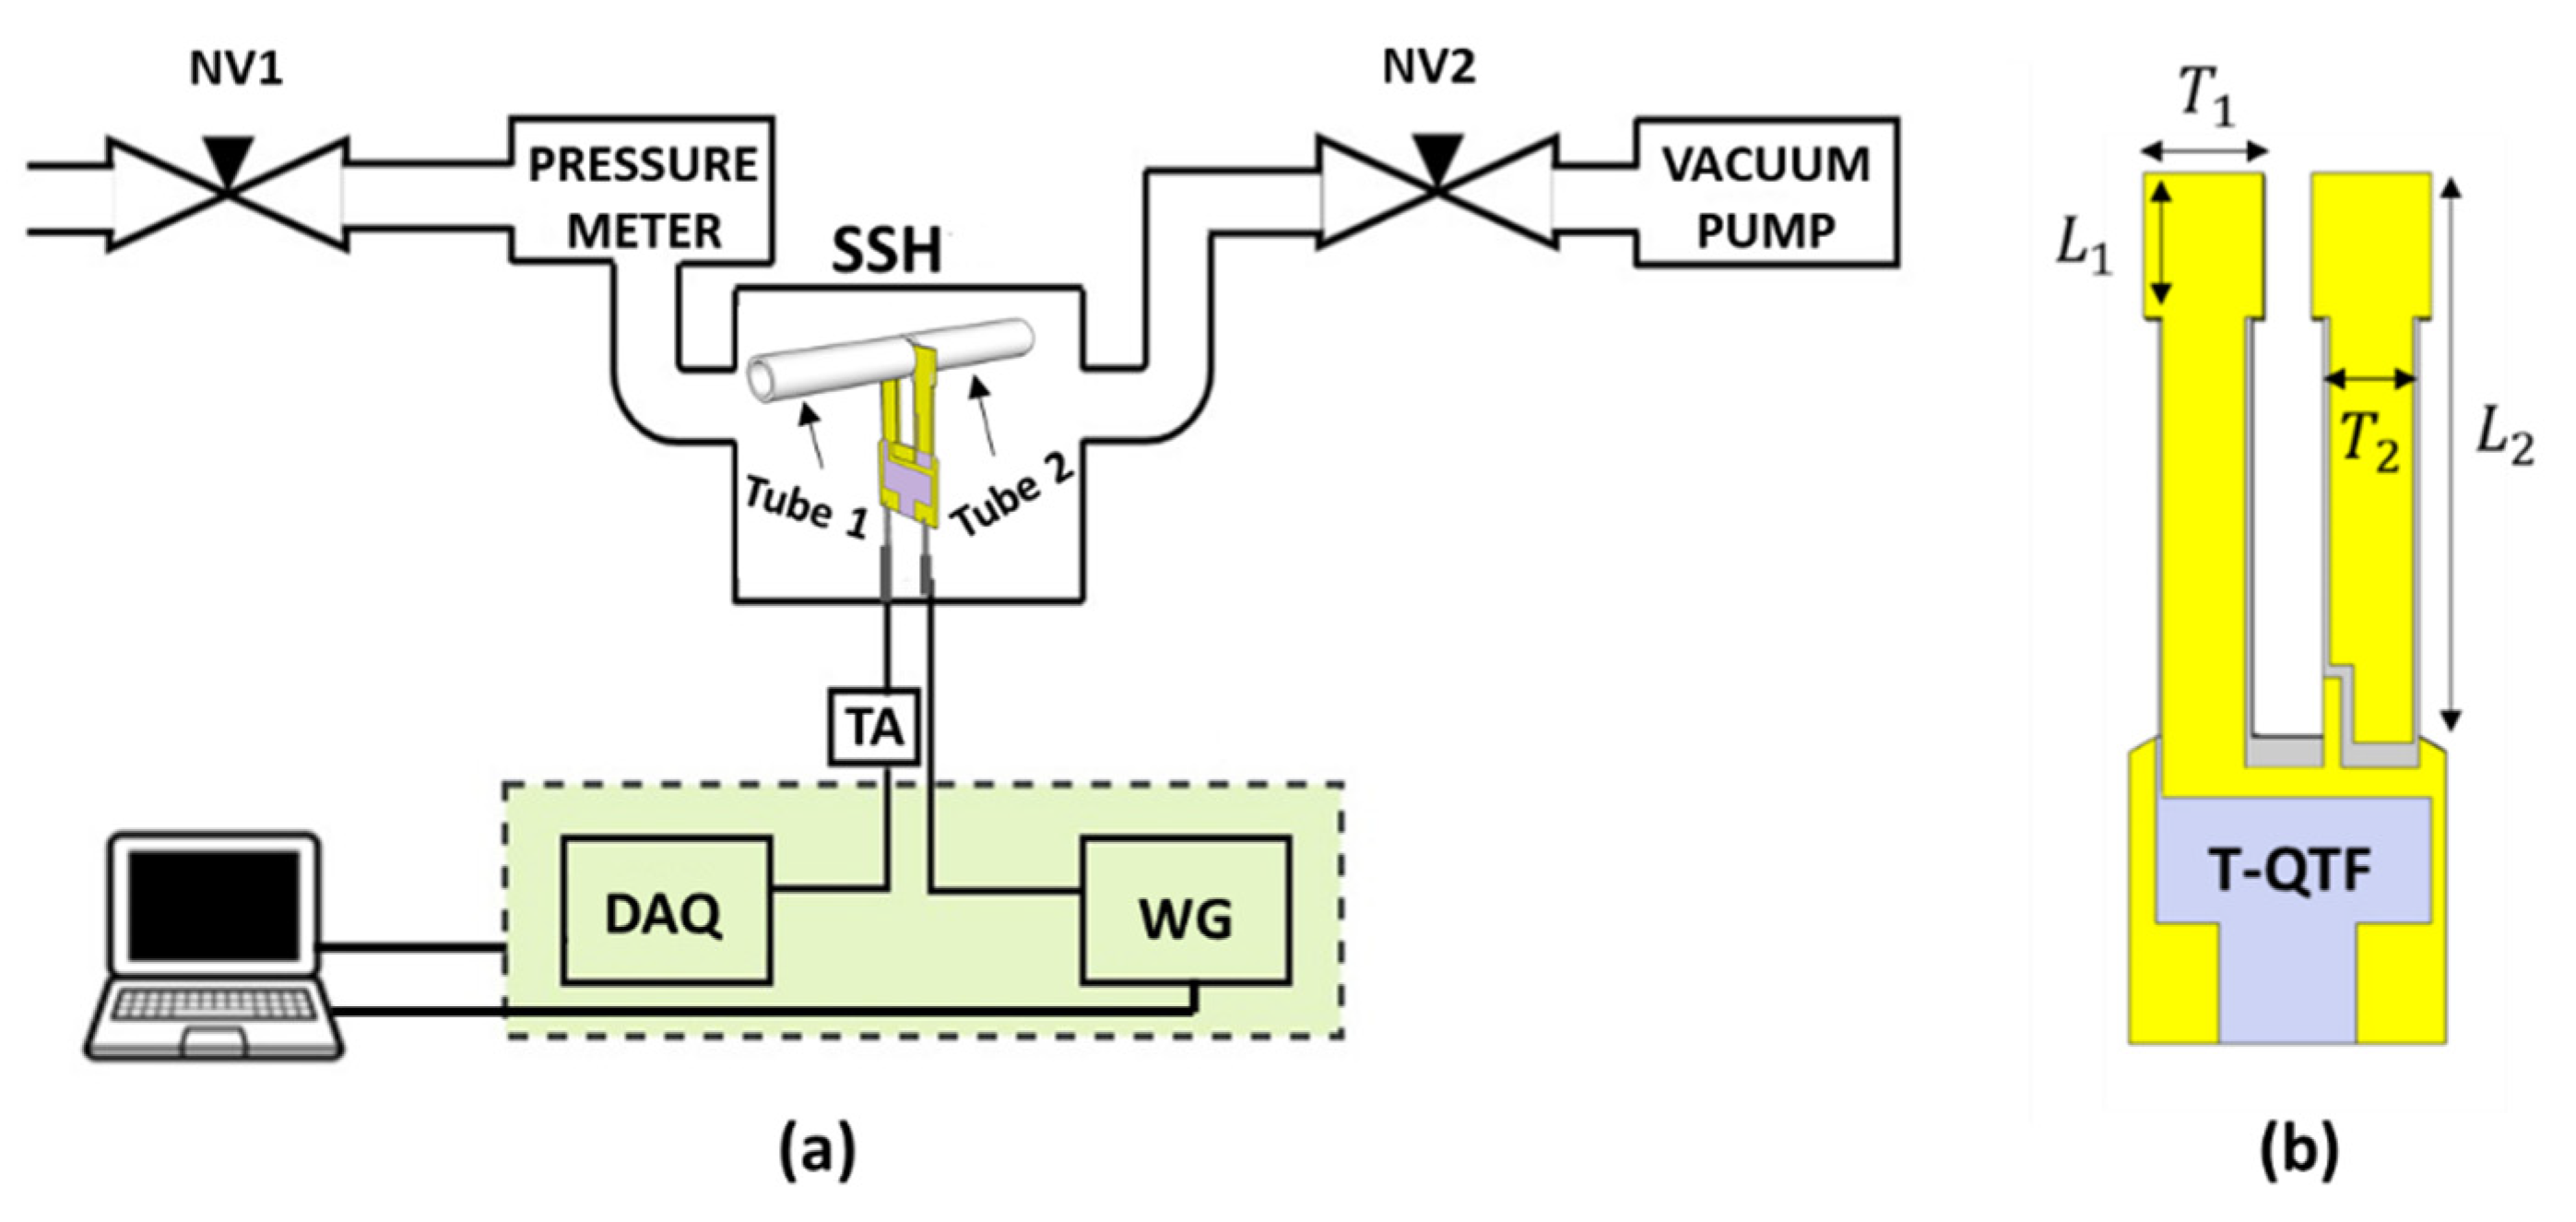
3. Experimental Setup
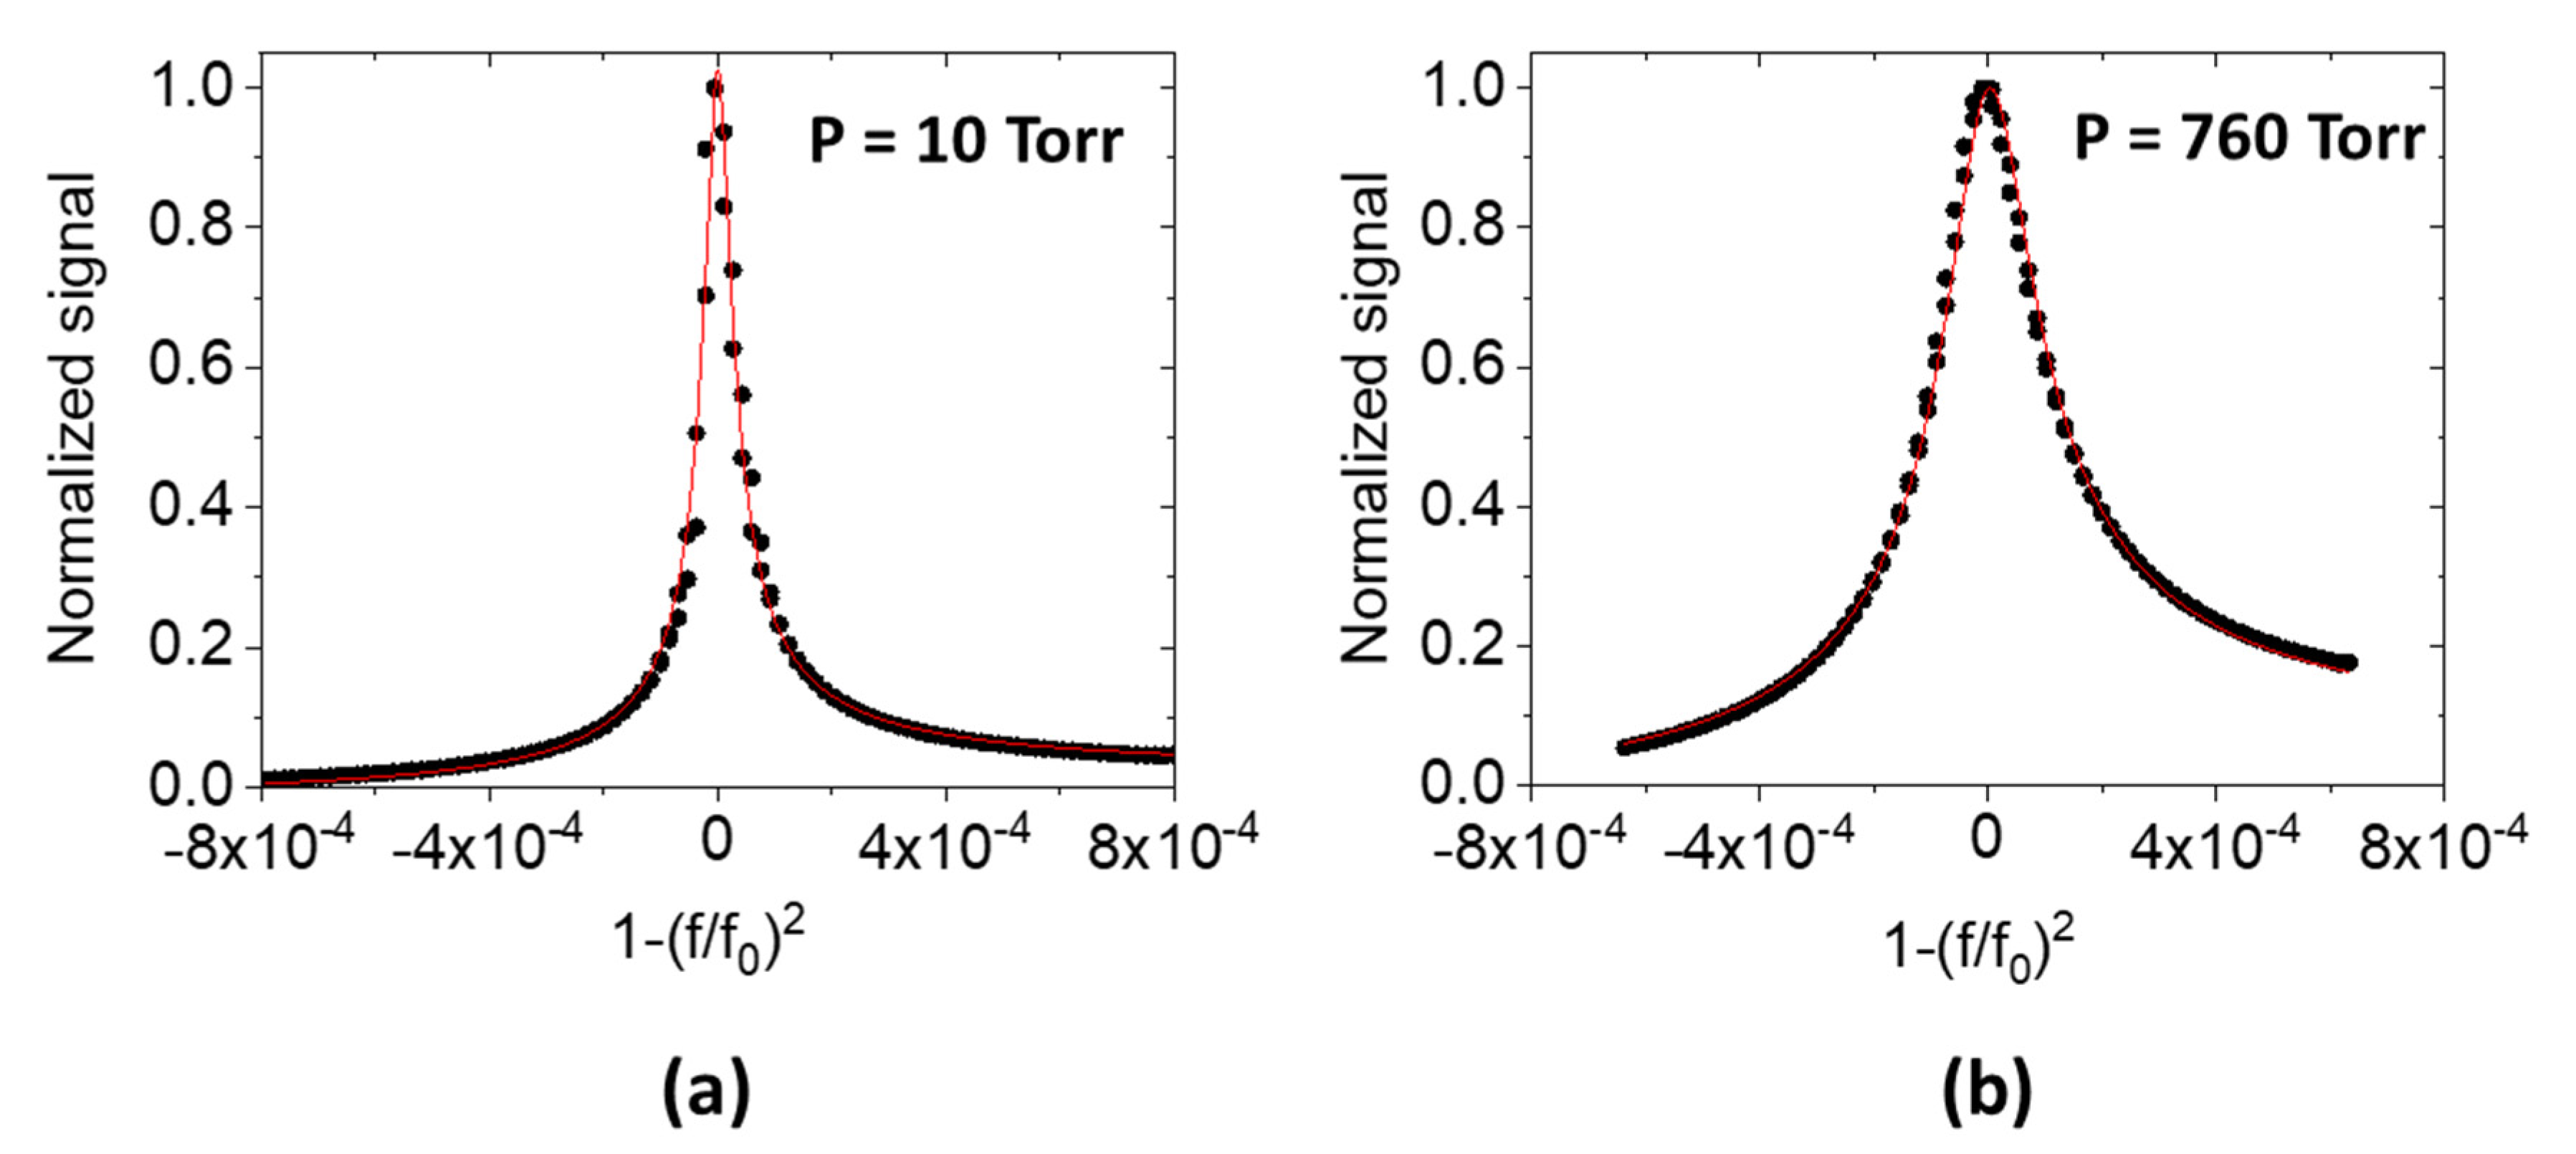
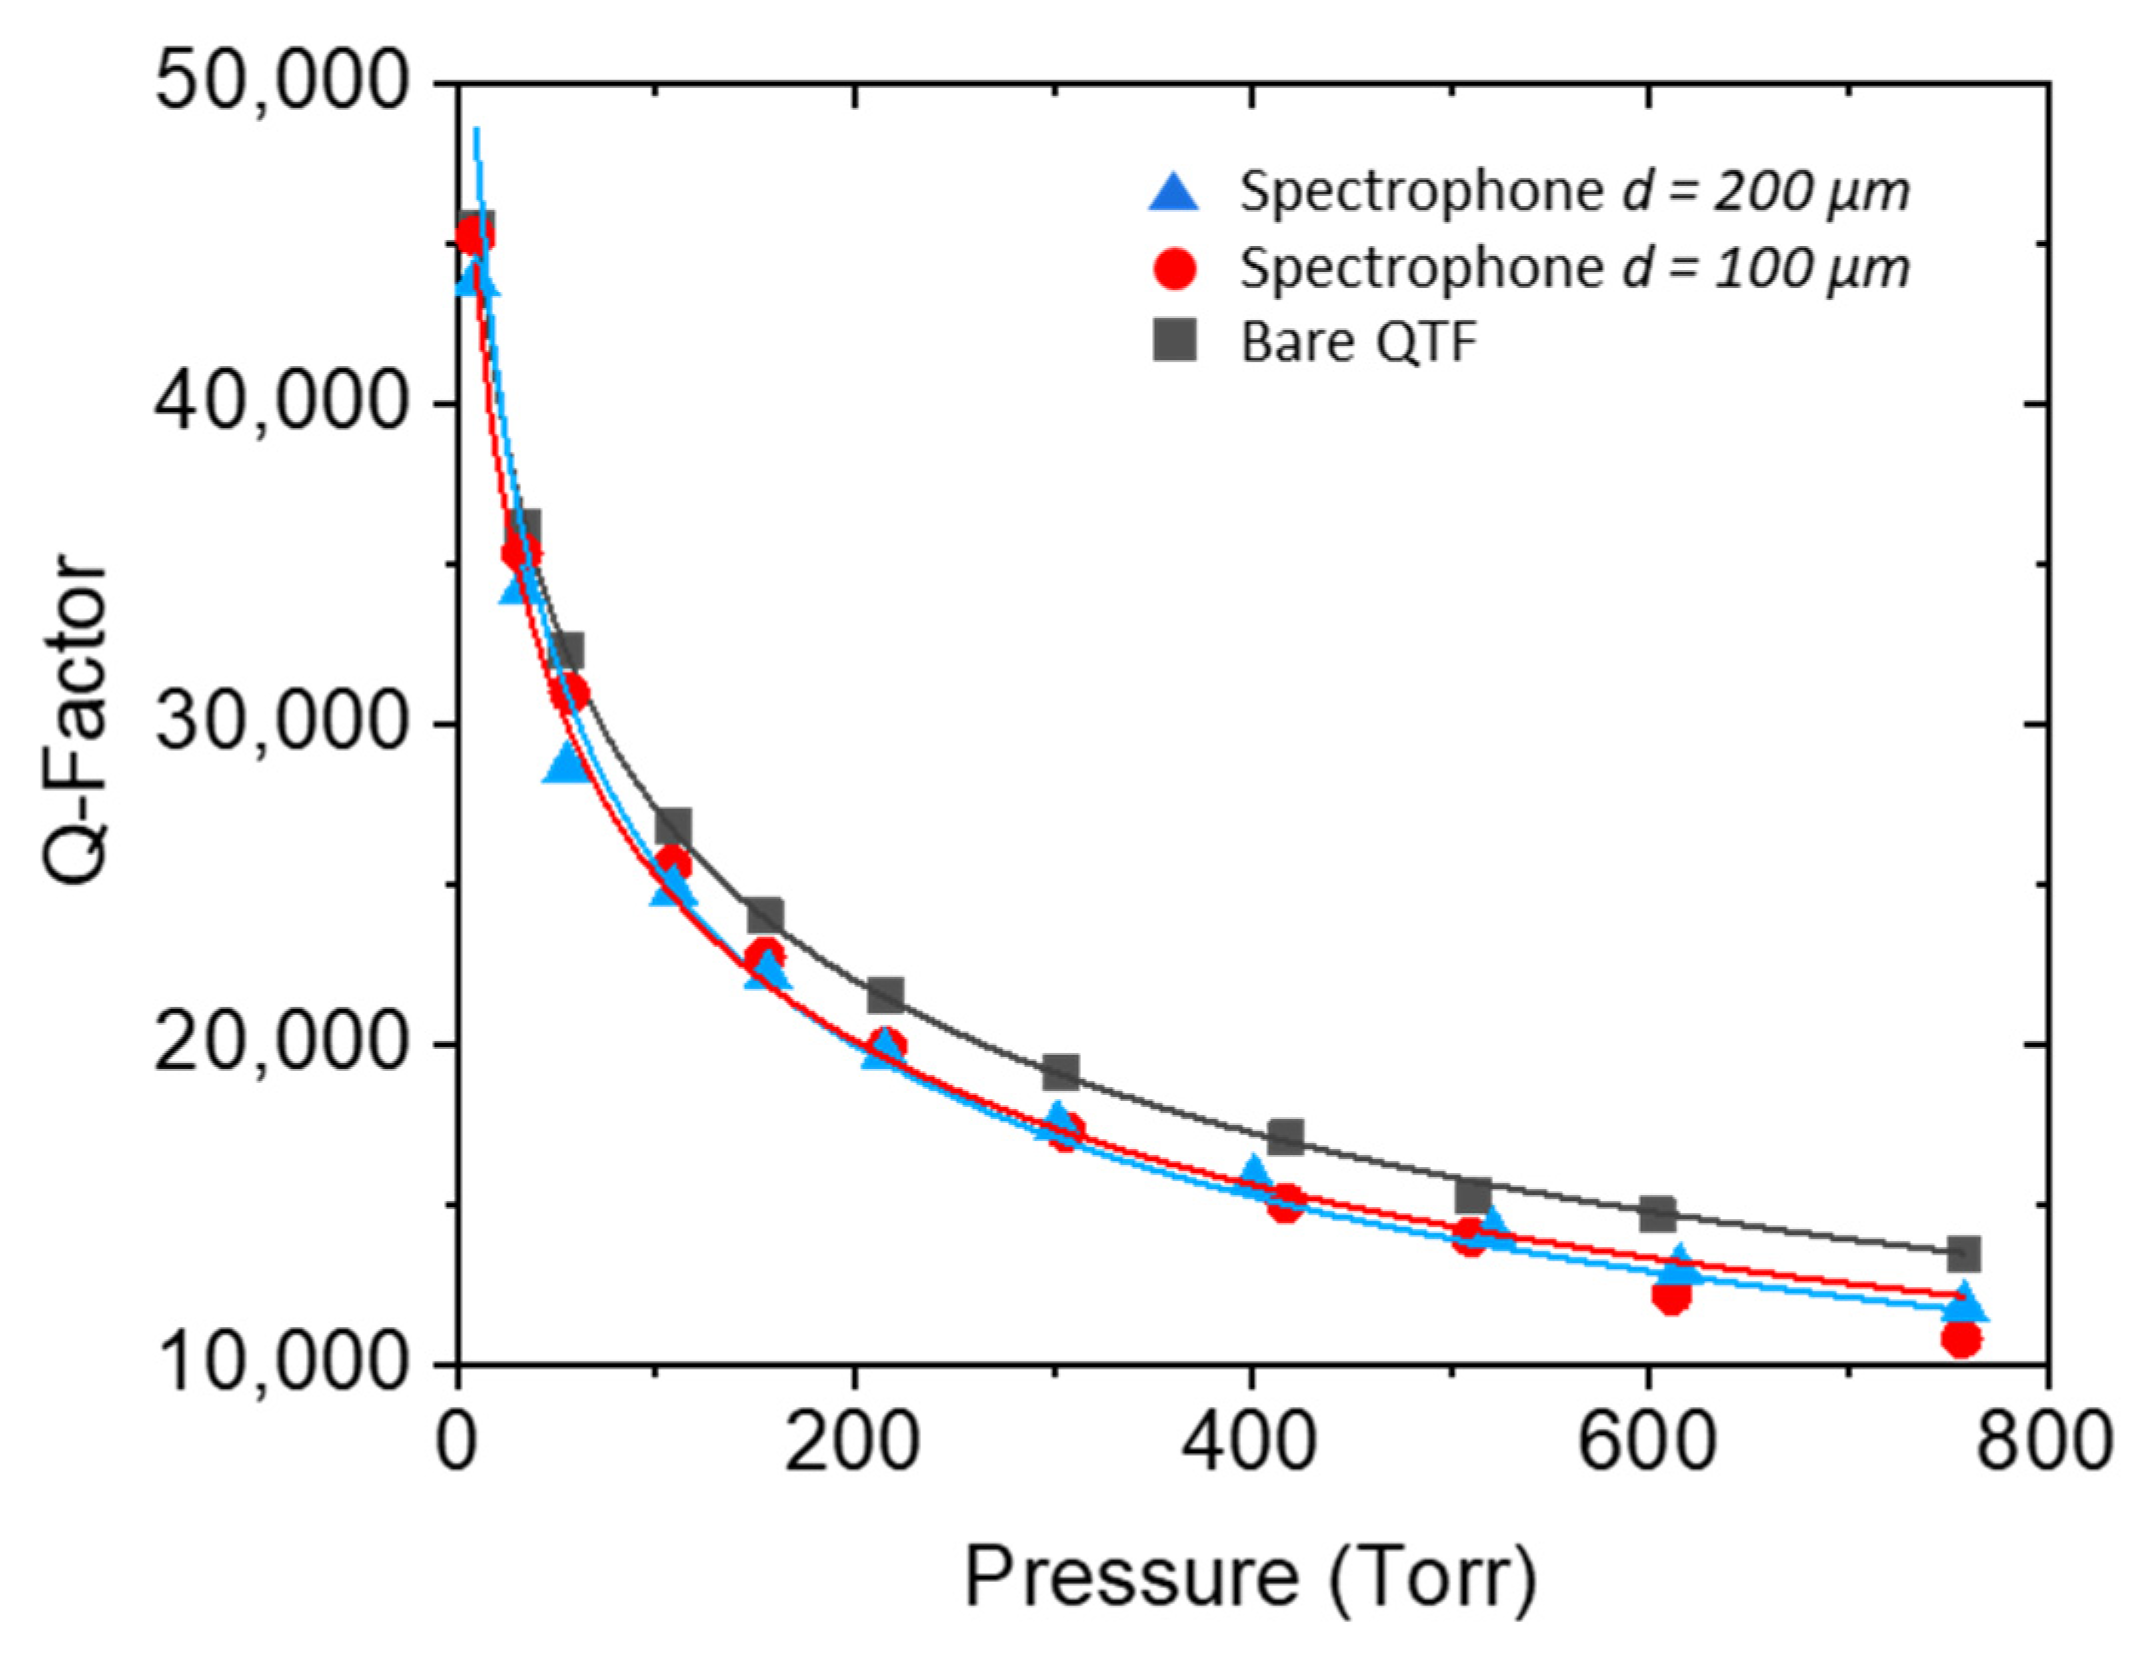
4. Results
5. Conclusions
Author Contributions
Funding
Institutional Review Board Statement
Informed Consent Statement
Data Availability Statement
Conflicts of Interest
References
- Friedt, J.-M.; Carry, É. Introduction to the quartz tuning fork. Amer. J. Phys. 2007, 75, 415–422. [Google Scholar] [CrossRef] [Green Version]
- Lee, S.; Lee, J.-Y.; Park, T.-S. Fabrication of SMD 32.768 kHz tuning fork-type crystals: Photolithography and selective etching of an array of quartz tuning fork resonators. Mater. Corros. 2001, 52, 712–715. [Google Scholar] [CrossRef]
- Gaudiuso, C.; Volpe, A.; Ancona, A. One-step femtosecond laser stealth dicing of quartz. Micromachines 2020, 11, 327. [Google Scholar] [CrossRef] [Green Version]
- Zheng, H.; Liu, Y.; Lin, H.; Liu, B.; Gu, X.; Li, D.; Huang, B.; Wu, Y.; Dong, L.; Zhu, W.; et al. Quartz-enhanced photoacoustic spectroscopy employing pilot line manufactured custom tuning forks. Photoacoustics 2020, 17, 100158. [Google Scholar] [CrossRef] [PubMed]
- Duquesnoy, M. Tuning Forks in Photoacoustic Spectroscopy: Comparative Study and New Developments. Doctoral Thesis, Universitè Paris-Saclay, Gif-sur-Yvette, France, 2021. [Google Scholar]
- Zhou, S.; Xu, L.; Zhang, L.; He, T.; Liu, N.; Liu, Y.; Yu, B.; Li, J. External cavity quantum cascade laser-based QEPAS for chlorodifluoromethane spectroscopy and sensing. Appl. Phys. B 2019, 125, 125. [Google Scholar] [CrossRef]
- Patimisco, P.; Sampaolo, A.; Dong, L.; Tittel, F.K.; Spagnolo, V. Recent advances in quartz enhanced photoacoustic sensing. Appl. Phys. Rev. 2018, 5, 011106. [Google Scholar] [CrossRef]
- Patimisco, P.; Sampaolo, A.; Giglio, M.; Mackowiak, V.; Rossmadl, H.; Gross, B.; Cable, A.; Tittel, F.K.; Spagnolo, V. Octupole electrode pattern for tuning forks vibrating at the first overtone mode in quartz-enhanced photoacoustic spectroscopy. Opt. Lett. 2018, 43, 1854–1857. [Google Scholar] [CrossRef] [PubMed]
- Hosaka, H.; Itao, K.; Kuroda, S. Damping characteristics of beam-shaped micro-oscillators. Sens. Actuat. A Phys. 1995, 49, 87–95. [Google Scholar] [CrossRef]
- Aoust, G.; Levy, R.; Bourgeteau, B.; Le Traon, O. Acoustic damping on flexural mechanical resonators. Sens. Actuat. A Phys. 2016, 238, 158–166. [Google Scholar] [CrossRef]
- Hao, Z.; Erbil, A.; Ayazi, F. An analytical model for support loss in micromachined beam resonators with in-plane flexural vibrations. Sens. Actuat. A Phys. 2003, 109, 156–164. [Google Scholar] [CrossRef]
- Zener, C. Internal friction in solids II. General theory of thermoelastic internal friction. Phys. Rev. 1938, 53, 90–99. [Google Scholar] [CrossRef]
- Dello Russo, S.; Sampaolo, A.; Patimisco, P.; Menduni, G.; Giglio, M.; Hoelzl, C.; Passaro, V.M.N.; Wu, H.; Dong, L.; Spagnolo, V. Quartz-enhanced photoacoustic spectroscopy exploiting low-frequency tuning forks as a tool to measure the vibrational relaxation rate in gas species. Photoacoustics 2021, 21, 100227. [Google Scholar] [CrossRef]
- Patimisco, P.; Sampaolo, A.; Giglio, M.; Dello Russo, S.; Mackowiak, V.; Rossmadl, H.; Cable, A.; Tittel, F.K.; Spagnolo, V. Tuning forks with optimized geometries for quartz-enhanced photoacoustic spectroscopy. Opt. Express 2019, 27, 1401–1415. [Google Scholar] [CrossRef] [Green Version]
- Patimisco, P.; Sampaolo, A.; Zheng, H.; Dong, L.; Tittel, F.K.; Spagnolo, V. Quartz-enhanced photoacoustic spectrophones exploiting custom tuning forks: A review. Adv. Phys. X 2016, 2, 169–187. [Google Scholar] [CrossRef]
- Dong, L.; Kostereve, A.A.; Thomazy, D.; Tittel, F.K. QEPAS spectrophones: Design, optimization, and performance. Appl. Phys. B 2010, 100, 627–635. [Google Scholar] [CrossRef]
- Aoust, G.; Levy, R.; Bourgeteau, B.; Le Traon, O. Viscous damping on flexural mechanical resonators. Sens. Actuat. A Phys. 2015, 230, 126–135. [Google Scholar] [CrossRef]
- Vignola, J.F.; Judge, J.A.; Jarzynski, J.; Zalalutdinov, M.K.; Houston, B.H.; Baldwin, J.W. Effect of viscous loss on mechanical resonators designed for mass detection. Appl. Phys. Lett. 2006, 88, 041921. [Google Scholar] [CrossRef]
- Milde, T.; Hoppe, M.; Tatenguem, H.; Mordmuller, M.; O’Gorman, J.; Willer, U.; Schade, W.; Sacher, J. QEPAS sensor for breath analysis: A behavior of pressure. Appl. Opt. 2018, 57, 120–127. [Google Scholar] [CrossRef] [PubMed]
- Patimisco, P.; Sampaolo, A.; Dong, L.; Giglio, M.; Scamarcio, G.; Tittel, F.K.; Spagnolo, V. Analysis of the electro-elastic properties of custom quartz tuning forks for optoacoustic gas sensing. Sens. Actuat. B Chem. 2016, 227, 539–546. [Google Scholar] [CrossRef]
- Christen, M. Air and gas damping of quartz tuning forks. Sens. Actuators 1983, 4, 554–555. [Google Scholar] [CrossRef]
- Sader, J.E. Frequency response of cantilever beams immersed in viscous fluids with applications to the atomic force microscope. J. Appl. Phys. 1998, 84, 64–76. [Google Scholar] [CrossRef] [Green Version]
- Lee, M.; Kim, B.; An, S.; Jhe, W. Dynamic responses of electrically driven quartz tuning fork and qplus sensor: A comprehensive electromechanical model for quartz tuning fork. Sensors 2019, 19, 2686. [Google Scholar] [CrossRef] [PubMed] [Green Version]
- Patimisco, P.; Scamarcio, G.; Tittel, F.K.; Spagnolo, V. Quartz-Enhanced Photoacoustic Spectroscopy: A Review. Sensors 2014, 14, 6165–6206. [Google Scholar] [CrossRef] [PubMed] [Green Version]
- Dello Russo, S.; Zifarelli, A.; Patimisco, P.; Sampaolo, A.; Wei, Y.; Wu, H.; Dong, L.; Spagnolo, V. Light-induced thermo-elastic effect in quartz tuning forks exploited as a photodetector in gas absorption spectroscopy. Opt. Express 2020, 28, 19074–19084. [Google Scholar] [CrossRef] [PubMed]


| L1 | L2 | T1 | T2 | w | |
| T-QTF | 2.4 | 9.4 | 2.0 | 1.4 | 0.25 |
| L | OD | ID | |||
| Tubes | 12 | 1.83 | 1.59 |
| Bare QTF | Spectrophone d = 100 μm | Spectrophone d = 200 μm | |
|---|---|---|---|
| f0 (Hz) | 12,455.01 | 12,455.05 | 12,455.11 |
| m (Hz/Torr) | 1.31 × 10⁻³ | 1.19 × 10⁻³ | 1.10 × 10⁻³ |
| u0 (kg/(m × Torr)) | 1.95 × 10⁻¹⁰ | 1.77 × 10⁻¹⁰ | 1.64 × 10⁻¹⁰ |
Publisher’s Note: MDPI stays neutral with regard to jurisdictional claims in published maps and institutional affiliations. |
© 2021 by the authors. Licensee MDPI, Basel, Switzerland. This article is an open access article distributed under the terms and conditions of the Creative Commons Attribution (CC BY) license (https://creativecommons.org/licenses/by/4.0/).
Share and Cite
Olivieri, M.; Zifarelli, A.; Menduni, G.; Di Gioia, M.; Marzocca, C.; Passaro, V.M.N.; Sampaolo, A.; Giglio, M.; Spagnolo, V.; Patimisco, P. Influence of Air Pressure on the Resonance Properties of a T-Shaped Quartz Tuning Fork Coupled with Resonator Tubes. Appl. Sci. 2021, 11, 7974. https://doi.org/10.3390/app11177974
Olivieri M, Zifarelli A, Menduni G, Di Gioia M, Marzocca C, Passaro VMN, Sampaolo A, Giglio M, Spagnolo V, Patimisco P. Influence of Air Pressure on the Resonance Properties of a T-Shaped Quartz Tuning Fork Coupled with Resonator Tubes. Applied Sciences. 2021; 11(17):7974. https://doi.org/10.3390/app11177974
Chicago/Turabian StyleOlivieri, Mariagrazia, Andrea Zifarelli, Giansergio Menduni, Michele Di Gioia, Cristoforo Marzocca, Vittorio M. N. Passaro, Angelo Sampaolo, Marilena Giglio, Vincenzo Spagnolo, and Pietro Patimisco. 2021. "Influence of Air Pressure on the Resonance Properties of a T-Shaped Quartz Tuning Fork Coupled with Resonator Tubes" Applied Sciences 11, no. 17: 7974. https://doi.org/10.3390/app11177974
APA StyleOlivieri, M., Zifarelli, A., Menduni, G., Di Gioia, M., Marzocca, C., Passaro, V. M. N., Sampaolo, A., Giglio, M., Spagnolo, V., & Patimisco, P. (2021). Influence of Air Pressure on the Resonance Properties of a T-Shaped Quartz Tuning Fork Coupled with Resonator Tubes. Applied Sciences, 11(17), 7974. https://doi.org/10.3390/app11177974