Article

Probabilistic and Semi-Probabilistic Analysis of Slender Columns Frequently Used in Structural Engineering

1
Department of Civil Engineering and Natural Hazards, University of Natural Resources and Life Sciences, 1190 Vienna, Austria
2
Faculty of Civil Engineering, University of Zagreb, 10000 Zagreb, Croatia
3
ISISE, Department of Civil Engineering, University of Minho, 4800-058 Guimarães, Portugal
4
Faculty of Civil Engineering, Slovak University of Technology in Bratislava, 81107 Bratislava, Slovakia
5
Department of Structural Engineering and Building Materials, Ghent University, 9052 Ghent, Belgium
6
Cerema, DTecITM/DTOA, 77447 Champs-sur-Marne, France
*
Author to whom correspondence should be addressed.
Appl. Sci. 2021, 11(17), 8009; https://doi.org/10.3390/app11178009
Submission received: 26 June 2021 / Revised: 11 August 2021 / Accepted: 11 August 2021 / Published: 30 August 2021

Abstract

:
The stability of slender columns is a topic that has been dealt with in research and practice for many years. The importance of this topic also increases with the possibility of using non-linear modeling approaches to determine the stability and with the increasingly complex safety formats. In order to show the complexity and the variability associated with the non-linear models, two previous contributions discussed and compared (a) the results of the Round Robin Non-Linear Modeling, and (b) the existing international associated standard specifications and safety concepts with respect to experimental results. The aim herein is to determine the reliability level (safety index) on the basis of these investigations and findings and to examine the existing safety formats of classical and extended probabilistic analyses and to derive any necessary adjustments. In addition, the method of the safety format Estimation of Coefficient of Variance of resistance (ECOV) is used for the determination of the global safety resistance factors based on the non-linear analyses’ findings of the Round Robin modeling partners.

1. Introduction

In current structural engineering practice, structures are typically designed in order to fulfil stability and serviceability requirements. Both requirements are related to a predefined period of time (durability and service life criteria) which should be achieved at minimum cost (economical and investment criteria). These requirements are typically formulated using a so-called limit state condition which associates the input parameters reflecting the resistance and the action sides of the structural evaluation. The input, which can be physical (dimensions, material strength, loads) or of dimensionless values, is then typically associated with a given level of uncertainty [1,2]. Therefore, the input parameters are treated within a reliability framework as random variables. The limit state function (G) delineates the acceptable region of a system’s performance with respect to a certain failure mode and typically represents a mathematical formulation in terms of the key input parameters. The failure is then attributed to specific combinations of the parameters and is conventionally defined by the condition G < 0. The failure probability of the considered state results from the system or element reliability. These notions determine whether a structural engineering design aims to ensure stability, serviceability or other limit states. The main focus of this investigation is the structural reliability assessment of designed slender concrete columns at the ultimate state.
The general approach described above can be implemented by applying various formats of different intricacies together with their corresponding efficiencies. Recent experimental studies for slender reinforced concrete columns [3] have indicated that the classical design approaches for distinguished N-M combinations are too conservative and so cannot meet the reliability level that is required in current design standards and the desired level of structural safety required in modern societies [4,5,6]. Simultaneously, due to the rapidly developing computational technologies and formats, more sophisticated numerical probabilistic simulations and non-linear calculation formats are becoming more important and finding their way into engineering practice [7]. Such non-linear calculation formats require an extended understanding of a multitude of material specific properties, modeling procedures and analysis formats. Despite the explicit possibilities in EN 1992-1-1 [8] of using non-linear formats, there is still a need for the development of more consistent safety formats [9,10,11,12,13,14,15,16] for predicting the stability failure of slender columns.
A key aspect in deciding on the appropriate configuration of non-linear calculations is the consideration of possible variations in complex and interacting input parameters. To that end, Strauss et al. [4] indicated the reliability deficiencies in the above-mentioned design situation of slender columns by assessing to what extent a group of peer institutions can capture this deficiency with independent non-linear numerical analyses. Furthermore, this study allowed a quantification of the modeling and calculation uncertainties [15]. In this context, it should be mentioned that there are already several studies in which uncertainties are analyzed on the structural behavior and design of slender columns, like for example [17].
However, the uncertainties due to the variability of material properties, constitutive laws, geometries, loads and loading applications were not further investigated on the basis of a formal probabilistic analysis.
Hence, the main objective of this paper is to discuss the probabilistic verification of the stability of slender columns. The associated research questions regarding the deterministic and probabilistic non-linear calculations for slender reinforced concrete columns, see also [18,19,20], provided the basis for the further studies presented in this paper. The studies gave rise to the discussion and analysis of the following novel elements:
(a)
The clear definition of the steps required for the probabilistic verification of the N-M stability of slender columns with regard to scattering interaction diagrams (I-D) [see EN 1992-1] [8].
(b)
The realistic determination of the safety level (evaluation of a possible safety risk) as well as the model uncertainties [21,22] of the non-linear probabilistic support analyses compared to experimentally determined N-M graphs and in relation to the EN1992-1 specific I-Ds.
(c)
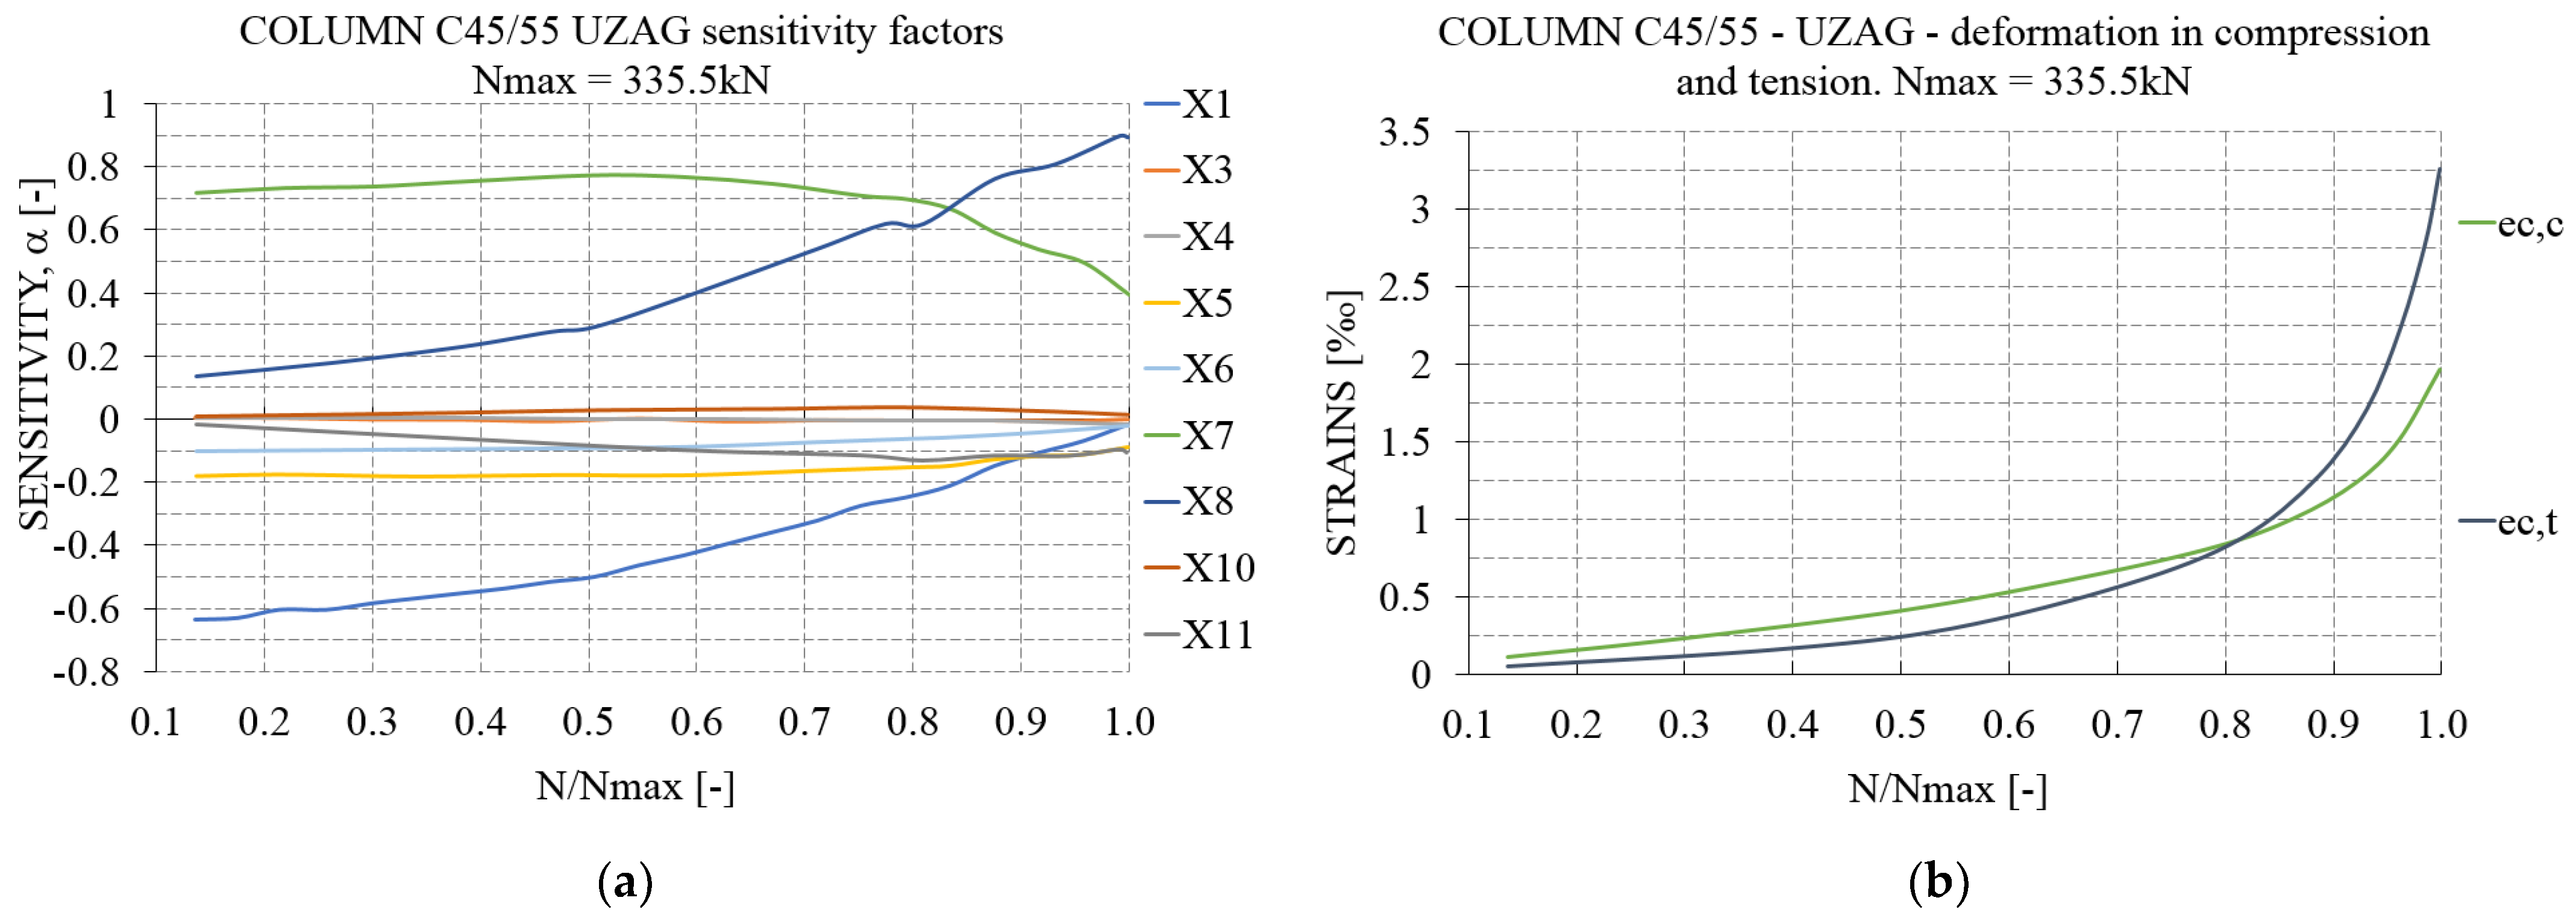
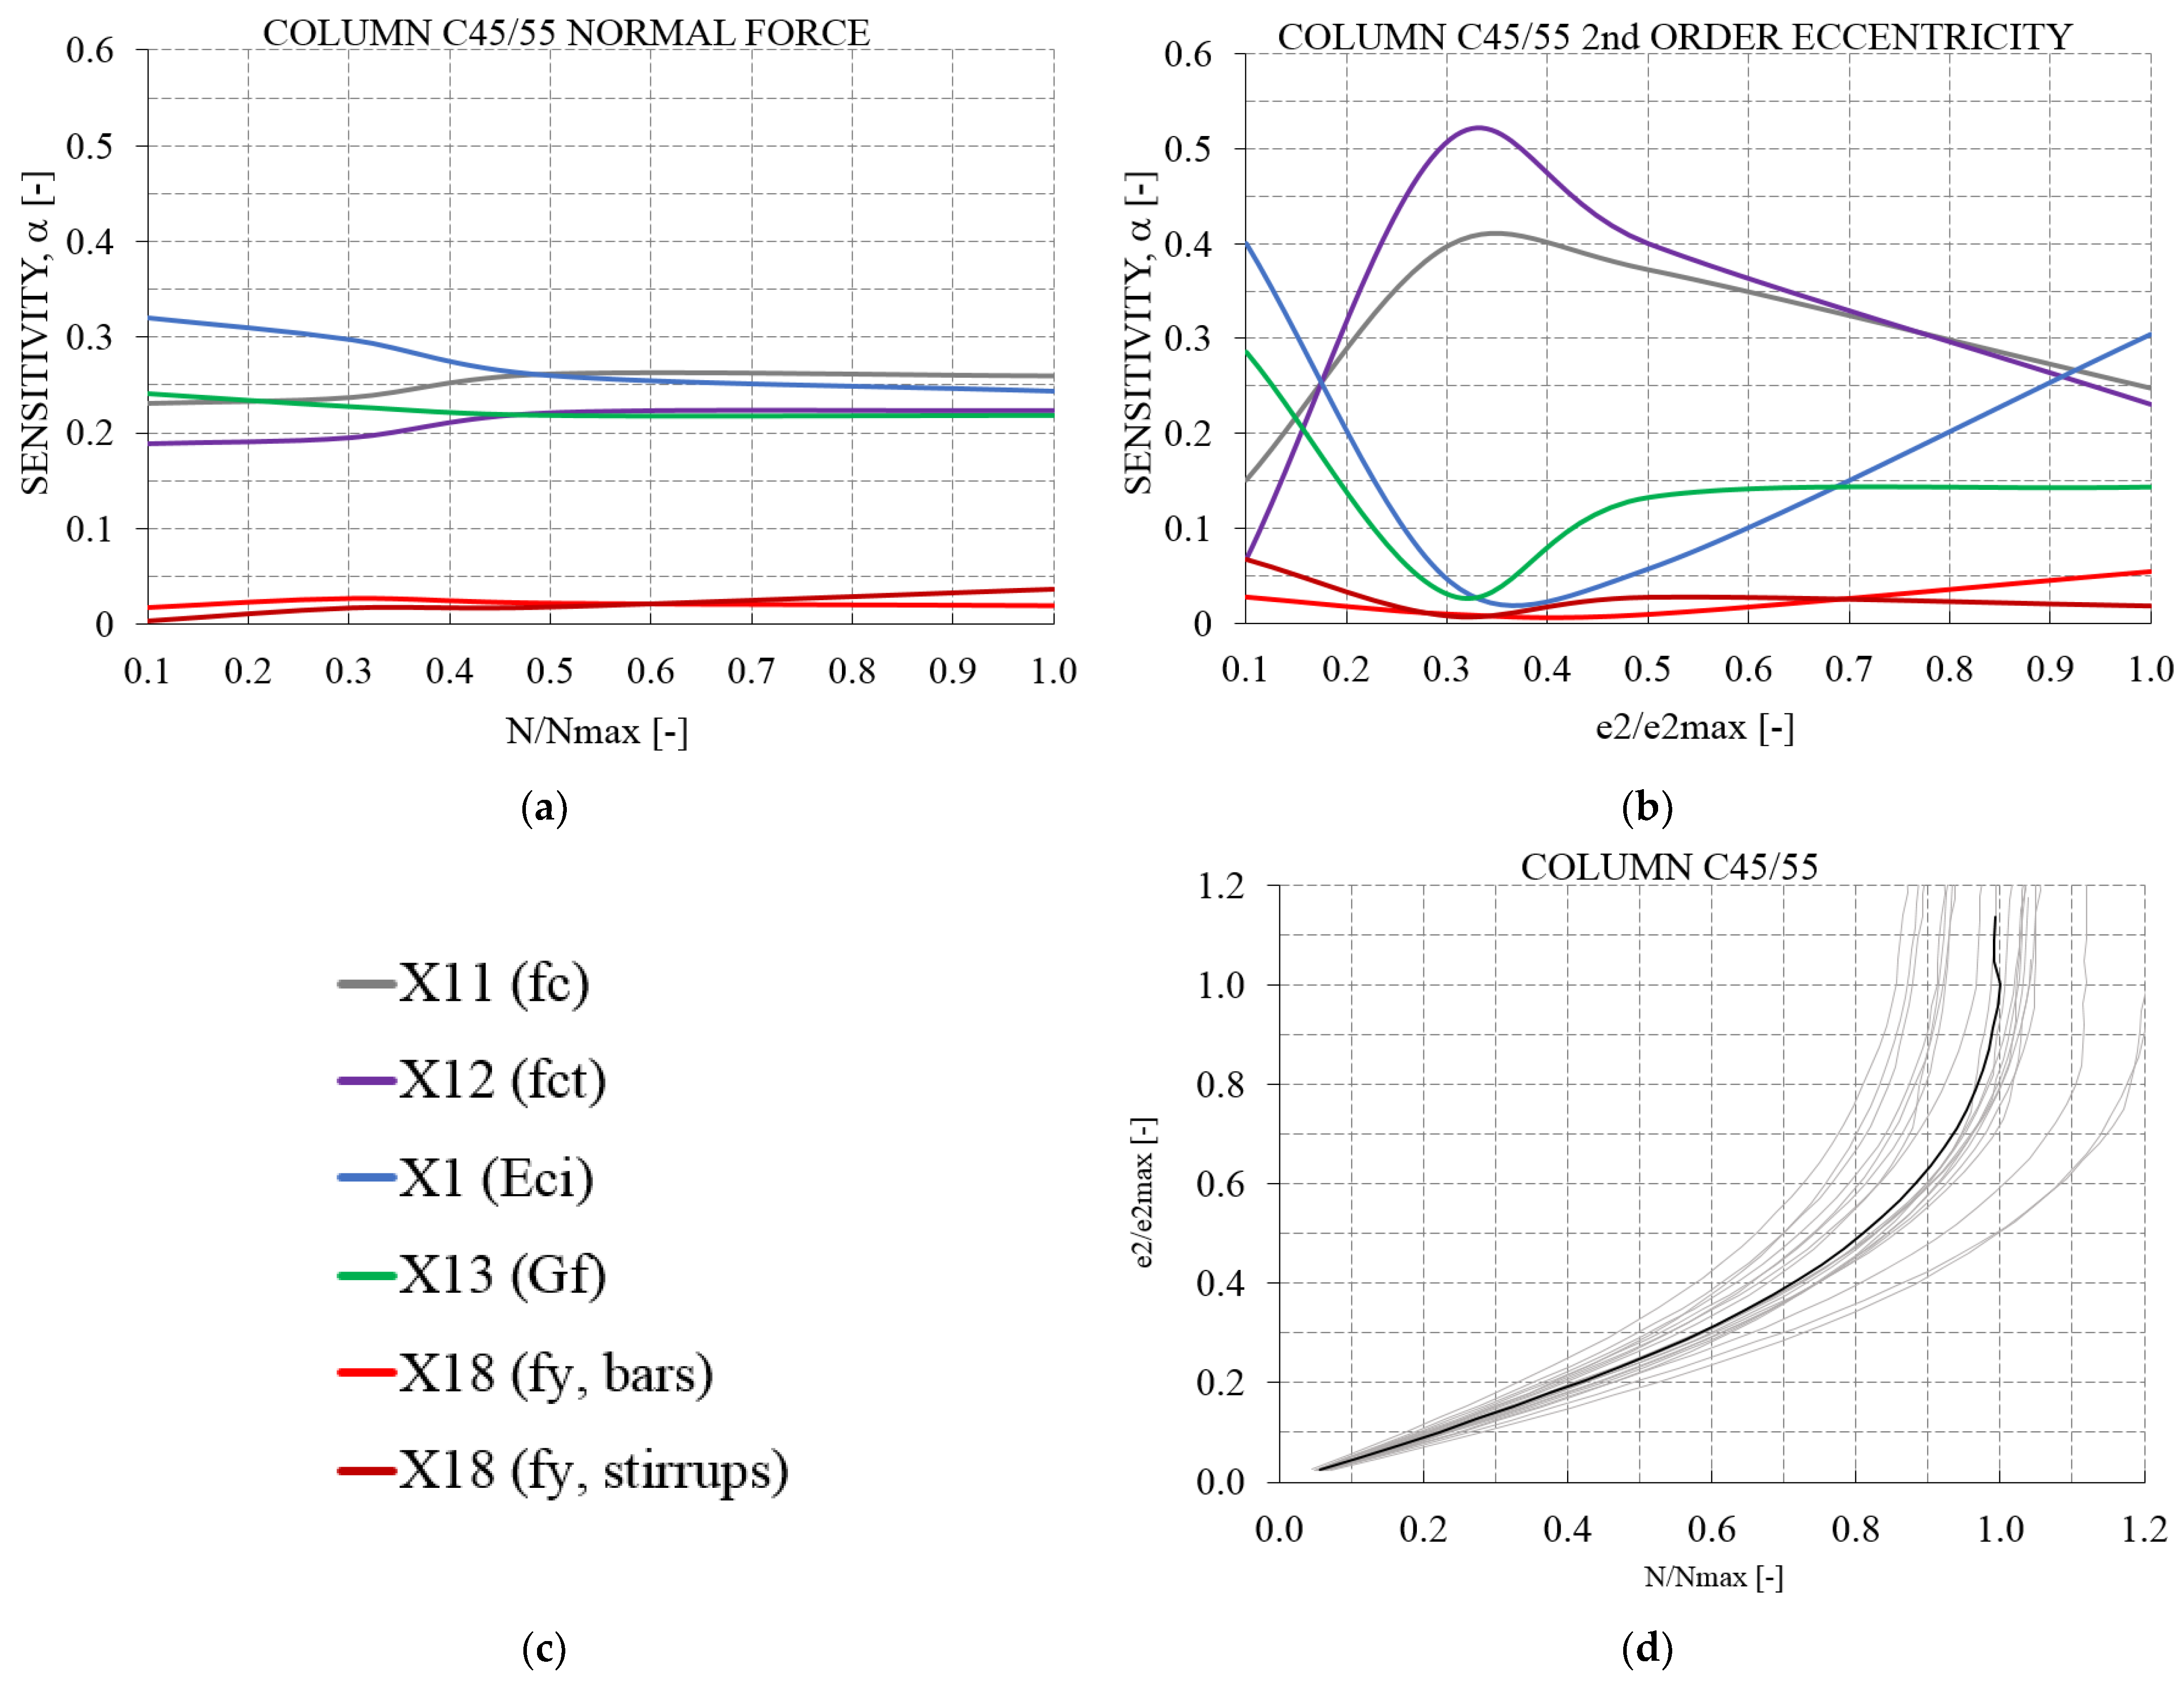
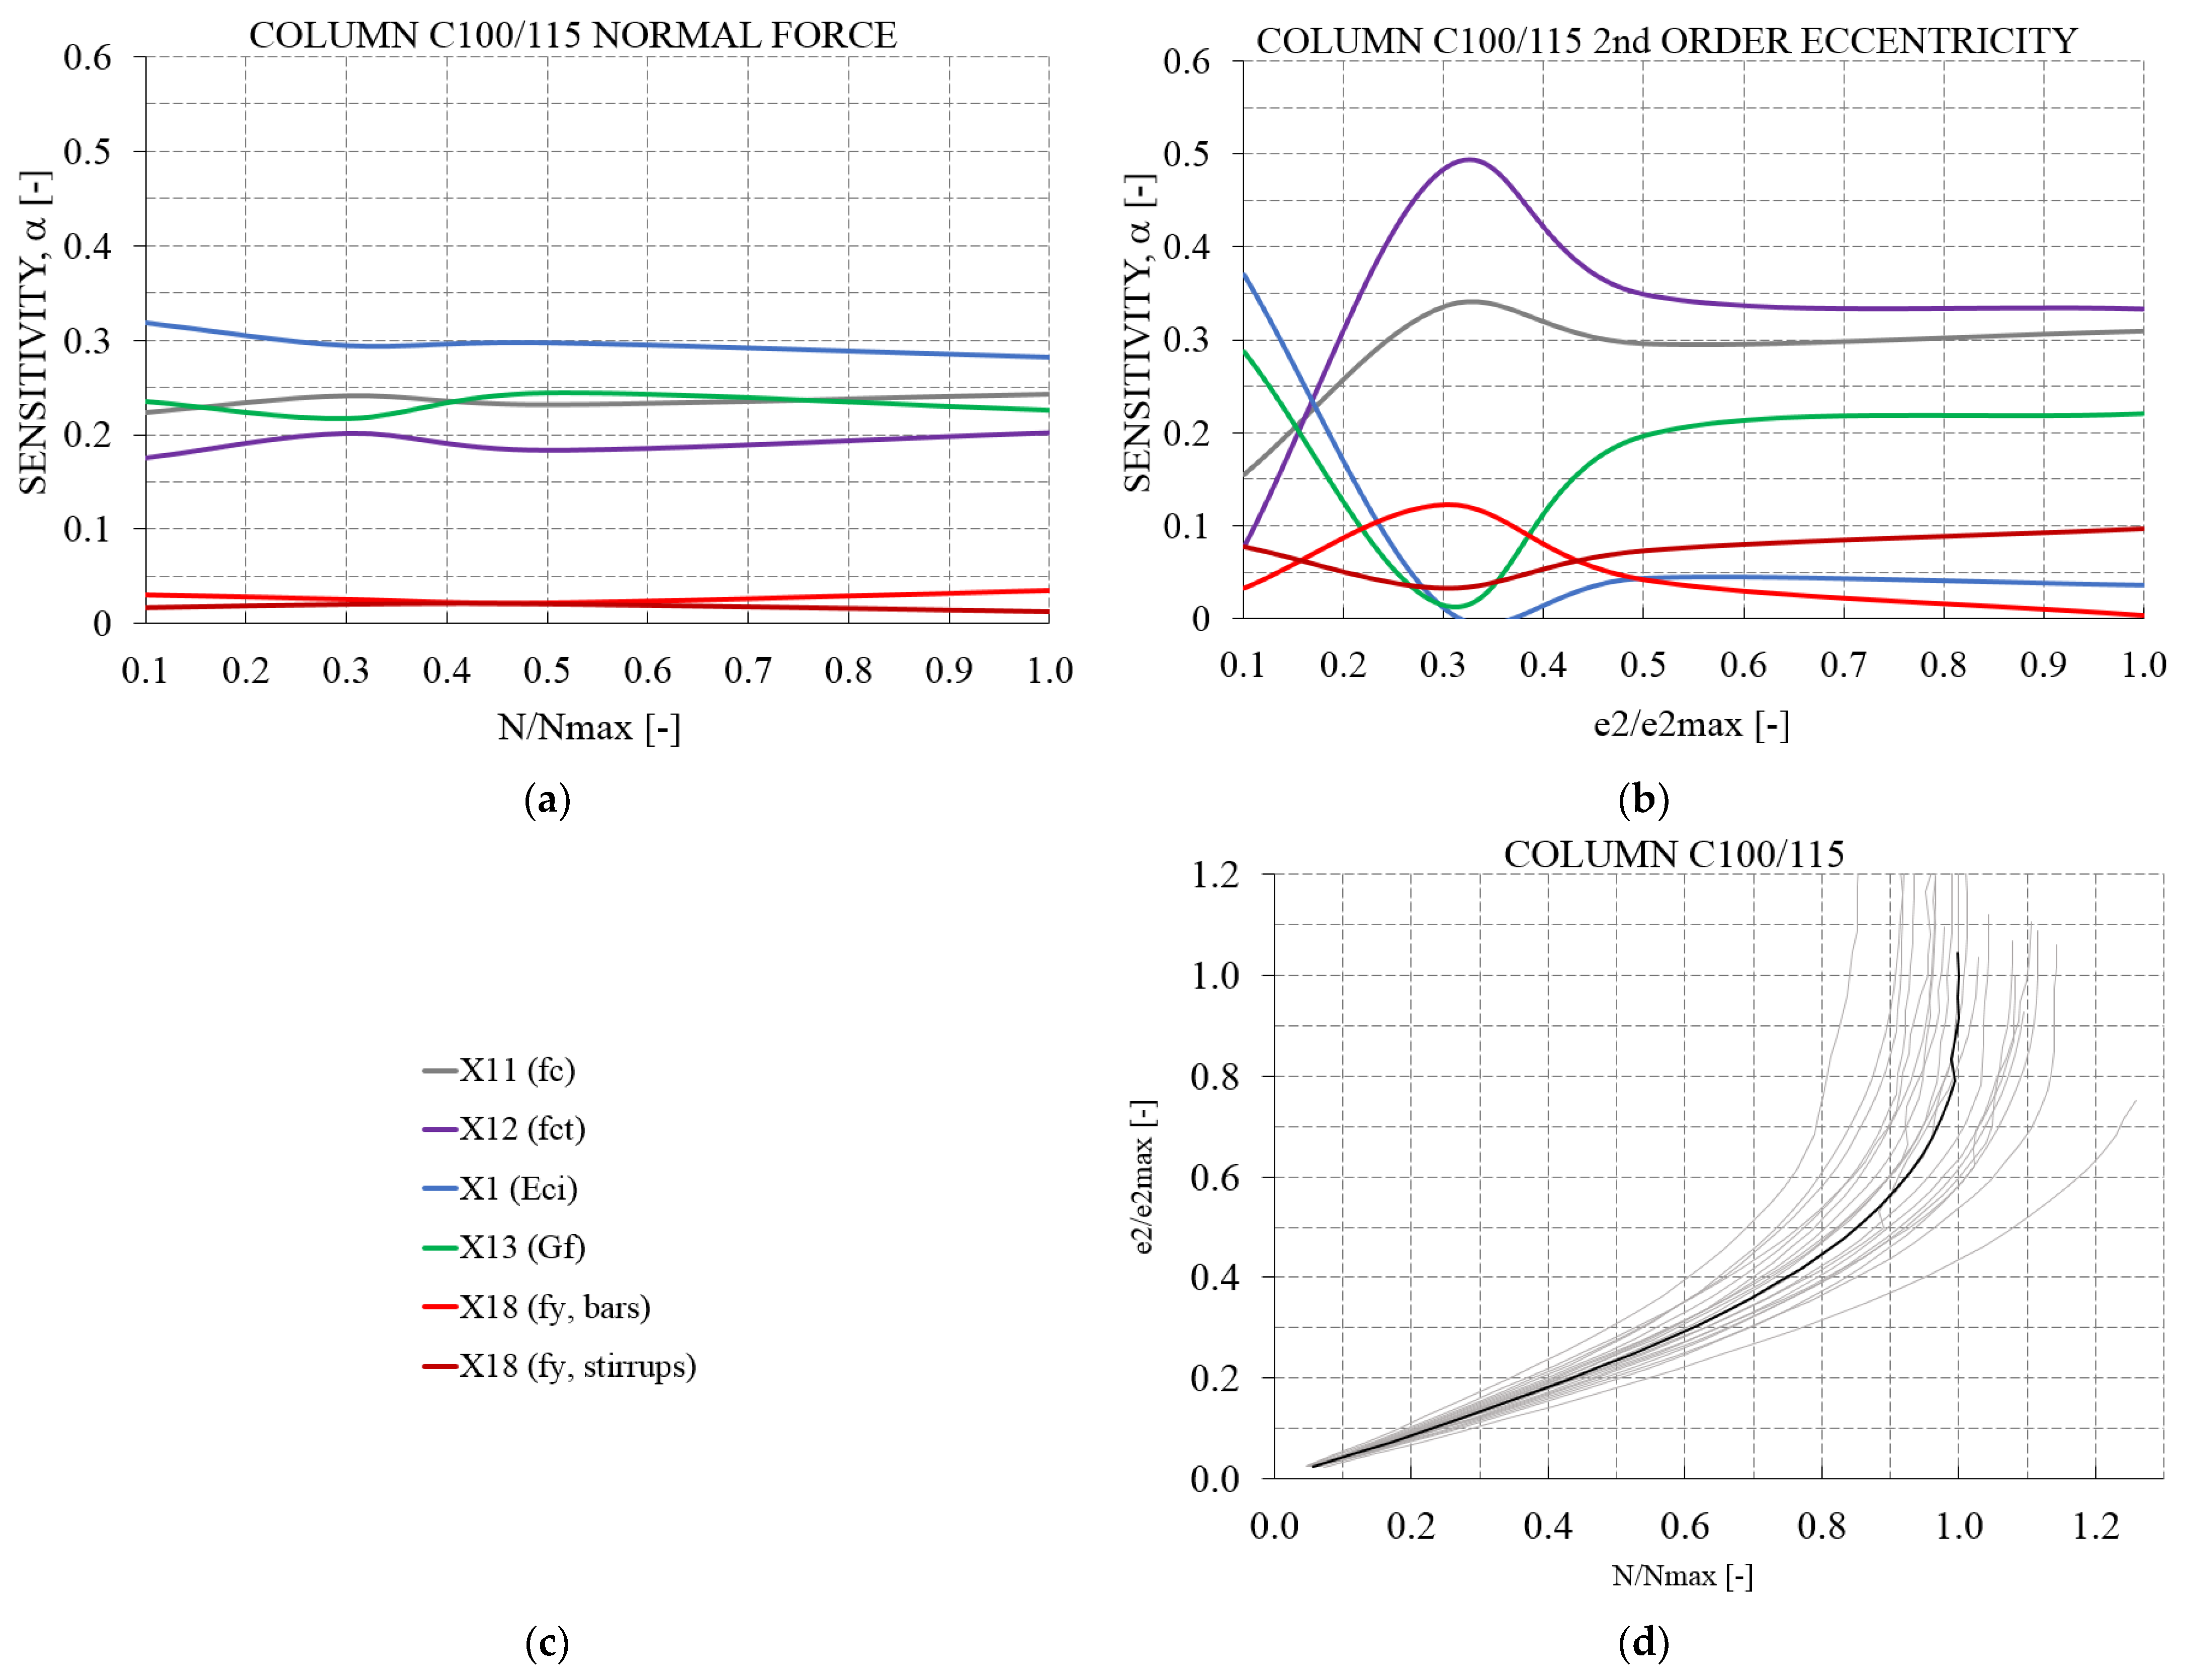
The study of the sensitivities, which vary with the load level (N-M interaction load level), of the descriptive model input variables for both the column cross-sectional level and the column component level in relation to the column load-bearing capacity and the column deformation.
(d)
The determination of the global safety resistance factors according to the “Estimation of the Co-efficient of Variation” (ECOV) method using the non-linear finite element responses generated by means of Latin Hyper Cube Sampling and from responses to experiments as well as the suitability of the global safety resistance factors for reliability assessment.

2. Probabilistic Non-Linear Computation

The probabilistic elements described below were used in the following studies and are briefly explained here for clarification.

2.1. Reliability Levels

In order to assess the reliability of a structure or a structural element in general, the limit state function g(x) is formulated as indicated in Equation (1),
g ( x ) = 0
where the vector x consists of m basic variables Xi (i = 1, …, m). For the present structural reliability problem, g(x) is formulated as the difference between the resistance R and the load E:
g ( x ) = K R R K E E
In general, due to simplifications in the modeling, model uncertainties KR for the resistance and KE for the load are introduced [23], as they are meant to reduce the deviation of the numerical model from the realistic model. The limit state function is formulated in a way that negative values indicate failure and the failure probability is defined as the probability that the random combination of the input values results in an outcome in the failure domain. Mathematically the latter can be expressed through Equation (3)
P f = g ( x ) < 0 f x ( x ) d x
where fx(.) is the m-dimensional joint probability density function (PDF) of the m basic variables Xi. The structural reliability is quantified through the reliability index β, which can be generally expressed and calculated—assuming a normal distribution for g(x)—through Equation (4).
β = Φ 1 [ 1 P f ]
where Φ−1[.] is the inverse of the standard normal cumulative distribution function.
Several methods have been developed historically and are now available for determining these failure probabilities or the corresponding reliability, each of which has its own level of sophistication. Often in literature [24,25], as well as in modern design standards [26] the following categorization is used, starting with the level of highest complexity:
  • Level III: limit state functions and distribution functions for the random variables are introduced without any approximation; calculations are usually based on Monte Carlo simulation or straightforward numerical integration;
  • Level II: the amount of calculation efforts is reduced by adopting well-chosen linearization techniques, usually the so called First Order Reliability Method; the degree of accuracy may strongly depend on the details of the problem at hand;
  • Level I: the variables Xi are introduced by one single value only; this value is referred to as the design value. This method does not actually calculate a failure probability but only checks whether some defined target level is attained or not. It is the basis for partial safety factor format (PSFM) which is defined in Eurocodes as the basic design format for new structures and it is the design and assessment procedure in everyday practice and is referred to as the semi-probabilistic level.
A particular challenge of many civil engineering problems lies in the fact that decisions are made based on values which are remote from the most expected (median or mean) values for a parameter. In these cases, the probability densities are very small, and the obtained results are very sensitive to the tails of the distributions. Besides, the probability of failure, although a strictly mathematical term, remains a subjective perception because it quantifies the expectation regarding structural failure. This subjective probability is not an inherent property; rather, it depends very much on the amount of information available to the calculation procedure.
For the present study two further limitations apply:
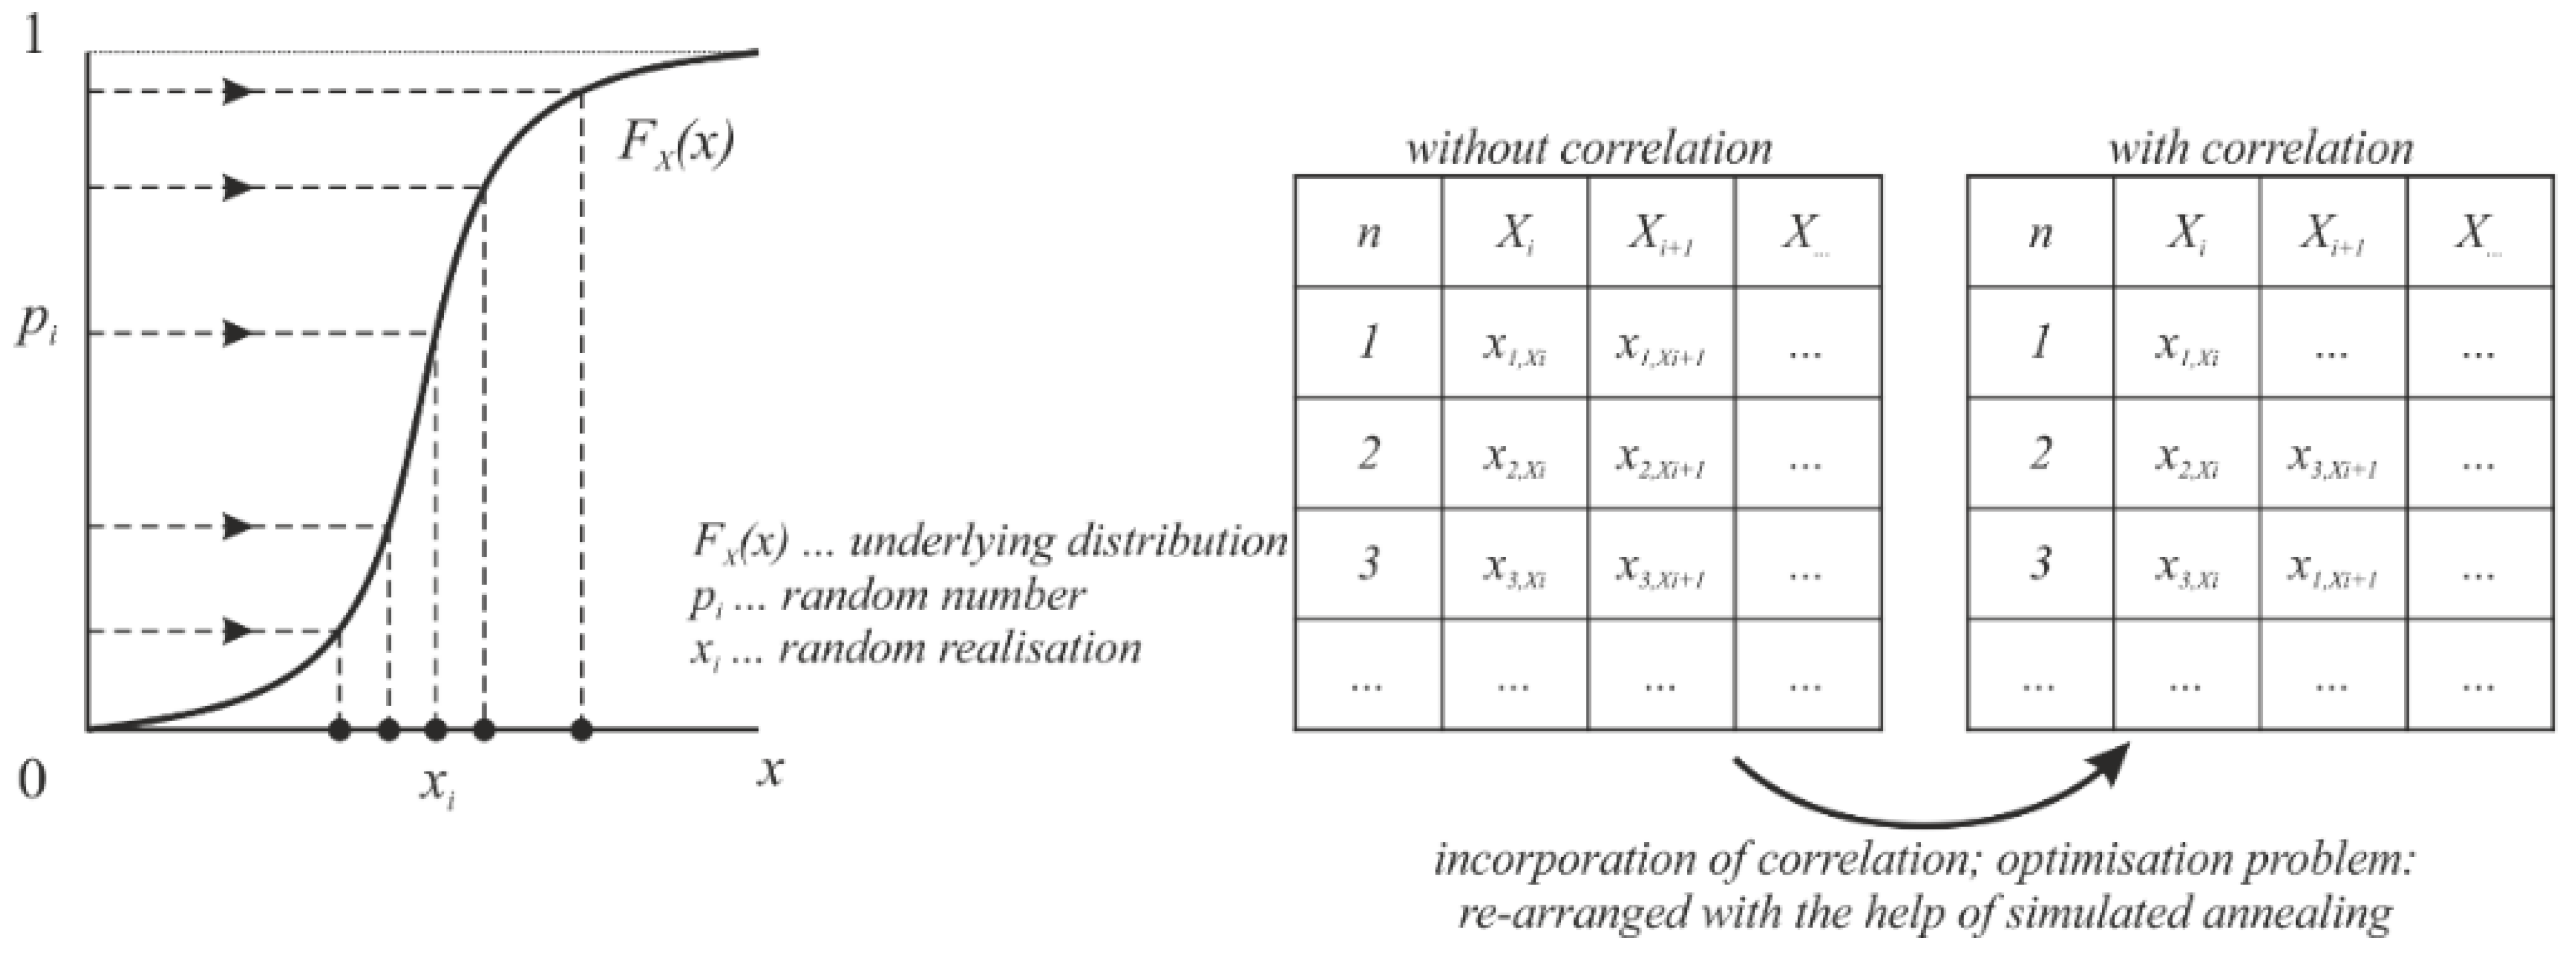
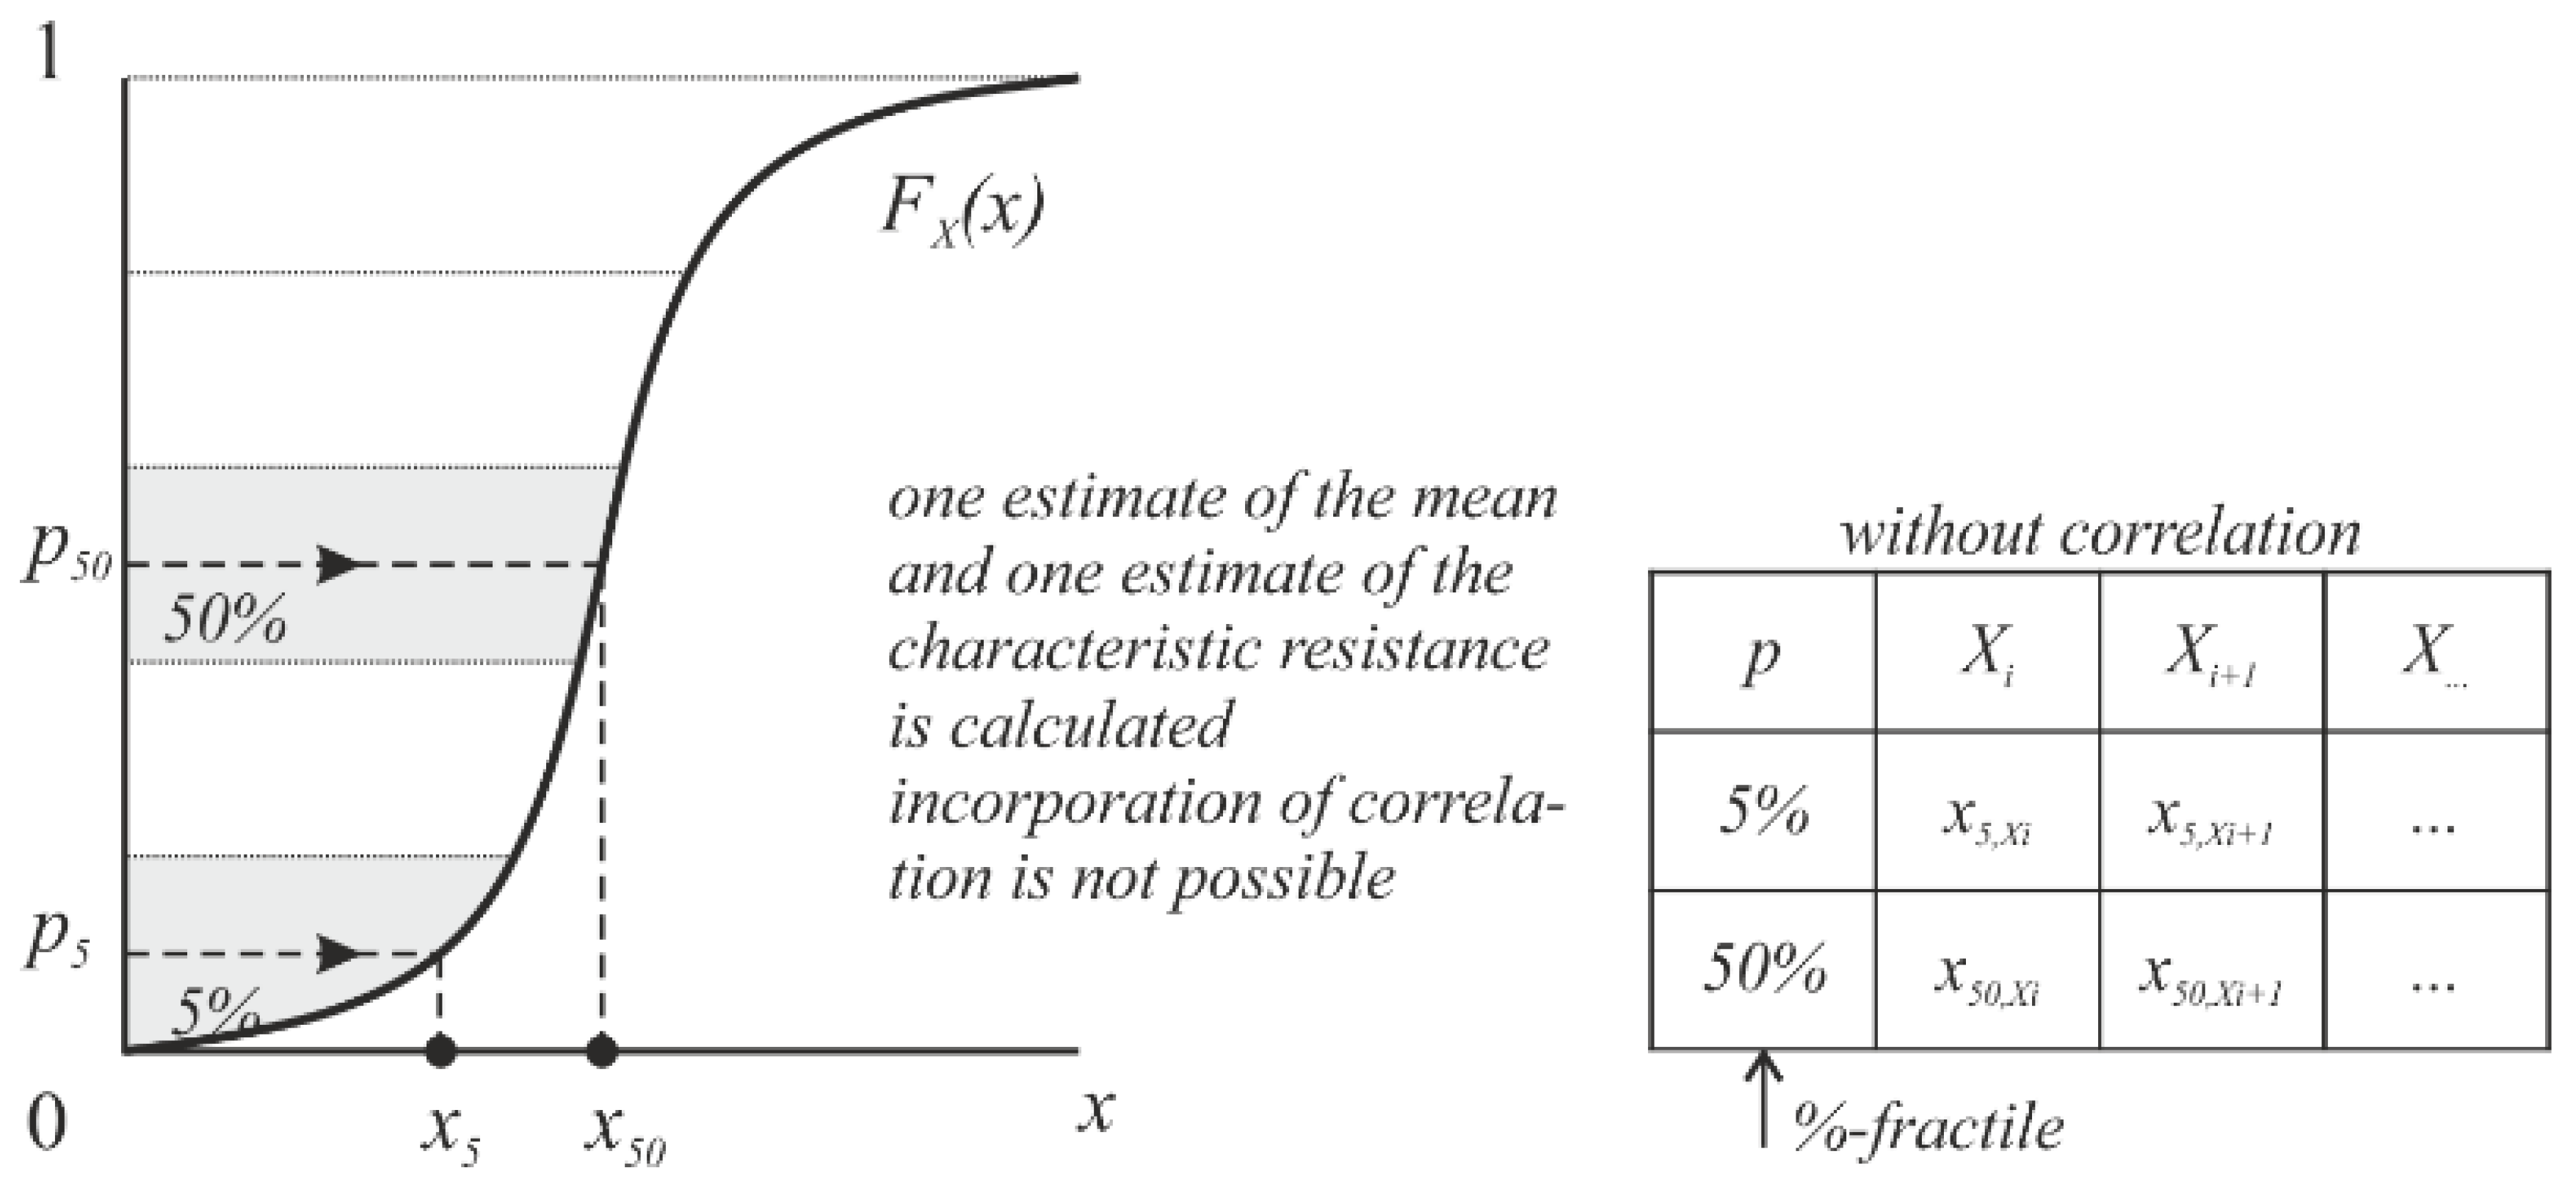
  • It is assumed that the variables in a limit state function are in a first approach independent from each other. Although correlations between variables can be taken into account in computational programs, they are difficult to determine and convolute the algorithms.
  • The analysis does not take into account human error. The failure probabilities pf discussed herein are conditional on the assumption that there are no errors affecting the resistance and loading condition of the case study. To reduce errors, special strategies and quality control measures are required.

2.2. Limit State Design

As requested by the current codes [8,27] Serviceability Limit State (SLS) verifications must be performed as post-analysis checks. For the load level corresponding to the SLS, derived from the SLS combinations imposed by the current codes, the stress state, crack opening and deflections controls must be performed. Regarding the Ultimate Limit State (ULS), verifications must be performed in order to obtain an adequate level of resistance against the loads imposed on the structures. The MC2010 proposes (a) the probabilistic method, (b) global resistance factor format (GRF) and (c) the partial safety factor format (PF). The Estimate of Coefficient of Variation of Resistance (ECOV) method is a particular method within the global resistance format. The forthcoming fib Model Code 2020, although its content and formats are still under discussion, should also encompass this concept.
Global Resistance Factor format (GRF): According to this format, the global resistance of the structure is a random variable. The effects of various uncertainties are integrated in the global design resistance and can be expressed by a global safety factor. The global safety coefficient is equal to the product of the safety and the model coefficients.
Partial Safety Factor format (PF): According to the Partial Safety Factor format, the basis variables are deterministic quantities representing values related to a level of confidence for each parameter. In that sense, the treatment of uncertainties and variabilities originating from various causes is distributed to the individual input parameters by means of design values assigned to variables. The variable design values are obtained by calibrating their characteristic values with corresponding partial factor. Design material properties, derived from the characteristic ones, are then used in the analysis. Understandably, the non-linear analysis is carried out for extremely low strength input parameters which can lead to a non-realistic structural response or global failure mechanism. For this reason, it is not advised to rely solely on the PF format for the design.
Estimation of Coefficient of Variation of Resistance method (ECOV): In this case, one estimation of the mean and one of the characteristic resistances are calculated using the respective set of values of the material parameters. The random distribution of resistance of reinforced concrete members can be described in a first approximation by a two-parameter lognormal distribution (the use of other distributions is possible but needs an adjustment of the following equations) while these two parameters are the mean resistance and the coefficient of variation of the material property, V R . V R is calculated according to [27] by:
V R = 1 1.65 · l n ( R m R k )
where Rm is the mean resistance value and Rk is the characteristic value of resistance corresponding to 5% exceedance probability. The respective global safety factor γ R is calculated as:
γ R = e α R · β · V R
where α R is a constant value and is assumed to be 0.8. The safety index β is to be taken in accordance with the target reliability index and applicable standards.
In this approach, the sensitivity factor of the resistance side αR, the coefficient of variation VR of the resistance side and the reliability index ß are considered. The descriptive elements of the action side (e.g., partial safety factor γE) influences the consideration only indirectly via the interrelation between αE, αR and ß.

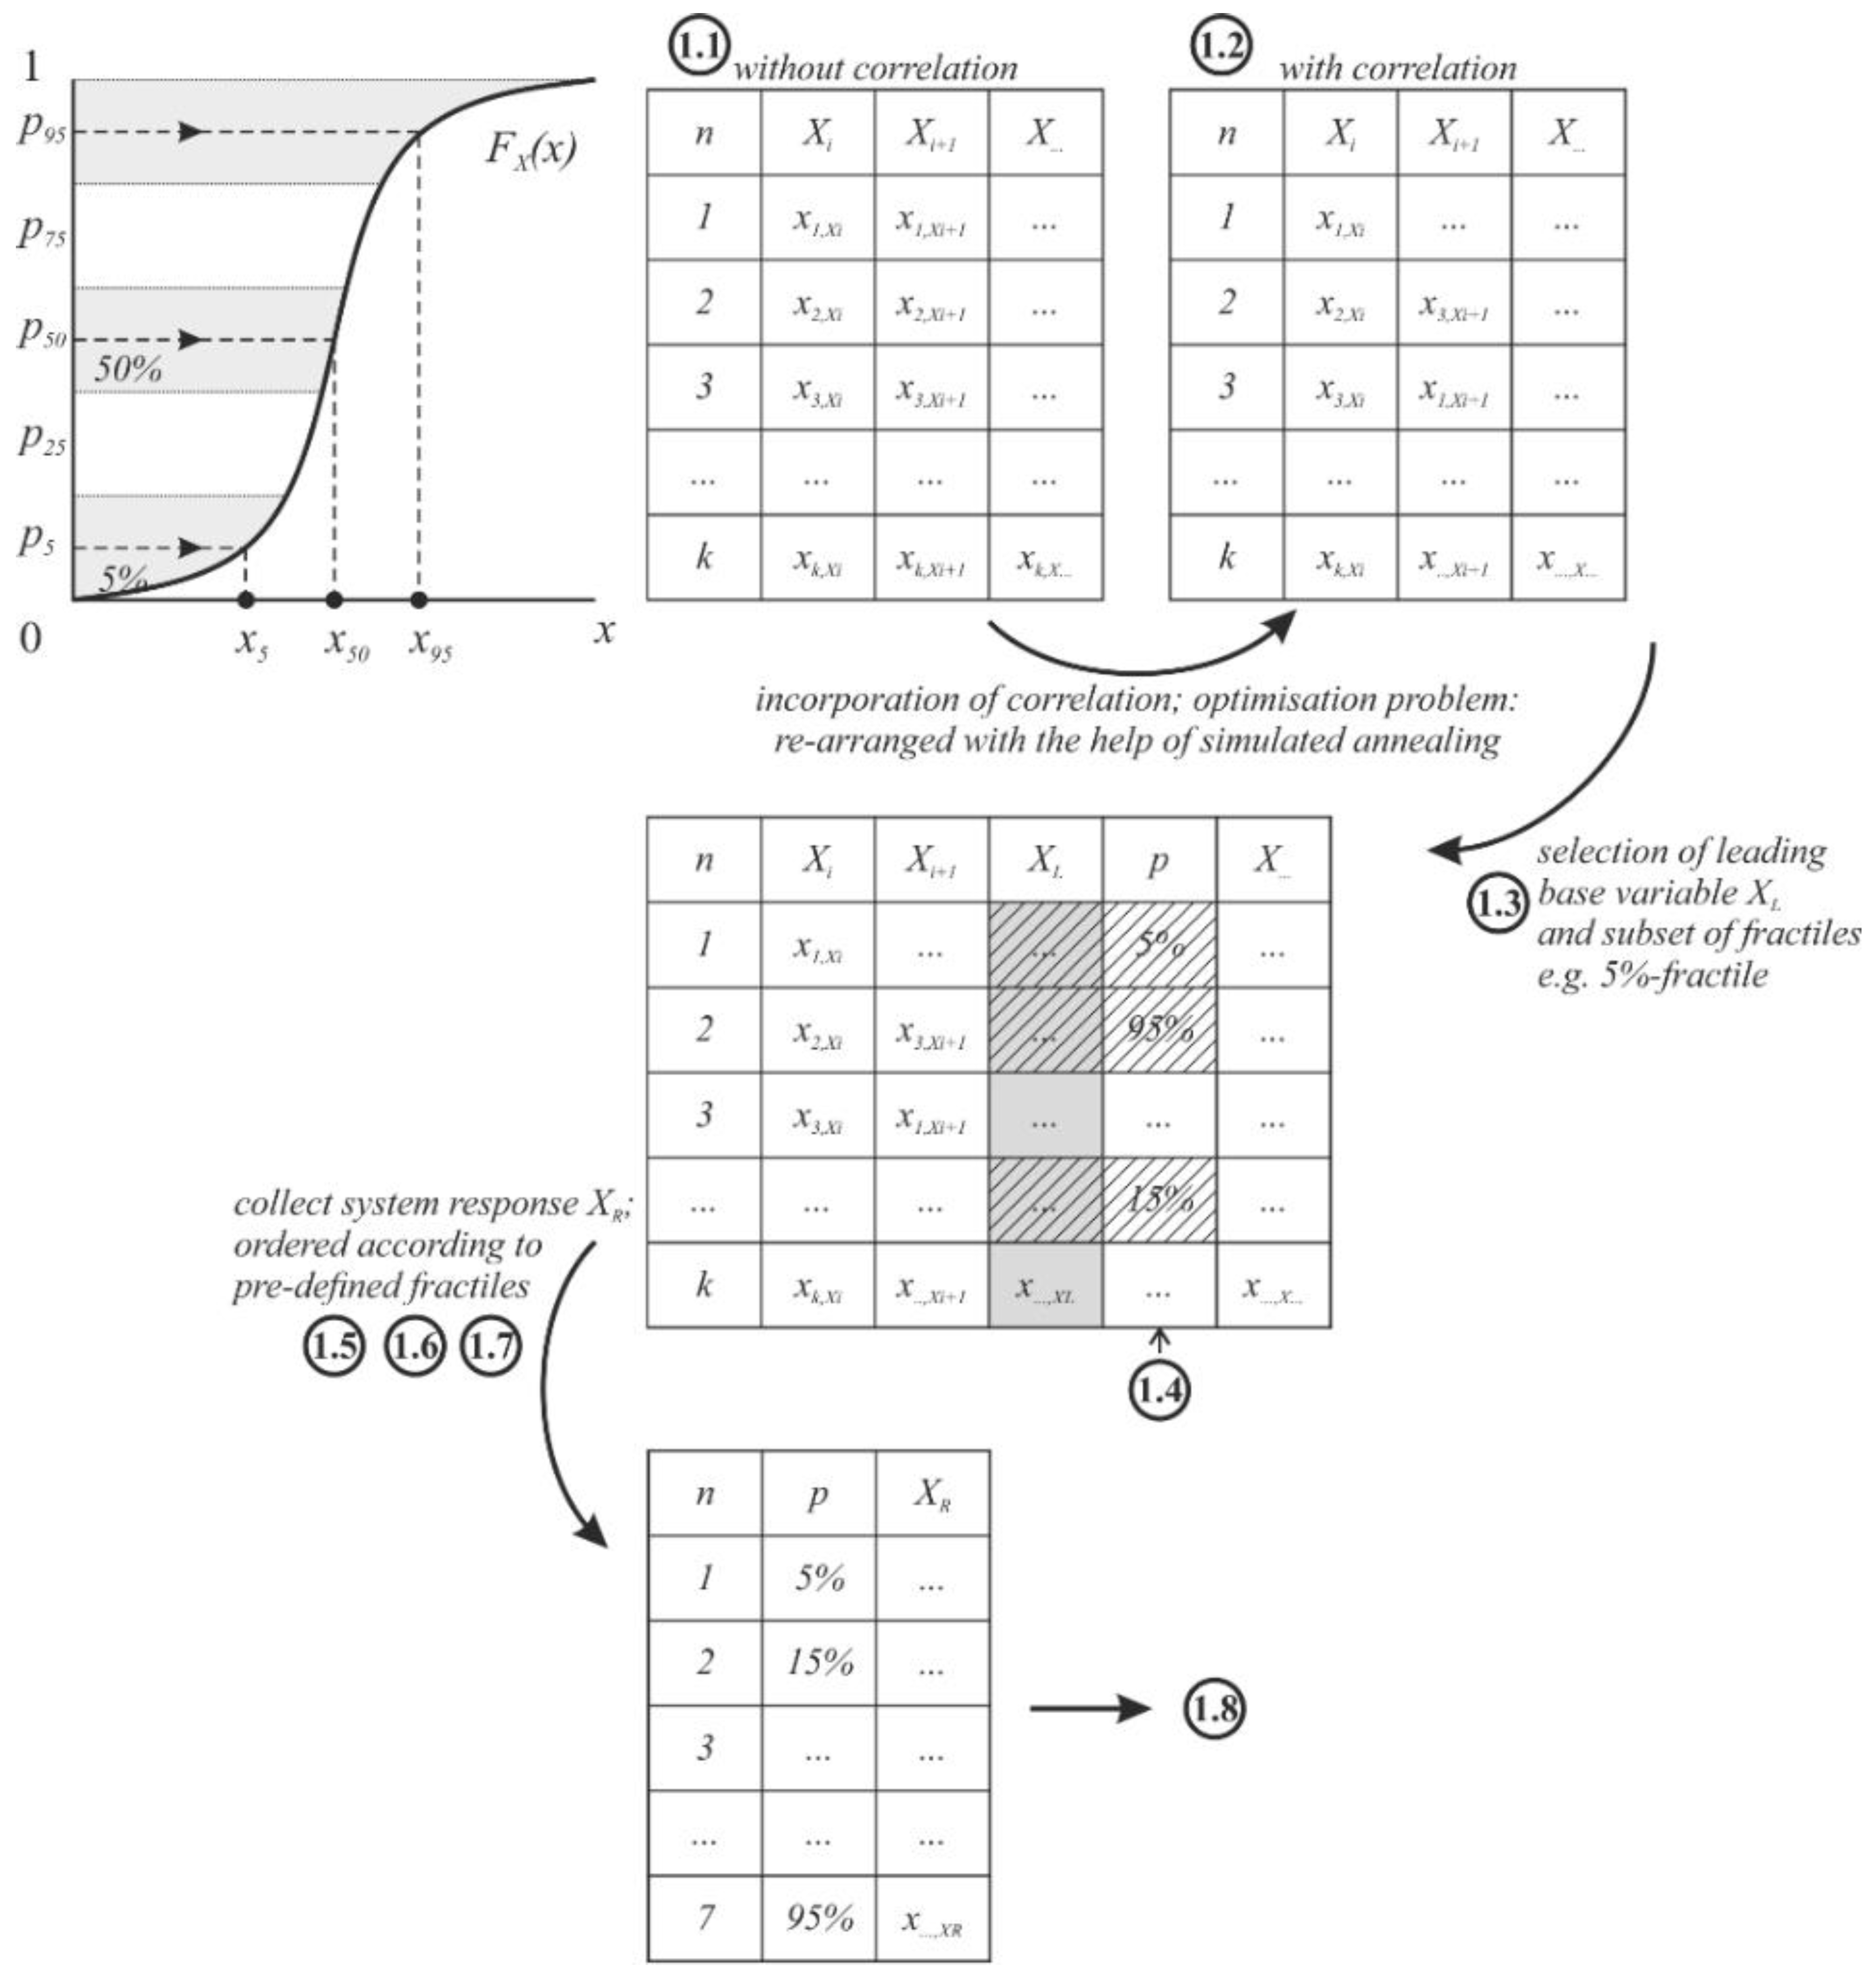
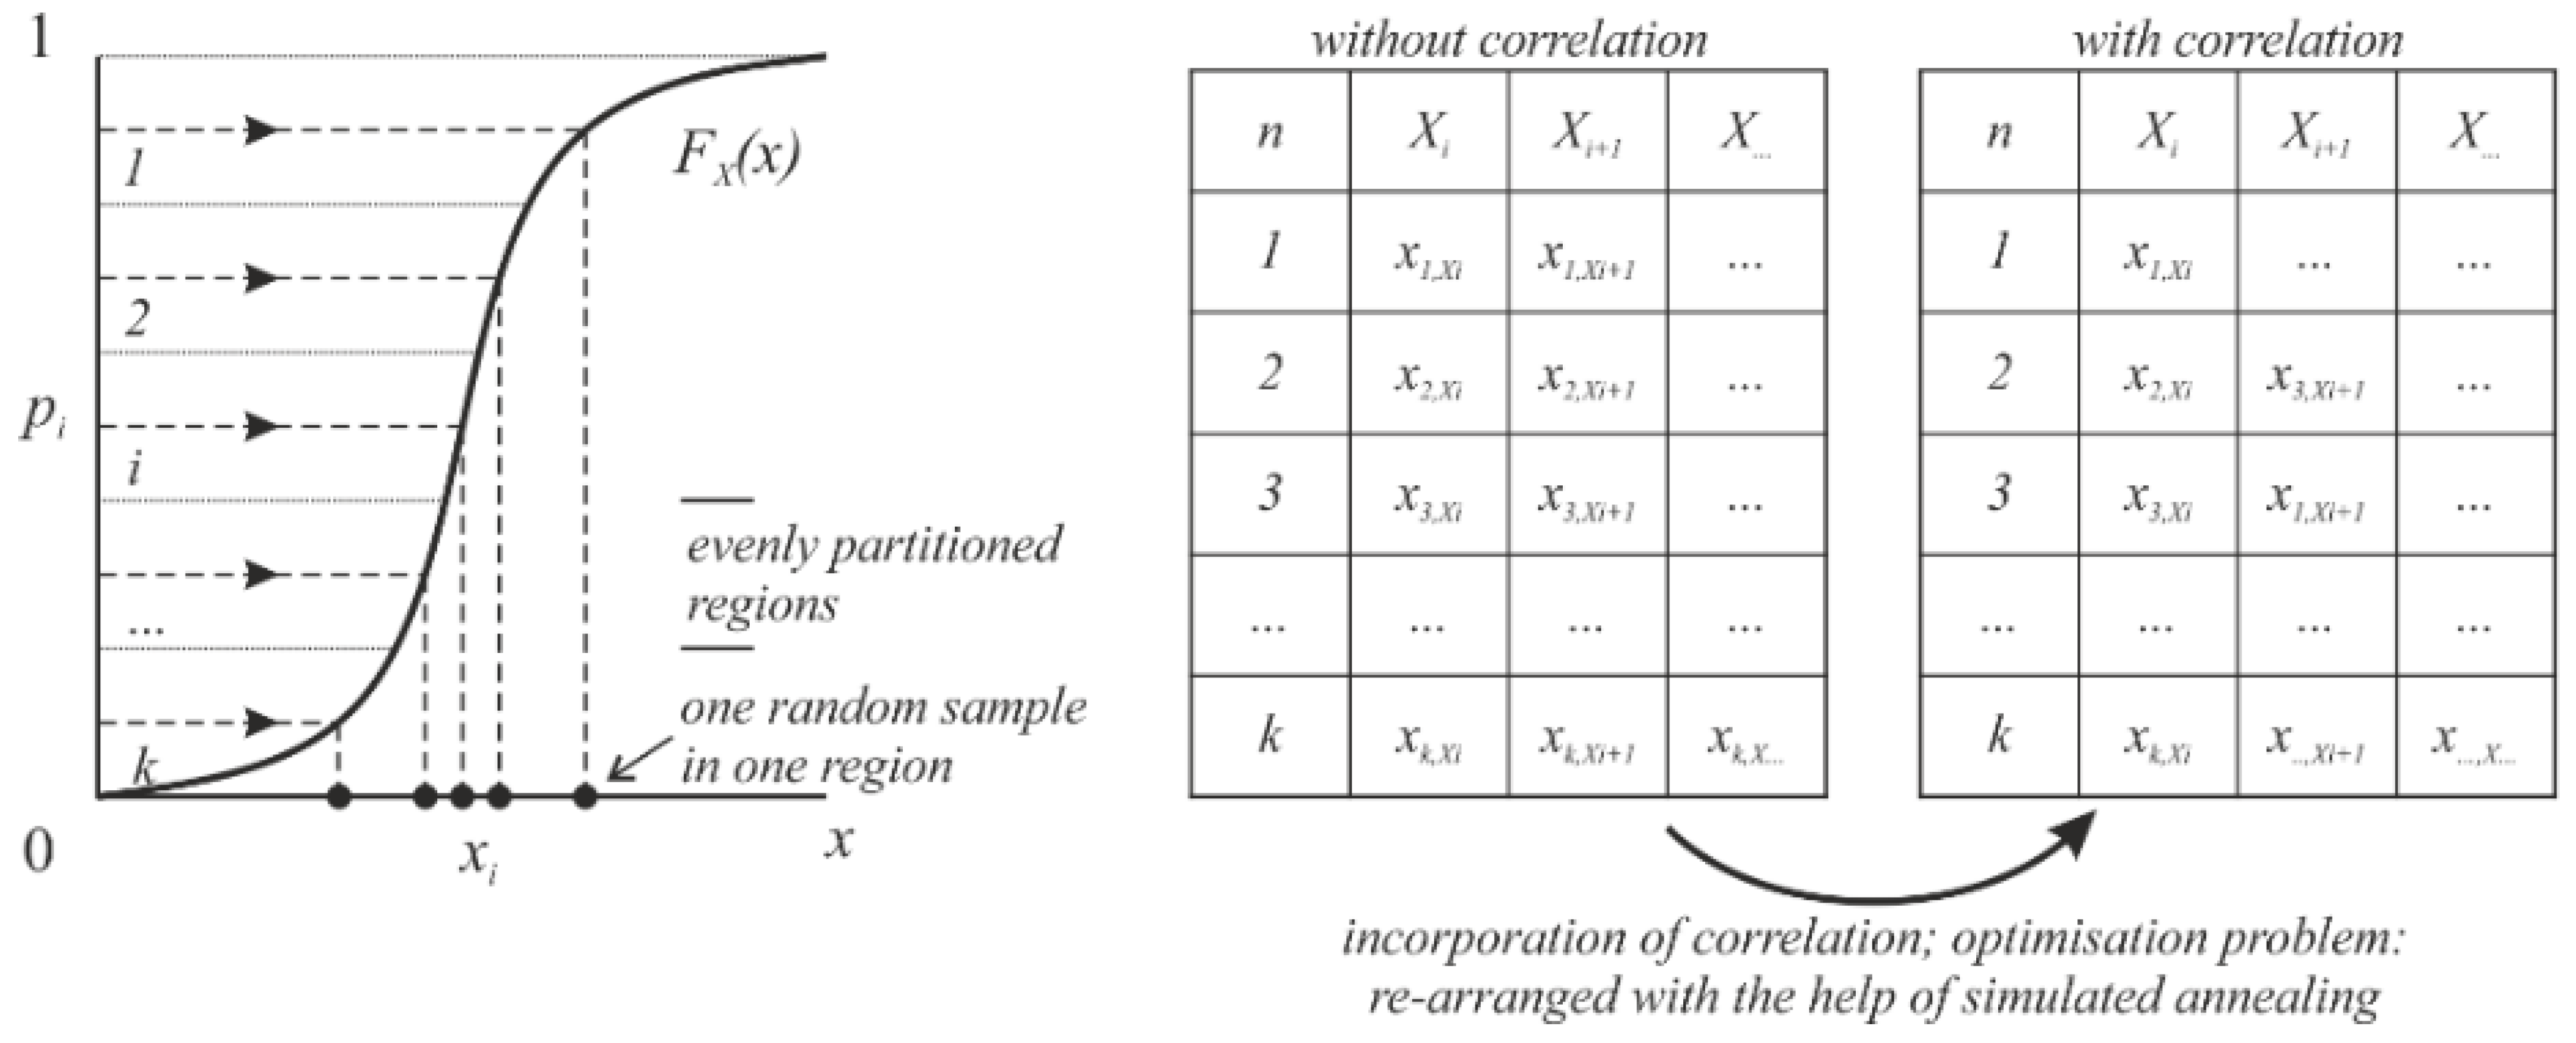
2.3. Sampling Methods

The Monte-Carlo (MC) method provides a powerful, adaptable, and accurate method which has been increasingly used. MC replaces an exact or approximate calculation of the probability density of the limit state function by generating a large number of individual evaluations of the function or the input parameters using random realizations xik of the underlying distributions for the random variables Xi where the index “k” stands for the “k”-th simulation (k = 1, 2, …, Nreal), see Figure 1. When combined with a finite element model, the resistance of the analyzed component or the limit state function has to be calculated for a large number of repetitions, yielding an output distribution function. Each set of the k realizations introduced into the analyzed model leads to a solution.
G k = G ( a 0 ,   x 1 k ,   x 2 k ,   ,   x i k ,   ,   x n k )
The resulting z numbers gk are evaluated statistically according to the basic statistics and lead to the pf = z0/z, where z0 is the number of results violating the design threshold.
The correlation between the basic variables, see Figure 1 (right), is set up by a controlled rearrangement of the sample field using simulating annealing. Simulated annealing (simulated cooling/annealing) is a heuristic approximation method.
In summary, the MC method provides an approximate solution by performing statistical sampling. It relies on repeated random sampling whereby the error decreases with the square root of 1/Nsim, where Nsim = amount of simulations; pi is generated randomly with uniform distribution on the interval [ 0 1 ] . However, sample points are generated without considering the previously generated sample points.
The Latin Hyper Cube Simulation (LHS) method [28] is an extended procedure and is based on the basic idea of the Monte Carlo method. In particular, in the context of statistical sampling, a square grid containing sample positions “Latin square” is used for the LHS method. During sampling there is only one sample in each row and each column accepted, see Figure 2. While pi is chosen randomly when using the MC method, see Figure 1 left, one pi is chosen from each of the Nsim-intervals, see Figure 2 left, when using the LHS method. Random samples can be taken one at a time, remembering which samples were taken so far by dividing the cumulative density function (CDF) into Nsim equally probable k intervals, see Figure 2. It ensures an acceptable accuracy at a low Nsim.
The Fractile Based Simulation (FBS) method is processed as the LHS method with a number of Nsim-intervals but taking only a reduced number of pis from this sample field for the evaluation procedures into account. The selection of the reduced pis is based on predefined fractile values of the CDF, for instance as shown in Figure 3. Hence, the effort of simulations can be reduced while fully including the properties of the LHS sampling field—encompassing the Nsim-intervals.
Since several basic variables are generally involved in a problem and the assignment of the pis to predefined fractile values is only possible for one basic variable, it is necessary to define a leading basic variable in advance and to formulate the dependencies of the other basic variables on this via the LHS simulation field.
The process steps of the FBS procedure are as follows, see Figure 3: (a) generate the LHS-field; (b) perform simulated annealing for correlation; (c) define the leading basic variable (on subset of fractiles) on the sample field with correlation the leading parameter XL; (d) determine those realizations which are closest to the pre-defined fractiles (e.g., 5%, 15%, …, 95%); (e) select the sample sets associated with the pre-defined fractiles of the leading parameter XL; (f) perform the deterministic simulation of each subset; (g) collect the results of the system response XR and order it according to the pre-defined fractiles; (h) perform a PDF-fitting; (i) perform sensitivity analysis to (I) the original LHS-field ρ α L H S and (II) the reduced FBS-field ρ α F B S ; (f) check leading parameter | ρ α L H S ρ α F B S | e r r o r .
More details regarding the appropriate selection of the leading basic variable are provided in [29].
The Estimation of Coefficient of Variation of Resistance method (ECOV) seems to be a further reduction to two pis as it is proposed in the FBS, but it is a simplified probabilistic procedure in which the random variation of resistance is estimated using only two samples. It is based on the idea that the random distribution of resistance, which is described by the COV, can be estimated from the mean and characteristic values e.g., 5%-fractile of resistance, see Figure 4. The method is not based on an LHS sampling field and hence does not take into account the correlation between basic variables but takes from all basic variables the, e.g., 5%-fractile or 50%-fractile.

3. Investigated Columns

The geometric layout of the following columns, which were tested experimentally and numerically analyzed in a non-linear way, was chosen because it was found that the stability failure of compressed slender concrete columns occurred before reaching the material capacity in the critical cross-section when calculated using a non-linear numerical format. The procedures outlined in Section 2 were used for an initial assessment.

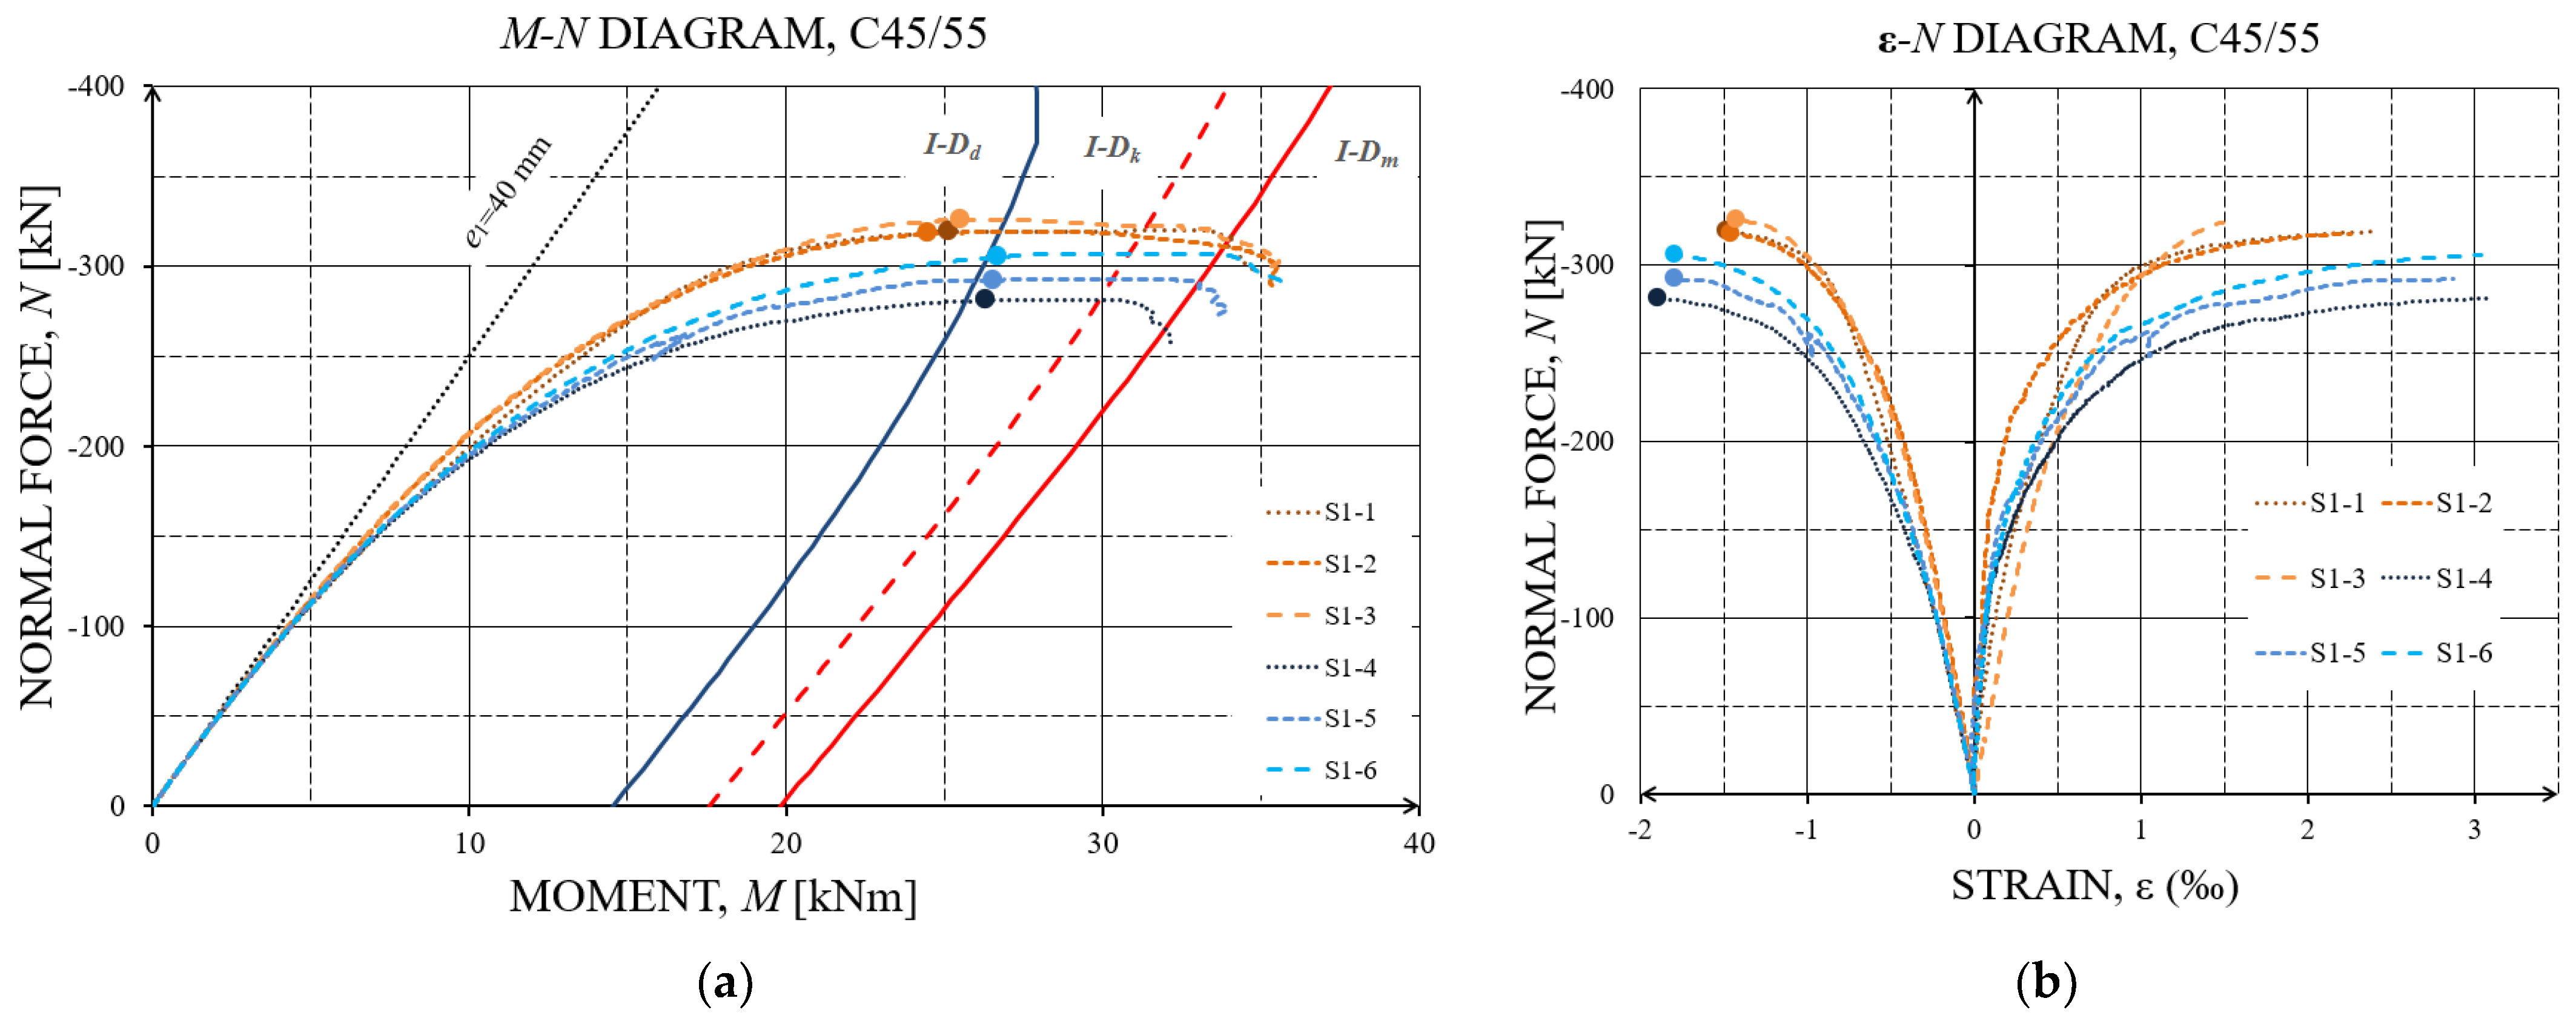
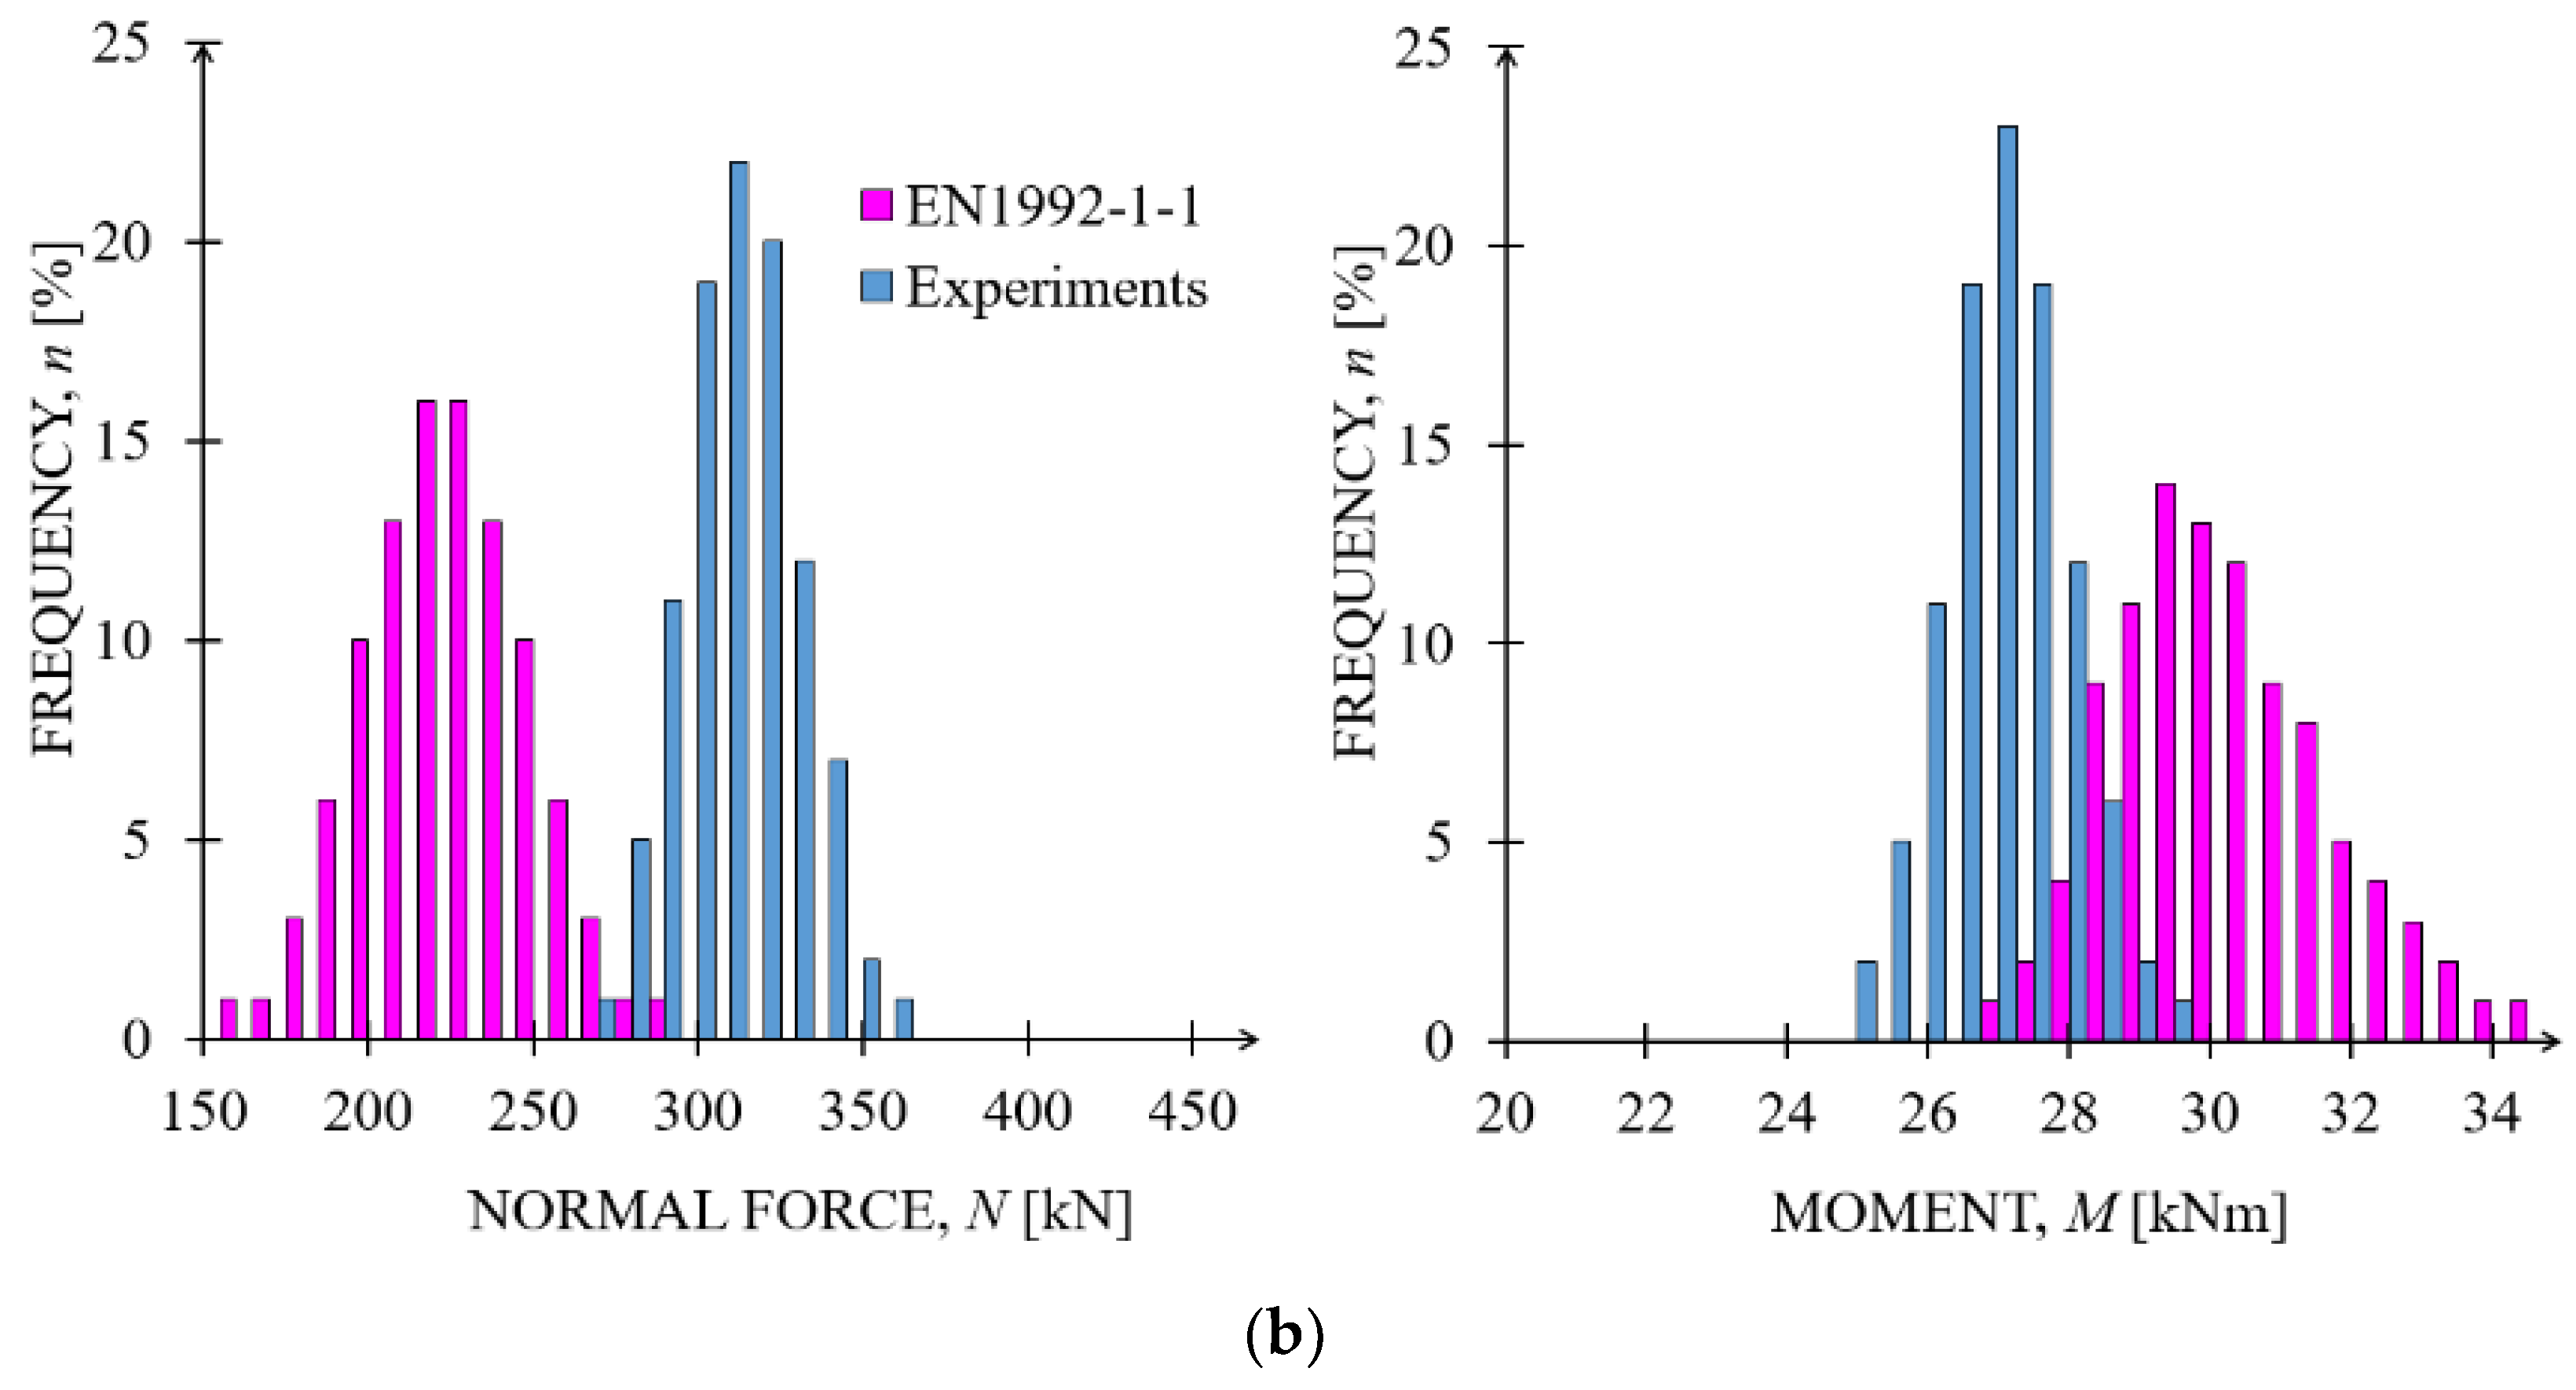
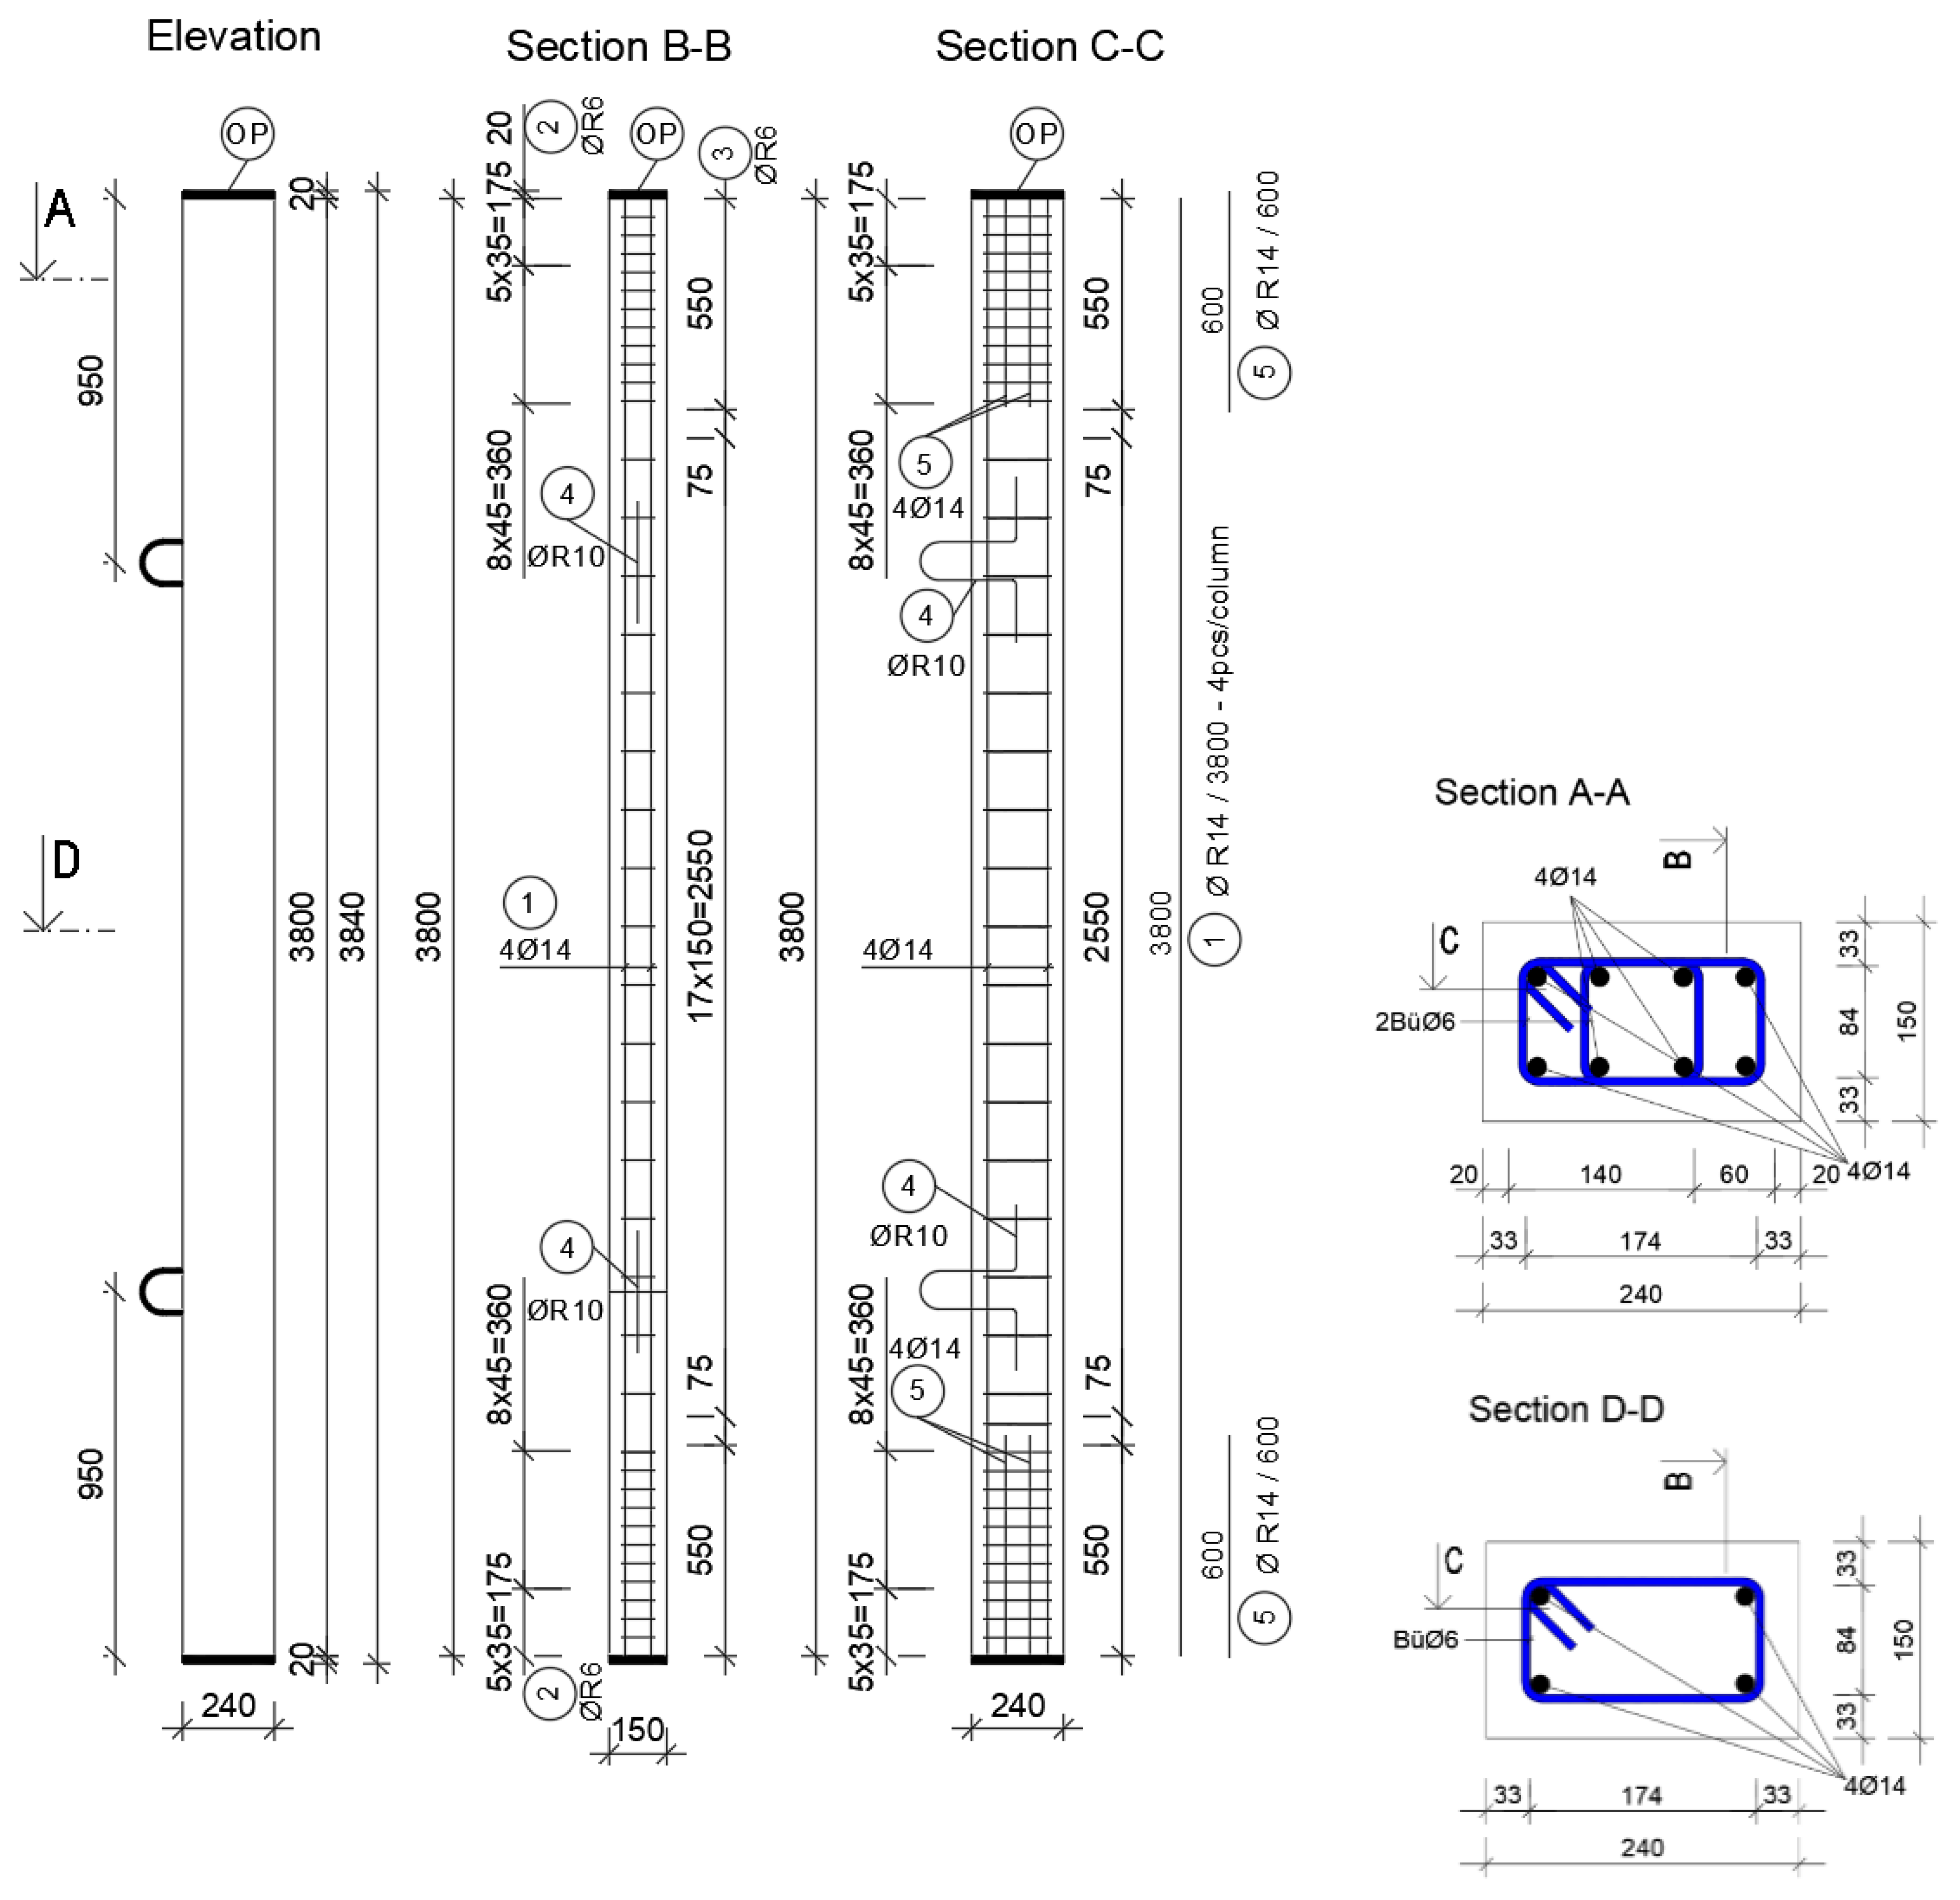
3.1. Layout and Test Results

The studies and analyses are based on the following experimental research for validating non-linear calculations for slender column elements. Several series of tests on slender columns were carried out and the failure loads were compared to the results of non-linear analyses and simplified formats.
The concrete material used to construct the first series of slender columns is C45/55 while the steel used is BST 500B. In the first series, 6 columns (see also [4]) were tested. Figure 5 shows the cross-sectional dimensions and layout of the tested columns while Table 1 lists the parameters used in the calculation according to different codes. Figure 6 presents the results of the experiments while Table 2 lists the descriptive parameters used for the slender columns.
The points shown in Figure 6 represent the tested maximum axial force capacity Nmax of each single column. All of the maximum N-M gradient points show the system stability failure before the mean I-D (left from the I-Dm) as defined in EN 1992-1-1 [8]. The right-hand graphic of Figure 6 shows the load-vs.-strain graphs in the fracture-prone cross-section at half the height of the columns. The concrete compressive strains in the compressed fiber of the cross-section were recorded for the column stability loss at between 1.4 and 1.8‰ and were far away from the permissible concrete compressive strains of 3.5‰. The associated concrete/reinforcement tension strains in the pulled fiber of the cross-section were recorded at between 1.4 and 3.1‰, see Figure 6. The model uncertainties of the experimental test results were derived following [30] and EN1990 Annex D (Edition: 2013-03-15) with θY = Ymean/Yk. This results for Nmax to θNmax = 1.06, for e2 at Nmax to θe2,Nmax = 1.02, and for M at Nmax to θM,Nmax = 1.01.
Based on the results from the experimental investigations, see Figure 6, and the previously discussed model uncertainty factors, the following design values of the resistance can be determined according to [4]:
N d = N m γ R d γ R = 292.9 1.06 · 1.212 = 227.98   kN   and M d = M m γ R d γ R = 28.6 1.06 · 1.292 = 20.89   kNm  
In addition, details of the column layout and test results of the columns made from C100/115 are also documented in [5,6]

3.2. Reliability Assessment

The current status of the standards includes a certain degree of prescribed safety, defined by partial safety factors within safety concepts, for the calculation and design of structural elements. The reliability levels and target reliability index are dependent on the consequences classes and the costs of safety measures, along with the reference period, both in EN 1992 [8] and the Model Code [27]. In general cases, an annual safety index of β = 4.7 or a failure probability of pf = 10−6 is defined as the minimum requirement for the bearing capacity of structures.
In the subsequent studies on the presented laboratory tested columns, the EN 1992 [9] and the Model Code [27] design-safety formats serve as a reference. These standards and design formats characterize interaction diagrams (I-D) which allow the determination of the permissible axial load and its corresponding moment for a pre-defined column geometry and specific material properties. In particular in this contribution, the analytical formulations according to EN 1992 on the one side and non-linear finite element analyses approaches according to EN 1992 on the other side were used for the probabilistic computation of N-M gradients and the existing reliability/safety of the columns by using the proposed I-Ds as thresholds, see also [4].
In other words, the analytical formulations of EN 1992 [8] and the Model Code [27] were converted in a first step into corresponding limit state equations [1] and probability distribution density functions were assigned to descriptive variables of these equations. The resistance thresholds in the axial forces and/or moments necessary for appropriate formulation of the limit state equations in the form of PDFs were derived from the aforementioned I-Ds and the descriptive quantities of the associated basic variables from [31]. Finally, FORM and LHS methods, as presented in Section 2, were used to carry out the reliability and the sensitivity analyses.
In a further step, the reliability and the sensitivity analyses were also performed for the N-M gradients with respect to the associated I-Ds by using the non-linear finite element (NLFEM) elaborations [3,32]. These probabilistic NLFEM studies, as allowed in EN 1992-1-1 [8], also primarily served to evaluate the proposed safety factors for NLFEM considerations [33].

4. Probabilistic Analyses

The following formulation was considered in general as the limit state function for probabilistic analysis and for the investigation of the safety level or reliability index:
g ( x ) = K R · R K E   ( g + q )
where KR is the model uncertainty related to the resistance, R denotes the resistance of the respective scenario in terms of ultimate load bearing capacity, KE is the model uncertainty related to the loads, represents the permanent loads acting on the structure while q represents the imposed service loads. In the following, the probabilistic models of the different variables in these equations are discussed.
All of the variables shown in Equation (9) on the right are basic variables which are described using PDFs. Depending on the analysis method, e.g., (a) based on the analytical formulation of the code regulations or (b) based on the NLFEM studies, the resistance side (KR · R) in Equation (9) corresponds to the interaction diagram (I-D) which corresponds to the function of the maximum permissible N-M values, while the action side (KE·(g + q)) of Equation (9) corresponds to the acting N-M load path so that the intersection of the N-M load path with the I-D characterizes the maximum permissible N-M values; further details can also be found in [33,34]. Both strategies have it in common that the model uncertainties are taken into account in determining the necessary partial safety factors.

4.1. Slenderness

The load-bearing capacity of slender columns is significantly influenced by their slenderness. The slenderness of a column is given by:
λ = l o i
where:
  • i is the minimum radius of gyration: i = I c / A c
  • I c is the moment of inertia
  • A c is the concrete cross-sectional area
  • l o is the effective length of the member which can be assumed to be:
    l o = β · l w
    where:
  • l w is the clear height of the member
  • β is a coefficient which depends on the support conditions.
As can be seen from above, the actual length of the overall system lw is included in the slenderness evaluation via the equivalent length lo. The procedures for determining the equivalent length (nomograms) have been adopted in Eurocode 2 along with the routines for determining the ß value. In addition, the verification of the load-bearing capacity is carried out in the critical cross-section in the following outlines of simplified procedures.

4.2. Simplified Design Formats

In the absence of a more rigorous approach, Eurocode 2 allows the calculation of the design resistance in terms of axial force for columns in plain concrete and lightly reinforced concrete (where the reinforcement provided is less than the minimum required for reinforced concrete) as follows (Chapter 12.6—EN 1992-1-1 [8]):
N Rd = b × h w × f cd , pl × ( 1 2 e tot h w )
where:
  • N Rd is the axial resistance
  • b is the overall width of the cross-section
  • h w is the overall depth of the cross-section
  • fcd,pl is the design compressive strength for plain concrete
αcc,pl = 0.8
f cd , pl = α cc , pl · f c k / γ c
where:
e tot = e 0 + e i
  • e 0 is the first order eccentricity including, where relevant, the effects of floors (e.g., possible clamping moments transmitted to the wall from a slab) and horizontal actions.
  • e i is the additional eccentricity covering the effects of geometrical imperfections.
The slenderness defined in Equation (10) is explicitly included in Equation (14).
Other simplified formats may be used provided that they are not less conservative than a rigorous method. EN 1992-1-1 [8] identifies four different approaches for deriving the design capacity of slender columns: (a) the ‘nominal curvature’ method where second-order moments are determined from an estimation of the column curvature. These second-order moments are added to the first-order moments to provide the total column design moment; (b) the ‘moment magnification’ method where the design moments are obtained by factoring the first-order moments; (c) a second-order analysis based on the nominal stiffness values of the beams and columns that, again, requires computer modeling and iterative analysis; (d) a general method based on a non-linear analysis of the structure and allowing for second-order effects which requires the use of computer analysis. The first three methods belong to the aforementioned simplified ones. The simplified verification procedures are therefore generally divided into the following main steps: the determination of (a) the buckling length lo, see Section 4.1, (b) the slenderness λ, (c) the load center of the action eo = Msd/Nsd, (d) the unwanted eccentricity ea, (e) e2 (theory II order effects), (f) etot = eo + ea + e2 and (g) dimensioning for Nsd and Msd = Nsd·etot using a µ–ν diagram or Equations (12)–(14).

4.3. Non-Linear Analysis Formats

EN 1992-1-1 [8] also allows non-linear formats of analysis (e.g., Non-Linear Finite Element Analyses formats) for the design and recalculation of columns for both ULS and SLS provided that equilibrium and compatibility considerations are satisfied and an adequate non-linear behavior for materials is assumed. The analyses may be performed considering first or second order effects where: (a) at the ultimate limit state, the ability of local critical sections to withstand any inelastic deformations implied by the analysis should be checked, taking appropriate account of uncertainties; (b) for structures predominantly subjected to static loads, the effects of previous applications of loading may generally be ignored and a monotonic increase of the intensity of the actions may be assumed; and, (c) the use of material characteristics which represent the stiffness in a realistic way and where the consideration of uncertainties in material characteristics is of paramount importance.

4.4. Simplified Basic Variables Xi

For the probabilistic analyses of the slender columns according to the simple methods mentioned above, as well as according to the non-linear analysis format, it is necessary to examine and characterize the variables, which are considered decisive in the probabilistic analyses in terms of their properties, as random variables. Table 3 shows the basic variables considered in simplified verification formats and in the non-linear considerations with their distribution functions and the associated statistical descriptive parameters. All random variables are considered statistically independent, i.e., uncorrelated.

4.5. Elements of the Limit State Formulations

As a first step, the resistance of the cross-section was calculated according to standard EN1992-1-1 which enabled the drawing of the N-M gradient lines for the given cross-section for the characteristic, design and the mean values of the resistance parameters.
The resistance mechanism of the reinforced concrete cross-section must be known in order to make the load capacity assessment, as shown in Figure 7. The calculation algorithm was used to obtain the interesting cross-section moments from different normal forces. When assessing a slender column according to EN 1992-1-1 [8], creep is accordingly taken into account by a global factor. The relationship between the normal force applied to a slender column and the resulting bending moment is defined as:
M e d = N e d · ( e 0 + e i + e 2 )
where M e d is the design bending moment, N e d is the design normal force, e 0 is the initial eccentricity of the applied load, e i is the eccentricity caused by geometric imperfection and e 2 is the eccentricity caused by second-order deformation of the system (i.e., slender column). The limits of the concrete pressure zone x l i m and F c d , l i m are computed by:
x l i m = 700 + d [ m ] f y d [ N / m m 2 ] + 700
Since the analyses on the component consisting of the material C100/115 are of the same interest, as the influence of the material properties on the stability problem of interest can be shown, the input parameters for the probabilistic analyses for the material C100/115 were developed in an analogous way as for the C45/55 in Table 3.
F c d , l i m = 0.8095 · x l i m · b Z u g · f c d
where bZug is the section height under tension. For the control as to whether predominantly bending failure takes place can be tracked by:
x = 1.202 · ( d d 2 2.055 · M s 1 b · f c d )  
if
0 x x l i m  
then the failure can be considered predominantly determined by bending.
The integrated pressure zone then results in:
F c d = 0.8095 · x · b · f c d  
and with the obtained force, it is now possible to determine the reinforcement for a cross-sectional side (with uniaxial bending).
A s 1 = F c d N e d σ s 1  
Using the equations presented, it is now possible for different M to determine the associated N for a given cross-section and reinforcement. The derivation was carried out for the design, characteristic and the mean resistance parameters. For the probabilistic calculation, 30 samples were generated from the mean values, the corresponding standard deviations and the distribution of the main random variables (see Table 3). These samples yielded 30 random values for X1 to X11. For these randomly generated values, the cross-sectional resistance was then calculated (see Table 3, bottom part) allowing the creation of a point cloud around the mean I-D as shown in figure in Section 4.7.

4.6. Sensitivity Analyses

The aim of a sensitivity analysis is to determine the relative significance of each random variable in its effect on the stability of the slender column. The analysis was performed at two levels: at the cross-sectional level (parameters used for the verification of the cross-section load-bearing capacity) on the one hand and at the system level (parameters used for the verification of the column load-bearing capacity) on the other hand. The sensitivity analyses were performed for concrete strengths C45/55 and C100/115.

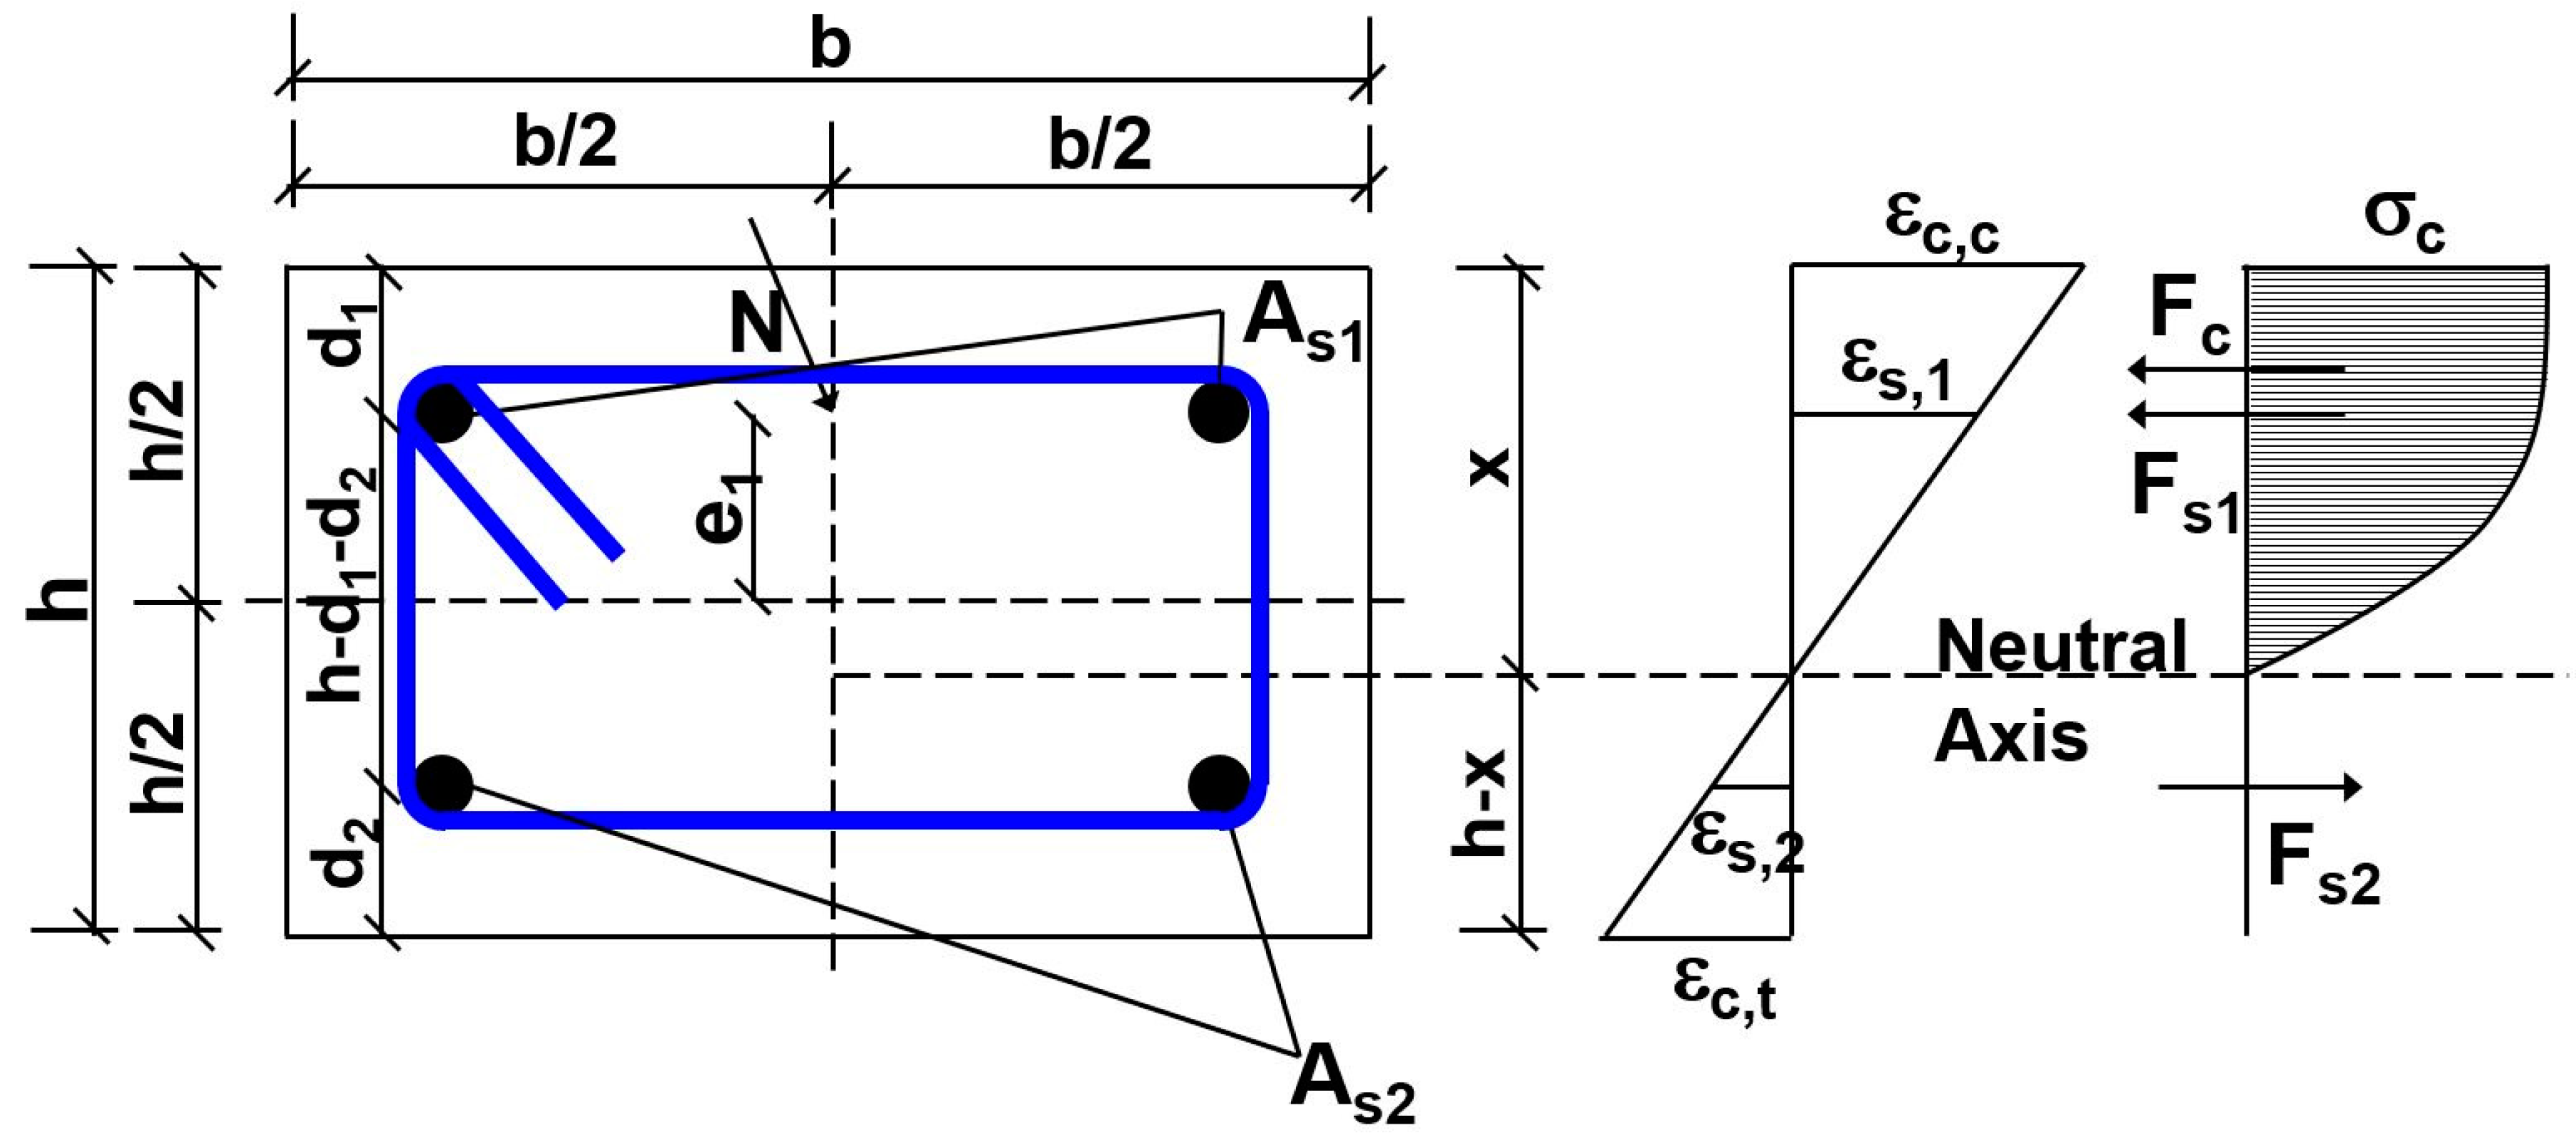
4.6.1. Cross-Sectional Level

Sensitivity analysis at the cross-section level is performed based on the FORM probabilistic method for reliability analysis. The Limit State Equation (LSE) is defined as an equilibrium equation for the cross-section simultaneously exposed to axial force and bending moment. Equilibrium of inner forces (Figure 7) is achieved when both the sums of bending moments and axial forces are equal to zero.
The axial force applied to the column is equal to the sum of forces in the concrete and steel reinforcement:
N = F c + F s 1 F s 2  
and the LSE for cross-sectional analysis is then equal to the sum of moments:
M = F c k c + F s 1 k s 1 + F s 2 k s 2 N k N = 0  
where:
k c = x k a ; k a  
k s 1 = x d 1
k s 2 = h x d 2  
k N = e 1 + e 2 + x h / 2
The probabilistic analysis was conducted for multiple steps where the normal force was increased incrementally in each step in order to compute the sensitivity factor of each random variable, as detailed in Table 3, and their variations with different load sizes. The sensitivity factor values αi are used to provide the relative importance of each individual random variable. By definition, the sum of squares of sensitivity factors for each random variable is equal to 1:
i = 1 n ( α i ) 2 = 1  
Figure 8a shows the sensitivity analyses and sensitivity factors, calculated via the First Order Reliability Method (FORM), versus N/Nmax with Nmax = 335.5 kN while Figure 8b shows the maximum and minimum strains in the column longitudinal axis up to the maximum bearing capacity of N = 335.5 kN for the column made of C45/55. It can be seen from the graphs that at the beginning of the loading procedure, the concrete modulus of elasticity X1(Eci) has a major impact on results but as the force increases, its impact diminishes as the concrete is entering a non-linear state of behavior. Due to small uncertainties in the statistical parameters of areas of reinforcement, their impact on the results can be neglected. The axis distance of reinforcement in compression X7(d1) has a major impact at the beginning of the loading, but reduces as the force increases, while the impact of axis distance of reinforcement in tension X8(d2) increases with the force and deformation of the concrete in tension. Its impact reaches its peak values as the concrete deformation in tension reaches its maximum, just before the cracking of the concrete. The impact of the concrete compressive strength X11(fc) increases along with the loading and reaches its peak value at the point when the concrete deformation in compression and tension are equal (absolute values). After the peak (when the force is around 280 kN), its impact decreases as the tension area of the concrete increases.

4.6.2. Component Level

The component sensitivity analysis was performed using the advanced Monte Carlo-based Latin Hyper Cube sampling technique with 60 generated column samples of the non-linear numerical finite element model (P-NLFEM). The P-NLFEM was developed by the University of Natural Resources and Life Sciences using ATENA Scientific software [35]. In the course of the step-by-step axial loading process, the basic variables of the model input data were determined for each loading step with a step size increment of ΔN = 10 kN. The development of the sensitivity factors calculated using the Kendal Tau algorithm [36] were analyzed and are plotted as a function of the axial (normal) force N of the column in Figure 9a and the transverse deformation of the column at half the system length in Figure 9b. The Kendall rank correlation coefficient, commonly referred to as the Kendall’s r coefficient, was used to measure the ordinal association between two measured quantities, e.g., model input variable i and model response k. The sensitivity analyses according to FORM were not applied here as the Kendal Tau algorithm allows a much simpler handling of the sensitivity considerations for finite element applications. Comparative studies have shown that both methods lead to almost the same results Figure 9d shows the statistical responses of the horizontal column deflections versus the gradually applied normalized axial force N. At the component level, the variables X7 and X8 were not taken into account in the sensitivity analyses because (a) the exact locations of the reinforcement were quarantined by an extraordinary quality control during the fabrication of the columns and (b) the influence of the material laws, solution algorithms, non-linear fracture processes and slenderness on the instability process were the focus of interest. As can be seen in Figure 9a, the modulus of elasticity of the concrete X1(Eci) as well as the compressive strength X11(fc) dominate in the ultimate failure load in compression. When considering the sensitivity factors with regard to the horizontal deflection in the middle height of the column, see Figure 9b, the tensile strength of the concrete X12(fct) and the compressive strength X11(fc) both play a significant role initially; however, the modulus of elasticity of the concrete X1(Eci) becomes more important with increasing horizontal deflection. On the basis of the 60 Latin Hyper Cube samples, Figure 9d provides an insight into the scatters in the relationship between the axial force and the horizontal displacement in the middle height of the column, computed in ATENA.
As can be seen from the graph in Figure 10a for the C100/C115 concrete column, the modulus of elasticity of the concrete X1(Eci), as well as the compressive strength X11(fc) and fracture energy X13(Gf) dominate in the ultimate failure load. When considering the sensitivity factors with regard to the horizontal deflection in the column middle height, see Figure 10b, the tensile strength of the concrete X12(fct) and the compressive strength X11(fc) both play a significant role as the horizontal displacement increases, however, the modulus of elasticity of the concrete X1(Eci) and the concrete fracture energy X13(Gf) are initially more important. Figure 10d provides an insight into the scatters in the relationship between the axial force and the horizontal displacement in the middle height of the column made of C100/115 in a similar way as was reported in the previous section for the C45/55 column.
A closer comparison between the sensitivity factor curves of the C45/55 and C100/115 columns shows clear differences. For example, X1(Eci) becomes more important for the normal force analysis with higher strength, see Figure 9a and Figure 10a. For the horizontal deflection sensitivity analysis, X1(Eci) becomes less important and X13(Gf) becomes more important with increasing strength and load, see Figure 9b and Figure 10b.

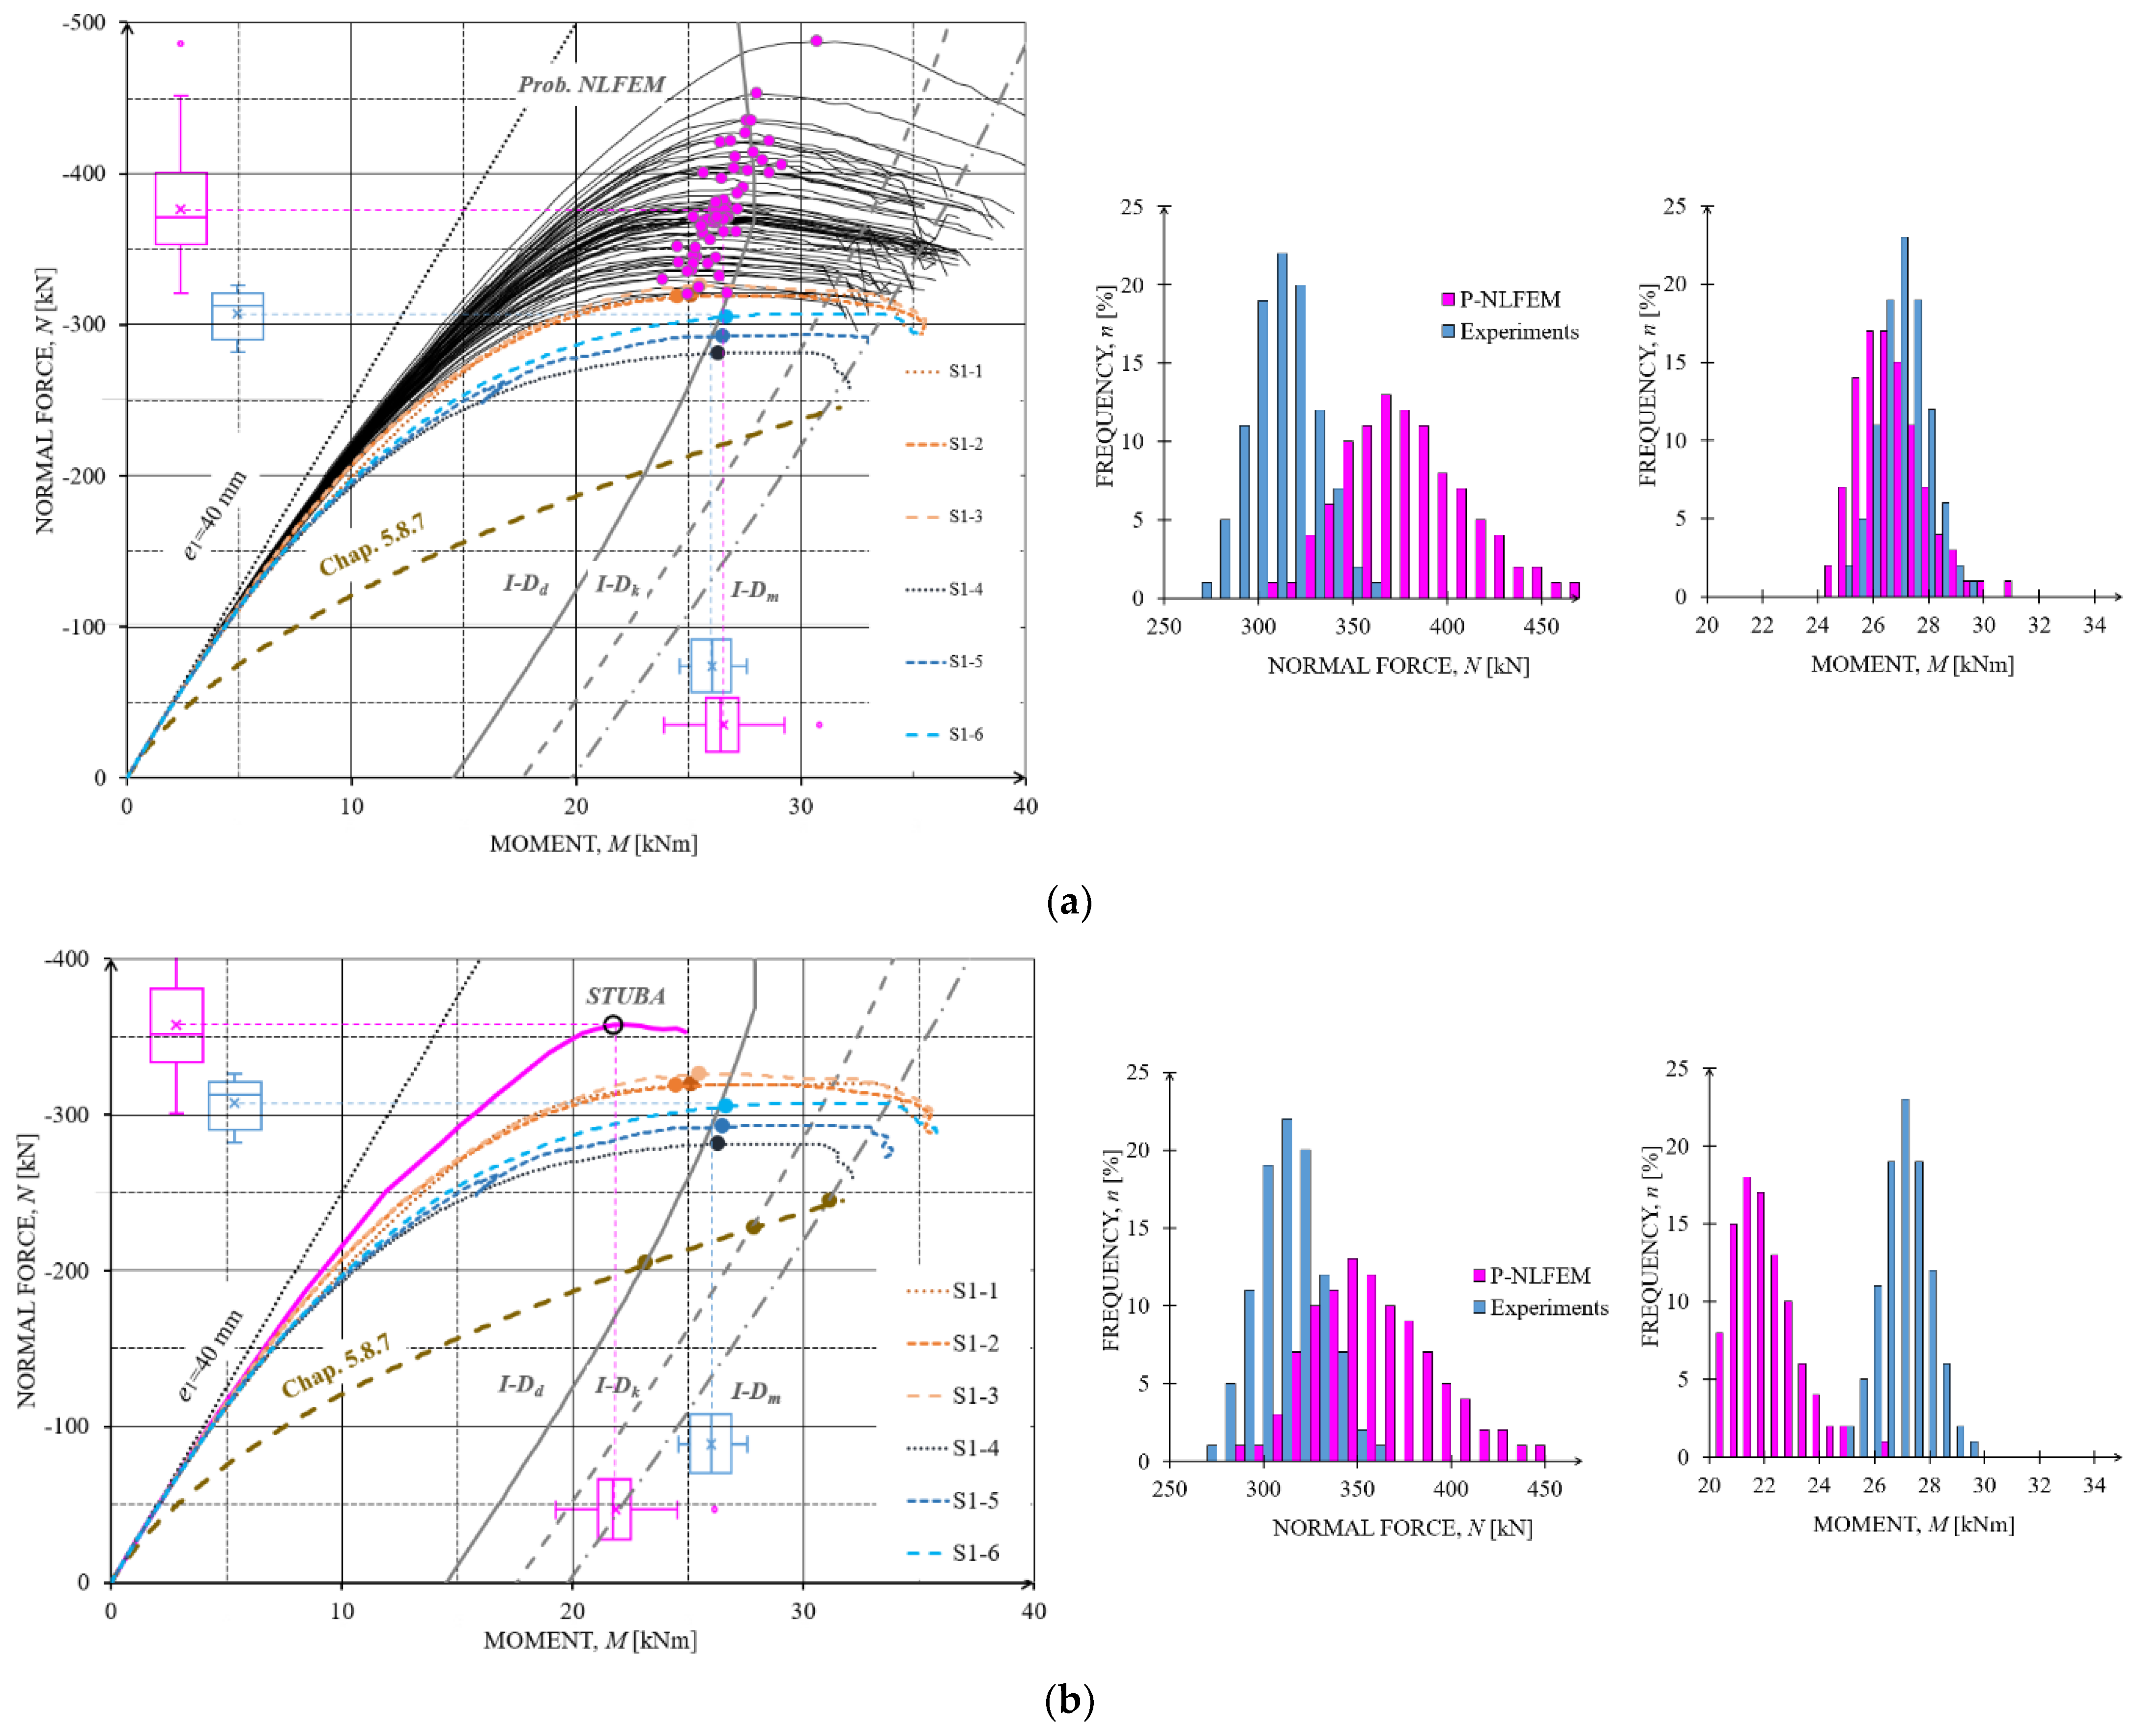
4.7. Standard Based Analyses

In a first approach to these probabilistic investigations, the focus was on the simplified procedures defined in EN1992-1 [8]. There were recognized calculation methods for these procedures which included semi-probabilistic proof at the design level. The probabilistic analysis was therefore divided into (a) preparation of the verification procedure (nominal stiffness method) for the stochastic procedure, including the removal/correction of the partial safety factors, and the associated factors, in order to be able to analyze the verification procedure without the safety elements, (b) structuring of the prepared verification procedure in the form of a limit state equation, see Equation (1), and (c) definition of the basic random variables Xi for the limit state equation. For the correlation between the input parameters of the EN1992-1-1 [8], provision was not explicitly discussed, since the provision formulation implements correlations implicitly. For the numerical probabilistic analysis, an explicit definition of the correlations between the input parameters was made according to [31].
Figure 11a shows the scattering failure loads obtained from the EN1992-1 nominal stiffness calculation (pink point set) and the gradients of the tested columns (dashed lines) in relation to the I-D curves constructed according to EN1992-1-1 [8] for the design, characteristic and mean levels. These sets of I-D curves show the theoretical failure of the column in terms of stability when the maxima of the N-M gradients are on the right side of the I-D curves. The analyses were processed according to LHS procedure for 30 samples in which the values in Table 3 served as input characteristics. For a realistic modeling with respect to the interaction diagram, as is the case with EN1992-1-1 [8], non-linear modeling poses a safety/reliability problem. This fact can be seen in Figure 11b where, in the histograms of the maximum normal force associated with Figure 11a, the PDF in pink obtained according to EN1992-1-1 is clearly below the one derived from the experiments (PDF in blue), see also Table 2. For the determination of the PDFs of the test results, the probabilistic results of the optimized NLFEM model [4] have also been considered.
However, when the experimentally obtained blue PDF of the secondary moments are considered, see Figure 11b on the right, they are clearly below the PDF obtained from the standard in pink which partly is on the left side of the I-D as defined according to EN1992-1-1 and hence shows a reliability shortcoming.

4.8. Non-Linear Finite Element Analyses

4.8.1. General

The interest in probabilistic analyses was further extended to non-linear numerical methods suggested in EN1992-1-1, see Section 4.3. For these analyses, we used the non-linear numerical results already carried out in the 1st of this paper series [4] and tested in the form of a multi-stage process.
The probabilistic analysis was carried out as follows: (a) the preparation of the numerical non-linear models for the stochastic procedure including the definition of the random variables (scattering quantities) used in the non-linear numerical analysis for material laws, geometries and loading procedure, see Table 3 and Table 4, (b) the formulation of the correlations between the random variables (see Table 5), (c) the implementation of the statistical structural responses of the probabilistic non-linear numerical analyses into the reliability-based verification method in the form of a limit state equation, see Equation (1), (d) the definition of the random variables Xi for the limit state equation, (e) the generation of the n-simulation sets, or sample sets using LHS technique for non-linear finite element calculations (for LHS see Section 2.3, for NLFEM see Section 4.3) based on the probabilistic parameters of the random variables displayed in Table 4 and Table 5, (f) the n-fold repetition of the NLFEM computation and the structuring of the statistical system responses in response vectors of dimension n suitable for the reliability assessment and (g) the determination of the reliability and failure probabilities with regard to predefined limit values and the study of the sensitivities of the input base variables with regard to the examined limit state equations.
The correlations according to [32] were set up for the numerical simulations as shown in Table 5.

4.8.2. Pre NLFEM-Modeling

The IABSE Working Commission Group 1 organized a NLFEM round-robin modeling [4] for the previously discussed columns with the following process steps in the context of the amount of accessible information for non-linear modeling: 1st Round-Robin Modeling Process Step: Deterministic analyses based on the drawings without conformity test results; 2nd Round-Robin Modeling Process Step: Deterministic analyses based on the drawings with conformity test results; 3rd Round-Robin Modeling Process Step: Analyses based on the drawings with defined input parameters; 4th Round-Robin Modeling Process Step: Deterministic analyses based on the drawings with conformity test results and the test results of the column; 5th Round-Robin Modeling Process Step: Probabilistic analyses based on the drawings with conformity test results and the test results of the column. For more details regarding these process steps and a list of the Round-Robin Modeling Experts see [4].
The received deterministic structural responses (4th process step) allowed an unambiguous comparability of the predictions with the experimentally obtained data as shown in Table 2.
The results from the group investigations according to the 1st paper of this paper series can be summarized as follows (see [4]): the 1st Round-Robin Modeling Process Step revealed a modeling uncertainty based on the minimum and maximum values found by the partners for the C45/55 column of φ EXP,C45/55 = 1 + (Nmax,NLFEM,C45/55 − Nmin,NLFEM,C45/55)/Nmean,EXP,C45/55 = 1.14. This uncertainty was reduced in the 4th Process Step to φ EXP,C45/55 = 1.04, see [4]. For the C100/115 column, the uncertainty improved the φ EXP,C100/115 from 1.23 to 1.06 in the 4th Process Step. Consequently, the optimized 4th Round-Robin ATENA 3D NLFEM model from the University of Natural Resources and Life Sciences (BOKU) was used for the following probabilistic analyses.

4.8.3. Probabilistic NLFEM-Modeling

The probabilistic modeling based on the BOKU ATENA 3D NLFEM model and the stochastic information of the selected random variables according to Table 4 and Table 5 were carried out with the Structural Analysis and Reliability Assessment (SARA) program package developed in the project “Safety and Reliability Assessment of Structure” [36,37] ] in which the Latin Hyper Cube Sampling (LHS) method with a sample number of n = 305 was used for the development of the input sampling sizes. The significantly increased number of samples compared to the previously described analytical probabilistic analysis results from the fracture processes that occur during the loading process and the clearly pronounced physical and material non-linearities that are also taken into account in the NLFEM analysis. A corresponding convergence analysis in the statistical structure responses already shows correspondingly stable results with an LHS sample number of 105, however, the number of samples was increased to 305 due to the trustworthiness of the results. In total, around 1450 simulations were carried out for all deterministic and probabilistic considerations on the cross-sectional level and on the structural level for the materials C45/55 and C100/115.
The N-M structural response curves from the 305 NLFEM probabilistic analyses are shown in Figure 12a with the maximum values indicated by pink dots.
As can be seen from this bundle of results and the associated maximum values (pink points in Figure 12a, the P-NLFEM results in terms of axial forces are well above the experimental blue values which can also be seen in the corresponding PDF shown in Figure 12a on the right. These P-NLFEM results, which lie above the experimental results, are to be classified as dangerous because the P-NLFEM results lie above the real N-load of the experimental results and, as shown in the previous sections, the experimental failure points. Similar to the analytical predictions based on the interaction diagrams, the NLFEM failure points are also clearly located within interaction curves, and as can be seen in Figure 12a on the right, the NLFEM results are even below the experimental moment lines for some modeling groups. In addition to the probabilistic modeling based on the BOKU ATENA 3D NLFEM model, the probabilistic analyses were also carried out based on the findings of the LHS simulations on the BOKU model and the models from:
STUBA: Slovak University of Technology in Bratislava, Bratislava, Slowakia.
UNIZG-FCE: University of Zagreb Faculty of Civil Engineering, Department of Structural Engineering.
U-MINHO: University of Minho, Institute for Sustainability and Innovation in Structural Engineering (ISISE).
It can be seen from the trend of the mean values (Figure 12b–d) that the maximum values of the normal force from STUBA, UNIZG-FCE and U-MINHO are above the experimental values. The STUBA analyses (PDF) with regard to the moments associated with the normal forces show, as for BOKU, a failure well before the I-Dm on the mean level, see Figure 12b on the right. Such an underestimation of moment capacity was not seen in the simulations of the partners UNIZG-FCE and U-MINHO, see Figure 12c,d. Therefore, we can conclude that BOKU, UNIZG-FCE and U-MINHO came to completely different results for moment distribution. The probabilistic analyses of most of the partners showed that the calculated normal force mean values are significantly higher than the experimentally determined ones, as can be seen from the box whisker plots (P-NLFEM results in pink; experimental results in blue) and the histograms of Figure 12. In these histograms of the normal forces it can also be seen that these differences are smaller in the lower fractile ranges.
By considering a model uncertainty of 1.10, an agreement between the normal force mean values of the P-NLFEM and the experiments can be found, see the graphs in the middle column of Figure 12. Consequently, the lower P-NLFEM fractile values shift below the experimental ones, which is on the safe side. Since these deviations appeared in all simulations of the partners and errors can be excluded in the experiments due to the high quality controls, it is important to clarify which effects in the NLFEM lead to this overestimation of the column performance.
Considering the normal force maxima of the P-NLFEM and the experiments, see Figure 12a–d, it can be seen that the distance in the corresponding moments (at half column height) to moments of the EN1992-1 interaction diagram (I-D) at the mean value level are significant.
These experimental and P-NLFEM detected column collapses in front of or to the left of the I-Dmean according to EN1992-1 indicate a possible defect and possibly safety problems in the I-D formulations too, in particular for the examined columns geometry.

4.9. ECOV Analyses

According to the ECOV format detailed in Section 2.2, the global resistance factor and the design resistance value for the normal force and moment of the slender columns are computed considering two safety levels characterized by target reliability indexes of 3.8 and 4.2 (see Table 6). These reliability levels have been selected due to the assumption of moderate (ß = 3.8) and low (ß = 4.2) relative costs of safety measures and great consequences of failure for a considered classical public building and a reference period of 50 years according to EN 1990.
Furthermore, two model uncertainty factors were considered for NLFEM. For the nominal stiffness method and the NLFEM, a model uncertainty factor equal to 1.10 was first considered since such models are considered here as high uncertainties given the fact that the NLFEM results have shown poor agreement with the experimental results. Nevertheless, the Model Code [27] recommends a model uncertainty factor of 1.06 for refined numerical analysis such as non-linear finite element analysis since such modeling approaches are regarded as low uncertainties models. Accordingly, calculations considering the low model uncertainty factor for NLFEM are also presented for the purpose of benchmarking.
For exceptional cases when models are validated through assessment of an existing structure and no uncertainties are observed, a model uncertainty factor of 1.10 is recommended. This could be the case for the experimental campaign. Nonetheless, given deviations in the results provided by the experimental campaign, a low model uncertainty factor was considered when applying the ECOV format to the outputs of the experiments.
The ECOV format results are displayed in Table 6 and the model uncertainty factor is of crucial importance. Employing the ECOV method as suggested by the Model Code, and considering a model uncertainty factor of 1.06 and a target safety index of 3.8, leads to an overestimation of the slender column axial capacity for most of the developed NLFEM, except for the model developed by the UNIZG-FCE where the design normal force is below the design value obtained from the experimental campaign results (i.e., 235.41 kN). For the same target safety level when considering a model uncertainty factor of 1.1, the overestimation of the normal force is only observed for the model developed by BOKU. Concerning the higher safety index, i.e., 4.2, the design value overestimation was observed only for the BOKU prediction for high uncertainty models (γRd = 1.1). For low uncertainty models (γRd = 1.06), the overestimation is observed for the U-MINHO and BOKU NLFEM. As previously stated, the nominal stiffness method provides results that are too conservative, with a design normal force representing approximately 70% of the design normal force provided by the experimental campaign results.
According to such findings, higher model uncertainty factors (i.e., γRd >1.1) are recommended for the design and safety assessment of slender columns using standard NLFEM. Further research is also suggested to investigate more sophisticated numerical models for the prediction of the carrying capacity of slender columns.

5. Conclusions

The work described in this paper was able to show that the geometrical and mathematical non-linear design of slender members, such as columns in the ultimate limit state, is still a matter of controversy because of the known inconsistencies in the design concepts.
The analyses which were carried out show that the stability failure of the investigated compressed slender concrete columns calculated by non-linear numerical format occur before reaching the material capacity in the critical cross-section and hence failure occurs before the scattering Interactions Diagrams (I-D) according to EN 1992-1. In addition, the probabilistic non-linear finite element analyses (P-NLFEM), based on an advanced Latin Hyper Cube Sampling technique, indicate that the computed structural responses in terms of axial forces are higher than those derived from experiments, which can be evaluated as a failure to meet the required safety level.
The modeling uncertainties used for this study came from the previous modeling for NLFEM models and were 1.04 for the C45/55 columns and 1.06 for the C100/115 columns. In the following global resistance factor studies, model uncertainties of 1.06 and 1.10 were taken into account.
The global resistance factors determined using the “Estimation of the Coefficient of Variation” (ECOV) and the resulting slender column axial capacity showed, as expected when using a model uncertainty factor of 1.10, an overestimation of the axial capacity for the majority of the columns. According to such findings, higher model uncertainty factors (i.e., γRd > 1.10) are recommended for the design and safety assessment of slender columns using standard NLFEM.
From the sensitivity studies at the cross-sectional level in the middle height of the column on one side and the sensitivity studies of the whole column on the other side, it can be seen that the sensitivities behave very differently in relation to the normal force and the horizontal force. The concrete modulus of elasticity is most significant in relation to the normal force at the cross-sectional level compared to the component level, but its importance diminishes with increasing load. For the horizontal deformations, the sensitivity analyses showed that in addition to the concrete’s modulus of elasticity, they are also influenced by the compressive strength, the tensile strength and the fracture energy of the concrete. It is also of great interest that the effective influences of these material parameters change significantly with increasing load as well as change their relative positions with regard to levels of influence.
The knowledge gained from this paper permits the conclusions that it is of great importance for the NLFEM and the P_NLFEM to determine the model uncertainty appropriately and that there is a need to adjust the safety formats for the non-linear modeling.
All in all, the probabilistic studies of the non-linear modeling and analyses of the safety format of slender columns investigated in this article show that the present Eurocode provisions for some column geometries can result in not acceptable uncertainties and premature failures. It is therefore recommended to supplement the Eurocode provisions associated with the non-linear numerical analyses formats with additional system safety factors, as it is already the case in some national EN documents.

Author Contributions

Conceptualization, A.S., A.M.I. and A.O.; methodology, A.S., A.M.I. and A.O.; formal analysis, B.T., M.H., N.G., J.D. and D.S.; writing—original draft preparation, A.S; J.M. and N.G. writing—review and editing, A.S., A.M.I., K.N. and A.O.; Resources, R.W.-W.; Visualization, B.T.; supervision, V.B.; All authors have read and agreed to the published version of the manuscript.

Funding

This research received no explicit external funding.

Institutional Review Board Statement

Not applicable.

Informed Consent Statement

Not applicable.

Data Availability Statement

Data to support the reported results can be found at the University of Natural Resources and Life Sciences, Vienna, Austria; [email protected], University of Zagreb, Faculty of Civil Engineering, Zagreb, Croatia; [email protected].

Acknowledgments

This paper describes work mainly carried out during IABSE activities. The authors would like to acknowledge IABSE Commission 1 for supporting this project, the authors acknowledge the financial support provided by the Interreg project ATCZ190 SAFEBRIDGE. The authors also gratefully acknowledge Scientific Grant Agency of the Ministry of Education. This work was supported by the Slovak Research and Development Agency under the contract No. APVV-15-0658. The authors also would like to express their thanks for the support provided from the Czech Science Foundation project MUFRAS No. 19-09491S. In addition, this work was partly financed by: (1) national funds through the Foundation for Science and Technology (FCT) under Grant No. PD/BD/143003/2018 attributed to the seventh author; and (2) FCT/MCTES through national funds (PIDDAC) under the R&D Unit Institute for Sustainability and Innovation in Structural Engineering (ISISE), under Reference UIDB/04029/2020.

Conflicts of Interest

The authors declare no conflict of interest.

References

  1. JCSS. JCSS Probabilistic Model Code. Available online: https://www.jcss-lc.org/jcss-probabilistic-model-code/ (accessed on 18 August 2021).
  2. Faber, M. Statistics and Probability Theory; Springer: Berlin, Germany, 2012. [Google Scholar]
  3. Benko, V. Nichtlineare Berechnung von Stahlbetondruckglieder. (Nonlinear analysis of reinforced concrete compression members). Innov. Betonbau 2001, 27, 9–12. [Google Scholar]
  4. Strauss, A.; Ivanković, A.M.; Benko, V.; Matos, J.; Marchand, P.; Wan-Wendner, R.; Galvão, N.; Orcesi, A.; Dobrý, J.; Diab, M.E.H.; et al. Round-Robin Modelling of the Load-bearing Capacity of Slender Columns by Using Classical and Advanced Non-linear Numerical and Analytical Prediction Tools. Struct. Eng. Int. 2021, 31, 118–135. [Google Scholar] [CrossRef]
  5. Benko, V.; Gúcky, T.; Valašík, A. The reliability of slender concrete columns subjected to a loss of stability. In Advances and Trends in Engineering Sciences and Technologies II, Proceedings of the 2nd International Conference on Engineering Sciences and Technologies, ESaT 2016, Vysoké Tatry, Slovak Republic, 29 June–1 July 2016; Taylor & Francis: London, UK, 2017. [Google Scholar] [CrossRef]
  6. Benko, V.; Dobrý, J.; Čuhák, M. Failure of Slender Concrete Columns Due to a Loss of Stability. Slovak J. Civ. Eng. 2019, 27, 45–51. [Google Scholar] [CrossRef] [Green Version]
  7. CEB-FIP. Practitioners’ Guide to Finite Element Modelling of Reinforced Concrete Structures; Fib Fédération Internationale du Béton: Lausanne, Switzerland, 2008. [Google Scholar]
  8. EN 1992-1-1. Eurocode 2: Design of Concrete Structures—Part 1-1: General Rules and Rules for Buildings; European Standard: Brussels, Belgium, 2004; Volume 1. [Google Scholar]
  9. Shlune, H.; Gylltoft, K.; Plos, M. Safety format for non-linear analysis of concrete structures. Mag. Concr. Res. 2012, 64, 563–574. [Google Scholar] [CrossRef]
  10. Holicky, M. Global resistance factors for reinforced concrete members. In Proceedings of the 1st International Symposium on Uncertainty Modelling in Engineering, Prague, Czech Republic, 2–3 May 2011. [Google Scholar]
  11. Cervenka, V. Global Safety formats in Fib Model Code 2010 for Design of Concrete Structures. In Proceedings of the 11th Probabilistic Workshop, Brno, Czech Republic, 6–8 November 2013. [Google Scholar]
  12. Cervenka, V. Reliability-based non-linear analysis according to Model Code 2010. Struct. Concr. 2013, 14, 19–28. [Google Scholar] [CrossRef]
  13. Caspeele, R.; Steenbergen, R.; Sykora, M. Partial Factor Methods for Existing Concrete Structures; FIB Bulletin No. 80; FIB: Lausanne, Switzerland, 2016; ISBN 978-2-88394-120-5. [Google Scholar] [CrossRef]
  14. Engen, M.; Hendriks, M.; Köhler, J.; Øverli, J.; Åldtstedt, E. A quantification of modelling uncertainty for non-linear finite element analysis of large concrete structures. Struct. Saf. 2017, 64, 1–8. [Google Scholar] [CrossRef]
  15. Castaldo, P.; Gino, D.; Bertagnoli, G.; Mancini, G. Partial safety factor for resistance model uncertainties in 2D non-linear analysis of reinforced concrete structures. Eng. Struct. 2018, 176, 746–762. [Google Scholar] [CrossRef]
  16. Moccia, F.; Yu, Q.; Ruiz, M.F.; Muttoni, A. Concrete compressive strength: From material characterization to a structural value. Struct. Concr. 2021, 22, E655–E682. [Google Scholar] [CrossRef]
  17. Momeni, M.; Bedon, C. Uncertainty Assessment for the Buckling Analysis of Glass Columns with Random Parameters. Int. J. Struct. Glass Adv. Mater. Res. 2020, 4, 254–275. [Google Scholar]
  18. Mehmel, A.; Schwarz, H.; Karperek, K.; Makovi, J. Tragverhalten Ausmittig Beanspruchter Stahlbetondruckglieder; Institut Für Baustatik, EHT, Deutscher Ausschuss für Stahlbeton, Heft. 204; DafStb: Berlin, Germany, 1969. [Google Scholar]
  19. Foster, S.; Attard, M. Experimental tests on eccentrically loaded high strength concrete columns. Struct. J. 1997, 94, 295–303. [Google Scholar]
  20. Allaix, D.; Carbone, V.; Mancini, G. Global safety format for non-linear analysis of reinforced concrete structures. Struct. Concr. 2013, 14, 29–42. [Google Scholar] [CrossRef]
  21. Cervenka, V.; Cervenka, J.; Kadlek, L. Model uncertainties in numerical simulations of reinforced concrete structures. Struct. Concr. 2018, 19, 2004–2016. [Google Scholar] [CrossRef]
  22. Gino, D.; Castaldo, P.; Giordano, L.; Mancini, G. Model uncertainty in non-linear numerical analyses of slender reinforced concrete members. Struct. Concr. 2021, 22, 845–870. [Google Scholar] [CrossRef]
  23. Ditlevsen, O.; Madsen, H. Structural Reliability Methods; John Wiley & Sons Ltd.: Chicheste, Denmark, 1996. [Google Scholar]
  24. Ang, A.H.; Tang, W.H. Probability Concepts in Engineering Planning, 2nd ed.; John Wiley & Sons, Inc.: Hoboken, NJ, USA, 2007. [Google Scholar]
  25. Hendriks, M.A.N.; de Boer, A.; Belletti, B. Guidelines for Nonlinear Finite Element Analysis of Concrete Structures: Girder Members; Report RTD:1016:2012; Rijkswaterstaat Ministry of Infrastructure and Water Management: The Hague, The Netherlands, 2012. [Google Scholar]
  26. European Committee for Standardization (CEN). EN 1990, Eurocode 0: Basis of Structural Design; CEN: European Standard: Brussels, Belgium, 2005. [Google Scholar]
  27. International Federation for Structural Concrete (FIB). Model Code for Concrete Structures; Ernst & Sohn: Lausanne, Switzerland, 2010. [Google Scholar]
  28. Novák, D.; Vořechovský, M.; Teplý, B. FReET: Software for the statistical and reliability analysis of engineering problems and FReET-D: Degradation module. Adv. Eng. Softw. Adv. Eng. Softw. 2014, 72, 179–192. [Google Scholar] [CrossRef]
  29. Beletti, B.; Vecchi, F.; Cosma, M.P.; Strauss, A. Non linear structural analyses of prestressed concrete girder: Tools and safety formats. In Life-Cycle Analysis and Assessment in Civil Engineering. Towards an Integrated Vision, Proceedings of the Sixth International Symposium on Life-Cycle Civil Engineering, Ghent, Belgium, 28–31 October 2008; Caspeele, R., Taerwe, L., Frangopol, D.M., Eds.; Taylor & Francis Group: London, UK, 2018. [Google Scholar]
  30. Achenbach, M.; Gernay, T.; Morgenthal, G. Quantification of model uncertainties for reinforced concrete columns subjected to fire. Fire Saf. J. 2019, 108, 102832. [Google Scholar] [CrossRef]
  31. Zimmermann, T.; Lehký, D.; Strauss, A. Correlation among selected fracture-mechanical parameters of concrete obtained from experiments and inverse analyses. Struct. Concr. 2016, 17, 1094–1103. [Google Scholar] [CrossRef]
  32. Strauss, A.; Krug, B.; Slowik, O.; Novak, D. Combined shear and flexure performance of prestressing concrete T-shaped beams: Experiment and deterministic modeling. Struct. Concr. 2018, 19, 16–35. [Google Scholar] [CrossRef] [Green Version]
  33. Strauss, A.; Benko, V.; Taubling, B.; Valasik, A.; Cuhak, M. Reliability of slender columns. Beton-Stahlbetonbau 2017, 112, 392–401. [Google Scholar] [CrossRef]
  34. Červenka, V.; Jendele, L.; Červenka, J. Atena Program Documentation—Part 1: Theory; Cervenka Consulting: Prague, Czech Republic, 2007. [Google Scholar]
  35. Tau, K.; Agresti, A. Analysis of Ordinal Categorical Data, 2nd ed.; John Wiley & Sons: New York, NY, USA, 2010. [Google Scholar]
  36. Strauss, A.; Novák, D.; Lehký, D.; Vořechovský, M.; Teplý, B.; Pukl, R.; Červenka, V.; Eichinger-Vill, E.M.; Santa, U. Safety analysis and reliability assessment of engineering structures—The success sotry of SARA. Ce/Papers 2019, 3, 38–47. [Google Scholar] [CrossRef]
  37. Strauss, A.; Wan-Wendner, R.; Vidovic, A.; Zambon, I.; Yu, Q.; Frangopol, D.M.; Bergmeister, K. Gamma prediction models for long-term creep deformations of prestressed concrete bridges. J. Civ. Eng. Manag. 2017, 23, 681–698. [Google Scholar] [CrossRef]
Figure 1. Monte-Carlo method simulation procedure including and not including correlation between basic variables.
Applsci 11 08009 g001
Figure 2. Latin Hyper Cube Simulation (LHS) method including and not including correlation between basic variables.
Applsci 11 08009 g002
Figure 3. Fractile Based Simulation (FBS) method procedure including and not including correlation between basic variables—including the process steps.
Applsci 11 08009 g003
Figure 4. ECOV simulation procedure not including correlation between basic variables.
Applsci 11 08009 g004
Figure 5. Reinforcement and formwork drawings of the investigated slender columns.
Applsci 11 08009 g005
Figure 6. Experimentally determined N-M gradients vs. the Eurocode I-D (blue graph = design values, red dashed graph = characteristic values, red graph = mean values) (a) and normal force—strain (b) of the specimens S1-1 to S1-6.
Applsci 11 08009 g006
Figure 7. Column cross-section with strains, stresses and inner force diagrams.
Applsci 11 08009 g007
Figure 8. Sensitivity analyses at the cross-section level: (a) sensitivity of material parameters with respect to the applied normalized normal force (maximum bearing capacity of N = 335.5 kN); (b) strains in compression and tension with respect to the applied normal force, see also Table 3.
Applsci 11 08009 g008
Figure 9. Sensitivity analyses at the component/column level based on the probabilistic non-linear analysis of the considered column made of C45/55, see Section 4.4: (a) sensitivity of material parameters with respect to the normalized applied axial force; (b) sensitivity of material parameters with respect to the normalized horizontal displacement at middle height of the column; (c) basic variables of considered material models; (d) normalized horizontal displacement vs. normalized axial force.
Applsci 11 08009 g009
Figure 10. Sensitivity analyses at the component/column level based on the probabilistic non-linear analysis of the considered column made of C100/115, see Section 4.4: (a) sensitivity of material parameters with respect to the normalized applied axial force; (b) sensitivity of material parameters with respect to the normalized horizontal displacement at middle height of the column; (c) basic variables of considered material models; (d) normalized horizontal displacement vs. normalized axial force response.
Applsci 11 08009 g010
Figure 11. Statistical scattering failure loads obtained according to EN1992-1 nominal stiffness calculations (pink point set). (a) Nominal stiffness calculated and experimental N-M gradients vs. the Interaction Diagrams I-D according to EN1992-1 at the design, characteristic and mean levels, and, (b) histogram of the maximum calculated axial forces (pink) vs. those tested experimentally (blue) and histogram of the maximum calculated moments (pink) vs. those tested experimentally (blue).
Applsci 11 08009 g011aApplsci 11 08009 g011b
Figure 12. Statistical structural responses and PDFs obtained according to EN1992-1 non-linear finite element analyses: (a) BOKU Group: University of Natural Resources and Life Sciences Vienna, Institute of Structural Engineering, (b) STUBA Group: Slovak University of Technology in Bratislava, Department of Concrete Structures and Bridges, (c) U-MINHO Group: University of Minho, Institute for Sustainability and Innovation in Structural Engineering (ISISE) and (d) UNIZG-FCE Group: University of Zagreb Faculty of Civil Engineering, Department of Structural Engineering.
Applsci 11 08009 g012aApplsci 11 08009 g012b
Table 1. List of parameters used in the calculation.
DescriptionSymbolUnitValue
Width of column cross-sectionbmm240
Height of column cross-sectionhmm150
Distance from topmost compression face to the centroid of compression reinforcementd’mm33
Distance from topmost compression face to the centroid of tensile reinforcement dmm117
Cross-sectional area of RC columnAcmm236,000
Cross-sectional area of tensile reinforcement Asmm2307.88
Cross-sectional area of compression reinforcement A’smm2307.88
Characteristic compressive strength of concrete (for assoc. parameters see table in Section 4.5f’ckN/mm255
Yield strength of reinforcing reinforcement fsyN/mm2500
Young modulus of reinforcing reinforcement EsN/mm2200,000
Ultimate strain of concrete in compression εcu-Varied
Ratio of the depth of equivalent compression block to that of actual compressionβ-Varied
Eccentricityemm40
Table 2. Descriptive statistical parameters of the experimental results of the considered test series C45/55 without considering sample size aspects.
TestNmax (kN)e2 (mm)Mmax (kNm)
S1-1324.457.631.7
S1-2323.442.726.8
S1-3332.638.326.0
S1-4271.258.426.7
S1-5296.059.429.4
S1-6311.455.029.6
Table 3. Input parameters for the probabilistic analyses of the EN 1992-1-1 closed formulations provisions and the EN 1992-1 Non-Linear Finite Element provisions of the slender column made of C45/55.
XVariableDis. **UnitXkµσ
C45/55
X1Eci a,b,cInitial tangent concrete modulus of elasticityLNGPa37.537.54.91
X2Es a,b,cReinforcing steel modulus of elasticityDGPa200200-
X3 *As1bReinforcement areaNcm23.083.080.062
X4 *As2bReinforcement areaNcm23.083.080.062
X5 *H bHeightNcm15.015.00.30
X6 *B bWidthNcm24.024.00.45
X7 *d bAxis distance of reinforcementLNcm3.303.300.50
X8 *d2bAxis distance of reinforcementLNcm3.303.300.50
X9 *e1bEccentricityNcm4.004.000.10 ***
X10 *εc,1 bStrain at max. compressive stressLN−2.40−2.400.11
X11fc a,b,cConcrete compressive strengthLNMPa45.053.05.13
X12fct a,b,cConcrete tensile strengthLNMPa2.73.80.78
X13GF a,b,cConcrete fracture energyLNMPa10414930.8
X14εc,lim a,b,cUltimate strainLN−3.50−3.500.10 ***
X15εct,max a,b,cMaximum tensile strainLN0.150.150.10 ***
X16k1bTension stiffening factor (fct)LN 0.60.60.10 ***
X17k2bTension stiffening factor (εct,max)LN 5.05.00.10 ***
X18fy a,b,cReinforcing steel yield strengthLNMPa50054840.0
X19k bRatio (ft/fy)k for ductility class BD1.081.08-
X20εu bStrain at max. tensile stressD5050-
X21L a,b,cLengthDM1.92--
X22θR bResistance model uncertaintyLN-1.001.000.10 ***
Variables for each step of the analysis at the system level—obtained from non-linear analysis in Sofistik software
X23εc,c bConcrete compressive strain DSoftware-based
X24εc,t bConcrete tension strainDSoftware-based
X25N bAxial acting forceDkNSoftware-based
X26αv bConcrete force associated coefficientD/Calculated
X27ka bConcrete compressive border zone associated coefficient D/Calculated
X28e2bSecond-order eccentricityDMmSoftware-based
(*) Variables are shown graphically in Figure 7; (**) normal distribution, N; log normal distribution LN, deterministic value, D; (***) values determined by an expert appraisal; (a) values used for the standard based analyses (Section 4.7); (b) values used for the cross-section analyses (Section 4.6.1); (c) values used for the component analyses (Section 4.6.2).
Table 4. Input parameters for the probabilistic analyses of the EN 1992-1 Non-Linear Finite Element provisions of the slender column made of C100/115 (details regarding C45/55 are provided in Table 3).
XVariableDist.UnitXkµσ
C100/115
X1EciInitial tangent concrete modulus of elasticityLNGPa48.948.96.23
X2EsReinforcing steel modulus of elasticityD.GPa200200-
X11fcConcrete compressive strengthLNMPa100.0108.04.99
X12fctConcrete tensile strengthLNMPa3.75.21.08
X13GFConcrete fracture energyLNMPa11917035.0
X18fyReinforcing steel yield strengthLNMPa50054840.0
Table 5. Correlation between basic variables for EN 1992-1 Non-Linear Finite Element provisions of the slender columns made of C45/55 and of C100/115 [32].
C45/55 and C100/115
EciEsfcfctGFfy
X1Eci100.70.60.80
X2Es 10000
X11fc 10.90.70
X12fct 10.50
X13GF 10
X18fy 1
Table 6. Global resistance factor and design resistance according to ECOV format.
Safety Level β = 3.8 β = 4.2
γRNNd
(kN)
γRMMd
(kNm)
γRNNd
(kN)
γRMMd
(kNm)
Stiffness Method 1.28170.271.2821.641.32165.881.3221.08
NLFEM
γRd = 1.1
BOKU 1.37246.331.3217.871.41238.361.3617.35
STUBA1.41228.901.2416.111.46220.811.2715.75
U-MINHO 1.41232.151.3220.961.46223.931.3620.35
UNIZG-FCE1.32226.801.2422.701.36220.231.2722.18
NLFEM
γRd = 1.06
BOKU 1.37255.671.3218.541.32247.301.3218.00
STUBA1.41237.491.2416.711.41229.101.3616.33
U-MINHO 1.41240.911.3221.751.46232.341.2721.12
UNIZG-FCE1.32235.381.2423.551.46228.511.3623.02
Experiments1.24235.411.2820.911.23230.071.3220.37
Publisher’s Note: MDPI stays neutral with regard to jurisdictional claims in published maps and institutional affiliations.

